Presentation on Works and Accounts Management Information System (WAMIS) For
Upload
truonglienCategory
view
218download
4
Remote Sensing and Drought MonitoringAn Overview, Options for Mali, and Future Directions
Dr. Brian WardlowAssistant Professor
Remote Sensing SpecialistNational Drought Mitigation Center
University of Nebraska-Lincoln
Drought Monitor WorkshopBamako, Mali
September 14-17, 2009

Satellite-based remote sensing has been widely used over the past 20+ years for national to global-scale many environmental monitoring activities, including drought.
Remote Sensing for Environmental Monitoring

Advantages of Remote Sensing for Drought Monitoring
Satellite image of relative vegetation greenness for Mali.
1. Spatial continuous measurements across large geographic areas.
- Important in locations where weather stations or other ground observations (human) are sparse or non-existent.
2. Frequent revisit time for image acquisition- Several satellites acquire image data every 1-2
days or a 1-2 week basis for same location.
3. Historical record of conditions- Several instruments (AVHRR and Landsat) provide 20+ years of
information with some newer sensors (MODIS) approaching 10+ years of observations.

Ideal Remote Sensing Data Characteristics for Drought Monitoring
1. Operational data production – routinely produce the same data products at a set time interval.
Ex. – Production a vegetation condition map each dekad.
July 2009 – Dekad 2 July 2009 – Dekad 3 August2009 – Dekad 3
Greenness
Low
High

Ideal Remote Sensing Data Characteristics for Drought Monitoring
2. Anomaly, Percent of Normal, Change, or Ranking MapsProvide historical context of how current conditions compare to the
historical conditions for a specific location and time during the year.- Easier to differentiate moderate, severe, and extreme drought events.
Current GreennessAugust (2009) Dekad 1
GreennessDifference in
Greenness
Difference in Greenness from July (2009) Dekad 3
Difference in Greenness from Historical Mean August Dekad 1

Ideal Remote Sensing Data Characteristics for Drought Monitoring
3. Data easy accessible and in multiple formats- digital data in analysis using GIS and computers- graphical maps that can be downloaded and printed
for visual analysis
Vegetation Greenness Map
Precipitation Maps
Water Requirement Satisfaction Index Map

Ideal Remote Sensing Data Characteristics for Drought Monitoring
4. Evaluation of the Information’s Accuracy for Your Local Area
Assess Accuracy for:1) multiple locations across your country or region2) multiple years (drought and non-drought periods)3) spatial gradients between drought and non-drought areas4) trends over time
Resources:• Expert opinion
- climatology, meteorology, agriculture, water resources, and natural resources/ecology
• Local feedback• Ground measurement
- crop/rangeland conditions, meteorological and surface water observations, and
• Comparison with other drought index data and maps
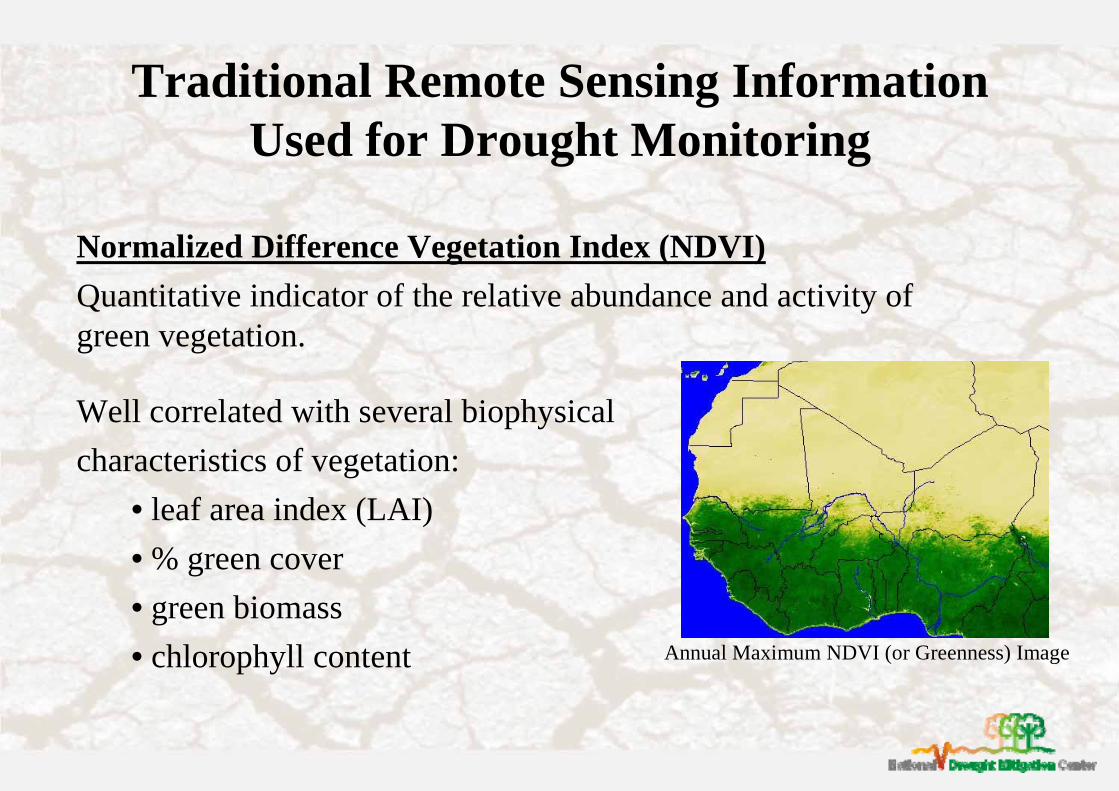
Traditional Remote Sensing Information Used for Drought Monitoring
Normalized Difference Vegetation Index (NDVI)Quantitative indicator of the relative abundance and activity ofgreen vegetation.
Well correlated with several biophysicalcharacteristics of vegetation:
• leaf area index (LAI)• % green cover• green biomass• chlorophyll content Annual Maximum NDVI (or Greenness) Image

NDVI – Why is it an Indicator of Vegetation Health?
NDVI = (NIR – Red) / (NIR + Red)
NIR (Near-Infrared) energy sensed from vegetation is controlled by the plants internal leaf structure.
LOW NIR = stressed or non-green vegetation (wilting)HIGH NIR = healthy green vegetation
Red energy detected from vegetation is controlled by the vegetation’s chlorophyll content.
LOW Red = healthy green vegetation absorbs visible red energyHIGH Red = stressed or non-green vegetation reflects red energy
NDVI values ranging from -1 to +1.HIGH NDVI values = healthy, green vegetation (typical range of
vegetation values from 0.2 - .08, with values > 0.5 indicative of denser vegetation)
LOW NDVI values = stressed or non-green vegetation

NDVI (Greenness Product) and AVHRR
• The Advanced Very High Resolution Radiometer (AVHRR) instrument from the National Oceanic and Atmospheric Administration (NOAA) has produced a 20+ year historical record of global NDVI observations.
• NDVI maps at a 8-km spatial resolution updated at weekly, bi-weekly, dekadal, and monthly time intervals dating back to 1982.
• Widely used for drought monitoring and other types of environmental assessments (e.g., ecological studies and crop production).

Vegetation Health Index (VHI)
http://www.star.nesdis.noaa.gov/smcd/emb/vci/VH/vh_currentImage.php
VHI estimates vegetation health (condition) based on combination of :1)vegetation greenness
(Normalized Difference Vegetation Index, NDVI)
2) temperature (Brightness Temperature, BT).
VHI Data Characteristics:• 8-km spatial resolution• weekly updates• 2004 - present

Other Global NDVI Data Sets
• Large-area NDVI data sets are also available from other satellite-based remote sensing instruments (MODIS, SPOT Vegetation, and MERIS), but they lack a long historical record of information.

Traditional Remote Sensing Information Used for Drought Monitoring
Rainfall Estimate (RFE) Uses a combination of satellite-based observations (cloud temperature and cold cloud duration) and ground-based rain gauge information.
• RFEs updated at multiple time intervals- daily - dekad- weekly - monthly
Satellites:• Meteosat (used since 1995)• Special Sensor Microwave/Imager (SSMI)**• Advanced Microwave Sounding Unit (AMSU)**
**Implemented in 2000.

Operational Remote Sensing Products for Mali

Famine Early Warning System (FEWS) NetworkRemote Sensing Data Resources for Mali
FEWS/NOAA Data:- Set of rainfall
estimates (RFE) and anomalies
- Short- & long-termforecasts
FEWS/USGS Data:- Vegetation condition
data sets- Soil Moisture Index - RFE data- Standardized
Precipitation Index (SPI) http://www.fews.net/Pages/default.aspx

FEWS/U.S. Geological Survey (USGS) Maps and Data

http://earlywarning.usgs.gov/?l=en

http://earlywarning.usgs.gov/adds/
Several operational products for each dekad.
Custom maps and data available for different regions of Africa.

NDVI (Vegetation Greenness)
• 8-km spatial resolution• 5-year of NDVI observations
(2005 – present)
• Long-term mean: 1982 to 2008 • Short-term mean: 2003 to 2008
Data Characteristics:

Current WRSI
Extended WRSI
WRSI Anomaly (Median Year)
WRSI Anomaly (Previous Year)
Water Requirement Satisfaction Index (WRSI)Cropland (Millet)
WRSI is an indicator of crop performance based on the availability of water to the crop during the growing season. Based on the water supply and demand of a crop.
Forecast estimate of WRSI at the end of the growing season.
Median year span: 1996 – 2008

Current WRSI WRSI Anomaly (Median Year)
Extended WRSI WRSI Anomaly (Previous Year)
Water Requirement Satisfaction Index (WRSI)Rangeland

Moisture Index (MI)The MI is an agro-meteorological indicator defined by a simply ‘supply/demand ratio’ that is presented as a percentage.
Calculation of MI considers:1) recent rainfall2) available soil water3) potential evapotranspiration (PET)
MI for August 2009 Dekad 2

Soil Water Index (SWI)The SWI is the percentage of the soil’s water holding capacity (WHC).

Standardized Precipitation Index
(SPI)

Rainfall Estimate(RFE)
• 8-km spatial resolution
• standard NOAA RFE product
• RFE calculated using:1) satellite observations from
- Meteosat, - Special Sensor Microwave
Imager (SSMI), - Advance Microwave
Sounding Unit (AMSU)2) station rainfall data.
FEWS/NOAA (National Oceanic and Atmospheric Administration)
Maps and Data

http://www.cpc.ncep.noaa.gov/products/fews/index.shtml?l=en


Interpolated RFE from rain gauge data• broad rainfall patterns• lacks ‘local’ spatial variability
Combined of satellite and rain gauge data• more spatial detailed rainfall patterns• improved ‘local’ spatial variability
Contribution of Remote Sensing to RFE

NOAA / FEW RFE Products
• number of RFE products- some are operational, but
many experimental variations of operational products
• 0.25 degree spatial resolution• daily, dekadal, monthly, and
seasonal products• Products available from 2003
to present• Area-specific products vary
- continental- region-specific (e.g., Sahel)

Africa Rainfall Estimate (RFE) ClimatologyCurrent RFE (mm)
Difference between Current RFE & 26-year Mean RFE (mm) Percent of Historical Mean (%)
* Daily, dekadal, and monthly information available.

Africa Rainfall Estimate (RFE) ClimatologyCurrent RFE (mm)
Difference between Current RFE & 26-year Mean RFE (mm) Percent of Historical Mean (%)
Current RFE show rainfall has been received.
A 10 to 25-mm rainfall deficit compared to 26-year mean rainfall is shown.
25 to 75% of historical normal precipitation is shown for this dekad.
* Daily, dekadal, and monthly information available.

Seasonal Rainfall Estimate (RFE) Climatology
• Season: May – September
• Coverage: Sahel region product (no continental-scale maps)
• Years: 2004 – 2009

Advances in Remote Sensing:The Future for Drought Monitoring

Progress in Remote Sensing• Over the past 10 years, many advanced remote sensing
instruments have been launched that collect information thatcan be used monitor different aspects of drought.
• Development of advanced processing and analysis techniques andimproved computing capabilities have resulted in new approaches that could be used for drought monitoring.
New Remote Sensing Instruments
Vegetation Conditions
Rainfall
Evapotranspiration (ET)
Soil MoistureGroundwater Fluxes
Remote Sensing-based Estimates of:

Vegetation
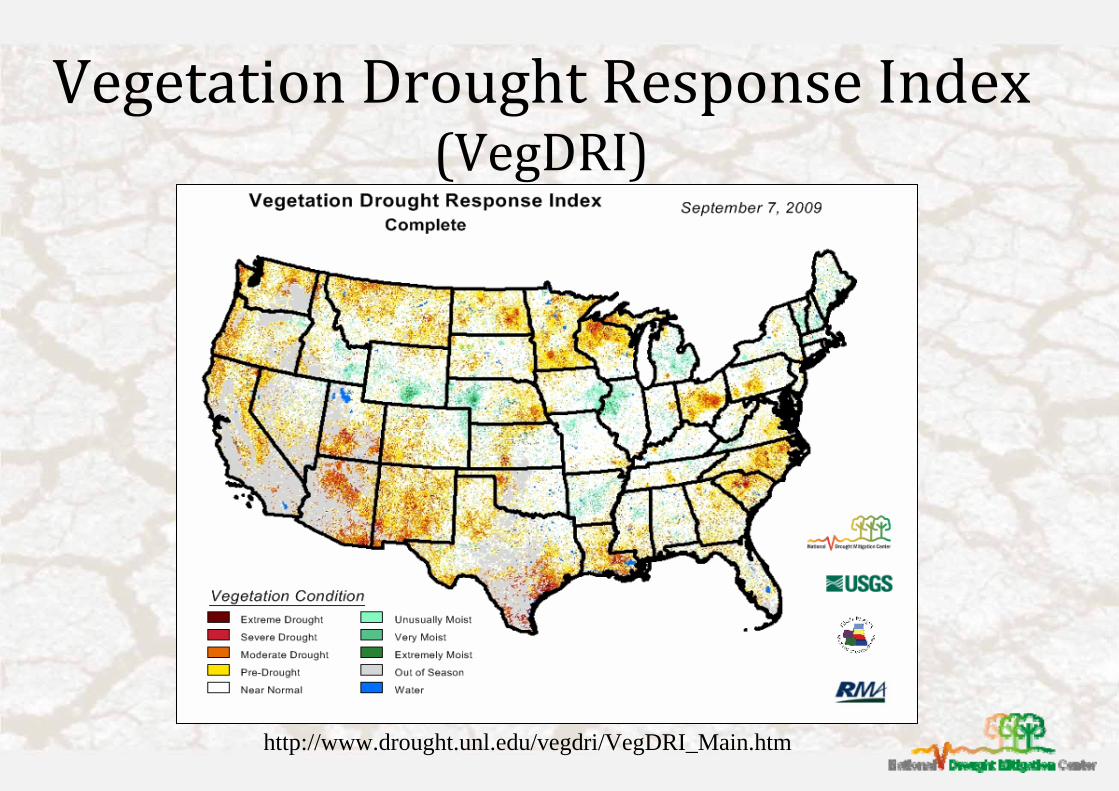
Vegetation Drought Response Index (VegDRI)
http://www.drought.unl.edu/vegdri/VegDRI_Main.htm

What is VegDRI?VegDRI is a new ‘hybrid’ drought index that integrates:
- satellite-based observations of vegetation conditions- climate-based drought index data- biophysical characteristics of the environment
to produce 1-km spatial resolution maps that depict ‘drought-related vegetation stress’.

Remote Sensing Component Climate Component Biophysical Component
+ +
What is VegDRI?
Vegetation health information- NDVI-based
Measure of dryness Environmental characteristics that influence climate-vegetation interactions.
- land use/cover type - soil characteristics- elevation- ecological setting

VegDRI vs. U.S. Drought Monitor
Goal of VegDRI Tool: National-level monitoring capabilities with local-scale information (i.e., county to sub-county level) regarding the level of drought stress on vegetation.
VegDRINebraska – June 30, 2008
U.S. Drought MonitorNebraska – July 1, 2008

VegDRI EvaluationPurpose: Establish a network of 150+ evaluators across the U.S. that provide periodic feedback regarding the accuracy of the VegDRI maps for their ‘local’ area.
Goal: Collect ‘baseline’ information about VegDRI’s performance and better understand the index’s current strengths and weaknesses.
Types of feedback:1) qualitative: - visual observations
- photos- impacts (e.g., cattle sales & feed surplus/deficits)
2) quantitative: - clip plot data (e.g., biomass)- rainfall measurements & variations- production (e.g., ‘How yield/forage production
compared to the historical average.’)

Vegetation Outlook ( VegOut)A new experimental tool that provides a series of maps depicting future outlooks of general vegetation conditions (seasonal greenness) based on an analysis of:
1) climate-based drought indices2) satellite-based observations of vegetation3) general biophysical characteristics of the environment4) oceanic indicators.


Standardized Seasonal Greenness (SSG)
High
Intermediate
Low
Out of season
4-week VegOut
6-week VegOut
2-week VegOut
VegOut Maps for the Central U.S.
(b) 2-week SSG prediction for August 11
(c) 4-week SSG prediction for August 25
(d) 6-week SSG prediction for September 8
(e) Observed SSG for August 11
(g) Observed SSG for September 8
(f) Observed SSG for August 25
(a) Observed SSG forJuly 28, 2008
Results:- Slight under-
estimation of greenness in areas of low greenness.
- Slightly lower predictive accuracy with longer outlook period.
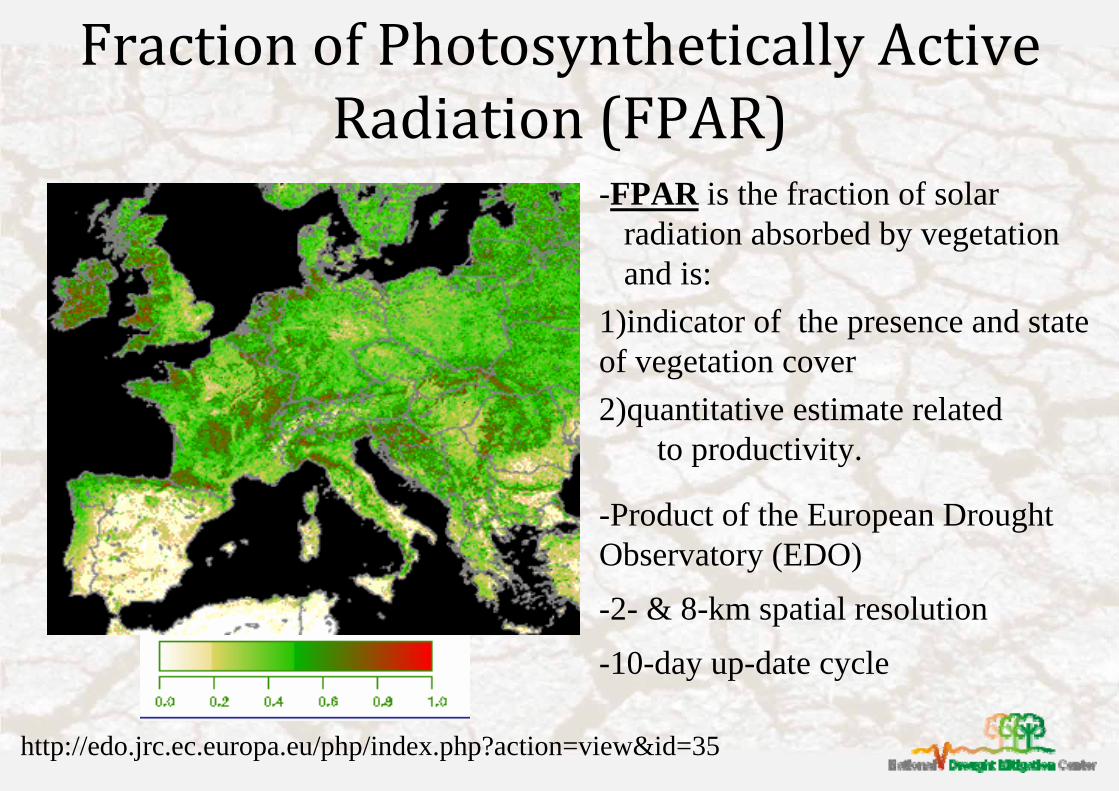
Fraction of Photosynthetically Active Radiation (FPAR)
-FPAR is the fraction of solar radiation absorbed by vegetation and is:
1)indicator of the presence and state of vegetation cover 2)quantitative estimate related
to productivity.
-Product of the European Drought Observatory (EDO)-2- & 8-km spatial resolution-10-day up-date cycle
http://edo.jrc.ec.europa.eu/php/index.php?action=view&id=35
Evapotranspiration (ET)
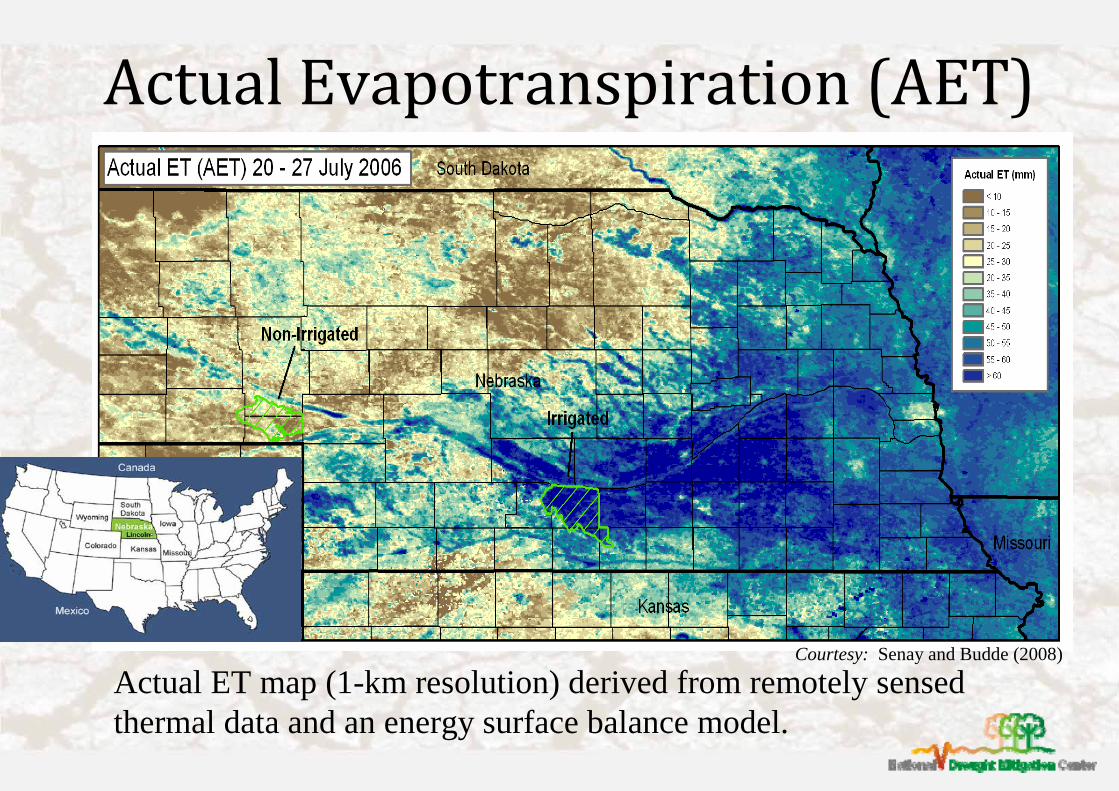
Actual Evapotranspiration (AET)
Actual ET map (1-km resolution) derived from remotely sensed thermal data and an energy surface balance model.
Courtesy: Senay and Budde (2008)

WetterDrierSEASONAL ANOMALIES (9-year record)
April – September 2008
Evaporative Stress Index (ESI)
U.S. Drought Monitor (USDM)
Courtesy: M. Anderson USDA ARS (2008)
ΔESI
ΔDM
Evaporative Stress Index (ESI)ESI depicts ‘transpiration’ fluxes from vegetation and ‘evaporative’ fluxes from non-vegetated surfaces (e.g., soils).
• developed by U.S. Department of Agriculture’s (USDA) Agricultural Research Division (ARS)
• use thermal observations from satellite in surface energy balance model
• Can be applied to data from multiple sensors:- Spatial resolution of ESI can range
from 30-m to 8-km- Updated hourly, daily, or every 1-2
weeks.

Soil Moisture & Groundwater
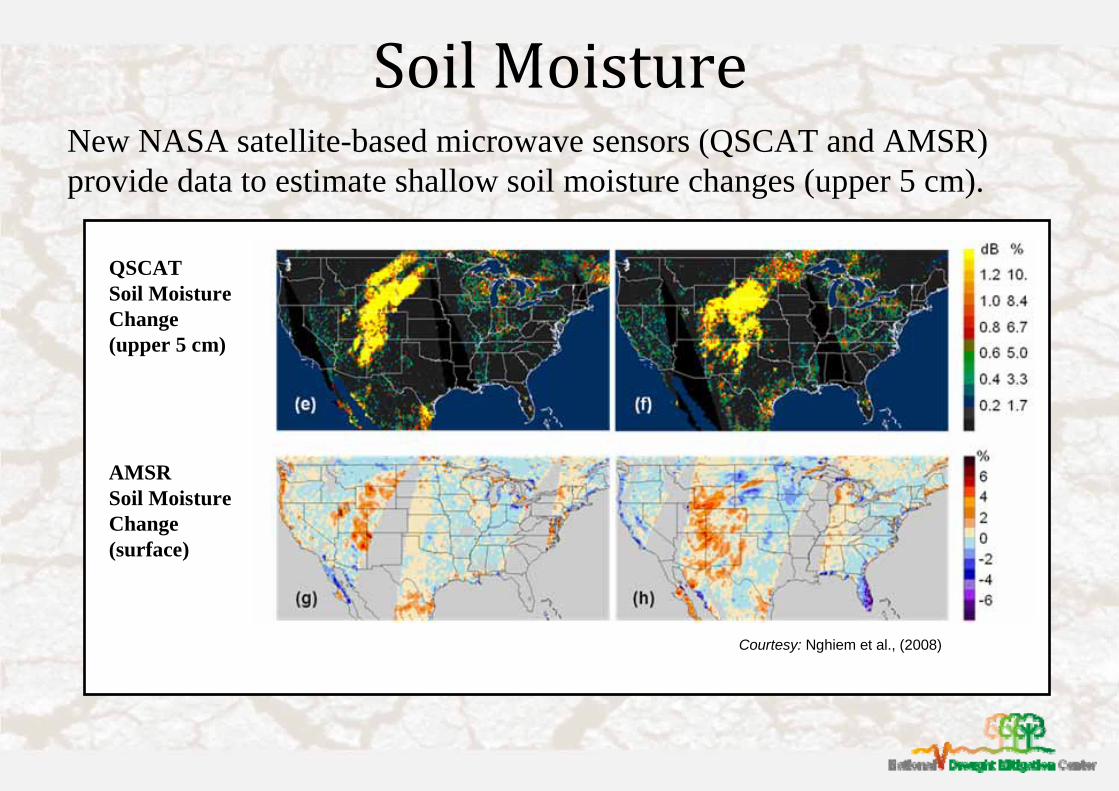
Soil Moisture
QSCAT Soil Moisture Change (upper 5 cm)
AMSRSoil Moisture Change (surface)
Courtesy: Nghiem et al., (2008)
New NASA satellite-based microwave sensors (QSCAT and AMSR) provide data to estimate shallow soil moisture changes (upper 5 cm).
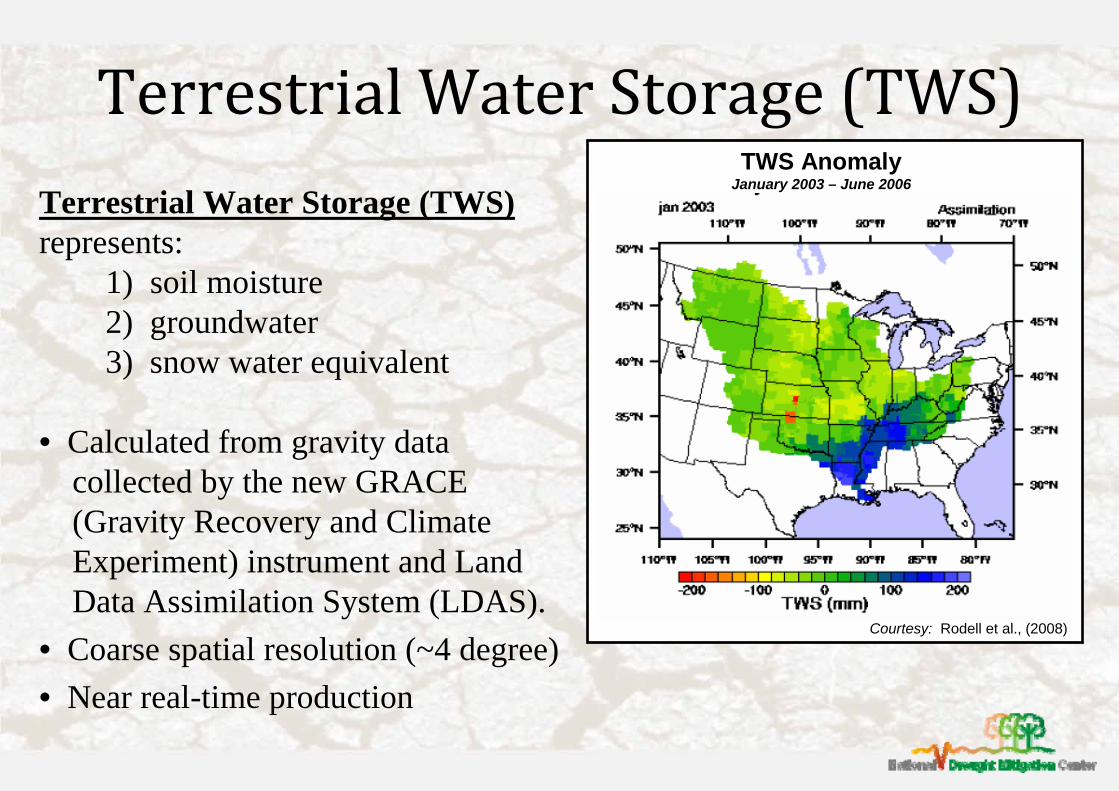
Terrestrial Water Storage (TWS)TWS Anomaly
January 2003 – June 2006
Courtesy: Rodell et al., (2008)
Terrestrial Water Storage (TWS) represents:
1) soil moisture2) groundwater3) snow water equivalent
• Calculated from gravity data collected by the new GRACE (Gravity Recovery and Climate Experiment) instrument and Land Data Assimilation System (LDAS).
• Coarse spatial resolution (~4 degree)• Near real-time production

Thank you for your attention.
For further information, please contact:
Dr. Brian WardlowAssistant Professor / Remote Sensing Specialist
National Drought Mitigation [email protected]