
Remote Sensing a Tool to Measure and Monitor Tea ... · PDF fileincidence of pests and...
14
TS03F - Remote Sensing II Rishiraj Dutta The Netherlands Informal Settlement in Ethiopia, the Case of two Kebeles in Bahir Dar City FIG Working Week 2011 Bridging the Gap between Cultures Marrakech, Morocco, 18-22 May 2011 1/14 Remote Sensing a Tool to Measure and Monitor Tea Plantations in Northeast India Rishiraj DUTTA, The Netherlands Keywords: Tea plantations, NDVI, LAI, waterlogging and biophysical status SUMMARY Tea yield has stagnated in Northeast India which is attributed to several factors such as old age of tea bushes, declining soil health, waterlogging and increased incidence of pests and diseases. Therefore monitoring tea using remote sensing has become a pressing need. Understanding the effect of waterlogging, and biophysical status of the tea would help the estates to take effective measures when the need arises. Delineating waterlogged tea areas showed that waterlogging was caused by blocking of natural drainage by eutrophication, built up areas and siltation and this could be well monitored through remote sensing. Establishing an empirical equation between MODIS derived NDVI and LAI showed that LAI in tea had significant and linear relationship with NDVI. However, the NDVI observation at different time periods alone could not explain much variance in tea leaf yield. The study took into consideration different methods and approaches that could fit well in monitoring and quantifying tea plantations from time to time. It also indicated that the tea area problems can be easily monitored by using a GIS platform.
Transcript of Remote Sensing a Tool to Measure and Monitor Tea ... · PDF fileincidence of pests and...

TS03F - Remote Sensing II
Rishiraj Dutta The Netherlands
Informal Settlement in Ethiopia, the Case of two Kebeles in Bahir Dar City
FIG Working Week 2011
Bridging the Gap between Cultures
Marrakech, Morocco, 18-22 May 2011
1/14
Remote Sensing a Tool to Measure and Monitor Tea Plantations in Northeast
India
Rishiraj DUTTA, The Netherlands
Keywords: Tea plantations, NDVI, LAI, waterlogging and biophysical status
SUMMARY
Tea yield has stagnated in Northeast India which is attributed to several factors such as old
age of tea bushes, declining soil health, waterlogging and increased incidence of pests and
diseases. Therefore monitoring tea using remote sensing has become a pressing need.
Understanding the effect of waterlogging, and biophysical status of the tea would help the
estates to take effective measures when the need arises. Delineating waterlogged tea areas
showed that waterlogging was caused by blocking of natural drainage by eutrophication, built up
areas and siltation and this could be well monitored through remote sensing. Establishing an
empirical equation between MODIS derived NDVI and LAI showed that LAI in tea had
significant and linear relationship with NDVI. However, the NDVI observation at different time
periods alone could not explain much variance in tea leaf yield.
The study took into consideration different methods and approaches that could fit well in
monitoring and quantifying tea plantations from time to time. It also indicated that the tea area
problems can be easily monitored by using a GIS platform.

TS03F - Remote Sensing II
Rishiraj Dutta The Netherlands
Informal Settlement in Ethiopia, the Case of two Kebeles in Bahir Dar City
FIG Working Week 2011
Bridging the Gap between Cultures
Marrakech, Morocco, 18-22 May 2011
2/14
Remote Sensing a Tool to Measure and Monitor Tea Plantations in Northeast
India
Rishiraj DUTTA, The Netherlands
1. INTRODUCTION
Tea is an evergreen shrub from the genus Camellia that includes some 82 species (Banerjee,
1992). Of all the species, tea is the most important both commercially and taxonomically and is
cultivated to produce a stimulant brew. In India, Camellia sinensis var. assamica is most widely
used. Tea is a leading cash crop in world agriculture with its production increasing from 850
million kg during the year 2000 – 2003 to 980 million kg 2004 – 2007 (Dutta et al., 2010). Tea is
indigenous to India and is an area where the country can take a lot of pride. This is mainly
because of its pre-eminence as a foreign exchange earner. Stagnation in tea production and
decline in tea quality are seen as major problems by the tea industry which is attributed to several
factors such as old age of tea plantations, waterlogging, declining soil health and increased
incidence of pests and diseases (Dutta et al., 2008). Tea is affected by a plethora of factors
ranging from genotype, environment and management (Dutta et al., 2010).
The monsoonal climate of Northeastern India is accompanied by alternate wet and dry
seasons giving a unique opportunity to have too much and too little water. Of late, large tea
plantations of about 350,000 ha supported by this region have become susceptible to continued
water logging, droughts, soil erosion etc. in certain areas. Due to flowing of water through the
catchments, the drainage problems have to be addressed on the basis of a watershed which has a
multidimensional issues and priorities (Bordoloi et al., 2006). Topographic information at the
catchment level including the existing natural drainage network is very essential. Strong and
accurate diagnostic tools are also required for identifying the exact nature of drainage problems
and the geographic changes that have taken over time (Bhagat et al., 2007). With the increasing
frequency of expansion of tea cultivation, low lying areas for growing of thatch, bamboo, fuel
plants or paddy cultivation are now covered by tea plantations. Instead of facing the high water
table problems in these new expansions, it is causing siltation in the natural drainage system in
the recent years. Although riparian laws forbid the blocking of the waterways, this is hardly
enforced (Bordoloi, 1993). Occasional blockades of tertiary streams serving as main drainage
base for the tea estates and encroachments of these streams have further deteriorated their
carrying capacity. Disposal of excess water through pumping system resulted in problems to the
adjoining paddy fields which are often inundated due to silting/blockage of natural drainage
system. Remote sensing techniques can be a very useful tool to visualize larger areas at a time
with its distinctive features and also the geomorphic changes. Use of remote sensing data on a
geographic information system (GIS) platform would help store, manipulate, analyze a huge
database (spatial and non-spatial) and display/reproduce the data in a more meaningful and
usable manner (Bordoloi and Borbora, 1994).
The use of space-based remote sensing techniques is well established for regional and global
monitoring and assessment of agricultural crops using various kinds of vegetation indices (Gallo
TS03F - Remote Sensing II
Rishiraj Dutta The Netherlands
Informal Settlement in Ethiopia, the Case of two Kebeles in Bahir Dar City
FIG Working Week 2011
Bridging the Gap between Cultures
Marrakech, Morocco, 18-22 May 2011
3/14
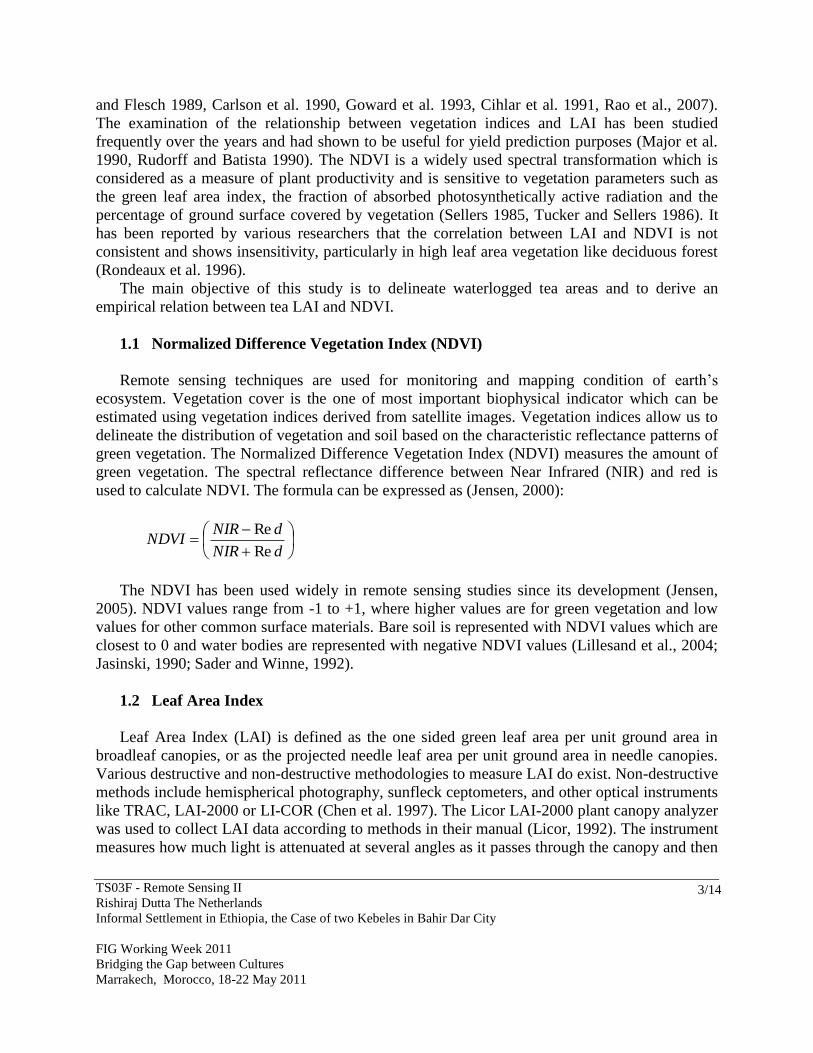
and Flesch 1989, Carlson et al. 1990, Goward et al. 1993, Cihlar et al. 1991, Rao et al., 2007).
The examination of the relationship between vegetation indices and LAI has been studied
frequently over the years and had shown to be useful for yield prediction purposes (Major et al.
1990, Rudorff and Batista 1990). The NDVI is a widely used spectral transformation which is
considered as a measure of plant productivity and is sensitive to vegetation parameters such as
the green leaf area index, the fraction of absorbed photosynthetically active radiation and the
percentage of ground surface covered by vegetation (Sellers 1985, Tucker and Sellers 1986). It
has been reported by various researchers that the correlation between LAI and NDVI is not
consistent and shows insensitivity, particularly in high leaf area vegetation like deciduous forest
(Rondeaux et al. 1996).
The main objective of this study is to delineate waterlogged tea areas and to derive an
empirical relation between tea LAI and NDVI.
1.1 Normalized Difference Vegetation Index (NDVI)
Remote sensing techniques are used for monitoring and mapping condition of earth‟s
ecosystem. Vegetation cover is the one of most important biophysical indicator which can be
estimated using vegetation indices derived from satellite images. Vegetation indices allow us to
delineate the distribution of vegetation and soil based on the characteristic reflectance patterns of
green vegetation. The Normalized Difference Vegetation Index (NDVI) measures the amount of
green vegetation. The spectral reflectance difference between Near Infrared (NIR) and red is
used to calculate NDVI. The formula can be expressed as (Jensen, 2000):
dNIR
dNIRNDVI
Re
Re
The NDVI has been used widely in remote sensing studies since its development (Jensen,
2005). NDVI values range from -1 to +1, where higher values are for green vegetation and low
values for other common surface materials. Bare soil is represented with NDVI values which are
closest to 0 and water bodies are represented with negative NDVI values (Lillesand et al., 2004;
Jasinski, 1990; Sader and Winne, 1992).
1.2 Leaf Area Index
Leaf Area Index (LAI) is defined as the one sided green leaf area per unit ground area in
broadleaf canopies, or as the projected needle leaf area per unit ground area in needle canopies.
Various destructive and non-destructive methodologies to measure LAI do exist. Non-destructive
methods include hemispherical photography, sunfleck ceptometers, and other optical instruments
like TRAC, LAI-2000 or LI-COR (Chen et al. 1997). The Licor LAI-2000 plant canopy analyzer
was used to collect LAI data according to methods in their manual (Licor, 1992). The instrument
measures how much light is attenuated at several angles as it passes through the canopy and then
TS03F - Remote Sensing II
Rishiraj Dutta The Netherlands
Informal Settlement in Ethiopia, the Case of two Kebeles in Bahir Dar City
FIG Working Week 2011
Bridging the Gap between Cultures
Marrakech, Morocco, 18-22 May 2011
4/14
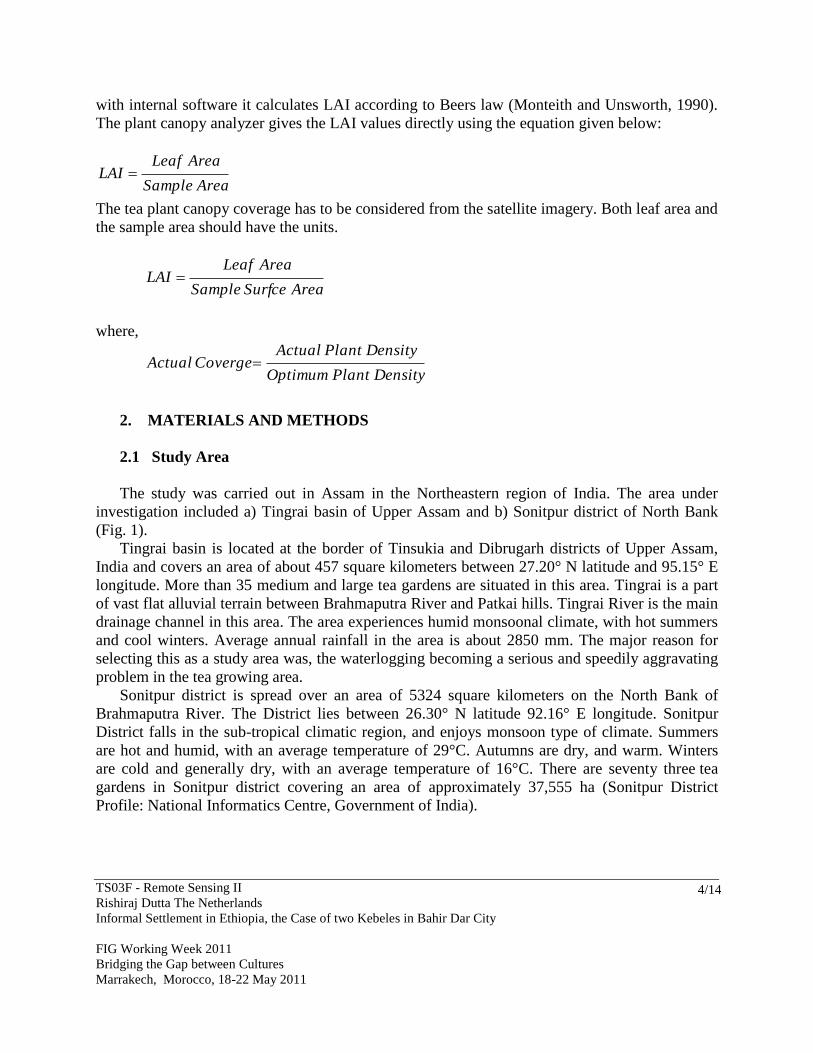
with internal software it calculates LAI according to Beers law (Monteith and Unsworth, 1990).
The plant canopy analyzer gives the LAI values directly using the equation given below:
AreaSample
AreaLeafLAI
The tea plant canopy coverage has to be considered from the satellite imagery. Both leaf area and
the sample area should have the units.
AreaSurfceSample
AreaLeafLAI
where,
DensityPlantOptimum
DensityPlantActualCovergeActual
2. MATERIALS AND METHODS
2.1 Study Area
The study was carried out in Assam in the Northeastern region of India. The area under
investigation included a) Tingrai basin of Upper Assam and b) Sonitpur district of North Bank
(Fig. 1).
Tingrai basin is located at the border of Tinsukia and Dibrugarh districts of Upper Assam,
India and covers an area of about 457 square kilometers between 27.20° N latitude and 95.15° E
longitude. More than 35 medium and large tea gardens are situated in this area. Tingrai is a part
of vast flat alluvial terrain between Brahmaputra River and Patkai hills. Tingrai River is the main
drainage channel in this area. The area experiences humid monsoonal climate, with hot summers
and cool winters. Average annual rainfall in the area is about 2850 mm. The major reason for
selecting this as a study area was, the waterlogging becoming a serious and speedily aggravating
problem in the tea growing area.
Sonitpur district is spread over an area of 5324 square kilometers on the North Bank of
Brahmaputra River. The District lies between 26.30° N latitude 92.16° E longitude. Sonitpur
District falls in the sub-tropical climatic region, and enjoys monsoon type of climate. Summers
are hot and humid, with an average temperature of 29°C. Autumns are dry, and warm. Winters
are cold and generally dry, with an average temperature of 16°C. There are seventy three tea
gardens in Sonitpur district covering an area of approximately 37,555 ha (Sonitpur District
Profile: National Informatics Centre, Government of India).

TS03F - Remote Sensing II
Rishiraj Dutta The Netherlands
Informal Settlement in Ethiopia, the Case of two Kebeles in Bahir Dar City
FIG Working Week 2011
Bridging the Gap between Cultures
Marrakech, Morocco, 18-22 May 2011
5/14
Fig. 1 Map showing the tea growing areas in Assam
2.2 Data Used
For delineation of waterlogged areas, the main sources of data was LISS IV (5.8 m
resolution) mono and LISS III (23.8m resolution) geo-coded standard false colour composite
(FCC) digital image of RESOURCESAT 1 (IRS P6), procured from National Remote Sensing
Centre (NRSC), Hyderabad, India. The statistical data were collected from the tea estate records
and Tea Research Association data files.
Similarly, to examine the relations between tea yield and remotely sensed NDVI, MODIS
data for the month of April, June and August were used for the period from 2005 – 2009. This
data was then used to derive the relations between tea leaf area index (LAI) and NDVI.
2.3 Methods

TS03F - Remote Sensing II
Rishiraj Dutta The Netherlands
Informal Settlement in Ethiopia, the Case of two Kebeles in Bahir Dar City
FIG Working Week 2011
Bridging the Gap between Cultures
Marrakech, Morocco, 18-22 May 2011
6/14
Image Processing
The basic spatial layers, such as administrative boundaries, contours etc. were digitized from
topomaps obtained from survey of India (SOI) at 1:50,000 scale. The digital elevation model
(DEM) was generated from the interpolation of contour lines and spot heights. The LISS IV
mono image was geo-referenced with LISS III FCC geo-coded image. Using „resolution
merging‟ technique, supervised classification was done and the landuse/landcover map was
generated. Geo-morphological map was generated from merged LISS III and LISS IV mono
images and incorporating field information collected from the field. The drainage maps were
generated by on-screen digitization of the images and extracting the Survey of India drainage
system, which was later superimposed to identify change detection. Classification was done
using both supervised and unsupervised techniques. In Tingrai basin, a ground survey was
conducted using area frame sampling method to verify and improve classification. Field data
collection was aided by GPS to locate the ground coordinates. Information on vegetation,
geomorphologic, soil and topographic parameters were also collected. The information collected
during ground truthing has helped in post processing of the classified images, done to improve
and refine the classification. About 10 per cent of the total sample area was randomly selected
for accuracy assessment while the overall accuracy was 90 per cent. Final maps were generated
on the basis of pre-field assessment and interpretation, field investigation and available
secondary data. Both visual and digital approaches were conjunctively used for the finalization
of maps.
Further an empirical relationship between NDVI – LAI were developed to observe the
variability which in turn will help in yield prediction. A year wise correlation was developed
between tea leaf yields and MODIS based NDVI of the tea estate during different months.
3. RESULTS
3.1 Delineation of waterlogged tea areas
The two geomorphic units of the area are younger alluvial plain and older alluvial plain. The
younger alluvial plain consists of cultivated fields and settlements. The older alluvial plains are
situated comparatively at a higher elevation and all the tea estates are situated in this unit. Land
cover classes were delineated which includes tea areas with estate boundaries, built up lands,
agricultural areas, forests, small vegetation, swampy areas, barren areas and water bodies. The
spatial coverage showed that 27.78% (127.13 sq km) of the area is under tea gardens. Tea
gardens are generally situated at higher elevation than the agricultural lands. But at few places
the reverse is true. It was observed that these are the places where the flooding problem is more
prominent.
When the drainage layers were extracted from the SOI map of 1970 and satellite image of
2004, it appeared that most of the drainage in the SOI map has become extinct in the satellite
image (Fig. 2). When the field data was correlated with the drainage maps, it showed that this is

TS03F - Remote Sensing II
Rishiraj Dutta The Netherlands
Informal Settlement in Ethiopia, the Case of two Kebeles in Bahir Dar City
FIG Working Week 2011
Bridging the Gap between Cultures
Marrakech, Morocco, 18-22 May 2011
7/14
happening because of the eutrophication and man-made bunds, besides several new sub-divisions
coming up as built up areas. This is the major cause of floods in the region which was due to
obstruction of natural flow of water. Dried drainage networks seen in the image are also blocked
by this problem and their natural flow is obstructed. Flood and water logging problems in the
Tingrai area are largely caused due to hindrance of free flow of water through natural channels.
Some of the channels have become extinct over the years since no water is flowing, more so
because some were diverted by the estate authorities.
Fig. 2 Maps showing the drainage situation in Tingrai Basin (a.) 1970 and (b.) 2004
3.2 Yield Estimation
NDVI was generated for tea areas from MODIS images using 3 x 3 pixel extraction methods.
The LAI – NDVI values were then plotted in the scatter plot and linearly regressed. From the
analysis it was observed that there exist a strong linear relationship between LAI and MODIS
based NDVI. For the yield estimation the MODIS LAI image for August and MODIS NDVI

TS03F - Remote Sensing II
Rishiraj Dutta The Netherlands
Informal Settlement in Ethiopia, the Case of two Kebeles in Bahir Dar City
FIG Working Week 2011
Bridging the Gap between Cultures
Marrakech, Morocco, 18-22 May 2011
8/14
image for April, June and August from 2005 – 2009 were used. The mean NDVI for all the
MODIS images were extracted using the area weighted average or zonal attribute.
3.3 LAI – NDVI Relationship
MODIS derived NDVI image was generated for the tea estate areas and the NDVI values
were extracted using 3 x 3 kernels for extracting the pixels. The LAI – NDVI values were plotted
and linearly regressed (Fig. 3). From the analysis it was observed that there exist a strong linear
relationship between LAI and MODIS based NDVI with an R² value of 0.699. Thus it could be
inferred that MODIS derived NDVI can approximately provide information on leaf area index
for tea.
y = 15.463x - 4.1505
R2 = 0.6995
0.25
1.25
2.25
3.25
4.25
5.25
6.25
7.25
0.3 0.35 0.4 0.45 0.5 0.55 0.6 0.65 0.7
NDVI
LA
I
Fig. 3 LAI - NDVI Relationship
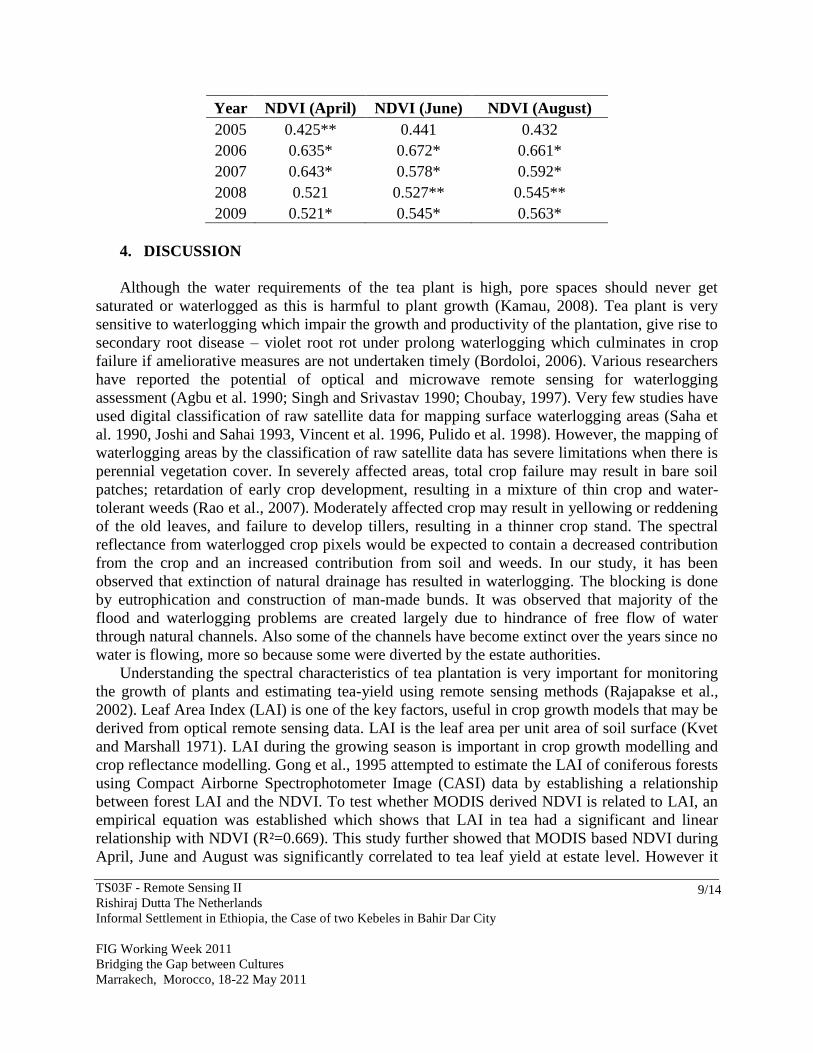
3.4 Relation between Tea Leaf Yield and MODIS NDVI
Correlation analysis was carried out between area weighted averaged NDVI of tea for
selected tea estate with their tea leaf yield for different years (2005 – 2009). Results showed that
correlation is positive and significant irrespective of month of the NDVI over the years (Table 1).
Tea leaf yield was found significantly related to NDVI at 95% level of significance during 2006,
2007 and 2009 while during April, 2005 and June and August, 2008, correlation is positive at 1%
level of significance.
Table 1 Year wise correlation between tea leaf yield and MODIS based NDVI of tea estates during
different months
TS03F - Remote Sensing II
Rishiraj Dutta The Netherlands
Informal Settlement in Ethiopia, the Case of two Kebeles in Bahir Dar City
FIG Working Week 2011
Bridging the Gap between Cultures
Marrakech, Morocco, 18-22 May 2011
9/14
Year NDVI (April) NDVI (June) NDVI (August)
2005 0.425** 0.441 0.432
2006 0.635* 0.672* 0.661*
2007 0.643* 0.578* 0.592*
2008 0.521 0.527** 0.545**
2009 0.521* 0.545* 0.563*
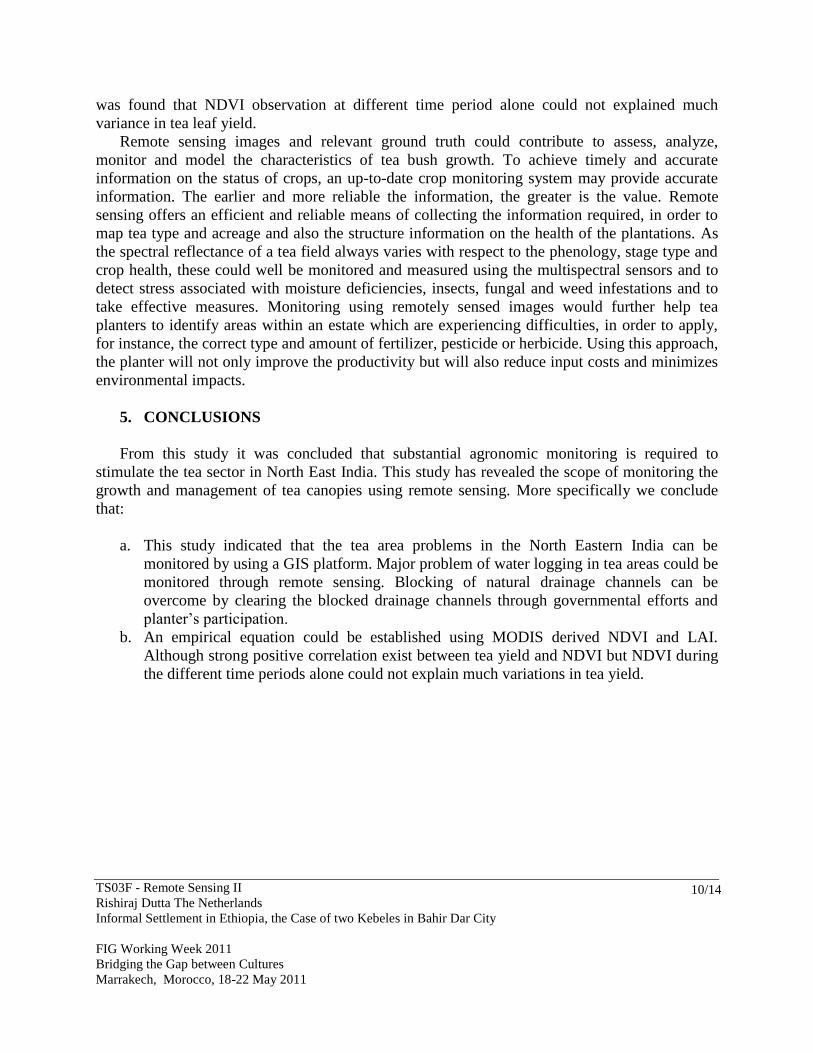
4. DISCUSSION
Although the water requirements of the tea plant is high, pore spaces should never get
saturated or waterlogged as this is harmful to plant growth (Kamau, 2008). Tea plant is very
sensitive to waterlogging which impair the growth and productivity of the plantation, give rise to
secondary root disease – violet root rot under prolong waterlogging which culminates in crop
failure if ameliorative measures are not undertaken timely (Bordoloi, 2006). Various researchers
have reported the potential of optical and microwave remote sensing for waterlogging
assessment (Agbu et al. 1990; Singh and Srivastav 1990; Choubay, 1997). Very few studies have
used digital classification of raw satellite data for mapping surface waterlogging areas (Saha et
al. 1990, Joshi and Sahai 1993, Vincent et al. 1996, Pulido et al. 1998). However, the mapping of
waterlogging areas by the classification of raw satellite data has severe limitations when there is
perennial vegetation cover. In severely affected areas, total crop failure may result in bare soil
patches; retardation of early crop development, resulting in a mixture of thin crop and water-
tolerant weeds (Rao et al., 2007). Moderately affected crop may result in yellowing or reddening
of the old leaves, and failure to develop tillers, resulting in a thinner crop stand. The spectral
reflectance from waterlogged crop pixels would be expected to contain a decreased contribution
from the crop and an increased contribution from soil and weeds. In our study, it has been
observed that extinction of natural drainage has resulted in waterlogging. The blocking is done
by eutrophication and construction of man-made bunds. It was observed that majority of the
flood and waterlogging problems are created largely due to hindrance of free flow of water
through natural channels. Also some of the channels have become extinct over the years since no
water is flowing, more so because some were diverted by the estate authorities.
Understanding the spectral characteristics of tea plantation is very important for monitoring
the growth of plants and estimating tea-yield using remote sensing methods (Rajapakse et al.,
2002). Leaf Area Index (LAI) is one of the key factors, useful in crop growth models that may be
derived from optical remote sensing data. LAI is the leaf area per unit area of soil surface (Kvet
and Marshall 1971). LAI during the growing season is important in crop growth modelling and
crop reflectance modelling. Gong et al., 1995 attempted to estimate the LAI of coniferous forests
using Compact Airborne Spectrophotometer Image (CASI) data by establishing a relationship
between forest LAI and the NDVI. To test whether MODIS derived NDVI is related to LAI, an
empirical equation was established which shows that LAI in tea had a significant and linear
relationship with NDVI (R²=0.669). This study further showed that MODIS based NDVI during
April, June and August was significantly correlated to tea leaf yield at estate level. However it
TS03F - Remote Sensing II
Rishiraj Dutta The Netherlands
Informal Settlement in Ethiopia, the Case of two Kebeles in Bahir Dar City
FIG Working Week 2011
Bridging the Gap between Cultures
Marrakech, Morocco, 18-22 May 2011
10/14
was found that NDVI observation at different time period alone could not explained much
variance in tea leaf yield.
Remote sensing images and relevant ground truth could contribute to assess, analyze,
monitor and model the characteristics of tea bush growth. To achieve timely and accurate
information on the status of crops, an up-to-date crop monitoring system may provide accurate
information. The earlier and more reliable the information, the greater is the value. Remote
sensing offers an efficient and reliable means of collecting the information required, in order to
map tea type and acreage and also the structure information on the health of the plantations. As
the spectral reflectance of a tea field always varies with respect to the phenology, stage type and
crop health, these could well be monitored and measured using the multispectral sensors and to
detect stress associated with moisture deficiencies, insects, fungal and weed infestations and to
take effective measures. Monitoring using remotely sensed images would further help tea
planters to identify areas within an estate which are experiencing difficulties, in order to apply,
for instance, the correct type and amount of fertilizer, pesticide or herbicide. Using this approach,
the planter will not only improve the productivity but will also reduce input costs and minimizes
environmental impacts.
5. CONCLUSIONS
From this study it was concluded that substantial agronomic monitoring is required to
stimulate the tea sector in North East India. This study has revealed the scope of monitoring the
growth and management of tea canopies using remote sensing. More specifically we conclude
that:
a. This study indicated that the tea area problems in the North Eastern India can be
monitored by using a GIS platform. Major problem of water logging in tea areas could be
monitored through remote sensing. Blocking of natural drainage channels can be
overcome by clearing the blocked drainage channels through governmental efforts and
planter‟s participation.
b. An empirical equation could be established using MODIS derived NDVI and LAI.
Although strong positive correlation exist between tea yield and NDVI but NDVI during
the different time periods alone could not explain much variations in tea yield.

TS03F - Remote Sensing II
Rishiraj Dutta The Netherlands
Informal Settlement in Ethiopia, the Case of two Kebeles in Bahir Dar City
FIG Working Week 2011
Bridging the Gap between Cultures
Marrakech, Morocco, 18-22 May 2011
11/14
REFERENCES
Agbu, P. A., Fehrenbacher, D. J. and Jansen, I. J., 1990. Soil property relationships with SPOT
satellite digital data in East Central Illinois. Soil Science Society of America Journal, 54,
807 – 812.
Bhagat, R. M, Singh S., Sood, C., Pradhan S. and Shrestha B., 2007. A hierarchical approach for
mapping forest and other land cover types in a mountainous area using IRS-ID LISS – III
data. International Journal of Geo-informatics, 3 (2), 79 – 86.
Banerjee, B., 1992. Botanical classification of tea. In: Willson, K.C., Clifford, M.N. (Eds), Tea:
Cultivation to consumption. Chapman and Hall, London, 25 – 51.
Bordoloi, P.K., 1993. The Brahmaputra and its impact on the tea industry. Two and a Bud, 40
(1), 13 – 17.
Bordoloi P. K. and Borbora B. C., 1994. A study on the landuse pattern and ground water
potential through remote sensing technique. Two and a Bud, 41(2), 36 – 39.
Bordoloi P. K., 2006. Application of GIS for Water Harvesting in Tea Planted on Hillocks in
Assam. Map Asia.
Bordoloi, P. K., Borah, D., and Dutta, A. K., 2006. Development of catchment wise integrated
drainage system through remote sensing and GIS towards solving water logging at micro
level – a pilot are study.
Carlson, T. N., Perry, E. M. and Schmugge, T. J., 1990. Remote estimation of soil moisture
availability and fractional vegetation cover for agricultural fields. Agricultural and Forest
Meteorology, 52, 45 – 69.
Chen, J. M., Rich, P. M., Gower, S. T., Norman, J. M., and Plummer, S., 1997. Leaf area index
of boreal forests: Theory, techniques, and measurements. Journal of Geophysical
Research, 102, 29429 – 29443.
Choubey, V. K., 1997. Detection and delineation of waterlogging by remote sensing techniques.
Journal of the Indian Society of Remote Sensing, 25, 123 – 135.
Cihlar, J., St. Laurent, L. and Dyer, J. A., 1991. Relation between the normalized difference
vegetation index and ecological variables. Remote Sensing of Environment, 35, 279 –
298.
Dutta, R., Stein, A. and Patel, N. R., 2008. Delineation of Diseased Tea Patches Using MXL and
Texture Based Classification. The International Archives of the Photogrammetry, Remote
Sensing and Spatial Information Sciences (ISPRS, Beijing) 37: Part B4, 1693 – 1700.
Dutta, R., Stein, A., Smaling, E. M. A., Bhagat, R. M. and Hazarika, M., 2010. Effects of plant
age and environmental and management factors on tea yield in Northeast India.
Agronomy Journal, 102, 1290 – 1301.
Gallo, K. P. and Flesch, T. K., 1989. Large area crop monitoring with the NOAA AVHRR:
estimating the silking stage of corn development. Remote Sensing of Environment, 27, 73
– 80.
TS03F - Remote Sensing II
Rishiraj Dutta The Netherlands
Informal Settlement in Ethiopia, the Case of two Kebeles in Bahir Dar City
FIG Working Week 2011
Bridging the Gap between Cultures
Marrakech, Morocco, 18-22 May 2011
12/14
Gong, P., Ruiliang, P. U., and Miller, J. R., 1995. Coniferous forest leaf area index estimation
along the Oregon transect using compact airborne spectrographic imager data.
Photogrammetric Engineering and Remote Sensing, 61, 1107 – 1117.
Goward, S. N., Dye, D. G., Turner, S. and Yang, J., 1993. Objective assessment of the NOAA
global vegetation index data product. International Journal of Remote Sensing, 14, 3365
– 3394.
Jasinski, M. F., 1990. Sensitivity of the normalized difference vegetation index to subpixel
canopy cover, soil albedo, and pixel scale. Remote Sensing of Environment, 32, 169 –
187.
Jensen, J. R., 2000. Remote sensing of the environment: An Earth Resource Perspective. Prentice
Hall, New Jersey.
Jensen, J. R., 2005. Introductory digital image processing: A Remote Sensing Perspective.
Pearson Prentice Hall, New Jersey.
Joshi, M. D. and Sahai, B., 1993. Mapping of salt-affected land in Saurashtra coast using Landsat
satellite data. International Journal of Remote Sensing, 14, 1919 – 1929.
Kamau, D. M., 2008. Productivity and resource use in ageing tea plantations. Ph.D. thesis.
Wageningen Universiteit, The Netherlands.
Kvet, J. and Marshall, J. K., 1971. Assessment of leaf area and other assimilating plant surfaces.
In Plant Photosynthetic Production: Manual of Methods, edited by Z. Sestak, J. Catsky
and P. G. Jarvis (The Hague: Dr W. Junk).
Licor, 1992. LAI – 2000 Plant Canopy Analyzer Operating Manual. Li-Cor, Lincoln, NB.
Lillesand, T. M, Kiefer, R. W. and Chipman, J. W., 2004. Remote sensing and image
interpretation. 5th
Edition, New York: John Wiley & Sons, Inc.
Major, D. J., Baret, F. and Guyot, G., 1990. A ratio vegetation index adjusted for soil brightness.
International Journal of Remote Sensing, 11, 727 – 740.
Monteith, J. and Unsworth, M., 1990. Principles of Environmental Physics. Arnold, London.
Pulido, M.L., Robles, R.B., Gonzalez, M.J., Wiegand, C.L. and Sanvicente, S.H., 1998.
Application of satellite images to identify soil salinity and areas with poor drainage. In
Proceedings VI1 National Irrigation Congress, Mexico (ILRS–Wageningen), 4 – 14.
Rajapakse, R. M. S. S., Tripathi, N. K. and Honda, K., 2002. Spectral characterization and LAI
modelling for the tea (Camellia sinensis (L.) O. Kuntze) canopy. International Journal of
Remote Sensing, 23 (18), 3569 – 3577.
Rao, N. Rama, Kapoor, M., Sharma, N. and Venkateswarlu, K., 2007. Yield prediction and
waterlogging assessment for tea plantation land using satellite image-based techniques.
International Journal of Remote Sensing, 28 (7), 1561 – 1576.
Rondeaux, G., Steven, M. and Baret, F., 1996. Optimization of soil-adjusted vegetation indices.
Remote Sensing of Environment, 55, 95 – 107.
Rudorff, B. F. T. and Batista, G. T., 1990. Spectral response of wheat and its relationship to
agronomic variables in the tropical region. Remote Sensing of Environment, 31, 53 – 63.
Sader, S. A. and Winne, J. C., 1992. RGB-NDVI colour composites for visualizing forest change
dynamics. International Journal of Remote Sensing, 13, 3055 – 3067.

TS03F - Remote Sensing II
Rishiraj Dutta The Netherlands
Informal Settlement in Ethiopia, the Case of two Kebeles in Bahir Dar City
FIG Working Week 2011
Bridging the Gap between Cultures
Marrakech, Morocco, 18-22 May 2011
13/14
Saha, S. K., Kudrat, M. and Bhan, S. K., 1990. Digital processing of Landsat TM data for
wasteland mapping in parts of Aligarh district, Uttar Pradesh, India. International
Journal of Remote Sensing, 11, 485 – 492.
Sellers, P. J., 1985. Canopy reflectance, photosynthesis, and transpiration. International Journal
of Remote Sensing, 6, 1335 – 1372.
Singh, R. P. and Srivastav, S. K., 1990. Mapping waterlogged and salt affected soils using
microwave radiometers. International Journal of Remote Sensing, 11, 1879 – 1887.
Tucker, C. J. and Sellers, P. J., 1986, Satellite remote sensing of primary production.
International Journal of Remote Sensing, 4, 325 – 334.
Vincent, B., Vidal, A., Tabbet, D., Baqri, A. and Kuper, M., 1996. Use of satellite remote
sensing for the assessment of waterlogging or salinity as an indication of the performance
of drained systems. In Evaluation of Performance of Subsurface Drainage Systems: 16th
Congress on Irrigation and Drainage, 15 – 22 September 1996 (Cairo, Egypt: University
of Cairo), 102 – 119.
BIOGRAPHICAL NOTES
Rishiraj Dutta is a PhD student currently pursuing his doctoral studies from the Department
of Earth Observation Science, Faculty of Geoinformation Science and Earth Observation,
University of Twente, The Netherlands. His topic of research is “Image Mining for Monitoring
Tea Replantation and Assessing Environmental Factors Influencing Tea Quality.” His PhD is a
joint programme between University of Twente and Tea Research Association, Assam, India.
He completed his graduations from Assam Agricultural University, Assam, India in 2003 and
joined as an Officer Trainee at the Indian Institute of Remote Sensing (IIRS), Indian Space
Research Organization, Dehradun, India in 2004 for his post graduate studies and obtained his
master‟s degree in Geoinformatics in 2006.
In 2006, he joined as a Consultant at the International Water Management Institute (CGIAR),
Colombo, Sri Lanka and worked on the Global Irrigated Area Mapping as an Indian Partner
before joining for his PhD in 2007. Currently, he is about to complete his PhD by the end of
December, 2010.
CONTACTS
Rishiraj Dutta
PhD Student, Department of Earth Observation Science
Room No.: 2 – 061, Mail Box: 162
Faculty of Geoinformation Science and Earth Observation, ITC, University of Twente
Hengelosestraat 99, P.O. Box: 217, 7500 AE, Enschede – The, Netherlands
Tel.: +31-53-4874-538 (Off.)

TS03F - Remote Sensing II
Rishiraj Dutta The Netherlands
Informal Settlement in Ethiopia, the Case of two Kebeles in Bahir Dar City
FIG Working Week 2011
Bridging the Gap between Cultures
Marrakech, Morocco, 18-22 May 2011
14/14
+31-638352401 (Mob.)
Email: [email protected]