
Remittances, Child Labor, and Schooling: Evidence from ......adult labor compared to child labor....
37
Remittances, Child Labor, and Schooling: Evidence from Colombia * Andres Cuadros-Menaca † Universidad Icesi Arya Gaduh ‡ University of Arkansas May 2018 Abstract We estimate the causal impact of remittances on child labor and school participation in Co- lombia using data from its main metropolitan areas. We develop an instrumental variable (IV) strategy that leverages the unemployment shocks in the main destination countries of Colombian migrants arising from the 2008 financial crisis. Our IV combines these shocks with the historical migration rates from Colombian regions to these countries. We find that remittances reduce both labor participation and hours worked, but the impact on the latter is imprecisely estimated. We do not find an effect of remittances on schooling. Relative to their mean participation shares, these impacts are larger for younger children and girls. However, the negative impact for girls is associated with an even larger positive impact on their participation in household work. Finally, we study how remittances affect the overall household labor supply. We find that remittances reduce the labor supply of female adults, but their percent-change impact on adults is smaller than that on children. Keywords: Child Labor, Schooling, Remittances, Colombia JEL Classification: F24, J22, O15 * We would like to thank two anonymous referees, as well as participants at the 14th Midwest International Economic Development Conference, 2016 UNU-WIDER Human Capital and Growth Conference, the XXIV Meeting of Economics of Education (AEDE), and the 86th Annual Meeting of the Southern Economic Association. Andres Cuadros-Menaca acknowledges financial support from the Fulbright Scholarship program. † Universidad Icesi, Calle 18 No. 122-135 Pance, Cali, Colombia Email: [email protected]. ‡ Corresponding author. Sam M. Walton College of Business. Department of Economics. Business Building 402, Fayetteville, AR 72701-1201. Email: [email protected].
Transcript of Remittances, Child Labor, and Schooling: Evidence from ......adult labor compared to child labor....

Remittances, Child Labor, and Schooling:
Evidence from Colombia*
Andres Cuadros-Menaca†
Universidad IcesiArya Gaduh‡
University of Arkansas
May 2018
Abstract
We estimate the causal impact of remittances on child labor and school participation in Co-lombia using data from its main metropolitan areas. We develop an instrumental variable(IV) strategy that leverages the unemployment shocks in the main destination countries ofColombian migrants arising from the 2008 financial crisis. Our IV combines these shockswith the historical migration rates from Colombian regions to these countries. We find thatremittances reduce both labor participation and hours worked, but the impact on the latteris imprecisely estimated. We do not find an effect of remittances on schooling. Relativeto their mean participation shares, these impacts are larger for younger children and girls.However, the negative impact for girls is associated with an even larger positive impact ontheir participation in household work. Finally, we study how remittances affect the overallhousehold labor supply. We find that remittances reduce the labor supply of female adults,but their percent-change impact on adults is smaller than that on children.
Keywords: Child Labor, Schooling, Remittances, ColombiaJEL Classification: F24, J22, O15
*We would like to thank two anonymous referees, as well as participants at the 14th Midwest International EconomicDevelopment Conference, 2016 UNU-WIDER Human Capital and Growth Conference, the XXIV Meeting of Economicsof Education (AEDE), and the 86th Annual Meeting of the Southern Economic Association. Andres Cuadros-Menacaacknowledges financial support from the Fulbright Scholarship program.
†Universidad Icesi, Calle 18 No. 122-135 Pance, Cali, Colombia Email: [email protected].‡Corresponding author. Sam M. Walton College of Business. Department of Economics. Business Building 402,
Fayetteville, AR 72701-1201. Email: [email protected].
1 Introduction
An estimated 168 million, or about 11 percent of children worldwide are child laborers (ILO,2013).1 Many of these children, given household budget constraints, often work out of necessity(IPEC, 2013). Yet, their need to fulfill current consumption may have negative intertemporalconsequences. Work may harm the human capital accumulation (Baland and Robinson, 2000),learning outcomes (Emerson et al., 2017), health (O’Donnell et al., 2005), and future labor marketoutcomes (Emerson and Souza, 2011) of these children.
Interventions that relax budget constraints can reduce child labor. Standard labor theorysuggests that the income effect from the shift in the budget constraint could induce parents totake their children out of the labor market. Policy makers often use public resources to undertakesuch interventions, often through unconditional and conditional cash transfer programs (Fiszbeinet al., 2009). However, in countries that send international migrants, private remittance incomecan play a similar function for households with emigrating members. Similar to cash transfers,remittance income relaxes the budget constraints of those left behind and can reduce child laborin economies with a significant share of international migrants.
In this paper, we study the impact of remittances on child labor in Colombia. According tothe Gran Encuesta Integrada de Hogares (GEIH) 2008–2010 data, about 12 percent of children aged12 to 18 years old living in Colombia’s major metropolitan areas participate in market work. Atthe same time, international migrants are important contributors to the Colombian economy. Inabsolute terms, Colombia is the fourth largest recipient of remittance income in Latin Americaand among the top 30 largest recipients in the world (Yang, 2011). Yet, despite its importance,little is known about the effect of remittances on child labor. We develop a strategy to identify thecausal effect of remittances on child labor.
Our analysis uses repeated cross-sections of GEIH, which is the national household survey ofColombia. We focus on the thirteen major Colombian cities and their metropolitan areas (whichwe will refer to as regions hereafter) from which 3 out of 4 international migrants from Colombiaoriginate. With information on labor participation and working hours, we can estimate theimpact of remittances at the extensive and intensive margins. Moreover, its inclusion of detailedinformation for all household members allows for the analysis of intra-household reallocation oflabor supply between children and adults.
To identify the causal impact of remittances, we estimate an instrumental variable (IV) modelthat focuses on the 2008–2010 period. Our empirical strategy leverages the macroeconomic shocksaffecting the unemployment rates in Colombia’s most important migrant destinations that arosefrom the 2008 financial crisis. We introduce a novel variation on the use of macroeconomic shocksto identify remittance impact by using an IV that combines shocks with historical migration
1There are estimated to be around 78 million child workers in Asia and the Pacific, 59 million in Sub-Saharan Africa,and 13 million in Latin America and the Caribbean.
1

rates.2 We focus on the immediate years after the crisis to minimize the effect of the households’endogenous adjustments that would have occurred over a longer time horizon (Yang, 2008).
To construct the IV, we first define a destination country’s monthly unemployment shockas the deviation of its mean unemployment rate in the previous 12 months from its pre-crisisunemployment rate. We calculate these monthly shocks for Colombian migrants’ main destinationcountries, namely, the United States, Spain, Venezuela, and Ecuador. Then for every region,we weight these monthly, destination-country-specific unemployment shocks with the historicalshare of migrants from each migrant-sending region to these countries. To address concerns overregional confounders, we include region fixed effects (FE) and a set of regional control variablesthat vary over time.
We argue that this variable is an appropriate IV for remittances received by Colombianhouseholds. Macroeconomic shocks in a destination country affect the incomes of its immigrants,which in turn affect the remittances received by the households left behind. Indeed, our regressionfinds a negative correlation between the migrant-share-weighted average of the unemploymentshocks in the destination countries and the remittance receipts of Colombian households. Inthe short term, these are unanticipated shocks for recipient households. Hence, conditionalon the regional control variables and the region fixed effects, these unemployment shocks inthe destination countries should be excludable from the (second-stage) child labor regression.Moreover, we show that our estimates are robust to potential direct channels from shocks tohousehold-level outcomes that can lead to the violation of the exclusion restriction.
We find that remittances reduce child labor primarily at the extensive margin by increasingchildren’s likelihood to exit the labor market. Our preferred estimate shows that a (PPP-adjusted,which hereafter is implied) US$1 increase in the remittance income received by householdsdecreases the incidence of child labor by 0.022 percentage points (p.p.). Therefore, a 10-percentincrease at the mean remittance value of US$ 3,728 leads to an 8.2 p.p. reduction in the probabilityof child labor. At the intensive margin, we find a consistent negative effect on hours worked,albeit one that is imprecisely estimated. We therefore focus on the impact at the extensive margin.
We also investigate whether remittances increase school participation. A key policy issuerelated to child labor is its potential negative impact on schooling. For instance, work is cited asone of the main reasons for school drop-outs in the Caribbean and Pacific regions of Colombia(MEN, 2012). If child schooling and labor were perfect substitutes, remittances would impact theformer in a similar (albeit opposite) way to the latter. However, we do not find that remittancesaffect school participation in Colombia. This result complements the finding of Attanasio et al.(2010), who find that an education-focused intervention does not lead to the reduction in childlabor in Colombia. They both support the notion that child labor and school participation areimperfect substitutes (Ravallion and Wodon, 2000; Edmonds and Pavcnik, 2005).
2A number of studies used macroeconomic shocks to identify the impact of remittances (such as Yang, 2008;Amuedo-Dorantes and Pozo, 2010; Alcaraz et al., 2012; Bargain and Boutin, 2015).
2
To understand the heterogeneous impact of remittances, we disaggregate the sample by agegroup, gender, and economic status. Since labor participation rates differ between subgroups, inmaking comparisons, we need to not only consider the percentage-point impact from the estimatedcoefficient but also its importance relative to the mean participation share of each subgroup (i.e.,the percent-change impact). Age groups are defined based on the legal minimum working age (of15 years old). Meanwhile, to define economic status, we construct a household asset-based wealthindex and define as poor (non-poor) households with below (above) median-asset index.
The set of results from this analysis helps us better understand the heterogeneity in reservationswages between the different subgroups. First, remittances lead to a larger percent change decreasein child labor among the younger cohort. This is consistent with the notion that parents andpolicymakers put a higher value on the home time of younger children. Second, we also find thatparents put a higher value on the home time of girls, partly because of their role in householdwork. Finally, we find evidence for the “luxury axiom” (Basu and Van, 1998). Poor householdswhose children are below the legal working age are more likely to let them work. However,remittances are very effective in inducing them to pull their children out of the labor market.
In the last section, we weigh in on the question of whether remittance income leads to astronger disincentive to work on adult household members. If the work-disincentive impact ofprivate transfers like remittances is much stronger among adults, it may strengthen the case fortargeted interventions designed to reduce child labor with minimum impact on adult labor (see,e.g., Alzúa et al., 2013). However, we find that remittances lead to a smaller percent reduction inadult labor compared to child labor. Furthermore, this work-disincentive effect only affects femaleadults and is only precisely estimated for non-poor households.
To our knowledge, this is the first study of the causal impact of remittances on child labor andschooling in Colombia. A related work by Arango et al. (2015) uses a difference-in-differences(DD) estimator to estimate the impact of the 2008 financial crisis in the United States and Spain onthe remittance receipts and labor supply of households residing in the high emigration regionsof Colombia. Although they similarly leverage the crisis-induced unemployment fluctuationsin destination countries and historical migration rates as sources of identification, our paper isdistinct from theirs in significant ways. First, and most importantly, our objective is to identifythe causal impact of remittances (instead of a destination-country-specific financial crisis). Thus,our IV strategy directly addresses the endogeneity of remittances.3 Second, instead of separatelyestimating the impact of unemployment-rate fluctuation by each destination country, we construct asingle aggregate measure of destination-country unemployment shocks across Colombian migrants’main destinations to instrument for remittances. Both aspects of our empirical strategy enable usto quantify the impact of remittances. Finally, in contrast to their emphasis on adult labor supply,
3Separately estimating of the causal impact of the crisis on remittances and labor supply can, at most, offer suggestiveevidence on how remittances affect labor supply that may not survive further scrutiny. For instance, Arango et al.(2015) find that the crisis led to a reduction in remittance inflows and an increase in the labor supply of adult males.However, as we show in Section 7, we find no evidence for the causal impact of remittances on their labor supply.
3

we primarily focus on child outcomes.
Our paper contributes to the literature identifying the causal impact of remittances in threeways. First, we develop an IV strategy that exploits both spatial and temporal variations toidentify this causal impact under relatively undemanding data requirements. The study whoseidentification strategy is most similar to ours is that of Amuedo-Dorantes and Pozo (2010). Theyuse labor market conditions in the different states in the United States as an IV for whetherhouseholds receive remittances. Unlike their approach, however, our strategy does not rely onspecialized household-level migration questions to identify where emigrant members residedabroad. Instead, we use publicly available data that are relatively easy to acquire.
Second, we also shed light on the causal impact of remittances on intra-household timereallocations, both in terms of (i) how household work, but not schooling, is (gender-differentially)reallocated to children; and (ii) who among the adults also reduces their labor supply. Un-derstanding how remittance income reallocates activities across actors within the household isnecessary for a complete picture of its welfare impact on children. A number of papers look athow remittances reallocate different activities to children (e.g., Calero et al., 2009), as well as theirimpact on the labor supply of both children and adults (e.g., Acosta, 2006). To our knowledge,Yang (2008) is the only other study to comprehensively estimate all of these outcomes, albeit witha different identification strategy.
Finally, we study the impact on child labor at both the extensive and intensive margins.Previous studies, with some rare exceptions (e.g., Dimova et al., 2015, in rural Tanzania), tend tofocus on the former.4 In doing so, these studies may overlook the impacts on households whoseprimary response to an income shock is to adjust children’s working hours instead of their labormarket participation.
The rest of the paper is organized as follows. Section 2 describes the institutional contextsrelated to migration, child labor, and schooling in Colombia. We then describe the data, sampleconstruction, and the variables used (Section 3) followed by the empirical strategy (Section 4).Sections 5 and 6 report our main results on labor participation and school attendance, andthe heterogeneous impact analysis. Section 7 studies the broader work-disincentive effect ofremittances by comparing its impact on children and adults. Section 8 concludes.
2 International Migration and Child Labor in Colombia
This section provides the institutional context for the analysis. We describe the historical patternof international migration from Colombia and its effects on remittance flows. We then discussthe regulatory framework on child labor and present evidence of its enforcement in Colombia.
4Other related papers with hours worked as the outcome use migration status (e.g., Antman, 2011; Mansuri, 2006)or exchange rate shocks (which provides an exogenous source of variation in remittances) (Yang, 2008) as variables ofinterest.
4

Finally, we describe the Colombian education system and its potential interaction with child labor.
2.1 Migration and Remittances
International migration has played an important role in Colombia’s economic development inthe last few decades. The Colombian statistical agency, Departamento Administrativo Nacional deEstadística (DANE), estimated that, by 2005, around 8 percent of the total population lived outsidethe country, and a bulk of this migration was motivated by the desire to look for better economicand job opportunities (ENMIR, 2009). Historically, the main destinations included the UnitedStates, Spain, Venezuela, and Ecuador (Ramírez Herrera et al., 2010).5 Over time, the UnitedStates and Spain increasingly became the most preferred destinations: Between 2000 and 2010, thenumber of migrants to the United States almost doubled (from 471 to 909 thousand) while that toSpain increased more than tenfold (from 36 to 373 thousand) (Texidó and Gurrieri, 2012).
Figure 1 shows the historical migration rate across the different regions where the metropolitanareas are located in Colombia. It illustrates the wide spatial distribution of migrants hailing fromthese regions. Over time, they developed migrant networks in their destination countries, andmigrants from a particular region often have specific ties to networks in a particular country.We can see this in the historical migration data from the 2005 Census (Appendix Table A2). Forexample, migrants from the coffee regions at the center of the country prefer to go to Spainover other destinations. Those from the main cities — Bogotá, Medellín, and Cali — prefer theUnited States as their main destination. Meanwhile, migrants from the northeast region and thesouthwest region prefer their neighboring country of Venezuela and Ecuador respectively.
The rapid growth of outmigration brought a significant inflow of remittances into Colombia.According to the Colombian central bank, remittance flows increased from US$1,578 millionsin 2000 to US$3,313 millions in 2005 and reached a peak of US$4,427 millions in 2008. In 2008,an overwhelming 73 percent of the remittances came from two countries: the United States (37percent) and Spain (36 percent). However, the 2008 financial crisis that began in the United Statesand spread to the Eurozone led to the slowing down of remittance receipts. It was only by 2015that the remittance inflow returned to the pre-crisis level.
For the households left behind, about 59 percent of the remittance income is used for recurrenthousehold expenditure (Garay and Rodríguez, 2005). Moreover, only 4 percent of this income goesinto household savings. Hence, remittances function as a means to relax household immediatebudget constraints and have an important role in the survival of many poor households.6 Since
5Based on the 2005 census, DANE estimated that the majority of Colombia’s international migrants reside in fourcountries: the United States (34.6 percent), Spain (23.1 percent), Venezuela (20 percent), and Ecuador (3.1 percent)(Ramírez Herrera and Mendoza S., 2013). By 2010, these countries still account for more than 80 percent of thesemigrants (World Bank, 2011).
6From the total 24,291 recipients in the GEIH 2008–2010, 3.87 percent report being in the poorest income quartileof the metropolitan area where they reside. People at the poorest quartile roughly correspond to the poor in officialstatistics, since metropolitan-area poverty rate hovered around 25 percent during the period.
5

helping out with household expenses account is an important reason why children work inColombia, remittance income may reduce child labor through its effect on the household budgetconstraint.
2.2 Child Labor
According to the 2008–2010 GEIH data, around 12 percent of children in Colombia’s mainmetropolitan areas work, and there are important differences in the types of work they undertakeby gender. Table 1 shows total participation by main economic activity. The main sectors thatemploy children are wholesale and retail, followed by hotels and restaurants, manufacturing(mainly of food and beverage products), and storage and transportation (which includes maildelivery and communications). Across gender, the wholesale and retail sector is the primaryemployer. However, for certain sectors, employment is very gender-specific. For instance, theconstruction sector employs 8.9 percent of working boys (and is their second-most importantemployer), compared to 0.3 percent for girls. In contrast, the domestic service sector employsalmost 6 percent of working girls, but hardly employs working boys.7
The Government of Colombia regulates the allowed working hours and sectors for workingchildren of different ages. According to Law 1098 of 2006, the minimum working age is 15 yearsold. Children younger than 15 can only work in artistic, cultural, recreational or sports activitieswith official authorization and for a maximum of 14 hours per week. Meanwhile, children between15 and 16 years old require authorization to work a maximum of 30 hours during the week. Thosebetween 17 and 18 years old can work without restriction but for no more than 40 hours in a week.
However, this regulation has not been strictly enforced in practice. Table 1 shows hours workedby age groups (as stipulated in the law) and gender. We find, for example, that the other servicessector (which includes artistic, cultural, and recreational activities) only employs 2.5 percent ofchildren aged 12–14, even though the law only allows them to work in these activities. Moreover,these children also report working more hours than the legal limit. Children aged 12–14 years oldwork more than 20 hours during the week, with boys reporting more working hours than girls (23and 19 hours respectively). Importantly, the average number of working hours for boys exceeds thelegal limits, i.e, 32.7 hours among 15–16 year-old boys and 41.2 hours for 17–18 year-olds. Thesenumbers are consistent with qualitative evidence suggesting a stronger expectation for boys to beself sufficient (Pinzón-Rondón et al., 2008).
2.3 Education in Colombia
The General Law of Education (Law 115 of 1994) states that education is compulsory for childrenbetween 5 and 15 years old. Children must attend one year of kindergarten, and nine years ofbasic education that comprises five years of primary schools and four years of basic-secondary
7Domestic service refers only to paid household work, and not unpaid domestic chores.
6

school. Afterward, there are the additional two years of upper-secondary school that, until 2014,were not compulsory. Children must complete upper-secondary school to access university-leveleducation. The 12–18 year-old children in our sample represent those who should be attendingbasic- and upper-secondary education.
Two key education policy objectives in Colombia are to guarantee universal access to basiceducation and keep students in school. As such, the government introduced a number of targetedconditional transfers programs such as Familias en Acción and Red Juntos, as well as campaigns topersuade children to stay in school (e.g., Ni Uno Ni Menos). Despite these efforts, dropout ratesremain a problem, especially among those 11–16 years old. In parts of Colombia, child labor wascited as one of the main reasons for primary and secondary school dropouts (MEN, 2012). At thesame time, for half of the children 12–18 years old in our sample, working and attending schooldo not appear to be mutually exclusive (Table 1).
3 Data and Measurements
The main data source for our analysis is the Colombian household survey, Gran Encuesta Integradade Hogares (GEIH), that is produced annually by DANE since 2006. The survey includes socio-economic characteristics of the population such as labor, gender, age, and income sources. Wefocus on our analysis of Colombia’s thirteen main cities and metropolitan areas, which arethe country’s most dense regions where more than half of the Colombian population reside.Importantly, according to the 2005 Census, about 75 percent of individuals who reside abroad fiveyears prior to the census hail from these regions. Figure 1 illustrates the coverage of the GEIHsurvey, where the thick borders encapsulate the included municipalities. For each year, data werecollected over a 12-month period, and the dataset provides information on the month the surveywas conducted. Our analysis pools the cross-section data for the 2008–2010 period.
3.1 Sample Construction and Household Definition
To build our analytical sample, we first limit our observations to relatives of the household heads.For each household, GEIH interviews all members of the households, including domestic workersand other household employees. In addition, GEIH collects information on individual relationshipto the household head, categorized as “spouse”, “child”, “grandchild”, “other relative”, or differenttypes of employees. We limit our sample to household heads and their relatives, and excludehousehold employees. For the 2008–2010 period, we obtain 143,655 observations of childrenbetween 12 and 18 years old.8
We then assign to each individual the household she or he belongs. This assignment processdiffers depending on whether the individual lives in a nuclear- or an extended-family household.9
8They include 48,104 children in 2008, 47,916 in 2009, and 47,635 in 2010.9Out of 345,344 households in the dataset, there are 62,231 extended-family households.
7

In a nuclear-family household, everyone is assigned to the same household. In an extended-family household, we first define the nuclear family of the household head as one householdunit. We then group the remaining members as part of a second (economic) household unit.10
We use this definition to assign household-level variables (including total remittances) to theindividual. Conceptually, this process is grounded in the rich evidence on limited altruism towardextended families (Altonji et al., 1992; Cox and Fafchamps, 2007), including in remittance decisions(Rapoport and Docquier, 2006). Empirically, it strengthens the first stage.
3.2 Labor Supply and Remittances
We estimate the effect of remittances on labor participation in market work for children aged12–18 years old. We use two variables to capture labor participation at the extensive and intensivemargins. First, we use a binary variable of whether the child reports participating in any typeof economic activities as the dependent variable.11 The list of economic activities includes wagelabor, family labor, domestic work, and unpaid work. Then, we use the question on the typicalnumber of hours the child works to estimate the impact at the intensive margin.
Our main regressor is the total amount of international remittances received by the householdin the last twelve months. GEIH asked each household member for the amount of remittancesreceived from persons residing outside of the country. To account for variations in living costsover time, we convert this variable to the PPP-adjusted US dollar equivalent.12 As such, allreferences to US$ in our analysis are PPP-adjusted. Once adjusted, we aggregate by summingthese individual remittances for each economic household as defined above.
3.3 Other Observables
We include two sets of control variables at the household and regional levels. First, we include aset of control variables that capture characteristics of the child, her household, and her householdheads. Child characteristics include gender, age, and an indicator of whether the child is either ahousehold head or a spouse. Household characteristics include its size and number of children.In extended-family households, these variables are calculated for each economic household (seeSection 3.1). Household-head characteristics include his or her education, gender, and maritalstatus. Members of the extended family are assigned the characteristics of the main householdhead.
10An ideal assignment would link each individual who is not part of the household head’s nuclear family into herown nuclear household. However, since GEIH anchors an individual’s relationship to the household head, this is notpossible.
11To collect labor market participation information, GEIH asks each respondent his primary activity in the previousweek. If his primary activity is not working (full time), GEIH also inquires whether he performs paid work for at leastone hour or is employed but not currently performing work activities. Finally, it also asks if he works without receivingpay. In our analysis, a respondent who answers yes to any of these questions is considered working.
12We use the PPP conversion factor for private consumption from the World Bank’s World Development Indicators(WDI) database (World Bank, 2016).
8

Meanwhile, we use household assets instead of current income as a proxy of living standard,to address concerns over the potential endogeneity of income (McKenzie, 2005). We use theprincipal component analysis to construct this asset index. The variables used to construct thisindex include: home ownership; the availability of electricity, telephone, and internet services;sources of water supply; sanitation facility; and the types of flooring material. Table A1 in theAppendix provides the full list of the variables used to construct this index. All members of anextended-family household are assigned the same value.
Table 2 displays the summary statistics of children and household characteristics. Of the143,655 children, 4,013 live in remittance-receiving households. The proportion of children workingand the number of hours worked are higher in non-recipient households. Furthermore, recipienthouseholds have a higher proportion of female household head, which may be related to migrationpatterns, and a lower proportion of married household head. At the same time, the asset indexand the share of children at the bottom per-capita income quartile in their metropolitan area(which proxies for their poverty status) indicate that overall recipient households are better offthan non-recipient households.
The asset index also allows us to explore the variation in child labor participation in householdswith different socio-economic status. While the proportion of children from the richest quartilein the labor force is 7 percent, in the poorest quartile this proportion reaches almost 16 percent.In terms of hours worked, children living in the richest-quartile households also report workingfewer hours. For the poorest quartile, the average number of hours worked is 36 hours during theweek, while those children from households at the richest quartile report working an average of27 hours during the week.
At the region level, we include each region’s Gini coefficient and unemployment rate for eachyear. We also include the GDP growth of the regions where each metropolitan area is located.These variables control for time-varying regional income inequality, labor market equilibrium,and broad economic performance. All regional-level variables are obtained from DANE.
4 Empirical Strategy
We first estimate the impact of remittances on (labor and school) participation and hours worked.For the participation variables, we estimate the following linear probability model:
Yiht = γ.Rht + Xit.β+ ψr + ε it
where Yiht is an indicator variable that equals one if child i during month t is either working or inschool. Rht is the variable of interest, the total amount of remittances that household h received inthe twelve months prior to time t. Xit is a vector of child, household, and region characteristics.ψr are the region fixed effects (FE). The coefficient of interest, γ, is the estimated effect of an
9
additional unit of remittances on the likelihood of participation.
Meanwhile, to estimate the remittance impact on work hours, we begin by addressing thecensored nature of working hours. We use the standard approach by estimating the Tobitregression of work hours on remittances:
Y∗iht = α.Rht + Xit.δ + ψr + ε it
ε it ∼ Normal(0, σ2)
Yiht = Max(0, Y∗iht)
where Rht is our main independent variable, and Xit and ψr are as before.13
Remittance income is potentially endogenous to child labor outcomes and may bias ourstandard estimates. In theory, this bias can go in either direction. Consider, for instance, how (i)the relationship between wealth and child labor; and (ii) emigrant selection can interact to signof the bias. Empirical evidence suggests that the link between child labor and household wealthcan be negative (the “luxury axiom“, Basu and Van, 1998) or positive (the “wealth paradox“,Bhalotra, 2003).14 When interacted with the self-selection of remitting emigrants, this relationshipcan introduce either a positive or negative bias. For instance, under the luxury axiom, positive(negative) selection of emigrants implies richer (poorer) households receive more remittances,which leads to a negative (positive) bias. Including an index of household assets helps amelioratethis bias. Moreover, conditional on household assets, there may be persistent, unobservableshocks to certain household types (e.g., vulnerable households) that leads to the comovement ofremittances and child labor and introduce a positive bias. Empirical studies provide evidence forboth a positive bias (Alcaraz et al., 2012; Acosta, 2011) and a negative bias (Bargain and Boutin,2015).
We address this problem by estimating an instrumental variable (IV) model. To identify thecausal impact of remittances, we leverage the sharp unemployment shocks experienced by anumber of Colombia’s main migration destination countries arising from the 2008 financial crisisin the United States and the Eurozone. The crisis led to an economic recession and a sharpincrease in unemployment in both the United States and Spain and reduced remittance flows intoColombia (Arango et al., 2015).15 We use the deviation from the average pre-crisis unemployment
13The inclusion of fixed effects in non-linear Tobit models can potentially introduce the incidental-parametersproblem that will bias estimates of the coefficients and the standard errors (Greene, 2004). However, this problem ariseswhen the length of the panel is fixed and small. With only 13 regions, this is not true for our region fixed effects.
14Basu and Van (1998, p. 416) introduce the luxury axiom, to wit, “A family will send the children to the labormarket only if the family’s income from non-child-labor sources drops very low". However, in the context of ruralPakistan and Ghana, Bhalotra (2003) show that child labor was higher among households with more productive assets,creating a “wealth paradox”. In the Colombian context, even though we observe a higher rate of child labor amongpoor households, these rates do not decrease monotonically by income levels. In particular, it is common to findhouseholds with family business using child labor across income quartiles (Bernal and Cárdenas, 2006).
15Between November of 2007 and June 2009, the United States economy contracted by 5 percentage points and once
10
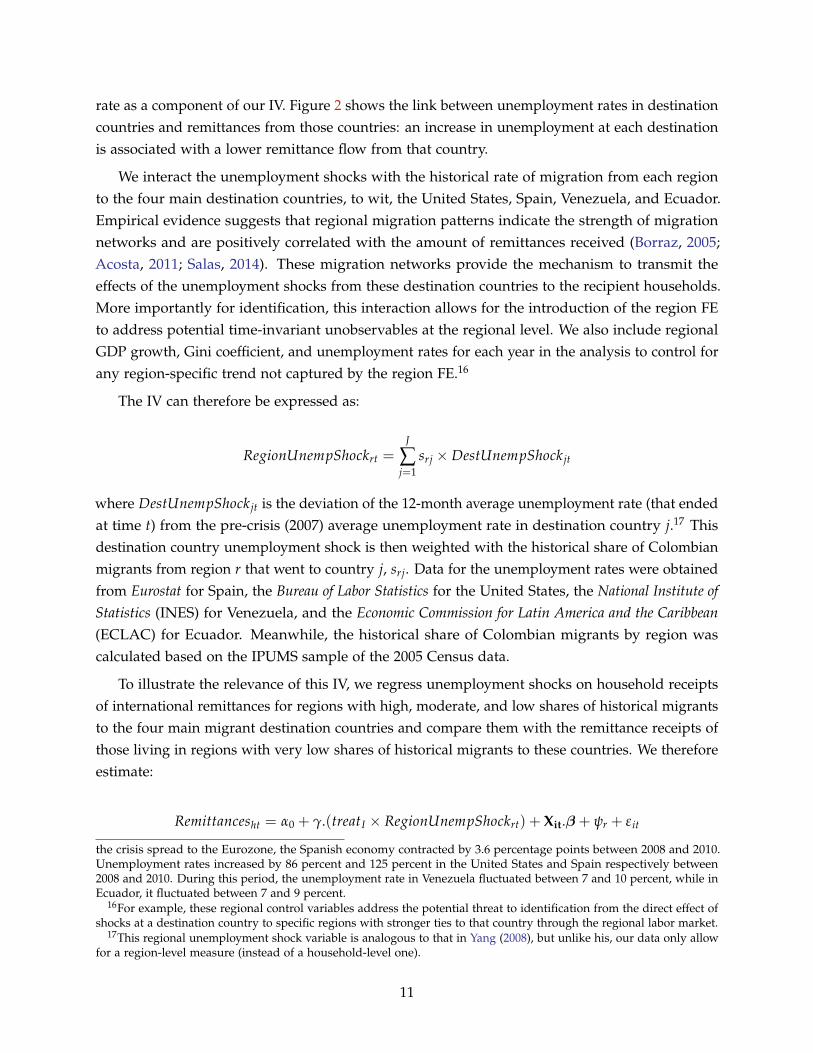
rate as a component of our IV. Figure 2 shows the link between unemployment rates in destinationcountries and remittances from those countries: an increase in unemployment at each destinationis associated with a lower remittance flow from that country.
We interact the unemployment shocks with the historical rate of migration from each regionto the four main destination countries, to wit, the United States, Spain, Venezuela, and Ecuador.Empirical evidence suggests that regional migration patterns indicate the strength of migrationnetworks and are positively correlated with the amount of remittances received (Borraz, 2005;Acosta, 2011; Salas, 2014). These migration networks provide the mechanism to transmit theeffects of the unemployment shocks from these destination countries to the recipient households.More importantly for identification, this interaction allows for the introduction of the region FEto address potential time-invariant unobservables at the regional level. We also include regionalGDP growth, Gini coefficient, and unemployment rates for each year in the analysis to control forany region-specific trend not captured by the region FE.16
The IV can therefore be expressed as:
RegionUnempShockrt =J
∑j=1
srj × DestUnempShock jt
where DestUnempShock jt is the deviation of the 12-month average unemployment rate (that endedat time t) from the pre-crisis (2007) average unemployment rate in destination country j.17 Thisdestination country unemployment shock is then weighted with the historical share of Colombianmigrants from region r that went to country j, srj. Data for the unemployment rates were obtainedfrom Eurostat for Spain, the Bureau of Labor Statistics for the United States, the National Institute ofStatistics (INES) for Venezuela, and the Economic Commission for Latin America and the Caribbean(ECLAC) for Ecuador. Meanwhile, the historical share of Colombian migrants by region wascalculated based on the IPUMS sample of the 2005 Census data.
To illustrate the relevance of this IV, we regress unemployment shocks on household receiptsof international remittances for regions with high, moderate, and low shares of historical migrantsto the four main migrant destination countries and compare them with the remittance receipts ofthose living in regions with very low shares of historical migrants to these countries. We thereforeestimate:
Remittancesht = α0 + γ.(treatI × RegionUnempShockrt) + Xit.β+ ψr + ε it
the crisis spread to the Eurozone, the Spanish economy contracted by 3.6 percentage points between 2008 and 2010.Unemployment rates increased by 86 percent and 125 percent in the United States and Spain respectively between2008 and 2010. During this period, the unemployment rate in Venezuela fluctuated between 7 and 10 percent, while inEcuador, it fluctuated between 7 and 9 percent.
16For example, these regional control variables address the potential threat to identification from the direct effect ofshocks at a destination country to specific regions with stronger ties to that country through the regional labor market.
17This regional unemployment shock variable is analogous to that in Yang (2008), but unlike his, our data only allowfor a region-level measure (instead of a household-level one).
11

where I ∈ (H, M, L) and H, M, and L respectively indicate regions with high, moderate, and lowshares of historical migrants – corresponding to regions at the top, second, and third quartiles ofhistorical migrant shares to these countries. They are compared with those in the fourth quartile,which have less than 4 percent migrant share to these countries. ψr indicates the region FE. Aswe show in Table 3, the shocks are correlated with remittances in regions with high shares ofhistorical migrants.
Our identification relies on the assumption that first, these destination-country unemploymentshocks were unexpected for Colombian households, and second, conditional on the set of controls,they affect household-level outcomes only through remittances. For the former, the main concern isthat given sufficient time, households would employ multiple strategies to adjust to the unexpecteddecline in the remittance amount (Yang, 2008; Arango et al., 2015). To limit the impact of themedium- and long-term endogenous adjustments at the household level, we focus our analysis onthe 2008–2010 period.18 Meanwhile, for the latter, Section 5.3 discusses potential direct channelsfrom these shocks to household-level outcomes that might remain conditional on the controlvariables, and shows that our results are not affected by them.
Therefore, for our preferred specification, we use the IV to estimate a two-stage least square(2SLS) LPM and an IV-Tobit model of participation and working hours respectively. For the latter,the IV-Tobit is estimated using the Newey (1987) two-step estimator. With an IV that introducesboth regional and temporal exogenous variations, we control for the potential effects of anytime-invariant unobserved region characteristic using the region FE. As described above, we alsocontrol for potential child- and household-level confounders, as well as time-varying regionalcontrols. We cluster our standard errors at the level of the interaction between region and the(interview) month-year in all estimates.19
5 Do Remittances Reduce Child Labor or Increase Schooling?
This section presents our baseline results. First, we show the impact of remittances on childlabor at both the extensive and intensive margins. We then report the impact of remittanceson schooling. Finally, we briefly discuss the robustness of our estimates to potential threats toidentification.
18Arguably, we would have liked to include data from 2007 to capture the pre-crisis economic decline in the UnitedStates and Spain. However, some researchers expressed concerns that there may be issues with the income modulefrom the 2007 wave (see IICA, 2014, p.25). We therefore exclude the 2007 wave from our main analysis, even thoughincluding it does not qualitatively affect our results. These additional results are available upon request.
19With an instrument that is constructed at the region level, the natural choice would be to cluster the standarderrors at that level. However, with only 13 regions, the concern is that standard cluster-robust estimates of the variancematrix can be downward-biased (Cameron and Miller, 2015). Indeed, we find in our case that the estimates of standarderrors that are clustered at the household level are more conservative than those clustered at the region level.
12

5.1 Remittances and Child Labor
Standard neoclassical labor model provides the predictions for our results. Remittances sup-plement households’ non-labor income and relax household budget constraints. The incomeeffect leads to a reduction in household labor supply. If the household head is the sole arbiter ofchildren’s labor market participation decision and poor households only send children to work outof necessity, relaxing the household budget constraint would reduce child labor. The reductionscan happen at the intensive margin (working hours) or extensive margin (participation). Ourbaseline results provide support for these predictions.
Table 4 reports our results for the impact of remittances on child labor. We will first focuson Columns 1 and 2 which report extensive margin estimates. Panel A reports the standard,non-instrumented LPM estimates. Column 1 reports estimates with the region FE, while Column2 adds the child, household, and region characteristics as control variables. The estimates arestatistically significant and indicate a negative relationship between remittances and child labor.
The first-stage estimates reported in Panel C in Table 4 provide evidence for the validityand relevance of our IV. As expected, all columns indicate a negative correlation between theinstrument and the remittances: an unemployment shock (i.e., a negative employment shock) onmigrants’ destination is associated with receiving fewer remittances as expected. Moreover, witha first-stage Kleibergen-Papp F-statistic of 10.3 for our preferred specification, our estimates areunlikely to be biased by a weak instrument. Nonetheless, we also report here (as in the subsequenttables) the Anderson-Rubin (AR) 90-percent confidence interval as a test for the robustness of ourestimates in the presence of a weak instrument (Dufour and Taamouti, 2005).20
The 2SLS estimates, reported in Columns 1–2 of Panel B, show that remittances reducechildren’s likelihood of working. Comparisons of the LPM and 2SLS estimates suggest a positiveomitted variable bias. Column 2 reports the results from our preferred specification with the fullset of controls. We find that a US$1 increase in remittances decreases the incidence of child laborby 0.022 p.p. This suggests that a 10-percent increase at the mean remittance value of US$ 3,728leads to an 8.2 p.p. reduction in the probability of child labor.21
Columns 3 and 4 of Table 4 report the marginal effects of remittance on children’s workinghours. Panel A reports the non-instrumented Tobit estimates. Consistent with theory, we findnegative and statistically significant associations between remittances and hours worked bychildren. Panel B shows that, as in the case of the extensive margin, instrumenting increases themagnitudes of the estimates. However, in this case, the IV estimates are not statistically significant.
20Dufour and Taamouti (2005) show that the confidence region reported by the AR confidence interval is robust tothe presence of weak instruments and seems to have the correct size under a wide variety of violations of the standardassumptions of an IV regression.
21The magnitude of this effect on child labor is smaller compared to the effect estimated in Calero et al. (2009) forEcuador. However, in their study, the effect of remittances on child labor is not statistically significant.
13

5.2 Remittances and Schooling
In many developing countries, one of the main opportunity costs from going to school is thelabor market return (Rosenzweig, 1990). By reducing labor market participation, remittance cantheoretically increase school attendance, in particular if school attendance and work are substitutes.There is evidence from some other countries in Latin America that remittances can also increaseschooling (Calero et al., 2009; Amuedo-Dorantes and Pozo, 2010; Alcaraz et al., 2012), althoughthe effect is by no means universal (see e.g., Acosta, 2011).
We do not find evidence that remittances increase schooling in Colombia. GEIH collects schoolattendance information from the children of the households. Columns 5 and 6 of Panel A inTable 4 report standard LPM estimates of school attendance without and with the control variables.Despite the positive and statistically-significant correlation between remittance and schooling inColumn 5, the correlation disappears with the full set of controls in Column 6. Our IV estimatesin Panel B also cannot reject the null hypothesis of a zero coefficient.22
This result highlights two policy-relevant insights. First, it provides additional evidence forthe imperfect substitutability of child labor and schooling in response to transfers. Ravallion andWodon (2000) show that targeted education subsidies in rural Bangladesh only had a very smallimpact in reducing child labor. Similarly, Attanasio et al. (2010) show that while the CCT Familiasen Acción increases school enrollment in Colombia, its (indirect) impact on reducing children’smarket work is very limited. Our evidence complements theirs by showing no indirect impact inthe other direction, to wit, through market work to schooling. These results are also consistentwith the fact that in Colombia, a large share of working children also attend school (see Table 1).
Second, it shows that the mechanisms through which remittances influence the welfare ofchildren left behind are heterogeneous even among relatively similar countries in Latin America.On the one hand, our finding contrasts with that of Calero et al. (2009), who found a statisticallysignificant effect of remittances on school attendance, but not on child labor in Ecuador (whichborders with Colombia). On the other hand, Acosta (2011) similarly finds that remittance does notaffect schooling in El Salvador.
5.3 Threats to Identification
Identification in our empirical strategy relies on the assumption that unemployment shocks affectchild labor through its effects on remittances. By controlling for regional GDP growth, Ginicoefficient, and unemployment, we address potential direct or general equilibrium effects fromthese shocks to the regional economies. However, the exclusion restriction may be violated ifdestination-country shocks have direct economic impacts on households through channels otherthan remittances or the regional economic environment. In this section, we address two potential
22Heterogeneous analysis by gender and age groups yield similar non-rejections of the null hypothesis. Results areavailable upon request.
14

channels, to wit, direct household-level economic relationship to destination countries throughtrade and selective return migration.
Share of Export-Related Income. — Remittance-receiving households may be directly affected bydestination-country shocks if they receive a large share of income from sectors in which the regionhas significant trading relations with destination countries. For these households, destination-country shocks affect child labor above and beyond their effects on remittance inflows and theregional economy. For instance, suppose a household’s main income share comes from agricultureand it resides in a region with a significant agricultural export to Spain. A large enough shock toSpain can affect the household through its direct impact on the household members’ income.
To address this issue, we show that our result is robust to the inclusion of the share of thehousehold’s labor income from activities related to the region’s main exports.23 Column 2 ofTable 5 shows that including this variable hardly affects our extensive margin estimate. Althoughthis variable may be affected by remittances — which, from an identification perspective, makes ita “bad control” (Angrist and Pischke, 2009) — the robustness of our results to its inclusion shouldmitigate concerns about the potential bias from this channel.
Differential Return-Migration Patterns. — Selective return migration in response to destination-country shocks may change the composition of adults in the remittance-receiving households,which can affect child labor directly instead of through remittances: if shocks induce returnmigration, the returning adults migrants can be substitutes for child labor. However, usinga difference-in-differences (DD) estimator and employing family size as the outcome variable,Arango et al. (2015) show that the Great Recession did not lead to return migration to Colombiaduring the 2006–2011 period. Employing a similar DD strategy with the household share of adultsas the outcome variable, we came to a similar conclusion.24
We further check the robustness of our results by including the share of adults in the householdas a control variable (along with the household size that is part of the baseline specification).Column 3 of Table 5 presents our result. We find that the coefficient on remittances is robust tothe inclusion of this variable. As before, even though this variable is plausibly endogenous and
23To construct the share of export-related income, we use information on each region’s main export sectors that arecoded based on the 2-digit International Standard Industrial Classification (ISIC). Since GEIH coded each individual’ssector of employment using ISIC, we can therefore calculate for each household the share of its labor income thatcomes from these sectors.
24Arango et al. (2015) use unemployment shocks in the US and Spain as the treatment intensity variables. Thesevariables are interacted with an indicator variable of whether the household resides in a region with either a high ormedium-high share of historical migrants. We use a similar approach, but use (i) our weighted unemployment shockas the treatment intensity variable; and (ii) an indicator of whether the household resides in a region that historicallyhas an above-median share of migrants. We estimate:
Yirt = α1 + α2.RegionUnempShockrt + α3.HighRegionr + γ.(RegionUnempShockrt × HighRegionr)
+ Xitβ + ψr + µit
where Xit and ψr are the control variables and region FE respectively. Our DD estimate γ, like theirs, is not statisticallysignificant.
15
therefore a bad control, the robustness of our result to its inclusion (along with the aforementionedDD estimates) should mitigate concerns over the potential bias from selective migration. Finally,Column 4 shows the robustness of our estimate to controlling for both channels.
6 Heterogeneous Impacts: Demographic and Economic Factors
In this section, we study the heterogeneous impact of remittances by demographic and economicfactors. We estimate the impacts by subgroup and compare between them. In making comparisons,we consider not only the coefficient estimate (which captures the percentage-point impact), butalso its magnitude relative to the mean participation rate in that subgroup (i.e., the percent-changeimpact). For two subgroups with an identical percentage-point impact, the subgroup with asmaller mean participation rate will experience a larger percent-change impact. We explore theseheterogeneous effects by gender, age, and wealth to unravel interesting patterns that shed light onhow these factors interact to influence children’s reservation wages.
6.1 Demographic Heterogeneity: Age and Gender
Economic and institutional factors can lead to the heterogeneous treatment impacts by age andgender. The minimum working age law, for instance, reflects policymakers’ (and to a certainextent, parents’) higher valuation of younger children’s home time, increasing their reservationwages relative to older children. Moreover, higher labor market returns for older children will alsoincrease the relative reservation wage of younger children. On the other hand, with participationthat increases in age, there is a greater margin for improvement among older children. In terms ofgender, traditional gender roles in economic activities imply that children’s reservation wagesmay also differ by gender (Edmonds, 2007).
Table 6 presents the results of our analysis of the treatment effects that are disaggregated byage and gender. Panel A examines the heterogeneous impacts by age groups and by gender, whilePanel B further disaggregates the sample to examine how these factors interact. At the bottomof each panel, we include the statistics on the children’s participation rate for each subgroup tobenchmark its parameter estimate.
Age Effects. — We use the legal minimum working age of 15 years old to divide the sample intotwo age groups. The first group are children aged 12–14 years old who are not allowed to work,except under very restrictive circumstances. The second group, to wit, those between 15–18 yearsold, are allowed to work with much fewer restrictions.
Columns 1–2 of Table 6 report the heterogeneous treatment effects by age groups. The pointestimate for the older cohort is larger than that for the younger cohort: in terms of percentage-point impact, the magnitude for the older cohort is close to two-and-a-half times larger than thatfor the younger cohort. This result appears counterintuitive, given parental and governmental
16
preference to keep younger children out of the labor market. However, note that the share of theolder cohort who work is more than three-and-a-half times that of the younger cohort (16.9 v. 4.8percent). As such, although the percentage-point impact of remittances on child labor is larger forthe older cohort, its percent-change impact is actually smaller.
This finding is consistent with the interpretation of a higher reservation wage assigned byparents and policymakers to younger children. It is also consistent with the existing literaturethat remittances tend to reduce child labor among younger children (Acosta, 2011; Bargain andBoutin, 2015). Our finding contrasts with the evidence on the impact of conditional cash transferson child labor, which finds little age-differential impact (De Hoop and Rosati, 2014).
Gender Effects. — Columns 3–4 of Table 6 report the effects of remittances by gender. They showthat the impact on the likelihood of participation in the labor force is stronger for girls than boys.The point estimate (or the percentage-point impact) for girls is almost double that for boys andits impact on the percent change is even larger given the lower likelihood of working girls (9.4percent) compared to boys (14.1 percent). The impact on boys is imprecisely estimated. Theseestimates are unlikely driven by biases from weak instruments given the reasonably strong firststage and their robustness under weak instruments.
Panel B1 examines whether these gender-differential impacts also differ by age groups. Co-lumns 5–6 report the results among the younger cohort. We find no gender-differential percentage-point impact. Since girls in this cohort are less likely to do market work, the coefficient similaritytranslates into a slightly larger percent-change impact for girls. However, we find a starkerdifference among older cohorts in Columns 7–8. The coefficient estimates are much larger forgirls, despite their lower likelihood of working. However, with a relatively weak instrument forboys in the older cohort, we need to interpret this result with caution.
A number of factors may explain why remittances lead a greater labor market exit for girls.First, there is a greater social acceptability of market work for boys compared to girls in LatinAmerica (Brown et al., 2003; Duryea and Arends-Kuenning, 2003). The idea that boys are expectedto work more than girls would increase the reservation wage for girls and may explain thisgender-differential impact. Second, all else the same, the gender wage gap, especially amonglow-skilled workers, will further exacerbate the gender differentials among the older cohort(Angel-Urdinola and Wodon, 2006).
However, this gender-differentiated impact does not necessarily imply larger welfare gains forgirls, if in response to market-work exit, households simply reallocate household works to girls.We find suggestive evidence that this is indeed the case. Panel B2 examines the question usingparticipation in household work as the outcome. We find that remittances increase the likelihoodof participation in household chores across all age and gender subgroups. However, it is worthnoting that unlike the case for boys, the percentage-point increases in participation in householdchores for girls in both age groups exceed the reductions in their labor market participation.Without time-use data to track detailed changes in hours worked (in market and household work),
17
it is nonetheless difficult to establish the heterogeneous welfare impacts of remittances.
6.2 Wealth Heterogeneity
The households’ economic status will also determine children’s reservation wage. Children workwhen the market wage is higher than their reservation wage. For poor households, remittancesmay not be enough to offset their children’s income. With higher reservation wages among richerhouseholds, the negative effect of remittances on the children-labor supply of richer householdswill be larger. This is more likely to hold among older children, whose income usually comprisesa larger share of the household income.
To study the role of household economic status, we use the constructed wealth index to splitthe sample into poor and non-poor households. We define as poor (non-poor) households whosewealth index is below (above) the median wealth index. Columns 1 and 2 in Table 7 examine theheterogeneous impacts of remittances between poor and non-poor households. The statistics onthe share of working children suggests that those in poor households are more likely to workcompared to those in non-poor households (14.1 v. 9 percent).
We find that the impact of remittances on the children’s likelihood of working is negative forboth household types. Remittances have larger impacts on poor households, both in terms ofpercentage-point and percent decline. However, the impact is only precisely estimated for childrenin non-poor households. The instruments are weaker for the subsample of poor households,although the AR tests suggest these results are robust to the presence of weak instruments.
Further disaggregating by age groups clarifies the underlying mechanism behind both wealth-and age-heterogeneity results. Columns 3–4 present the results for the younger cohort by economicstatus. We find evidence for the luxury axiom. First, the mean values of the outcomes in Columns3 and 4 show that poor households are twice more likely to send younger children who are belowthe legal working age to work. Second, the percentage-point impact of remittances on youngerchildren in poor households is more than four times that in non-poor households. Even accountingfor the higher likelihood of working among children in poor households, the percent-changeimpact of remittances is still larger among poor households.
These results also help explain the imprecise estimates for the subsample of poor households.Columns 5–6 present the results for the older cohort by economic status. Column 5 shows that theIV has very little relevance in explaining the remittances received by poor households with oldercohort, which explains the imprecise overall estimates for poor households. In contrast, Column 6shows that for the older cohort in non-poor households (whose reservation wages are likely to behigher), the effect is economically and statistically significant.
18
7 Remittances and Adult Labor Supply
Income transfers can create a general disincentive to work. From a policy perspective, this is acentral concern in the design of (publicly-funded) anti-poverty transfer programs. Developed-country evidence suggests that transfer programs can negatively affect labor supply (Moffitt, 2002),although randomized-controlled trial (RCT) evidence from developing countries shows otherwise(Banerjee et al., 2017; Alzúa et al., 2013). This section investigates this concern for private transferslike remittances by examining their relative impact on the labor supply of children and adults.
We find that remittances lead to a smaller percent decline in adult labor supply comparedto children (despite the larger percentage-point impact). Columns 2–6 of Table 8 present 2SLSestimates for adults (who are relatives of the household head) living in the same households asour estimating sample of children.25 Column 2 shows a percentage-point impact among adultsthat is almost twice that of children. However, since adults are almost six times more likely toparticipate in the labor market, this implies a smaller percent-change impact among adults.
Furthermore, we also find that among adults, remittances primarily reduce female laborsupply. Column 3 essentially shows no impact of remittances on male labor supply, while Column4 shows a statistically significant negative impact on female labor supply. Based on the AR 90-percent confidence intervals, these results are robust to the potential bias from weak instruments.These results are consistent with global evidence of reductions in female labor participation inresponse to remittances or emigration of a male household member (see, e.g., Amuedo-Dorantesand Pozo, 2006; Lokshin and Glinskaya, 2009; Mendola and Carletto, 2012). We also observenegative impacts both in below- and above-median-wealth-index households (Columns 5 and 6respectively), although inferences on the former may suffer from a weak instrument.
It is important to note, however, that the reduction in female labor supply may not be anundesirable outcome from the policy perspective. Parental time investment in children has beenshown to play a significant role in their outcome as adults (Haveman and Wolfe, 1995; Cunha et al.,2006; Del Boca et al., 2017). However, increased home time does not always lead to either greaterengagement with children or an improvement in the quality of their human capital. Furtherresearch, perhaps utilizing time-use information, can shed light on the ultimate impact of transferssuch as remittances on the quality of children’s human capital.
8 Conclusion
We provide new evidence on the causal impact of remittances on child labor and schooling inColombia. Using data on Colombia’s main metropolitan areas, we implemented an IV strategythat leverages the unemployment shocks in migrant destination countries. Our findings suggest
25We conducted a similar analysis of the full sample of adults, but are unable to make inferences given the very weakfirst-stage (F=0.26).
19

that remittances induce children to exit from market work, but have no impact on their schoolingparticipation. The impact is stronger for younger children and girls, although the stronger impactfor the latter is associated with a larger increase in household work. Among younger children,the impact is also stronger among households with below-median wealth index. Since parentalabsence from migration can increase pressure for children to work to compensate for lost income(Antman, 2012; Giannelli and Mangiavacchi, 2010), we show that remittances can mitigate thepotential negative impacts of migration on the welfare of children who are left behind.
Our findings also illustrate the potential complementarity of private and public transfers inimproving children outcomes. The Colombian government has introduced a number of CCTs tofoster human capital accumulation of poor households. A prominent example is Familias en Acción,whose largest component is a grant that is conditional on having children attend 80 percent ofschool classes. Attanasio et al. (2010) show that the program increases children’s enrollment rateand reduces their participation in domestic chores, but has no effect on their participation inmarket work, except among urban teens aged 14–17. We find the opposite for remittances. Atthe same time, in contrast to our finding of a work-disincentive effect of remittances on femaleadults, Barrientos and Villa (2015) found that the CCT has no negative effect on adult laborsupply. Further research is still needed to understand the impact of these intra-household timereallocations on children’s short- and long-term outcomes.
We propose two avenues for future research. First, there is the question of the role of intra-household bargaining as a mechanism that can help explain the heterogeneous results found inthis paper. The absence of a household member and the imperfect monitoring by migrating adultscan shift the intra-household allocation of resources (including the remittance income) amongthe household members left behind (Chen, 2006; Mendola and Carletto, 2012). Variations in thegender of the emigrating household members and their relationships with children left behindcan affect the welfare outcomes of these children. Second, it would be important to extend theanalysis in this paper to children living in hard-to-reach populations. This is particularly relevantfor a country like Colombia where internal conflicts have led many children to engage in some ofthe worst forms of child labor.
20

References
Acosta, Pablo, “Labor Supply, School Attendance, and Remittances from International Migration:the Case of El Salvador,” World Bank Policy Research Working Paper, 2006, (3903).
, “School Attendance, Child Labour, and Remittances from International Migration in ElSalvador,” Journal of Development Studies, June 2011, 47 (6), 913–936.
Alcaraz, Carlo, Daniel Chiquiar, and Alejandrina Salcedo, “Remittances, Schooling, and ChildLabor in Mexico,” Journal of Development Economics, January 2012, 97 (1), 156–165.
Altonji, Joseph G., Fumio Hayashi, and Laurence J. Kotlikoff, “Is the Extended Family Altruis-tically Linked? Direct Tests Using Micro Data,” The American Economic Review, 1992, 82 (5),1177–1198.
Alzúa, María Laura, Guillermo Cruces, and Laura Ripani, “Welfare Programs and Labor Supplyin Developing Countries: Experimental Evidence from Latin America,” Journal of PopulationEconomics, October 2013, 26 (4), 1255–1284.
Amuedo-Dorantes, Catalina and Susan Pozo, “Migration, Remittances, and Male and FemaleEmployment Patterns,” American Economic Review, April 2006, 96 (2), 222–226.
and , “Accounting for Remittance and Migration Effects on Children’s Schooling,” WorldDevelopment, December 2010, 38 (12), 1747–1759.
Angel-Urdinola, Diego F. and Quentin Wodon, “The Gender Wage Gap and Poverty in Colom-bia,” Labour, December 2006, 20 (4), 721–739.
Angrist, Joshua David and Jörn-Steffen Pischke, Mostly Harmless Econometrics: An Empiricist’sCompanion, Princeton: Princeton University Press, 2009.
Antman, Francisca M., “The Intergenerational Effects of Paternal Migration on Schooling andWork: What Can We Learn from Children’s Time Allocations?,” Journal of Development Economics,November 2011, 96 (2), 200–208.
, “Gender, Educational Attainment, and the Impact of Parental Migration on Children LeftBehind,” Journal of Population Economics, October 2012, 25 (4), 1187–1214.
Arango, Luis E., Dolores de la Mata, and Nataly Obando, “Echoes of the Crises in Spain andUS in the Colombian Labor Market: a Differences-in-Differences Approach,” SERIEs, November2015, 6 (4), 441–477.
Attanasio, Orazio, Emla Fitzsimons, Ana Gomez, Martha Isabel Gutiérrez, Costas Meghir, andAlice Mesnard, “Children’s Schooling and Work in the Presence of a Conditional Cash TransferProgram in Rural Colombia,” Economic Development and Cultural Change, January 2010, 58 (2),181–210.
21
Baland, Jean-Marie and James A. Robinson, “Is Child Labor Inefficient?,” Journal of PoliticalEconomy, August 2000, 108 (4), 663–679.
Banerjee, Abhijit V., Rema Hanna, Gabriel E. Kreindler, and Benjamin A. Olken, “Debunkingthe Stereotype of the Lazy Welfare Recipient: Evidence from Cash Transfer Programs,” TheWorld Bank Research Observer, August 2017, 32 (2), 155–184.
Bargain, Olivier and Delphine Boutin, “Remittance Effects on Child Labour: Evidence fromBurkina Faso,” The Journal of Development Studies, July 2015, 51 (7), 922–938.
Barrientos, Armando and Juan Miguel Villa, “Antipoverty Transfers and Labour Market Outco-mes: Regression Discontinuity Design Findings,” The Journal of Development Studies, September2015, 51 (9), 1224–1240.
Basu, Kaushik and Pham Hoang Van, “The Economics of Child Labor,” The American EconomicReview, 1998, 88 (3), 412–427.
Bernal, Raquel and Mauricio Cárdenas, “Trabajo Infantil en Colombia,” January 2006.
Bhalotra, S., “Child Farm Labor: The Wealth Paradox,” The World Bank Economic Review, December2003, 17 (2), 197–227.
Borraz, Fernando, “Assessing the Impact of Remittances on Schooling: the Mexican Experience,”Global Economy Journal, January 2005, 5 (1).
Brown, Drusilla K., Alan V. Deardorff, and Robert M. Stern, “Child Labor: Theory, Evidence,and Policy,” in Kaushik Basu, Henrik Horn, Lisa Romn, and Judith Shapiro, eds., InternationalLabor Standards, Oxford, UK: Blackwell Publishing Ltd, January 2003, pp. 194–247.
Calero, Carla, Arjun S. Bedi, and Robert Sparrow, “Remittances, Liquidity Constraints andHuman Capital Investments in Ecuador,” World Development, June 2009, 37 (6), 1143–1154.
Cameron, A. Colin and Douglas L. Miller, “A Practitioner’s Guide to Cluster-Robust Inference,”Journal of Human Resources, 2015, 50 (2), 317–372.
Chen, Joyce J, “Migration and Imperfect Monitoring: Implications for Intra-Household Allocation,”American Economic Review, April 2006, 96 (2), 227–231.
Cox, Donald and Marcel Fafchamps, “Chapter 58 Extended Family and Kinship Networks:Economic Insights and Evolutionary Directions,” in “Handbook of Development Economics,”Vol. 4, Elsevier, 2007, pp. 3711–3784.
Cunha, Flavio, James J. Heckman, Lance Lochner, and Dimitriy V. Masterov, “Chapter 12Interpreting the Evidence on Life Cycle Skill Formation,” in “Handbook of the Economics ofEducation,” Vol. 1, Elsevier, 2006, pp. 697–812.
22
De Hoop, J. and F. C. Rosati, “Cash Transfers and Child Labor,” The World Bank Research Observer,August 2014, 29 (2), 202–234.
Del Boca, Daniela, Chiara Monfardini, and Cheti Nicoletti, “Parental and Child Time Invest-ments and the Cognitive Development of Adolescents,” Journal of Labor Economics, April 2017,35 (2), 565–608.
Dimova, Ralitza, Gil S. Epstein, and Ira N. Gang, “Migration, Transfers and Child Labor,” Reviewof Development Economics, August 2015, 19 (3), 735–747.
Dufour, Jean-Marie and Mohamed Taamouti, “Projection-Based Statistical Inference in LinearStructural Models with Possibly Weak Instruments,” Econometrica, July 2005, 73 (4), 1351–1365.
Duryea, Suzanne and Mary Arends-Kuenning, “School Attendance, Child Labor and LocalLabor Market Fluctuations in Urban Brazil,” World Development, July 2003, 31 (7), 1165–1178.
Edmonds, Eric V., “Chapter 57 Child Labor,” in “Handbook of Development Economics,” Vol. 4,Elsevier, 2007, pp. 3607–3709.
Edmonds, Eric V and Nina Pavcnik, “Child Labor in the Global Economy,” Journal of EconomicPerspectives, February 2005, 19 (1), 199–220.
Emerson, Patrick M. and André Portela Souza, “Is Child Labor Harmful? The Impact of WorkingEarlier in Life on Adult Earnings,” Economic Development and Cultural Change, January 2011, 59(2), 345–385.
, Vladimir Ponczek, and André Portela Souza, “Child Labor and Learning,” Economic Develop-ment and Cultural Change, January 2017, 65 (2), 265–296.
Fiszbein, Ariel, Norbert Rüdiger Schady, and Francisco H. G. Ferreira, Conditional Cash Transfers:Reducing Present and Future Poverty A World Bank policy research report, Washington D.C: WorldBank, 2009.
Garay, Luis Jorge and Adriana Rodríguez, Estudio sobre migración internacional y remesas enColombia, 1 ed ed., Bogotá : [Geneva, Switzerlan]: Ministerio de Relaciones Exteriores deColombia ; Organización Internacional para las Migraciones (OIM), 2005. OCLC: ocm79434872.
Giannelli, Gianna Claudia and Lucia Mangiavacchi, “Children’s Schooling and Parental Migra-tion: Empirical Evidence on the ‘Left-behind’ Generation in Albania: Children’s Schooling andParental Migration,” LABOUR, December 2010, 24, 76–92.
Greene, William, “Fixed Effects and Bias Due to the Incidental Parameters Problem in the TobitModel,” Econometric Reviews, December 2004, 23 (2), 125–147.
Haveman, Robert and Barbara Wolfe, “The Determinants of Children’s Attainments: A Reviewof Methods and Findings,” Journal of Economic Literature, 1995, 33 (4), 1829–1878.
23

Herrera, Clemencia Ramírez and Laura Mendoza S., Perfil Migratorio de Colombia 2012: OIM -Colombia, Bogotá: Organización Internacional para las Migraciones, 2013.
, Marcela Zuluaga, and Clara Perilla, Perfil Migratorio de Colombia 2010: OIM - Colombia, Bogotá:Organización Internacional para las Migraciones, 2010.
IICA, Programa mundial de alimentos, Efectos del Aumento de los Precios Internacionales de losAlimentos y las Materias Primas Sobre los Ingresos Netos Agrícolas y la Seguridad Alimentaria enColombia, IICA Biblioteca Venezuela, 2014.
International Labour Office and ILO International Programme on the Elimination of ChildLabour, Marking Progress Against Child Labour: Global Estimates and Trends 2000-2012, Geneva:ILO, 2013.
International Programme on the Elimination of Child Labour (IPEC), Economic Vulnerability,Social Protection and the Fight Against Child Labour number 1. In ‘World report on child labour.’,Geneva: ILO, 2013.
Lokshin, Michael and Elena Glinskaya, “The Effect of Male Migration on Employment Patternsof Women in Nepal,” The World Bank Economic Review, January 2009, 23 (3), 481–507.
Mansuri, Ghazala, “Migration, School Attainment, and Child Labor: Evidence from RuralPakistan,” SSRN Scholarly Paper ID 923252, Social Science Research Network, Rochester, NYJune 2006.
McKenzie, David J., “Measuring Inequality with Asset Indicators,” Journal of Population Economics,June 2005, 18 (2), 229–260.
Mendola, Mariapia and Calogero Carletto, “Migration and Gender Differences in the HomeLabour Market: Evidence from Albania,” Labour Economics, December 2012, 19 (6), 870–880.
Ministerio de Educacion Nacional (MEN), “Deserción Escolar en Colom-bia,” http://colombiadigital.net/desercion-escolar/item/4086-deserci%C3%
B3n-escolar-en-colombia-factores-de-riesgo-por-regi%C3%B3n.html 2012.
Moffitt, Robert A., “Chapter 34 Welfare Programs and Labor Supply,” in “Handbook of PublicEconomics,” Vol. 4, Elsevier, 2002, pp. 2393–2430.
Newey, Whitney K., “Efficient Estimation of Limited Dependent Variable Models with Endoge-nous Explanatory Variables,” Journal of Econometrics, November 1987, 36 (3), 231–250.
Observatorio de Migraciones (ENMIR), “Encuesta Nacional 2008-2009 Resultados Generales deMigraciones Internacionales y Remesas,” http://www.observatoriodemigraciones.org 2009.
O’Donnell, Owen, Furio C. Rosati, and Eddy van Doorslaer, “Health Effects of Child Work:Evidence from Rural Vietnam,” Journal of Population Economics, September 2005, 18 (3), 437–467.
24

Pinzón-Rondón, Angela M., Sandra Hofferth, and Leonardo Briceño, “Children Working in theStreets of Colombian Cities: Different Pathways to the Street Lead to Different Populations,”Children and Youth Services Review, December 2008, 30 (12), 1417–1424.
Rapoport, Hillel and Frédéric Docquier, “Chapter 17 The Economics of Migrants’ Remittances,”in “Handbook of the Economics of Giving, Altruism and Reciprocity,” Vol. 2, Elsevier, 2006,pp. 1135–1198.
Ravallion, Martin and Quentin Wodon, “Does Child Labour Displace Schooling? Evidence onBehavioural Responses to an Enrollment Subsidy,” The Economic Journal, March 2000, 110 (462),158–175.
Rosenzweig, Mark R., “Population Growth and Human Capital Investments: Theory and Evi-dence,” Journal of Political Economy, October 1990, 98 (5, Part 2), S38–S70.
Salas, Vania B., “International Remittances and Human Capital Formation,” World Development,July 2014, 59, 224–237.
Texidó, Ezequiel and Jorge Gurrieri, Panorama Migratorio de América del Sur 2012: OIM, BuenosAires: Organización Internacional para las Migraciones, 2012.
Vyas, S. and L. Kumaranayake, “Constructing Socio-economic Status Indices: How to UsePrincipal Components Analysis,” Health Policy and Planning, August 2006, 21 (6), 459–468.
Wooldridge, Jeffrey M., Econometric Analysis of Cross Section and Panel Data, 2nd ed ed., Cambridge,Mass: MIT Press, 2010.
World Bank, “Datos Sobre Migracion y Remesas,” http://siteresources.worldbank.org/
INTPROSPECTS/Resources/334934-1110315015165/Factbook2011Spanish.pdf 2011.
, World Development Indicators, 1960–2015 2016.
Yang, Dean, “International Migration, Remittances and Household Investment: Evidence fromPhilippine Migrants’ Exchange Rate Shocks,” The Economic Journal, April 2008, 118 (528), 591–630.
, “Migrant Remittances,” Journal of Economic Perspectives, August 2011, 25 (3), 129–152.
25

Tables
Table 1: Descriptive Statistics of Working Children
All Boys GirlsChildren Aged [. . . ]
12-14 15-16 17-18(1) (2) (3) (4) (5) (6)
Economic ActivityWholesale and retail 0.284 0.261 0.321 0.380 0.292 0.252Hotels and restaurants 0.094 0.076 0.120 0.097 0.093 0.093Manufacturing 0.075 0.063 0.092 0.131 0.074 0.057Storage transportation and communication 0.070 0.055 0.091 0.098 0.071 0.060Other services 0.028 0.015 0.048 0.025 0.026 0.030Construction 0.055 0.089 0.003 0.019 0.054 0.067Domestic service 0.024 0.002 0.057 0.012 0.023 0.028Others 0.370 0.438 0.267 0.239 0.367 0.413
Hours worked 33.92 35.83 31.01 21.47 30.62 39.28Share attending school 0.50 0.46 0.56 0.84 0.60 0.35housework 0.06 0.03 0.11 0.03 0.05 0.07Observations 16926 10208 6718 2956 4409 9561
Notes: The sample includes children between 12-18 years old from GEIH, 2008-2010. We use the 2-digitInternational Standard Industrial Classification (ISIC) to classify the economic activities. We present the fivemost important economic sectors, in addition to the construction and domestic services sector. None of theomitted activities (aggregated as “Others”) accounts for more than five percent of working children.
26

Table 2: Descriptive Statistics
Recipient Non-recipient(1) (2)
Outcome variablesLabor market participation rate 0.106 0.118Hours worked 30.23 34.01School attendance rate 0.847 0.820Household-work participation rate 0.049 0.059
Children characteristicsAge 15.087 15.006Male 0.504 0.503Household head or spouse 0.014 0.015
Household head characteristicsFemale 0.557 0.365Married 0.337 0.361Years of education 8.657 7.948
Household characteristicsHousehold size 3.755 4.026Number of children 2.024 2.206Total remittances 3728 0.000Wealth index 1.811 1.497
Additional statisticsShare in bottom metro-areaincome quartile
0.044 0.304
Observations 4013 139642
Notes: The sample includes children between 12-18 years old from GEIH,2008-2010. Total amount of remittances in PPP-adjusted US dollar.
27

Table 3: Impact of Unemployment Shocks on Remittances
(1) (2) (3)
TreatH -0.121 -0.116(0.037)*** (0.039)***
TreatM 0.010 0.006(0.028) (0.028)
TreatL -0.009 -0.014(0.029) (0.032)
Observations 143655 109566 75022
Region FE Yes Yes YesChild characteristics Yes Yes YesHousehold characteristics Yes Yes YesRegion Variables Yes Yes YesObservations 143655 108552 64404
Notes: The sample includes children between 12-18 years old fromGEIH, 2008-2010. The individual and household controls inclu-ded are presented in Table 2. Regional controls include the Ginicoefficient, the unemployment rate, and the regional GDP gro-wth. Coefficients are reported with standard errors clustered at theregion-month-year level in parentheses. */**/*** denotes signifi-cance at the 10/5/1 percent level.
28
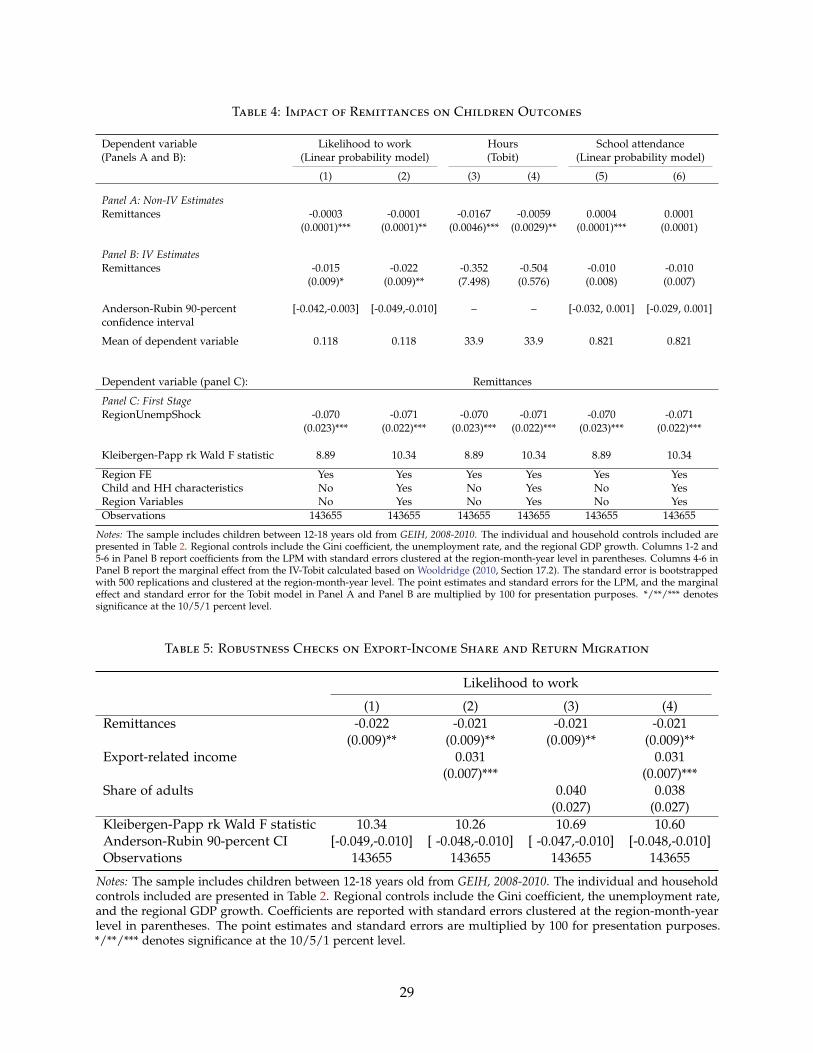
Table 4: Impact of Remittances on Children Outcomes
Dependent variable(Panels A and B):
Likelihood to work Hours School attendance(Linear probability model) (Tobit) (Linear probability model)
(1) (2) (3) (4) (5) (6)
Panel A: Non-IV EstimatesRemittances -0.0003 -0.0001 -0.0167 -0.0059 0.0004 0.0001
(0.0001)*** (0.0001)** (0.0046)*** (0.0029)** (0.0001)*** (0.0001)
Panel B: IV EstimatesRemittances -0.015 -0.022 -0.352 -0.504 -0.010 -0.010
(0.009)* (0.009)** (7.498) (0.576) (0.008) (0.007)
Anderson-Rubin 90-percentconfidence interval
[-0.042,-0.003] [-0.049,-0.010] – – [-0.032, 0.001] [-0.029, 0.001]
Mean of dependent variable 0.118 0.118 33.9 33.9 0.821 0.821
Dependent variable (panel C): Remittances
Panel C: First StageRegionUnempShock -0.070 -0.071 -0.070 -0.071 -0.070 -0.071
(0.023)*** (0.022)*** (0.023)*** (0.022)*** (0.023)*** (0.022)***
Kleibergen-Papp rk Wald F statistic 8.89 10.34 8.89 10.34 8.89 10.34
Region FE Yes Yes Yes Yes Yes YesChild and HH characteristics No Yes No Yes No YesRegion Variables No Yes No Yes No YesObservations 143655 143655 143655 143655 143655 143655
Notes: The sample includes children between 12-18 years old from GEIH, 2008-2010. The individual and household controls included arepresented in Table 2. Regional controls include the Gini coefficient, the unemployment rate, and the regional GDP growth. Columns 1-2 and5-6 in Panel B report coefficients from the LPM with standard errors clustered at the region-month-year level in parentheses. Columns 4-6 inPanel B report the marginal effect from the IV-Tobit calculated based on Wooldridge (2010, Section 17.2). The standard error is bootstrappedwith 500 replications and clustered at the region-month-year level. The point estimates and standard errors for the LPM, and the marginaleffect and standard error for the Tobit model in Panel A and Panel B are multiplied by 100 for presentation purposes. */**/*** denotessignificance at the 10/5/1 percent level.
Table 5: Robustness Checks on Export-Income Share and Return Migration
Likelihood to work
(1) (2) (3) (4)Remittances -0.022 -0.021 -0.021 -0.021
(0.009)** (0.009)** (0.009)** (0.009)**Export-related income 0.031 0.031
(0.007)*** (0.007)***Share of adults 0.040 0.038
(0.027) (0.027)Kleibergen-Papp rk Wald F statistic 10.34 10.26 10.69 10.60Anderson-Rubin 90-percent CI [-0.049,-0.010] [ -0.048,-0.010] [ -0.047,-0.010] [-0.048,-0.010]Observations 143655 143655 143655 143655
Notes: The sample includes children between 12-18 years old from GEIH, 2008-2010. The individual and householdcontrols included are presented in Table 2. Regional controls include the Gini coefficient, the unemployment rate,and the regional GDP growth. Coefficients are reported with standard errors clustered at the region-month-yearlevel in parentheses. The point estimates and standard errors are multiplied by 100 for presentation purposes.*/**/*** denotes significance at the 10/5/1 percent level.
29

Table 6: Heterogeneous Treatment Effect of Remittances By Age and Gender
Children Aged [. . . ]Boys Girls
12-14 15-18(1) (2) (3) (4)
Panel A. Dependent variable: Labor market participation
Remittances -0.014 -0.034 -0.016 -0.028(0.007)* (0.017)** (0.011) (0.013)**
Kleibergen-Papp rk Wald F statistic 9.34 5.64 8.57 6.14Anderson-Rubin 90-percent CI [-0.035,-0.005] [ -0.091 ,-0.0150] [-0.047,-0.002] [ -0.070 ,-0.014]Observations 61141 82514 72290 71365Labor market participation rate 0.048 0.169 0.141 0.094
Children Aged 12-14 Children Aged 15-18
Boys Girls Boys Girls(5) (6) (7) (8)
Panel B1. Dependent variable: Labor market participation
Remittances -0.014 -0.013 -0.026 -0.039(0.008)* (0.010) (0.024) (0.018)**
Anderson-Rubin 90-percent CI [ -0.041 ,-0.004] [ -0.046 ,-0.002] [ -0.106 , 0.014] [ -0.097 ,-0.020]Labor market participation rate 0.055 0.041 0.207 0.132
Panel B2. Dependent variable: Household-work participation
Remittances 0.008 0.017 0.017 0.047(0.005)* (0.010)* (0.016) (0.023)**
Anderson-Rubin 90-percent CI [ 0.002, 0.023 ] [ 0.006, 0.050 ] [ 0.001, 0.069 ] [ 0.023, 0.122 ]Household-work participation rate 0.011 0.024 0.032 0.147
Kleibergen-Papp rk Wald F statistic 7.62 3.35 2.21 5.53Observations 31229 29912 41061 41453
Notes: The sample includes children between 12-18 years old from GEIH, 2008-2010. The individual and householdcontrols included are presented in Table 2. Regional controls include the Gini coefficient, the unemployment rate, andthe regional GDP growth. Coefficients are reported with standard errors clustered at the region-month-year level inparentheses. The point estimates and standard errors are multiplied by 100 for presentation purposes. */**/*** denotessignificance at the 10/5/1 percent level.
30
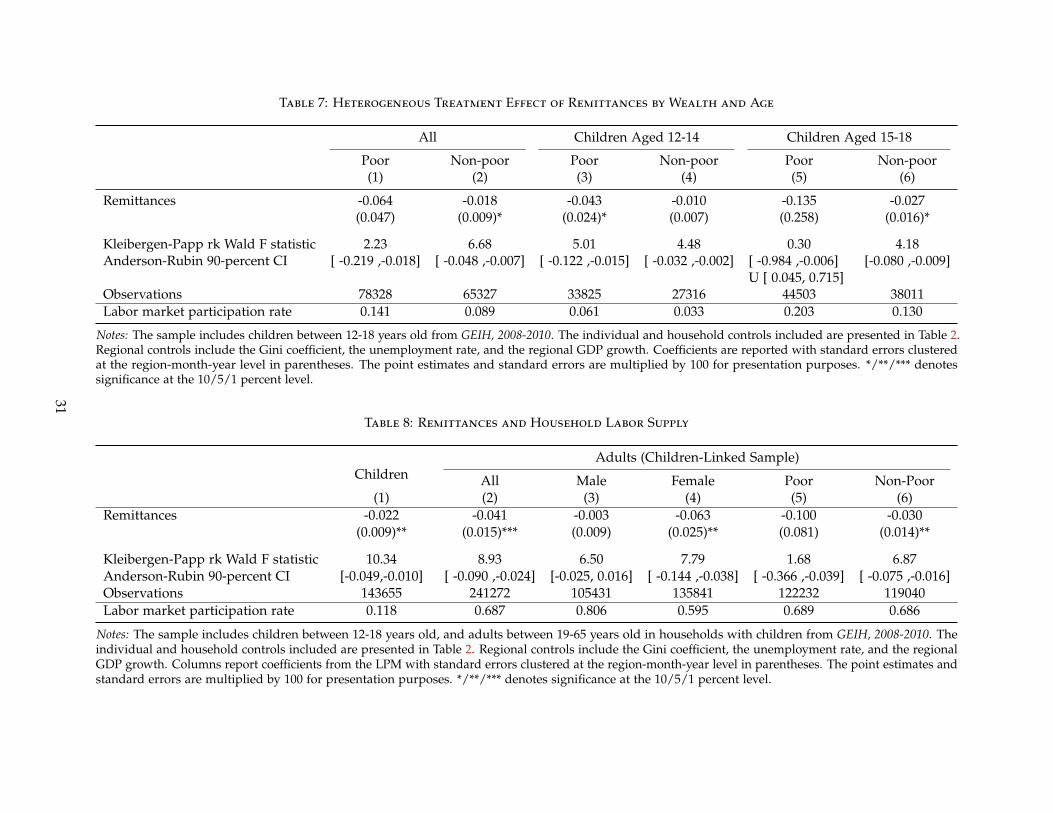
Table 7: Heterogeneous Treatment Effect of Remittances by Wealth and Age
All Children Aged 12-14 Children Aged 15-18
Poor Non-poor Poor Non-poor Poor Non-poor(1) (2) (3) (4) (5) (6)
Remittances -0.064 -0.018 -0.043 -0.010 -0.135 -0.027(0.047) (0.009)* (0.024)* (0.007) (0.258) (0.016)*
Kleibergen-Papp rk Wald F statistic 2.23 6.68 5.01 4.48 0.30 4.18Anderson-Rubin 90-percent CI [ -0.219 ,-0.018] [ -0.048 ,-0.007] [ -0.122 ,-0.015] [ -0.032 ,-0.002] [ -0.984 ,-0.006]
U [ 0.045, 0.715][-0.080 ,-0.009]
Observations 78328 65327 33825 27316 44503 38011Labor market participation rate 0.141 0.089 0.061 0.033 0.203 0.130
Notes: The sample includes children between 12-18 years old from GEIH, 2008-2010. The individual and household controls included are presented in Table 2.Regional controls include the Gini coefficient, the unemployment rate, and the regional GDP growth. Coefficients are reported with standard errors clusteredat the region-month-year level in parentheses. The point estimates and standard errors are multiplied by 100 for presentation purposes. */**/*** denotessignificance at the 10/5/1 percent level.
Table 8: Remittances and Household Labor Supply
ChildrenAdults (Children-Linked Sample)
All Male Female Poor Non-Poor(1) (2) (3) (4) (5) (6)
Remittances -0.022 -0.041 -0.003 -0.063 -0.100 -0.030(0.009)** (0.015)*** (0.009) (0.025)** (0.081) (0.014)**
Kleibergen-Papp rk Wald F statistic 10.34 8.93 6.50 7.79 1.68 6.87Anderson-Rubin 90-percent CI [-0.049,-0.010] [ -0.090 ,-0.024] [-0.025, 0.016] [ -0.144 ,-0.038] [ -0.366 ,-0.039] [ -0.075 ,-0.016]Observations 143655 241272 105431 135841 122232 119040Labor market participation rate 0.118 0.687 0.806 0.595 0.689 0.686
Notes: The sample includes children between 12-18 years old, and adults between 19-65 years old in households with children from GEIH, 2008-2010. Theindividual and household controls included are presented in Table 2. Regional controls include the Gini coefficient, the unemployment rate, and the regionalGDP growth. Columns report coefficients from the LPM with standard errors clustered at the region-month-year level in parentheses. The point estimates andstandard errors are multiplied by 100 for presentation purposes. */**/*** denotes significance at the 10/5/1 percent level.
31
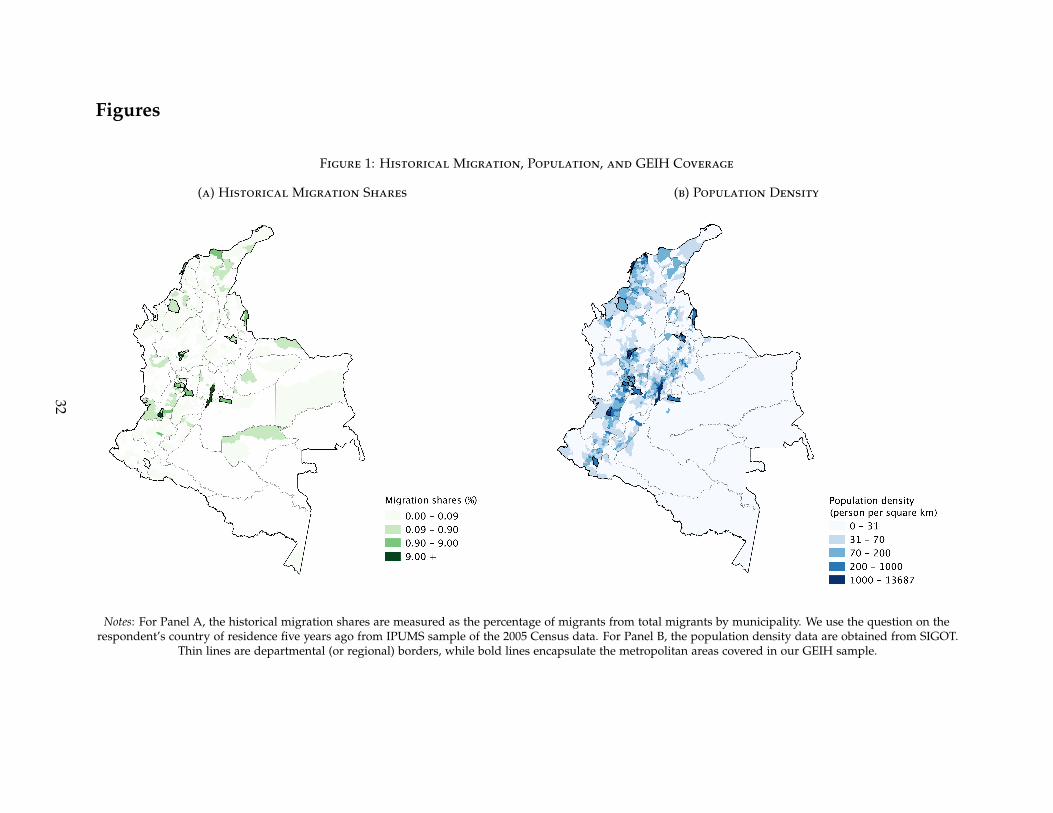
Figures
Figure 1: Historical Migration, Population, and GEIH Coverage
(a) Historical Migration Shares (b) Population Density
Notes: For Panel A, the historical migration shares are measured as the percentage of migrants from total migrants by municipality. We use the question on therespondent’s country of residence five years ago from IPUMS sample of the 2005 Census data. For Panel B, the population density data are obtained from SIGOT.
Thin lines are departmental (or regional) borders, while bold lines encapsulate the metropolitan areas covered in our GEIH sample.
32

Figure 2: Destination-Country Shocks and Remittance Inflow
(a) The United States
510
15
20
Unem
plo
ym
ent ra
te (
%)
0500
1000
1500
2000
Mill
ions o
f dolla
rs
2006m1 2007m7 2009m1 2010m7
Remittances Unemployment
(b) Spain
510
15
20
Unem
plo
ym
ent (%
)
0500
1000
1500
2000
Mill
ions o
f dolla
rs
2006m1 2007m7 2009m1 2010m7
Remittances Unemployment
(c) Venezuela5
10
15
20
Unem
plo
ym
ent (%
)
0100
200
300
400
500
Mill
ions o
f dolla
rs
2005m7 2006m7 2007m7 2008m7 2009m7 2010m7
Remittances Unemployment
(d) Ecuador
510
15
20
Unem
plo
ym
ent (%
)
0100
200
300
400
500
Mill
ions o
f dolla
rs
2005m7 2006m7 2007m7 2008m7 2009m7 2010m7
Remittances Unemployment
Notes: Remittance flows are obtained from the Colombian central bank, Banco de la República, and unemployment ratesare obtained from Eurostat for Spain, the Bureau of Labor Statistics for the United States, the National Institute ofStatistics (INES) for Venezuela, and the Economic Commission for Latin America and the Caribbean (ECLAC) for
Ecuador.
33

Appendix
Section A1 describes the principal component analysis and the list of variables used to constructthe wealth index. Section A2 reports additional tables mentioned in the paper.
A1 Wealth Index: Principal Component Analysis
Our wealth index is constructed based on a set of household assets using a principal componentanalysis (Vyas and Kumaranayake, 2006). In particular, given the vector of assets X, the firstprincipal component is the linear combination:
Y = a1x1 + a2x2 + · · ·+ anxn
where Y is our principal component index that proxies for household wealth, xn is a standardizedvariable with zero mean, and an are the coefficient estimates. The principal component reports anindex which assigns a larger weight to assets which vary most among households. Given that weuse dummy variables, the coefficients capture the effects of a change from zero to one in eachparticular asset on the wealth index. We use the variable Y as the index to classify householdsinto different socio-economic groups. Table A1 presents the full list of the variables that are usedas inputs to our wealth index and their respective weights.
A1-1
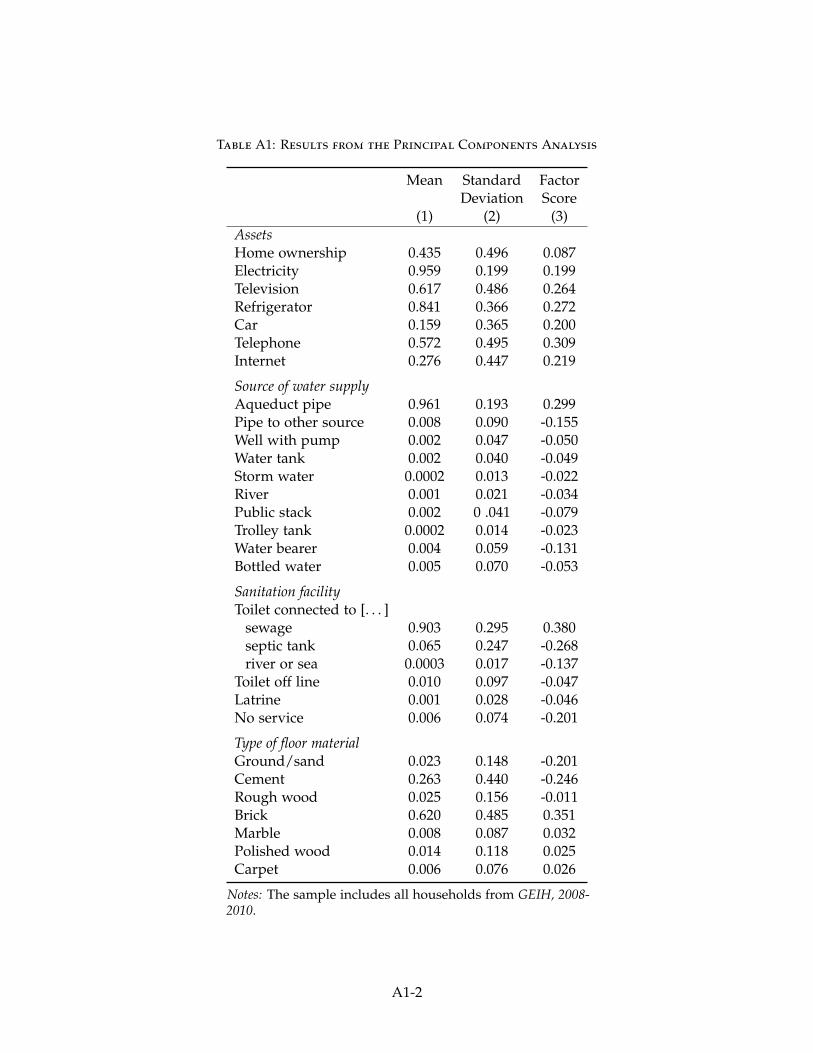
Table A1: Results from the Principal Components Analysis
Mean Standard FactorDeviation Score
(1) (2) (3)AssetsHome ownership 0.435 0.496 0.087Electricity 0.959 0.199 0.199Television 0.617 0.486 0.264Refrigerator 0.841 0.366 0.272Car 0.159 0.365 0.200Telephone 0.572 0.495 0.309Internet 0.276 0.447 0.219
Source of water supplyAqueduct pipe 0.961 0.193 0.299Pipe to other source 0.008 0.090 -0.155Well with pump 0.002 0.047 -0.050Water tank 0.002 0.040 -0.049Storm water 0.0002 0.013 -0.022River 0.001 0.021 -0.034Public stack 0.002 0 .041 -0.079Trolley tank 0.0002 0.014 -0.023Water bearer 0.004 0.059 -0.131Bottled water 0.005 0.070 -0.053
Sanitation facilityToilet connected to [. . . ]
sewage 0.903 0.295 0.380septic tank 0.065 0.247 -0.268river or sea 0.0003 0.017 -0.137
Toilet off line 0.010 0.097 -0.047Latrine 0.001 0.028 -0.046No service 0.006 0.074 -0.201
Type of floor materialGround/sand 0.023 0.148 -0.201Cement 0.263 0.440 -0.246Rough wood 0.025 0.156 -0.011Brick 0.620 0.485 0.351Marble 0.008 0.087 0.032Polished wood 0.014 0.118 0.025Carpet 0.006 0.076 0.026
Notes: The sample includes all households from GEIH, 2008-2010.
A1-2

A2 Additional Tables
Table A2: Share of Migrants by Region and Destination
TotalPopulation
Share of population who migrated to [. . . ]
Alldestinations
UnitedStates
Spain Venezuela Ecuador
(1) (2) (3) (4) (5) (6)
Pereira 572,860 18.70 7.98 7.64 2.30 0.78Cúcuta 663,270 16.23 0.00 0.22 16.01 0.00Cali 2,560,721 11.08 4.05 3.08 3.26 0.69Bucaramanga 915,531 9.04 1.19 0.71 6.81 0.32Bogotá 7,029,970 8.67 3.60 1.74 2.50 0.82Medellín 3,046,541 8.15 4.80 1.49 1.66 0.21Villavicencio 386,988 7.97 1.83 3.26 2.88 0.00Ibagué 431,005 5.80 1.66 0.69 3.45 0.00Barranquilla 1,523,223 4.83 1.24 0.63 2.93 0.02Cartagena 974,463 4.42 0.06 0.20 4.14 0.02Manizales 454,228 3.11 2.05 0.94 0.10 0.02Montería 522,382 1.54 0.32 0.12 1.09 0.00Pasto 347,655 0.15 0.00 0.00 0.15 0.00
Notes: We use the question on the respondent’s country of residence five years ago from IPUMS tocompute total number of migrants and construct the distribution of migrants by metropolitan area.We then use the distribution of migrants and the number of Colombian migrants in the United States,Spain, Venezuela, and Ecuador to construct the share of migrants. Data of Colombians migrants in theUS comes from the Pew Hispanic Research Center; in Spain from Ministerio de Empleo y Seguridad Socialde Espana; in Venezuela from Instituto Nacional de Estadística; and in Ecuador from Censo de Ecuador.
A2-3