Remediation of Petroleum Hydrocarbon- … of Petroleum Hydrocarbon- Contaminated Ground Water in the...
68
Remediation of Petroleum Hydrocarbon- Contaminated Ground Water in the Vicinity of a Jet-Fuel Tank Farm, Hanahan, South Carolina By Don A. Vroblesky, J. Frederick Robertson, Matthew D. Petkewich, Francis H. Chapelle, Paul M. Bradley, and James E. Landmeyer U.S. GEOLOGICAL SURVEY Water-Resources Investigations Report 96-4251 Prepared in cooperation with the U.S. DEPARTMENT OF DEFENSE, DEFENSE LOGISTICS AGENCY Columbia, South Carolina 1997
Transcript of Remediation of Petroleum Hydrocarbon- … of Petroleum Hydrocarbon- Contaminated Ground Water in the...

Remediation of Petroleum Hydrocarbon- Contaminated Ground Water in the Vicinity of a Jet-Fuel Tank Farm, Hanahan, South Carolina
By Don A. Vroblesky, J. Frederick Robertson, Matthew D. Petkewich, Francis H. Chapelle, Paul M. Bradley, and James E. Landmeyer
U.S. GEOLOGICAL SURVEY
Water-Resources Investigations Report 96-4251
Prepared in cooperation with the U.S. DEPARTMENT OF DEFENSE, DEFENSE LOGISTICS AGENCY
Columbia, South Carolina 1997

U.S. DEPARTMENT OF THE INTERIOR BRUCE BABBITT Secretary
U.S. GEOLOGICAL SURVEY
Gordon P. Eaton, Director
The use of firm, trade, and brand names in this report is for identification purposes only and does not constitute endorsement by the U.S. Government.
For additional information write to:
District Chief U.S. Geological Survey Stephenson Center-Suite 129 720 Gracern Road Columbia, SC 29210-7651
Copies of this report can be purchased from:
U.S. Geological Survey Branch of Information Services Box 25286 Denver, CO 80225-0286

CONTENTS
Abstract................................................................................................................................................................ 1
Introduction...............................................................................................^^ 1Purpose and Scope ...................................................................................................................................... 3Site History and Previous Investigations.................................................................................................... 3Description of Study Area........................................................................................................................... 5
Hydrogeology.................................................................................................................................... 5Ground-Water Contamination............................................................................................................ 8
Acknowledgments....................................................................................................................................... 11
Methods of Investigation...................................................................................................................................... 11Observation-Well Installation and Construction and Aquifer Testing........................................................ 11Water-Sample Collection and Analysis....................................................................................................... 12Water-Level Measurements......................................................................................................................... 15
Engineered-Remediation System Design and Operation..................................................................................... 15Bioremediation............................................................................................................................................ 15Hydraulic Remediation............................................................................................................................... 18
Hydrogeologic and Chemical Factors Affecting Contaminant Movement andRemediation at the Facility.............................................................................................................................. 19
Hydrogeologic Factors................................................................................................................................ 19Chemical Factors......................................................................................................................................... 22
Ground-Water Remediation in the Northern Part of the Facility......................................................................... 25Bioremediation............................................................................................................................................ 25
Laboratory Evidence.......................................................................................................................... 25Field Evidence ................................................................................................................................... 30
Hydraulic Remediation............................................................................................................................... 34
Ground-Water Remediation in Gold Cup Springs Subdivision........................................................................... 37Bioremediation............................................................................................................................................ 40
Laboratory Evidence.......................................................................................................................... 40Field Evidence ................................................................................................................................... 41
Hydraulic Remediation............................................................................................................................... 45
Conclusions...................................................................................................................................................^ 46
Selected References............................................................................................................................................. 48
Contents III

PLATE
1. Map showing locations of observation wells, surface-water sampling sites, and traces of hydrogeologic sections A-A' and B-B', Defense Fuel Supply Point, Hanahan, S.C. [in pocket]
FIGURES
1-3. Maps showing:1. Location of study area, and distribution of free-phase jet fuel and benzene,
Defense Fuel Supply Point, Hanahan, S.C.................................................................................. 22. Water table in the surficial aquifer at the Defense Fuel Supply Point,
Hanahan, S.C., during high ground-water levels, August 31, 1992 ........................................... 73. Water table in the surficial aquifer at the Defense Fuel Supply Point,
Hanahan, S.C., during low ground-water levels, January 2, 1992 ............................................. 9
4. Hydrogeologic section A-A', Defense Fuel Supply Point, Hanahan, S.C. ............................................. 10
5. Diagram showing hydraulic and bioremediation system, Defense Fuel Supply Point,Hanahan, S.C...................................................................................................................................... 16
6. Hydrogeologic section B-B' in tank 1 basin showing approximate location ofstratigraphically trapped free-phase fuel, Defense Fuel Supply Point, Hanahan, S.C....................... 21
7-11. Maps showing:7. Areal distribution of terminal electron-accepting processes, based on
interpretations of hydrogen measurements in ground water, Defense FuelSupply Point, Hanahan, S.C., June 1991 and November 1992 .................................................. 24
8. Distribution of combined benzene, toluene, ethylbenzene, and total xylenes in the shallow part of the surficial aquifer north of tank 3, Defense Fuel Supply Point, Hanahan, S.C., January 1992............................................................................................ 26
9. Distribution of combined benzene, toluene, ethylbenzene, and total xylenes in the shallow part of the surficial aquifer north of tank 3, Defense Fuel Supply Point, Hanahan, S.C., July to August 1995................................................................................. 27
10. Distribution of combined benzene, toluene, ethylbenzene, and total xylenesin the deep part of the surficial aquifer north of tank 3, Defense Fuel SupplyPoint, Hanahan, S.C., July 1992 ................................................................................................. 28
11. Distribution of combined benzene, toluene, ethylbenzene, and total xylenesin the deep part of the surficial aquifer north of tank 3, Defense Fuel SupplyPoint, Hanahan, S.C., July to August 1995................................................................................. 29
12-17. Graphs showing:12. Ground-water chemistry at well EW-11, Defense Fuel Supply Point,
Hanahan, S.C., 1993-94.............................................................................................................. 3113. Toluene, benzene, and total xylene concentrations in ground water at
well MW-12, Defense Fuel Supply Point, Hanahan, S.C., 1990-92........................................... 3314. Chloride and toluene concentrations and sulfate/chloride ratios at well
MW-12A, Defense Fuel Supply Point, Hanahan, S.C., 1992-93................................................ 34
IV Contents

15. Toluene concentrations at wells MWGS-33A and MWGS-32A, and specificconductance at well MWGS-33A, Defense Fuel Supply Point, Hanahan, S.C.,1993-94 ................................................. 35
16. Toluene, chloride, and dissolved oxygen concentrations, SO4/C1 ratios atwell MWGS-41A, and SO4/C1 ratios at infiltration-gallery 2, Defense Fuel SupplyPoint, Hanahan, S.C., 1993-95.................................................................................................... 36
17. Concentration of combined benzene, toluene, ethylbenzene, and total xylenes in ground water recovered from wells MW-07 and EW-02, Defense Fuel Supply Point, Hanahan, S.C., 1991-95.................................................................................................... 37
18. Map showing distribution of combined benzene, toluene, ethylbenzene, and totalxylenes in ground water north of tank 1, Defense Fuel Supply Point, Hanahan, S.C.,June to July 1992................................................................................................................................ 38
19. Map showing distribution of combined benzene, toluene, ethylbenzene, and totalxylenes in ground water north of tank 1, Defense Fuel Supply Point, Hanahan, S.C.,August 1995........................................................................................................................................ 39
20-23. Graphs showing:20. Benzene consumption in sediments under sulfate-reducing conditions
following initial feeding and subsequent refeedings, Defense Fuel SupplyPoint, Hanahan, S.C.................................................................................................................... 41
21. Changes in concentrations of ethylbenzene, toluene, total xylenes, and benzene at SW-12, the sampling point for the French drain collecting ground-water from the southeastern side of Valley Drive, Gold Cup Springs subdivision, Hanahan, S.C., 1992-95 .............................................................................................................. 43
22. Changes in concentrations of benzene, hydrogen, sulfate, and ferrous iron in ground water at well MW-04, Defense Fuel Supply Point, Hanahan, S.C., 1991-94 ...................................................................................................................................... 44
23. Benzene, ethylbenzene, total xylenes, and toluene in ground water at wellMWGS-22, Defense Fuel Supply Point, Hanahan, S.C., 1990-95 ............................................ 46
TABLES
1. Construction details for observation wells installed by the U. S. Geological Survey at theDefense Fuel Supply Point, Hanahan, S.C................................................................................................. 54
2. Construction details for privately owned wells and monitoring wells installed during previous investigations in the vicinity of the Defense Fuel Supply Point, Hanahan, S.C.............................................................................................................................................. 60
Contents

CONVERSION FACTORS, VERTICAL DATUM, AND ABBREVIATIONS
Multiply
inch (in.)foot (ft)
foot per foot (ft/ft)mile (mi)
foot squared per day (ft2/d)square mile (mi )
foot per day (ft/d)gallons per minute (gal/min)
gallons per day (gal/d)inches per year (in./yr)
gallon (gal)
By
Length25.4
0.30480.30481.609
Area0.092942.590
Flow0.30480.063080.003785
25.4Volume
3.785
To obtain
millimetermetermeter per meterkilometer
meter squared per daymeter squared per day
meter per dayliter per secondcubic meter per daymillimeters per year
liter
Temperature: In this report, temperature is given in degrees Celsius (°C), which can be converted to degrees Fahrenheit (°F) by the following equation:
°F = (9/5 x °C) + 32
Sea Level: In this report, "sea level" refers to the National Geodetic Vertical Datum of 1929~a geodetic datum derived from a general adjustment of the first-order level nets of the United States and Canada, formerly called Sea Level Datum of 1929.
Chemical concentration: In this report, chemical concentration in water is expressed in metric units as milligrams per liter (mg/L) or micrograms per liter (M,g/L).
Transmissivity: The standard unit for transmissiviry is cubic foot per day per square foot times foot of aquifer thickness [(ft3/d)/ft2] ft. In this report, the mathematically reduced form, foot squared per day (ft2/d), is used for convenience.
Biodegradation rate constant: In this report, first-order kinetics are used to describe the biodegradation rate of toluene. First-order rate constants (Ktol) are expressed in units of percent of compound degraded per day (pct/d). Because percent in dimensionless, this reduces to units of inverse days (d" 1 ).
Specific conductance is given in microsiemens per centimeter at 25 degrees Celsius (|iiS/cm at 25 °C).
Other units used in this report:gram gliter Lmicrograms |j,gmicromoles jiiMmicrometer jiimmicroliter \\Lmilligrams mgmilliliter mLmilliliter per minute mL/minmillimoles mMnanomoles nM
VI Contents

Abbreviations and acronyms used in this report:
bis14CH4
[2- 14C]-acetate
14CO2
CO2
BTEX
Cl
DFSC
DFSP
DIG
DO
Fe(III)
Fe(II)
GC
H2
H2O2
H2 S
ID
Isd
MCL
N
NO3
OD
PVC
SCDHEC
ssSO4
TEAP
TOC
TPH
USAEHA
USDOD
USEPA
USGS
below land surface
carbon-14 labeled methane
carbon-14 labeled acetate
carbon-14 labeled carbon dioxide
carbon dioxide
combined benzene, toluene, ethylbenzene, and total xylenes
chloride
Defense Fuel Supply Center
Defense Fuel Supply Point
dissolved inorganic carbon
dissolved oxygen
ferric iron
ferrous iron
gas chromatograph
dissolved hydrogen
hydrogen peroxide
hydrogen sulfide
inside diameter
land surface datum
maximum contaminant level
nitrogen
nitrate
outside diameter
poly vinyl chloride
South Carolina Department of Health and Environmental Control
stainless steel
sulfate
terminal electron-accepting process
total organic carbon
total petroleum hydrocarbons
U.S. Army Environmental Hygiene Agency
U.S. Department of Defense
U.S. Environmental Protection Agency
U.S. Geological Survey
Contents VII

Remediation of Petroleum Hydrocarbon-Contaminated Ground Water in the Vicinity of a Jet-Fuel Tank Farm, Hanahan, South CarolinaBy Don A. Vroblesky, J. Frederick Robertson, Matthew D. Petkewich, Francis H. Chapelle, Paul M. Bradley, and James E. Landmeyer
Abstract
Substantial decreases in petroleum-hydrocar bon concentrations in contaminated ground water at a tank farm in Hanahan, South Carolina, were observed during operation of an engineered hydraulic and biore- mediation system. For example, in the shallow part of the surficial aquifer north of tank 3 at wells MWGS- 32A and MWGS-33A, the combined concentrations of benzene, toluene, ethylbenzene, and total xylenes decreased from greater than 1,000 micrograms per liter prior to operation of the system to less than 100 micrograms per liter following operation. Ground- water contamination persisted in parts of the aquifer not affected by the infiltration-gallery water, such as in the deeper part of the surficial aquifer (about 16-30 feet below land surface) north of tank 3, and in source areas upgradient from the remediation system that continued to leach occasional hydrocarbon pulses to the aquifer. Laboratory and field evidence showed that reductions in contaminant concentrations were caused by engineered and natural bioremediation as well as hydraulic remediation.
The persistence of ground-water contamination north of tank 1 is caused by the presence of free-phase fuel stratigraphically trapped below the water table and isolated from the influence of recharge-gallery water. Investigation of the aquifer chemistry demon strated that inefficient microbial electron-accepting processes tend to dominate in zones contaminated with petroleum hydrocarbons. The system, however, could shift to more efficient electron-accepting pro cesses with the addition of more efficient electron acceptors, such as oxygen and nitrate.
INTRODUCTION
In October 1975, an estimated 83,000 gal of jet fuel (JP-4) leaked from tank 1 at the Defense Fuel Supply Point (DFSP), a military storage facility for jet fuel, hereafter referred to as the facility, in Hanahan, S.C. (U.S. Army Environ mental Hygiene Agency, 1975). The leak resulted in a plume of petroleum hydrocarbons in the ground water north of tank 1 (fig. 1). An addi tional plume of petroleum hydrocarbon-contami nated ground water subsequently was found north of tank 3.
In 1987, the U.S. Geological Survey (USGS), in cooperation with the U.S. Department of Defense (USDOD), Defense Logistics Agency, investigated the potential for bioremediation of the ground-water contamination. The project involved the operation and evaluation of an engi neered ground-water remediation system. The remediation system consisted of microbiological and hydraulic decontamination elements. As part of the study, the USGS extensively investigated the aquifer hydrogeology and geochemistry and used laboratory and field methods to investigate the site microbiology. Although the study area included the facility and surrounding areas, the investigation concentrated on the northern part of the facility and the ground-water-contamination plumes extending northward into Gold Cup Springs subdivision.
Introduction 1

D> D>
=[
3J
= 1
c 5
'=
0O
=> as 3
2.
0) ^ o_ (D
I I
O s I 6 O I 3. 5' CO I o a
EX
PL
AN
AT
ION
Dog
woo
d C
ourt
LIN
E O
F E
QU
AL
BE
NZE
NE
CO
NC
EN
TRA
TIO
N I
N T
HE
S
UR
FIC
IAL
AQ
UIF
ER
-Das
hed
whe
re in
ferr
ed.
Inte
rval
, in
m
icro
gram
s pe
r lit
er,
is v
aria
ble.
WE
LL, W
ELL
NU
MB
ER
, A
ND
BE
NZE
NE
CO
NC
EN
TRA
TIO
N O
R
CO
NC
EN
TRA
TIO
N R
AN
GE
, IN
MIC
RO
GR
AM
S P
ER
LIT
ER
-ln
ar
eas
of w
ell c
lust
ers,
onl
y th
e sa
mpl
e co
ntai
ning
the
hig
hest
be
nzen
e co
ncen
trat
ion
is s
how
n.
AP
PR
OX
IMA
TE A
RE
A O
F FR
EE
-PH
AS
E
FUE
L IN
TH
E S
UR
FIC
AL
AQ
UIF
ER
----
--
Col
lect
ion
Pipe
fo
r Fr
ench
Dra
in
Loca
ted
Dec
embe
r 19
93
Figu
re 1
. Lo
catio
n of
stu
dy a
rea,
and
dis
tribu
tion
of fr
ee-p
hase
jet f
uel (
July
199
2 no
rth o
f tan
k 1
and
Dec
embe
r 19
93 n
orth
of t
ank
3)
and
benz
ene
(Apr
il 19
93),
Def
ense
Fue
l Sup
ply
Poin
t, H
anah
an,
S.C
.

Purpose and Scope
The purpose of this report is to present the evaluation results of ground-water remediation in the study area. The investigation examined ground-water hydrology, chemistry, and microbi ology in the northern part of the facility and in parts of Gold Cup Springs subdivision, north of the facility.
To determine the effectiveness of the ground-water remediation system, many factors influencing the ground-water hydrology, chemis try, and microbiology were examined. This investigation included the installation of monitor ing wells; the collection of sediment samples for chemical and microbial evaluation, and lithologic description; the extensive collection of ground- water samples for chemical analysis; and the monthly collection of water-level data, as well as continuously recorded water-level data from two monitoring wells. Water-quality, water-level, and sediment data collected during this investigation for the period between December 1990 and Janu ary 1996 are presented in a separate report (Pet- kewich and others, in press). In addition, data obtained during previous investigations at the facility were collected, compiled, and evaluated to provide historical information regarding site conditions, as well as to provide useful informa tion to be integrated with data collected during this investigation.
Site History and Previous Investigations
The JP-4 leak from tank 1 at the facility occurred soon after the tank was filled on October 16, 1975. Losses of fuel were noted throughout the month, and on November 4, the tank was closed, and a leak was confirmed.
On November 13, 1975, Soil Consultants, Inc., drilled 12 boreholes in the vicinity of tank 1 to determine the areal extent and magnitude of the spill. The plume of subsurface fuel was at a depth of 7 to 12 ft below land surface (bis) (U.S. Army Environmental Hygiene Agency, 1975). The con tamination encompassed an area of 20,000 ft2 around the northern part of the storage tank and
was moving approximately 5 ft/d toward the northwest (U.S. Army Environmental Hygiene Agency, 1977).
During December 1975, the U.S. Army Environmental Hygiene Agency (USAEHA) recovered approximately 25 percent (20,750 gal) of the leaked fuel (U.S. Army Environmental Hygiene Agency, 1977). Initial fuel recovery (approximately 1,000 gal/d) was accomplished by pumping approximately 650 gal/min of combined fuel and water from 50 well points in the tank 1 basin to an oil/water separator. Most of the recov ery took place between December 4-7. The com bined water and jet-fuel recovery rapidly declined during the operation to about 30 to 50 gal/min (about 400 gal/d of fuel) because of pumpage- related water-level declines. After about 2 weeks of pumping, jet-fuel recovery further diminished, and the well points were removed. An interceptor trench, approximately 17-ft deep and encompass ing about 80 ft2 , was excavated north of tank 1 to allow venting of fuel vapors for approximately 1 month before the trench was refilled (U.S. Army Environmental Hygiene Agency, 1988).
The USAEHA (1977) constructed a second recovery system consisting of 40 well points in March 1976. A pumping rate of only 50 gal/min total flow was obtained from the new well points, and there was no measurable accumulation of fuel in the oil/water separator or in the pump dis charge. After about a month, pumping yield rates declined further, and the recovery effort was ter minated. Following an unusually heavy rainfall in September 1979, the residents of Gold Cup Springs subdivision began complaining of fuel odors. The following month, the South Carolina Department of Health and Environmental Control (SCDHEC) installed four observation wells along the northern perimeter of the tank farm. Evidence of petroleum contamination was in the four wells (U.S. Army Environmental Hygiene Agency, 1988). As a result of these observations, a third fuel-recovery effort was initiated in November 1979, which included installation of a 36-in.- diameter recovery well north of tank 1 (U.S. Army Environmental Hygiene Agency, 1988).
Introduction

The earliest investigation of the subsurface microbiology at the facility was by the USAEHA (1977). The investigators reported that all the col lected soils contained microorganisms capable of metabolizing JP-4 constituents.
In 1980, the Defense Fuel Supply Center (DFSC), the coordination organization for the facility, contracted Dames & Moore, Inc. to develop an on-site investigation and monitoring program to assess the extent of ground-water con tamination at and near the tank farm. As part of the investigation, lithologic samples were col lected at 17 boreholes at the facility. Observation wells (wells W-101 to W-108 and B-101 to B-109) were installed in the boreholes (existing wells shown on pi. 1). Dames & Moore, Inc. (1982) reported a sheen on the water surface in seven observation wells. These and other data implied that residual hydrocarbon contamination was present in the soil and was being flushed into the ground water by rainfall and water-level changes. Dames & Moore, Inc. (1982) recom mended that no additional ground-water cleanup was needed because (1) there was no gross con tamination of ground water, (2) repairs had already been made to the tanks, (3) improvements had been made to the facility operational prac tices, and (4) there were no existing ground-water users immediately downgradient.
In the spring of 1984, the residents of Gold Cup Springs subdivision again reported contami nation problems. They complained of objection able odors, a thick scum on the top of the Gold Cup Springs Lake (pi. 1), and oily deposits in the lake bottom (Daubel, 1984). The USAEHA responded by collecting seven surface-water sam ples in and around the subdivision and the facility and three ground-water samples from the northern boundary of the facility. Ground water from some wells contained benzene, toluene, ethylbenzene, and total xylenes (collectively termed BTEX). Surface-water samples from near the oil/water separator on the eastern side of the facility and at one site in Gold Cup Springs Lake contained tank-bottom residue from a recent discharge from the facility through the oil/water separator
(Daubel, 1984). In response to this finding, the DFSP ceased discharging tank-bottom residues to surface water (McClelland Engineers, Inc., 1987a).
Because of the growing public and State concern over ground-water contamination at this and other sites in the area, the U.S. Department of Defense (USDOD) began the Confirmation and Quantification stage of the Installation Restora tion Program for potential USDOD-related toxic and hazardous sites in and near Charleston Air Force Base. Ground-water samples collected from DFSP during this investigation showed 44,000 mg/L of oil and grease in well W-103 (Sci ence Applications International Corporation, 1985). Following this finding, three offsite wells were installed (wells W-001, W-002, and W-003)(pl. I)-
Responsibility for continued site investiga tion was transferred from the DFSC to the U.S. Navy in 1986. The Navy organized the investiga tion around the Navy Assessment and Control of Installation Pollutants Program and contracted McClelland Engineers, Inc., to plan and imple ment a Characterization Step study.
An investigation by McClelland Engineers, Inc., (1987a) included the installation and sam pling of seven observation wells, sampling of four privately owned wells in Gold Cup Springs subdi vision, and collection and analysis of soil and soil-gas samples. The study indicated that part of the JP-4 ground-water contamination from tank 1 was discharging to a spring-fed stream and flow ing northward toward Gold Cup Springs Lake. A subsequent study (McClelland Engineers, Inc., 1987b) reported evidence of leaks around tanks 1, 2, and 3, and evidence of three contamination plumes in the ground water. The main plume of ground-water contamination was moving north from tank 1 toward East Lakeside Drive, and another plume appeared to be moving west from the facility. A third plume was discovered north of tank 3 and did not appear to be related to JP-4 from tank 1.
In 1987, RMT, Inc. was contracted to com plete an aquifer evaluation of the site. These
4 Remediation of Petroleum Hydrocarbon-Contaminated Ground Water in the Vicinity of a Jet-Fuel Tank Farm, Hanahan, South Carolina

investigations showed that BTEX contamination was present in streams and ground water in the subdivision. In addition, low concentrations of fuel-related aromatic and nonaromatic vapors were present in some houses (RMT, Inc., 1987; 1988a; 1988b; 1989a; 1989b; 1989c; 1990).
In 1987, the USGS began investigations at the facility to determine the potential for in situ bioremediation of the ground-water contamina tion at the site. Initial findings of the investigation showed that naturally occurring bacteria were present in the surficial aquifer and were capable of rapidly degrading some JP-4 components dur ing aerobic metabolism and during anaerobic metabolism coupled to nitrate reduction (Francis H. Chapelle, U.S. Geological Survey, written commun., 1988).
As a result of the initial phase of the USGS investigation, an engineered bioremediation sys tem was designed by RMT, Inc. (1989d) and installed at the facility in 1990. A permit to oper ate the system was issued on January 14, 1992, by the SCDHEC.
Description of Study Area
The facility is in the lower Coastal Plain physiographic province of South Carolina (fig. 1) and is underlain by Quaternary, Tertiary, and Cre taceous deposits overlying crystalline rock of pre- Cretaceous age. The hydrogeologic units in the study area included, from shallowest to deepest, the surficial aquifer, the Cooper Group/Cross For mation confining unit, and the Santee Limestone/ Black Mingo aquifer. This investigation focused on the surficial aquifer. Lithologic descriptions of the sediments were based on data obtained from numerous borings made during this and previous investigations. Lithologic and strati- graphic descriptions of units below the surficial aquifer were obtained from drill cuttings and borehole geophysical logging during the installa tion of infiltration-gallery supply well DW-1.
Hydrogeology
The facility and adjacent areas are underlain by unconsolidated Quaternary fluvial and marine deposits consisting of very fine- to medium- grained quartz sand and silty sand with discontin uous layers of clay, clayey sand, and sandy clay. The Quaternary sediments in the vicinity of the facility range in thickness from approximately 39 ft at well B-103 to about 11 ft at well MW-09 (Dames & Moore, Inc., 1982; McClelland Engi neers, Inc., 1987a) (pi. 1). These sediments com pose the surficial aquifer. The unconformable contact between the Quaternary sediments and the underlying Cooper Group/Cross Formation con fining unit at the facility typically is marked by a layer of phosphatic pebbles and shell fragments.
Calculated hydraulic conductivities in the surficial aquifer ranged from 0.5 to 8 ft/d in slug tests done at three wells during this investiga tion. A previous investigation also used slug tests to calculate hydraulic conductivity and obtained values ranging from 1.1 to 3.7 ft/d at four wells in Gold Cup Springs subdivision (McClelland Engi neers, Inc., 1987a).
The Quaternary sediments composing the surficial aquifer are unconformably underlain by upper Oligocene and upper Eocene-age deposits referred to as the Cooper Group (Gohn and others, 1977; Ward and others, 1979). The Cooper Group is comprised of dense, phosphatic, calcareous silty to sandy clay (calcarenite) and dense, phos phatic and glauconitic calcilutite. The middle to upper Eocene-age Cross Formation, directly beneath the Cooper Group, is a dense, partially silicified calcilutite. Cooper Group sediment of only a few feet thick is dense enough to retard the vertical movement of water (Park, 1985). At the facility, the Cooper Group is about 225-ft thick and the combined Cooper Group/Cross Formation thickness is about 270 ft (well DW-1) (Kevin Conlon, U.S. Geological Survey, oral commun., 1996). The combined thickness is an effective confining unit, hydraulically isolating the surficial aquifer from deeper water-bearing units.
Description of Study Area 5

The Cross Formation is underlain by the middle Eocene-age fossiliferous Santee Lime stone and the upper Paleocene-age limestones, sands, and clays of the Black Mingo Group. The two formations have been considered to be hydraulically connected and have recently been referred to as the Santee Limestone/Black Mingo aquifer (Park, 1985; Meadows, 1987). The aqui fer at the facility is confined, with the potentio- metric surface at approximately 240 ft above the base of the overlying confining unit. A 24-hour pumping test in the aquifer (well DW-1) showed the transmissivity to be 575 fWd (Newcome, 1993). The supply well drilled at the facility (well DW-1) was completed with an open-hole section from 305 to 381 ft bis and is considered to have penetrated the upper portion of the Black Mingo Group.
Recharge to the surficial aquifer beneath the facility and adjacent areas primarily was derived from rainfall infiltration. Based on measurements obtained at the Charleston Airport, approximately 3 mi west of the facility, the average annual rain fall from 1961-90 was approximately 51.5 in./yr (National Oceanic and Atmospheric Administra tion, 1995), of which approximately 6 in./yr or less is thought to recharge the ground water in the South Carolina Coastal Plain (Newcome, 1989). Localized recharge also was provided by season ally losing reaches of the stream immediately east of the facility and by infiltration of water from the engineered remediation system in the northern part of the facility.
Ground water locally discharged from the surficial aquifer to springs, a French-drain system south of Valley Drive, gaining streams, and Gold Cup Springs Lake (pi. 1). Evapotranspiration provided an additional water-removal mecha nism. Once the engineered remediation system was placed into operation, ground water also was removed by extraction wells along the north end of the facility and in the subdivision. Because the lower confining unit beneath the facility was approximately 270-ft thick, vertical movement of water through the unit was considered to be negligible.
Much of the shallow ground water beneath the facility is derived from local recharge, as evi denced by the permeable soil, the local mounding during periods of high ground-water levels (fig. 2), and the typically downward vertical head gra dients in the northern part of the facility. At wells MW-12 and MW-12A, water levels were typically 0.31 to 1.05 ft higher in the shallower well rela tive to the deeper well, indicating a downward gradient. Similarly, north of tank 3 at well clus ters MWGS-31A and -3 IB and MWGS-34A and -34B, the higher water levels in the shallowest wells relative to the deeper wells indicated a downward gradient. Occasional gradient rever sals were observed at the remaining well clusters in the facility north of tank 3, possibly as a result of extraction and infiltration associated with the engineered remediation system.
Ground-water discharge took place in Gold Cup Springs subdivision, as shown by the springs, gaining streams, and localized flooding during periods of high ground-water levels. The vertical head differences at wells MW-05 and MWGS- 05A in the subdivision, varied from -0.59 ft to +0.58 ft. The upward gradients generally were observed during periods of high ground-water levels, suggesting that the area locally functioned as a discharge zone during high ground-water levels.
Ground-water levels fluctuated seasonally and with rainfall events. The greatest amounts of rainfall and the highest ground-water levels typi cally were observed during the spring and sum mer. The greatest seasonal water-level variation observed was 6.01 ft at well B-102, on the facility. Water-level variations of about 1.71 ft were mea sured in well MW-08, located in a topographically low area of the Gold Cup Springs subdivision.
In the northern part of the facility, additional water-level changes were caused by the engi neered remediation system. During the operation of the remediation system, about 16 percent of the extracted water from the entire system was replenished with infiltration-gallery water, indi cating a net removal of ground water.
6 Remediation of Petroleum Hydrocarbon-Contaminated Ground Water in the Vicinity of a Jet-Fuel Tank Farm, Hanahan, South Carolina

79°59'20" 79°59'10" 79059-
32°55'10"
32°54'50"
32°54'40" -
EXPLANATION
19 - - WATER-TABLE CONTOUR-Dashed where approximately located. Interval 3 feet. Datum is sea level.
'DEFENSE, £UEL SUPPLY PC
_ / _ _ _SiteBoundQTY. _______
Figure 2. Water table in the surficial aquifer at the Defense Fuel Supply Point, Hanahan, S.C., during high ground-water levels, August 31, 1992.
Description of Study Area 7

The dominant direction of ground-water flow in the surficial aquifer beneath the northern part of the facility is northwest (figs. 2 and 3). In the southern part of the facility, ground-water flow directions varied throughout the year. The ground-water flow direction in the southern part of the facility was typically northward to north westward during low ground-water levels (fig. 3). During high ground-water conditions, however, water-table mounding was observed south of tanks 5 and 6, which resulted in radial flow (fig- 2).
The area north of tank 1 at wells MW-11 and MW-11 A (pi. 1) contains locally confined conditions. Despite the short horizontal distance between the wells (about 3 ft) and the short verti cal distance (about 9 ft) between the screened intervals of these wells, a pronounced downward hydraulic gradient always was present when the water levels were measured. Water-level differ ences between the wells were typically from 1 to 2.6 ft, but were as much as 4.5 ft following heavy rains. Boring logs indicate that the surficial aqui fer north of tank 1 contains multiple clay or sandy clay layers and lenses ranging in thickness from about 0.5 to 3 ft and beginning at a depth of about 7 ft bis (fig. 4). East of well W-105, clay layers do not appear to exhibit substantial hydraulic control.
Ground-Water Contamination
The dominant contaminants in the ground water at the facility were petroleum hydrocarbons derived from fuel spilled or leaked onto the ground. To a large extent, the concentrations of dissolved oxygen (DO), nitrate, ferrous iron (Fe[II]), sulfate, organic acids, and several other constituents in the ground water were controlled by microbial activity related to the petroleum- hydrocarbon distribution. Microbial production of organic acids in the contaminated ground water north of tank 1 resulted in enhanced mineral dis solution (McMahon and others, 1995).
The presence of free-phase fuel in the aqui fer and in the unsaturated zone beneath the facil
ity resulted in ground-water contamination by petroleum hydrocarbons. The most soluble com ponents of the contamination (benzene, toluene, ethylbenzene, and total xylenes) were transported northward into Gold Cup Springs subdivision. The distribution of benzene, the BTEX compound of greatest regulatory concern, showed that ground-water contamination originated from tank 1 and tank 3 basins (fig. 1). Other organic com pounds detected included naphthalene, nitroben zene, a variety of pentane and hexane isomers, and methyl- and alkyl-benzenes.
Arsenic concentrations locally were ele vated above the 50 |ig/L Maximum Contaminant Level (MCL) for drinking water (U.S. Environ mental Protection Agency, 1991; 1996) in the deeper part of the surficial aquifer north of tank 3. The maximum arsenic concentration measured in ground water at well MWGS-31B (pi. 1) was 781 |ig/L, in July 1993. The lack of known arsenic sources at the facility and the close corre lation of elevated arsenic concentrations with ele vated organic-acid, petroleum-hydrocarbon, and Fe(II) concentrations suggest that arsenic may have been mobilized from the sediment by micro bial activity associated with petroleum-hydrocar bon degradation.
Lead was present in ground water north of tank 3. Although concentrations remained below the MCL of 50 ^ig/L for drinking water (U.S. Environmental Protection Agency, 1991), some were higher than the action level of 15 |ig/L (U.S. Environmental Protection Agency, 1996). The maximum lead concentration measured in ground water was 48.3 p.g/L at well PW-01A in January 1994, and concentrations of lead in the facility north of tank 3 occasionally ranged from 10 to 40 |j.g/L. In background areas and north of tank 1, the lead concentrations typically were less than 0.5 |ig/L. These data imply that part of the con tamination north of tank 3 was derived from com bat gasoline, formerly stored in tank 3. Lead potentially can have inhibitory effects on the microbial community, but probably not at the con centrations generally found at the facility (Brad ley and others, 1993a; 1993b).
8 Remediation of Petroleum Hydrocarbon-Contaminated Ground Water in the Vicinity of a Jet-Fuel Tank Farm, Hanahan, South Carolina

79°59'20" 79°59'10" 79°59'
32°55'10"
32°55' -
32°54'50" -
32°54'40" -
EXPLANATION
WATER-TABLE CONTOUR-Dashed where approximately located. Interval 3 feet. Datum is sea level.
f UEL SUPPLY !DEFENSE
Figure 3. Water table in the surficial aquifer at the Defense Fuel Supply Point, Hanahan, S.C., during low ground-water levels, January 2, 1992.
Description of Study Area 9

40-| i-40
-35
-30
Sea Level
100 METERS
EXPLANATION1 NO DATA
I'.-'. : ; -1 SAND 1 lrfA?FV°Q?Nr?R HH1 CI-AY [J CORED INTERVAL
w ((1, MWGS-39- W-I05_ _ _ _ _ -MWGS-33B- -MWGS-T4A"A-
/s**MWGS- /
o>
3
5 so a a
9^*"\ - - >H'~8 MWGS-27C Boring 561
DEFENSE
jL ( Tank A¥ V 1 /t\ \^_^/
pUEL SUPPLY
[ Tank \
>OINT
J Tank )
EXPLANATION
SECTION A- A'
w *03 WELL AND WELL NUMBER
0 50 100 FEET
0 25 METERS
Figure 4. Hydrogeologic section A -A, Defense Fuel Supply Point, Hanahan, S.C.
10 Remediation of Petroleum Hydrocarbon-Contaminated Ground Water in the Vicinity of a Jet-Fuel Tank Farm, Hanahan, South Carolina
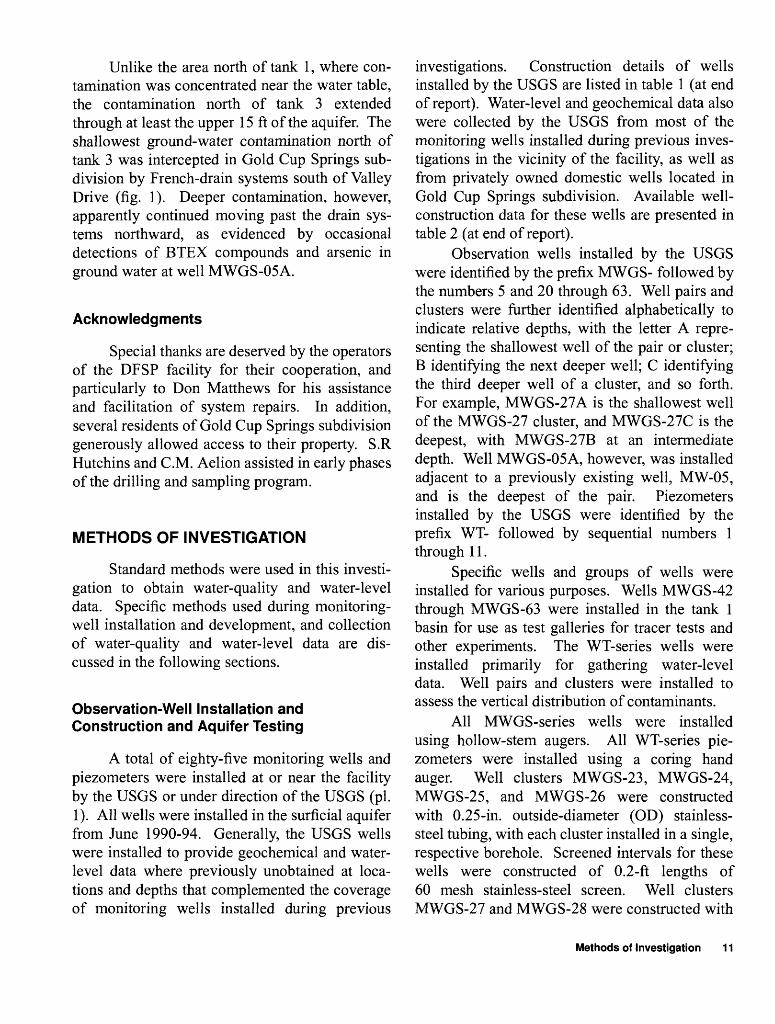
Unlike the area north of tank 1, where con tamination was concentrated near the water table, the contamination north of tank 3 extended through at least the upper 15 ft of the aquifer. The shallowest ground-water contamination north of tank 3 was intercepted in Gold Cup Springs sub division by French-drain systems south of Valley Drive (fig. 1). Deeper contamination, however, apparently continued moving past the drain sys tems northward, as evidenced by occasional detections of BTEX compounds and arsenic in ground water at well MWGS-05A.
Acknowledgments
Special thanks are deserved by the operators of the DFSP facility for their cooperation, and particularly to Don Matthews for his assistance and facilitation of system repairs. In addition, several residents of Gold Cup Springs subdivision generously allowed access to their property. S.R Hutchins and C.M. Aelion assisted in early phases of the drilling and sampling program.
METHODS OF INVESTIGATION
Standard methods were used in this investi gation to obtain water-quality and water-level data. Specific methods used during monitoring- well installation and development, and collection of water-quality and water-level data are dis cussed in the following sections.
Observation-Well Installation and Construction and Aquifer Testing
A total of eighty-five monitoring wells and piezometers were installed at or near the facility by the USGS or under direction of the USGS (pi. 1). All wells were installed in the surficial aquifer from June 1990-94. Generally, the USGS wells were installed to provide geochemical and water- level data where previously unobtained at loca tions and depths that complemented the coverage of monitoring wells installed during previous
investigations. Construction details of wells installed by the USGS are listed in table 1 (at end of report). Water-level and geochemical data also were collected by the USGS from most of the monitoring wells installed during previous inves tigations in the vicinity of the facility, as well as from privately owned domestic wells located in Gold Cup Springs subdivision. Available well- construction data for these wells are presented in table 2 (at end of report).
Observation wells installed by the USGS were identified by the prefix MWGS- followed by the numbers 5 and 20 through 63. Well pairs and clusters were further identified alphabetically to indicate relative depths, with the letter A repre senting the shallowest well of the pair or cluster; B identifying the next deeper well; C identifying the third deeper well of a cluster, and so forth. For example, MWGS-27A is the shallowest well of the MWGS-27 cluster, and MWGS-27C is the deepest, with MWGS-27B at an intermediate depth. Well MWGS-05A, however, was installed adjacent to a previously existing well, MW-05, and is the deepest of the pair. Piezometers installed by the USGS were identified by the prefix WT- followed by sequential numbers 1 through 11.
Specific wells and groups of wells were installed for various purposes. Wells MWGS-42 through MWGS-63 were installed in the tank 1 basin for use as test galleries for tracer tests and other experiments. The WT-series wells were installed primarily for gathering water-level data. Well pairs and clusters were installed to assess the vertical distribution of contaminants.
All MWGS-series wells were installed using hollow-stem augers. All WT-series pie zometers were installed using a coring hand auger. Well clusters MWGS-23, MWGS-24, MWGS-25, and MWGS-26 were constructed with 0.25-in. outside-diameter (OD) stainless- steel tubing, with each cluster installed in a single, respective borehole. Screened intervals for these wells were constructed of 0.2-ft lengths of 60 mesh stainless-steel screen. Well clusters MWGS-27 and MWGS-28 were constructed with
Methods of Investigation 11

1-in. inside-diameter (ID) polyvinyl chloride (PVC) flush-threaded pipe with slotted-screen sections cut to desired lengths in the field. Well clusters MWGS-23, MWGS-24, MWGS-25, MWGS-26, MWGS-27, and MWGS-28 were installed by a USEPA drill crew in cooperation with the USGS. Wells MWGS-35 through MWGS-39 were constructed with 4-in. ID flush- threaded PVC pipe and slotted screen (0.010-in. slots). All other MWGS- and WT-series wells were constructed with 2-in. ID flush-threaded PVC monitor pipe and slotted screen (0.010-in. slots). In most cases, the screened section of shal lower wells was placed to bracket the water table, unless the depth to the water table was too shal low to allow such placement. The annular space around the screened sections of all wells was filled with clean filter sand to various heights (minimum of 1 ft) above the top of the screens. A bentonite seal was placed above the filter sand, and the wells were grouted to land surface. With the exception of wells MWGS-42 through MWGS-63, the annular space above the bentonite seal in all wells was filled with cement grout to just below land surface and finished at land sur face with a concrete pad and a protective cover. Because of their intended use as temporary wells, wells MWGS-42 through MWGS-63 were sealed to land surface with bentonite and were not fin ished with protective covers.
Observation wells were developed either by bailing with Teflon bailers dedicated to individual wells or by pumping until the withdrawn water was clear. The amount of water required to be withdrawn varied from well to well. All water withdrawn during development was contained in waste-water holding tanks on the facility.
Negative-displacement slug tests provided data for estimation of aquifer hydraulic conduc tivity. The screened intervals of wells used for slug testing were fully saturated during the tests. Head changes during the testing were monitored using a data logger and pressure transducers. Slug tests at wells WT-11, MW-10, and MW-15 were analyzed using the Bouwer and Rice method
(1976), with resulting hydraulic-conductivity val ues of 0.5 ft/d, 6 ft/d, and 8 ft/d, respectively.
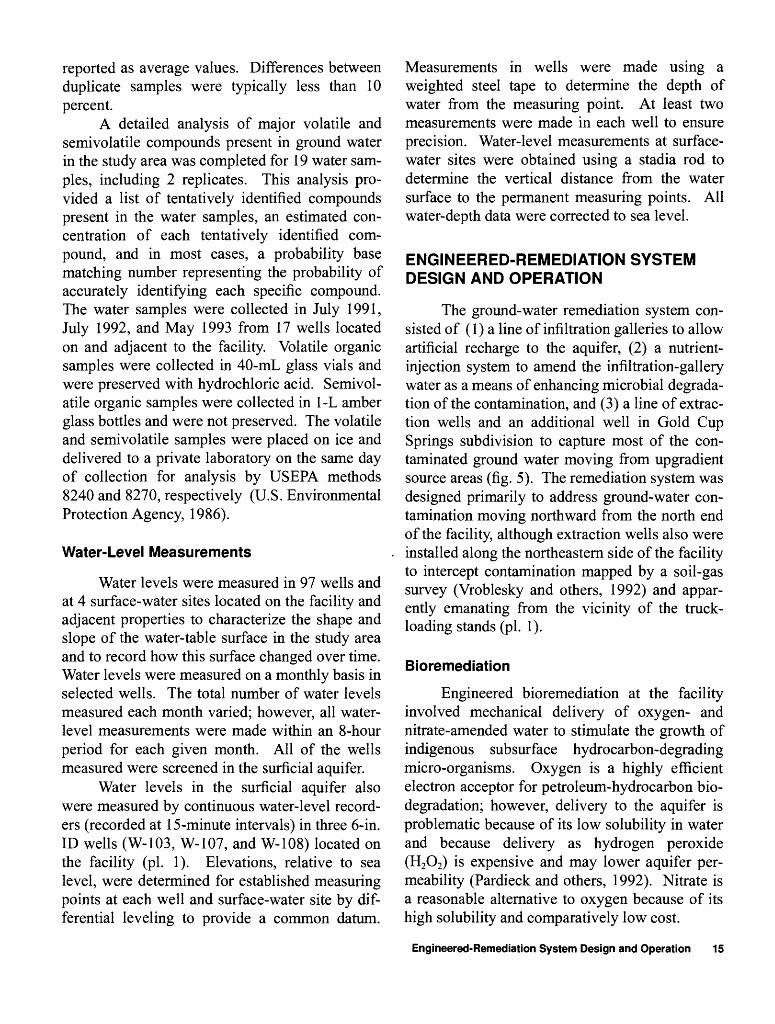
Water-Sample Collection and Analysis
Ninety-one wells and 13 surface-water sites located on and adjacent to the facility were sam pled intermittently during this investigation from December 1990 to January 1996. Between 49 and 79 wells were sampled on a quarterly basis from January 1992 to July 1995. The actual number of surface-water sites sampled each quarter varied somewhat, but typically, all 13 sites were sam pled. Extraction wells were sampled on a monthly basis between March 1992 and Septem ber 1995, depending on their operational status. The infiltration gallery port, IG-2, was sampled on a monthly basis between September 1993 and September 1995.
All monitoring wells were purged of casing water prior to collecting ground-water samples. At least 3 casing volumes of water were removed from each well with either a Teflon bailer, a peri staltic pump with silicon tubing, or a 1.8-in. diam eter stainless-steel submersible pump with a rubber hose, except for wells that were bailed dry prior to removing three casing volumes. Because the extraction wells pump continuously, they could be sampled without additional purging. Each well was sampled immediately following bailing. All purge water was contained in waste- water holding tanks located on the facility.
Most monitoring wells sampled in this study were assigned a dedicated Teflon bailer to collect samples. A few wells were sampled using a com mon bailer that was decontaminated prior to sam pling by washing with a detergent solution and rinsing with deionized water. The silicon tubing used in conjunction with the peristaltic pump was decontaminated by pumping approximately 1 L of deionized water through the system prior to sam pling each well. The outside of the silicon tubing was rinsed with deionized water. The submers ible pump and hose were decontaminated by pumping at least 25 gal of a detergent solution through the system and then rinsing with approxi-
12 Remediation of Petroleum Hydrocarbon-Contaminated Ground Water in the Vicinity of a Jet-Fuel Tank Farm, Hanahan, South Carolina

mately 25 gal of tap water. The outside of the hose and pump were scrubbed with the detergent solution and then rinsed with tap water. Prior to collecting filtered samples at each well, the filter stands and membrane filters were rinsed thor oughly with deionized water, followed by a rinse with ground water from the well.
Dissolved oxygen, ferrous iron, and total sulfide concentrations were measured in the field. After well purging, the dissolved-oxygen concentration in water from each well was deter mined by Winkler titration (Hach Company, 1983). Ferrous iron was analyzed using the Hach colorimeter/FerroZine method (Stookey, 1970). Total sulfide present as hydrogen sulfide (H2 S) or acid-soluble metallic sulfides was determined in the field using a colorimetric method (Hach Com pany, 1983). By allowing particulate matter in the samples to settle and by sampling the clear super natant, the results presented here represent the approximate concentrations of dissolved H2 S.
Specific conductance, pH, and water tem perature were measured after collecting the dis solved-oxygen sample using techniques described by Wood (1976). Specific conductance was mea sured with a Yellow Springs Instrument model 33 SCT meter. The pH was measured using a digital pH meter equipped with a combination pH elec trode and an automatic temperature-compensator probe. Water temperature was measured with the pH meter or a mercury-filled glass thermometer marked in increments of 0.1 °C. Specific conduc tance in the surficial aquifer also were measured by continuous specific conductance recorders (recorded at 15-minute intervals) in four 2-in. ID wells (MWGS-33A, MWGS-33B, MWGS-34A, and MWGS-34B) located on the facility (pi. 1).
Alkalinity titrations were completed in the field on 100-mL filtered samples during the December 1990, and the June, July, and October 1991 sampling events. Each sample was stirred slowly, using a battery-powered magnetic stirrer, while a Hach Digital Titrator was used to add 0.16-normal sulfuric acid solution to the sample until a pH endpoint of 4.5 was reached. Alkalinity was calculated as the endpoint of the
cumulative volume of added acid as a function ofpH.
Water samples for analysis of BTEX, total petroleum hydrocarbons (TPH), total organic car bon (TOC), and naphthalene were collected by slowly filling sample-rinsed glass bottles from a bottom-discharge bailer. The bottles were allowed to overflow several seconds, and the sam ples were then either preserved with 3 drops of hydrochloric acid (BTEX samples), preserved with sulfuric acid (TPH and TOC samples), or not preserved (naphthalene samples). All sample bot tles were capped with Teflon-lined bottle caps. If aeration of a BTEX sample was suspected, or if bubbles were observed in a bottle, the sample was discarded, and a new sample was collected. Ground-water samples for analysis of BTEX and naphthalene were collected in 40-mL glass bot tles; TPH and TOC samples were collected in 1-L and 200-mL amber glass bottles, respectively. The water samples for analysis of BTEX, TPH, TOC, and naphthalene were delivered to a private laboratory on the day of collection for analysis by USEPA methods 8020, 418.1, 415.1, and 8020 respectively (U.S. Environmental Protection Agency, 1983; 1986). The water samples col lected on February 28, 1995, for analysis of BTEX were analyzed by USEPA method 8240 (U.S. Environmental Protection Agency, 1986).
Water samples for analysis of inorganic ions were collected using either a syringe or a peristal tic pump. Water samples were collected in sam ple-rinsed polyethylene bottles after passing through a 0.45 Jim porous-membrane filter. The inorganic ion samples were packed in ice immedi ately following collection. Ammonium, calcium, magnesium, potassium, and sodium were sepa rated in the laboratory by ion-exchange chroma- tography using chemical suppression and conductivity detection. Chloride, bromide, nitrate, nitrite, phosphate, and sulfate were analyzed in the laboratory by ion-exchange chromatography using chemical suppression and conductivity detection using USEPA method 300.0 (U.S. Envi ronmental Protection Agency, 1983).
Methods of Investigation 13

Water samples for analysis of organic acids were collected in sample-rinsed 40-mL amber glass bottles similar to the BTEX-sample collec tion. The organic acid samples were not pre served, but were capped with Teflon-lined septa, and placed on ice. Samples were analyzed for acetate, formate, propionate, and butyrate by ion- exclusion chromatography using chemical sup pression and conductivity detection.
Water samples for analysis of lead and arsenic were collected in sample-rinsed 500-mL polyethylene bottles after passing through a 0.45-|am porous-membrane filter. Samples were packed on ice and delivered to a private labora tory on the day of collection for analysis using USEPA methods 7060 and 7421 (U.S. Environ mental Protection Agency, 1986).
Methane and dissolved inorganic carbon (DIG) samples were collected using a syringe to inject 5 mL of sample water into sealed septated vials through a 0.45-(im porous-membrane filter. The syringe and vials were rinsed with filtered sample water prior to sampling. The samples were packed in ice to minimize concentration changes due to microbial activity. Methane was quantified by thermal-conductivity-detection gas chromatography. Dissolved methane concentra tions were calculated using Henry's Law coeffi cients (Stumm and Morgan, 1981). The DIG samples were acidified in the laboratory with a 42.5 percent phosphoric acid solution, and DIG concentrations were quantified by thermal-con ductivity-detection gas chromatography. Because DIG samples were collected with headspace in the vials and gas chromatography attributes all car bon in this headspace to the DIG concentration, ambient air samples were collected and analyzed for carbon to correct the DIG concentrations for carbon present in the atmosphere.
For quality control and assurance measure of combined sampling and analytical repeatabil ity, replicate samples were collected from at least 10 percent of the total number of wells sampled for each sample event. Duplicate samples not showing analytical agreement were reanalyzed when possible.
Dissolved hydrogen gas was measured in ground water to provide an indicator of the pre dominant microbially mediated terminal electron- accepting processes (TEAP's). The concept was introduced by Lovley and Goodwin (1988). This approach has been used to document the zonation of TEAP's in a variety of aquifer systems (Chapelle and Lovley, 1990; 1992; Chapelle and McMahon, 1991; Chapelle and others, 1995; Lov ley and others, 1994a; Vroblesky and Chapelle, 1994). These studies indicate that hydrogen con centration ranges of 5 to 25 nM (nanomoles) are characteristic of methanogenesis; 1 to 4 nM are characteristic of sulfate reduction; and 0.1 to 0.8 nM are characteristic of ferric iron (Fe[III]) reduction. Because hydrogen is an extremely transitory intermediate, with a half life of less than a minute (Conrad and others, 1987), it is a useful constituent for documenting temporal as well as spatial variations in TEAP's. In this study, hydrogen concentrations were used in conjunc tion with concentrations of other microbially active solutes to document the spatial and tempo ral variations in TEAP's.
Ground-water hydrogen samples were col lected using the bubble-strip method of Chapelle and McMahon (1991). A stream of water was pumped from the well through a gas-sampling bulb at an approximate rate of 600 mL per minute. An injected bubble of nitrogen in the bulb asymp totically collected hydrogen and other soluble gases until equilibrium was achieved. Once equi librium was achieved (less than 5 percent change in 5 minutes, which typically occurred within 15 minutes of initiating the flow of water through the bulb), gas was extracted from the bulb using a gas-tight syringe. Hydrogen was measured in the field at the time of sample collection using a gas chromatograph equipped with a reduction gas detector. The detection limit of the method on samples collected from this site varied between 0.1 and 0.5 nM. Hydrogen samples typically were not collected if the ground water at the well was aerobic. All hydrogen samples were col lected as duplicates. Each duplicate was sepa rately analyzed; however, hydrogen values were
14 Remediation of Petroleum Hydrocarbon-Contaminated Ground Water in the Vicinity of a Jet-Fuel Tank Farm, Hanahan, South Carolina
reported as average values. Differences between duplicate samples were typically less than 10 percent.
A detailed analysis of major volatile and semivolatile compounds present in ground water in the study area was completed for 19 water sam ples, including 2 replicates. This analysis pro vided a list of tentatively identified compounds present in the water samples, an estimated con centration of each tentatively identified com pound, and in most cases, a probability base matching number representing the probability of accurately identifying each specific compound. The water samples were collected in July 1991, July 1992, and May 1993 from 17 wells located on and adjacent to the facility. Volatile organic samples were collected in 40-mL glass vials and were preserved with hydrochloric acid. Semivol atile organic samples were collected in 1-L amber glass bottles and were not preserved. The volatile and semivolatile samples were placed on ice and delivered to a private laboratory on the same day of collection for analysis by USEPA methods 8240 and 8270, respectively (U.S. Environmental Protection Agency, 1986).
Water-Level Measurements
Water levels were measured in 97 wells and at 4 surface-water sites located on the facility and adjacent properties to characterize the shape and slope of the water-table surface in the study area and to record how this surface changed over time. Water levels were measured on a monthly basis in selected wells. The total number of water levels measured each month varied; however, all water- level measurements were made within an 8-hour period for each given month. All of the wells measured were screened in the surficial aquifer.
Water levels in the surficial aquifer also were measured by continuous water-level record ers (recorded at 15-minute intervals) in three 6-in. ID wells (W-103, W-107, and W-108) located on the facility (pi. 1). Elevations, relative to sea level, were determined for established measuring points at each well and surface-water site by dif ferential leveling to provide a common datum.
Measurements in wells were made using a weighted steel tape to determine the depth of water from the measuring point. At least two measurements were made in each well to ensure precision. Water-level measurements at surface- water sites were obtained using a stadia rod to determine the vertical distance from the water surface to the permanent measuring points. All water-depth data were corrected to sea level.
ENGINEERED-REMEDIATION SYSTEM DESIGN AND OPERATION
The ground-water remediation system con sisted of (1) a line of infiltration galleries to allow artificial recharge to the aquifer, (2) a nutrient- injection system to amend the infiltration-gallery water as a means of enhancing microbial degrada tion of the contamination, and (3) a line of extrac tion wells and an additional well in Gold Cup Springs subdivision to capture most of the con taminated ground water moving from upgradient source areas (fig. 5). The remediation system was designed primarily to address ground-water con tamination moving northward from the north end of the facility, although extraction wells also were installed along the northeastern side of the facility to intercept contamination mapped by a soil-gas survey (Vroblesky and others, 1992) and appar ently emanating from the vicinity of the truck- loading stands (pi. 1).
Bioremediation
Engineered bioremediation at the facility involved mechanical delivery of oxygen- and nitrate-amended water to stimulate the growth of indigenous subsurface hydrocarbon-degrading micro-organisms. Oxygen is a highly efficient electron acceptor for petroleum-hydrocarbon bio- degradation; however, delivery to the aquifer is problematic because of its low solubility in water and because delivery as hydrogen peroxide (H2O2) is expensive and may lower aquifer per meability (Pardieck and others, 1992). Nitrate is a reasonable alternative to oxygen because of its high solubility and comparatively low cost.
Engineered-Remediation System Design and Operation 15

INFILTRATION GALLERY
EXTRACTION WELL
Nutrients From supply well DW-1To sewer
-20ft-
~----*----_ Water_TabJe __
Figure 5. Hydraulic and bioremediation system, Defense Fuel Supply Point, Hanahan, S.C.
The engineered bioremediation system at the facility utilized infiltration galleries to inject electron acceptors into the contaminated aquifer. The uncontaminated water for engineered biore mediation was delivered to the surficial aquifer through a line of infiltration galleries (pi. 1). The line was divided into three sections, separated by gate valves. The three sections were identified as infiltration-galleries 1, 2, and 3, and were north of the fuel storage tank numbers 1, 2, and 3, respec tively. Water delivery to individual infiltration galleries through separate feed lines (2-in. ID PVC) was controlled by globe valves in a splitter pit.
Each infiltration gallery consisted of an approximately 330-ft length of 4-in. diameter vit- rified-clay pipe, at a depth of about 2 ft bis. The pipe was perforated at angles of 45 degrees down from horizontal and was surrounded by packed gravel. Individual infiltration galleries were sepa rated from adjacent galleries by 4-in. gate valves. Each feed line intersected its respective infiltra
tion gallery at the approximate center. Distribu tion and metering boxes, identified as IG-1, IG-2, and IG-3 at the intersection of each respective infiltration gallery, allowed access to the injection water.
Although the original design of the system (RMT, Inc., 1989d) was to recirculate 60 percent of the water pumped out of the aquifer back through the infiltration galleries and discharge the remaining 40 percent to North Charleston Sewer District for subsequent treatment, the potential for system clogging by iron precipitation necessitated elimination of the recirculation aspect. Instead, all of the extracted water was sent to the North Charleston Sewer District, and injection water was derived from an uncontaminated onsite source.
The source for injection water was a produc tion well, identified as DW-1, adjacent to the split ter pit (pi. 1). Well DW-1 was cased to a depth of 305 ft bis and was an open hole from 305 to 381 ft bis. The well was open to the Santee Lime-
16 Remediation of Petroleum Hydrocarbon-Contaminated Ground Water in the Vicinity of a Jet-Fuel Tank Farm, Hanahan, South Carolina

stone/Black Mingo aquifer beneath the dense 270-ft thickness of the Cooper Group/Cross For mation confining bed.
Water pumped from DW-1 was directed to the splitter pit where it was diverted to individual infiltration galleries at controlled flow rates. Water from DW-1 was introduced to the surficial aquifer through infiltration-gallery 2 from January 27 to February 4, 1992; June 12 to 22, 1992; October 7 to 9, 1992; October 21 to 24, 1992; November 20 to 26, 1992; April 27 to July 21, 1993; July 23 to 29, 1993; September 14 to 30, 1993; and October 11, 1993 to September 30, 1995.
The ground water from well DW-1 was anaerobic and contained about 120 mg/L of sul- fate as a potential electron acceptor. In the absence of more efficient electron acceptors (such as oxygen, nitrate, and Fe[III]), the presence of sulfate can allow sulfate-reducing conditions to dominate. Some monoaromatic compounds, such as toluene and xylenes, have been found to be microbially degraded under sulfate-reducing con ditions (Holmer and Kristensen, 1994; Beller and others, 1992; Edwards and Grbic-Galic, 1992; Haag and others, 1991; Rabus and others, 1993); however, by adding oxygen and nitrate, the poten tial biodegradation efficiency can be increased by allowing the system to maintain oxic or nitrate- reducing conditions. Thus, the injection water to infiltration-gallery 2 was amended with nitrate to provide a more efficient electron acceptor. Low concentrations of DO entered the infiltration water during advective transfer of the water from the well to the infiltration gallery.
Sodium nitrate and sodium bromide solu tions, 10 and 2 percent, respectively, were added to infiltration water from DW-1 using diaphragm- type chemical metering pumps. Bromide was added as a secondary conservative tracer to sup plement the approximate 350 mg/L of chloride naturally present in the infiltration-gallery water. The additives were introduced to infiltration-gal lery 2 through the feed line about 50-ft downgra- dient from the splitter pit. The flow rates from the metering pumps were maintained at about
8.0 mL/min to provide target concentrations of 10 mg/L nitrate as nitrogen (N) and 10 mg/L of bromide in the amended infiltration water. These injection rates were based on a constant flow rate of 4.5 gal/min from DW-1 to infiltration-gallery 2. Because flow rates from DW-1 to infiltration gal lery 2 could not be precisely maintained, unlike the flow rates from the metering pumps, actual concentrations of nitrogen and bromide intro duced to the aquifer fluctuated slightly. Samples to determine the concentrations in the amended infiltration water were obtained at the distribution and metering box IG-2.
The infiltration water directed to infiltration- gallery 2 was amended with nitrate from May 21 to July 21, 1993; July 23 to July 29, 1993; Sep tember 14 to September 30, 1993; October 11, 1993 to January 12, 1994; and March 4 to Sep tember 23, 1994. During the period of nitrate amendment, approximately 60 mg/L as NO3 (13.6 mg/L as N) was allowed to infiltrate from infiltration-gallery 2 to the aquifer. By the time nitrate-amended water reached the extraction wells, the concentration of nitrate was about 33 mg/L as NO3 (7.5 mg/L as N), as measured at well MWGS-33A. Low concentrations (approxi mately 14 mg/L) of bromide were added to the infiltration water during the periods of nitrate amendment; however, bromide amendment con tinued during the period from January 12 to March 4,1994, when nitrate amendment ceased.
After passing through the bioremediation piping system, the injection water contained an average DO concentration of 0.8 mg/L. During times when the combined infiltration of rainwater and injection of slightly oxygenated water allowed oxic conditions to persist in the shallow aquifer, nitrate amendment was suspended. The temporary cessation of nitrate addition was intended to prevent potential accumulation of nitrate in the aquifer during times when aerobic respiration would limit nitrate reduction.
Engineered-Remediation System Design and Operation 17

Hydraulic Remediation
In addition to functioning as the nutrient- delivery mechanism for engineered bioremedia- tion, the introduction of water from the infiltration galleries also functioned as part of the engineered hydraulic remediation system. Engi neered hydraulic remediation refers to abiotic decreases in ground-water contamination result ing from introduction of uncontaminated water and advective removal of contaminated ground water. A total of about 5,155,000 gal of water from DW-1 was introduced into the surficial aqui fer through infiltration-gallery 2 at an average flow rate of about 4.2 gal/min. Infiltration-gallery 1 received a total of about 20,000 gal of water from DW-1 between June 12 and June 22, 1992, at an average flow rate of about 1.3 gal/min. Water rarely was discharged directly to infiltra tion-gallery 3, and then only for short time periods (less than 1 day).
The ground-water extraction system con sisted of 18 wells (pi. 1). Four of the wells (EW-01, EW-02, EW-03, and EW-04) were along the western boundary of the facility, eleven (EW-05, EW-06, EW-07, EW-08, EW-09, EW-10, EW-11, EW-12, EW-13, EW-14, and EW-15) along the northern boundary, two (EW-16 and EW-17) along the northeastern boundary, and one (EW-18) was in Gold Cup Springs subdivision.
Extraction-wells EW-01 through EW-17 were constructed with 30-ft lengths of 6-in. ID PVC slotted-screen sections (slot size 0.01 in.), placed to bracket the entire saturated thickness of the surficial aquifer. Because of the shallower depth to the bottom of the surficial aquifer in the subdivision, extraction-well EW-18 was installed with a 25 ft screened section. Total depths of the wells ranged from 30 ft (EW-18) to 38 ft (EW-06). The annular space from the bottom of the borehole to not less than 1 ft above the top of the screened interval was filled with filter sand. A 1-ft thick bentonite seal was placed above the sand pack, and the remaining annular space above the bentonite seal was grouted to land surface. Each wellhead was surrounded by a floored con
crete vault, the bottom of which was approxi mately 2 ft bis.
A 0.5-horsepower submersible pump capa ble of providing flow rates of about 10 gal/min was installed in each extraction well. The pumps were fitted with automatic level-control switches to deactivate and reactivate pump operation (cycling) to prevent dewatering the well. All extraction wells were connected to a common dis charge pipe, through which all extracted ground water was directed offsite for treatment.
Extraction-wells EW-04 through EW-07 also were installed with skimmer pumps intended to recover free-phase petroleum. Because these skimmer pumps were installed in a fixed position with an operating range of 2 ft, it was difficult to maintain the water level in the wells within the range of operation. Consequently, little free- phase petroleum was recovered. In an effort to recover greater volumes of product, the fixed- position skimmer pumps were replaced with depth-adjustable, hydrophobic skimmer pumps, capable of recovering free-phase petroleum from a greater range of water-level fluctuations. Hydrophobic skimmer pumps also were installed in wells EW-01, EW-02, and the 36-in. diameter recovery well. Plastic drums with overflow cut off switches were installed in the well vaults to contain the extracted free-phase petroleum.
Continuous operation of the extraction sys tem was initiated on January 27, 1992, with the activation of wells EW-09, EW-10, EW-11, and EW-18. Operation of wells EW-13 and EW-14 began on February 4, 1992, and continued until March 3, 1992. Well EW-13 began operating on March 11, 1992, and operated for about a week. Both wells operated from September 18 through 29, 1992, and from October 1 through December 1, 1993, when free product was detected immedi ately upgradient of EW-13 in well W-108. Subsequently, operation of well EW-13 was dis continued, and EW-14 was operated at low flow rates (average of about 1.6 gal/min) to prevent induced migration of free product. Extraction wells EW-01 through EW-08 began continuous pumping on May 15, 1992.
18 Remediation of Petroleum Hydrocarbon-Contaminated Ground Water in the Vicinity of a Jet-Fuel Tank Farm, Hanahan, South Carolina

The continuous operation of extraction wells EW-03, EW-04, EW-15, EW-16, and EW- 17 was considered undesirable for various rea sons. After pumping wells EW-03 and EW-04 for about three months, water-quality monitoring indicated that the continued operation of these two wells may be detrimental to the bioremedia- tion system as a whole. Water from EW-03 was aerobic and relatively uncontaminated. The mix ing of oxygenated water from EW-03 with anaer obic, Fe(II)-rich water from other extraction wells could have resulted in massive iron precipitation, which could have clogged the entire extraction system. Similarly, EW-04 was at an interface of aerobic and anaerobic waters and contained large amounts of iron precipitate. Wells EW-03 and EW-04 were turned off on August 25, 1992, and were not reactivated. Wells EW-15, EW-16, and EW-17 were not operated because of the potential to induce contaminant migration into areas previ ously containing little or no contamination.
Flow rates from the extraction wells could be controlled by adjusting valves on the discharge pipe at each wellhead. Initially, the system design called for the extraction wells to operate at a flow rate of approximately 3.4 gal/min each for wells EW-01 through EW-17, and approximately 6.8 gal/min for EW-18, providing a total with drawal rate from all 18 extraction wells of about 65 gal/min (RMT, Inc., 1991). Between January 27, 1992 and September 30, 1995, flow rates from on-site extraction wells varied, with typical flow rates between 1.5 and 3.5 gal/min. The average flow rate from EW-18 during the period was approximately 2.4 gal/min. In some instances, flow rates from wells near areas of free-phase petroleum were temporarily increased to as high as 6.0 gal/min to enhance hydraulic capture.
Total volumes of extracted water discharged to North Charleston Sewer District was measured at a totalizing flow meter in the splitter pit. Between January 27, 1992, when the extraction system was initially started, and September 30, 1995, a total of approximately 31,877,400 gal of water had been removed from the surficial aqui fer. Total daily flow rates during this period
ranged from about 5,800 gal/d to about 49,700 gal/d, with an average total daily flow rate of approximately 23,700 gal/d.
HYDROGEOLOGIC AND CHEMICAL FACTORS AFFECTING CONTAMINANT MOVEMENT AND REMEDIATION AT THE FACILITY
Hydrogeologic and chemical factors in the aquifer at DFSP influenced the movement and remediation of ground-water contamination. The hydrogeologic factors included dilution and mobilization by rainfall recharge, seasonal changes in ground-water-flow directions, and aquifer heterogeneities. The chemical factors affecting contaminant biodegradation were those that influenced that amount and type of electron acceptor available for microbial use.
Hydrogeologic Factors
Rainfall infiltration had a variety of effects on the movement and concentration of the ground-water contamination. An example is well MWGS-32A. The concentration of toluene in the shallow ground water at well MWGS-32A decreased from 1,700 jag/L on April 24, 1992, to 190 j^g/L on July 13, 1992, following a major recharge event. The event introduced sulfate (increase from 1.3 to 18 mg/L) to ground water at the well, which allowed the TEAP to switch from methanogenesis (as suggested by the presence of 6.6 nM hydrogen) to sulfate reduction (as sug gested by the presence of 1.7 nM hydrogen). This increase in efficiency of the TEAP probably increased biodegradation rates; however, the apparent decline in DIG concentrations (from 250 mg/L on April 8, 1992, to 77 mg/L on September 2, 1992) implied that dilution was the dominant factor in reducing contaminant concentrations.
Not all of the hydraulic effects of rainfall infiltration resulted in contaminant-concentration decreases, however. The residents of Gold Cup Springs subdivision complained of fuel odors fol lowing an unusually heavy rainfall in September
Hydrogeologic and Chemical Factors Affecting Contaminant Movement and Remediation at the Facility 19

1979 (U.S. Army Environmental Hygiene Agency, 1988). In May 1995, the USGS simu lated a rainfall event by spraying uncontaminated water over the northern part of the tank 3 basin. The sprayed zone covered an area where free- phase fuel contamination was present on the water table as well as an area where no free-phase fuel contamination was present in the saturated zone, but obvious petroleum contamination was present in the unsaturated zone. In the zone where no free-phase fuel contamination was present in the saturated zone, the BTEX concen tration in ground water increased from about 400 )ug/L prior to irrigation to about 1,500 jug/L when resampled 13 days following the initial irrigation. Thus, it appears that rainfall tempo rarily can dilute ground-water contaminant con centrations downgradient from source areas and can increase contaminant concentrations in ground water at the source areas where leachable contaminants are present in the unsaturated zone.
Seasonal differences in ground-water levels can change ground-water transport directions, particularly in the southern and northeastern parts of the facility (figs. 2 and 3) and also the locations of recharge and discharge areas in the stream immediately east of the facility (pi. 1). Periodic measurements of water levels in stream-bed pie zometers along the axis of the stream bed showed that the stream contained both gaining and losing reaches. Moreover, the boundary between the gaining and losing reaches migrated upstream during periods of low ground-water levels and downstream during periods of high ground-water levels. During some periods of low ground-water levels, the stream was flowing adjacent to the facility but had disappeared by infiltration into the ground surface within a few hundred feet down stream from the facility. The significance of this is that the area of the stream adjacent to ground- water contamination at tank 3 and further upstream, west of tank 6, is a gaining reach. Thus, there is a potential for ground-water con tamination to discharge to the creek. Because the creek water infiltrates the creek bed further down stream, there is a potential that contamination dis
charging from ground water at the facility to the creek can then discharge from the creek to the aquifer further downstream.
The distribution of discontinuous clay or sandy-clay lenses beneath the facility also have important effects on contaminant mobility and depletion in parts of the study area. The lenses locally produce confined conditions. Along the northern boundary of the facility, clay and sandy clay lenses dominantly are present west of well MWGS-39 (fig. 4). In 1991, the USGS installed a series of observation wells north of tank 1 to determine whether the clay lenses beneath the water table at tank 1 had stratigraphically trapped petroleum-hydrocarbon contamination beneath the water table. Well MWGS-27A was screened at the water table (approximately 12.6 ft bis in November 1991); well MWGS-27B was screened at a depth of 15.2 to 16 ft bis, immediately below the clay layer; and well MWGS-27C was screened at a depth of 21 to 22 ft bis (pi. 1).
When the wells were sampled in October 1991, the water-table well (MWGS-27A) con tained about 500 )ug/L of BTEX, and the deepest well (MWGS-27C) contained about 105 jug/L of BTEX. Well MWGS-27B, screened immediately below the clay, however, contained free-phase fuel (fig. 6). The water table was approximately 2 ft above the base of the clay at the time of sam pling and approximately 4.3 ft above the base of the clay during periods of heavy rainfall. The thickness of free-phase fuel in the aquifer was not determined because wells screened in a confined aquifer can function as collectors of product (Trimmell, 1987; Kimberlin and Trimmell, 1988).
The data from wells MWGS-27A-C indi cated that part of the unrecovered jet fuel that leaked to the aquifer in 1975 had accumulated in a stratigraphic trap below the water table. As a result of this finding, an additional recovery effort was initiated, involving the installation of addi tional wells below the clay in the tank 1 basin. These and other wells in the area were sampled in May 1992, and analyses of these samples indi cated that the jet fuel had not migrated to other
20 Remediation of Petroleum Hydrocarbon-Contaminated Ground Water in the Vicinity of a Jet-Fuel Tank Farm, Hanahan, South Carolina
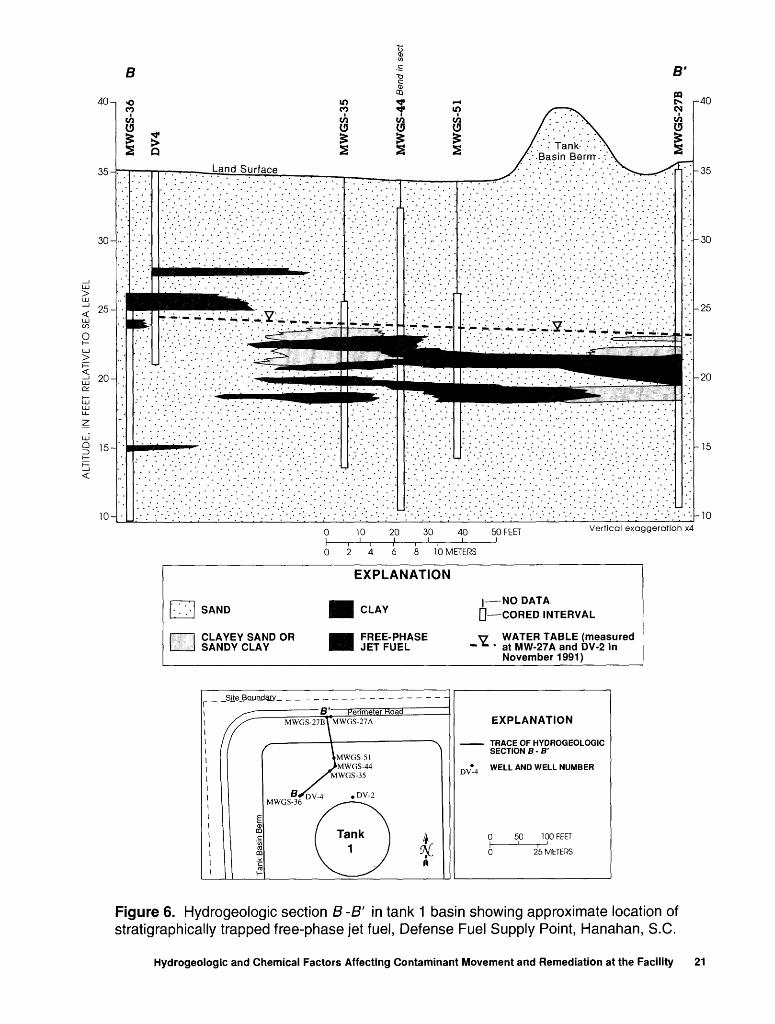
-40
-35
10- -10
Vertical exaggeration x4
10 METERS
SAND
CLAYEY SAND OR SANDY CLAY
EXPLANATION
CLAY
FREE-PHASE JET FUEL
| NO DATA CORED INTERVAL
V WATER TABLE (measured * ' at MW-27A and DV-2 in
November 1991)
Figure 6. Hydrogeologic section B -B 1 in tank 1 basin showing approximate location of stratigraphically trapped free-phase jet fuel, Defense Fuel Supply Point, Hanahan, S.C.
Hydrogeologic and Chemical Factors Affecting Contaminant Movement and Remediation at the Facility 21

observation wells. Following start-up of the nearby extraction wells (EW-06 and EW-07), free-phase fuel began moving out of stratigraphic traps and toward the extraction wells (fig. 1).
The presence of stratigraphically trapped JP-4 means that the most contaminated horizon north of tank 1 is isolated from the influence of infiltration-gallery water. The isolation and apparent lack of significant weathering, as will be discussed in the next section, means that the fuel will continue to be a source of dissolved petro leum hydrocarbons until it is removed or other wise remediated.
Free-phase jet fuel also was discovered in the tank 3 basin during this investigation. In December 1993, free-phase fuel began appearing in well W-108, north of the tank 3 basin. Delinea tion of the fuel showed that it extended from well W-108 into the tank 3 basin (fig. 1). The fuel had begun to migrate northwardly, possibly in response to the start-up of extraction-well EW-13, approximately two months earlier. Evaluation of the fuel by onsite personnel indicated that it was weathered JP-4 (Don Matthews, Defense Logis tics Agency, oral cornmun., 1993).
Chemical Factors
The discovery of free-phase fuel strati graphically trapped beneath the water table at tank 1 and shallow free-phase fuel not stratigraph ically trapped at tank 3 allowed comparisons to be made between the two. The most obvious differ ence between the free-phase fuel at each site was the color. The JP-4 recovered from beneath clay layers at tank 1 was amber colored, and the JP-4 recovered from the aquifer at tank 3 was black. The black color indicates that the tank-3 JP-4 was substantially more weathered than the tank-1 JP-4. Further evidence that the tank-3 JP-4 was more extensively weathered than the tank-1 JP-4 can be seen in the distribution of BTEX compo nents in the ground-water contamination. At tank 1, benzene is a dominant constituent of the ground-water contamination, but at tank 3, tolu ene is the dominant constituent and benzene is
only a minor constituent. Although some research has shown that the BTEX compounds can be transported at differing rates in ground water, resulting in chromatographic separation (Odermatt, 1994), the conditions at DFSP indicate that differential weathering was a primary factor. Benzene is readily biodegradable under aerobic conditions but under anaerobic conditions, it is substantially less biodegradable than toluene. Thus, at tank 3, where recharge by infiltrating oxygenated rain water frequently delivered oxy gen to the contamination, the free-phase fuel apparently was subject to extensive microbial degradation. The free-phase fuel at tank 1 was isolated from recharging oxygenated rain water by the presence of poorly permeable clay. Thus, the free-phase fuel at tank 1 apparently underwent little microbial degradation. These data also imply that without a mechanism to remove the trapped JP-4 or to deliver needed nutrients to the contaminated horizon, the free-phase fuel at tank 1 probably will continue to be a source of dis solved contamination for the foreseeable future.
Other constituents affected by microbial activity in the contaminated ground water included DO, Fe (II), sulfate, sulfide, hydrogen, methane, DIG, and low-molecular-weight ali phatic organic acids (formate, acetate, propionate, and butyrate). These compounds provided infor mation that can indicate the predominant TEAP during microbial metabolism and are important because biodegradation rates can vary with different TEAP's. For example, Hutchins (1991) showed that biodegradation rates of toluene, o-xylene, and m-xylene were faster under nitrate- reducing conditions than under sulfate-reducing conditions, and Mihelcic and Luthy (1988) showed that degradation of naphthalene and acenaphthalene was faster under denitrifying con ditions than under anaerobic conditions in the absence of nitrate. Similarly, Smolenski and Sufl- ita (1987) showed that the rate of biodegradation of several cresol isomers was faster under sulfate- reducing conditions than under methanogenic conditions. These observations indicate that dif ferences in anaerobic TEAP conditions directly
22 Remediation of Petroleum Hydrocarbon-Contaminated Ground Water in the Vicinity of a Jet-Fuel Tank Farm, Hanahan, South Carolina

affect microbial degradation rates of a variety of organic contaminants in ground water.
Dissolved oxygen typically was absent in contaminated parts of the aquifer. This is partly because microbial degradation of petroleum hydrocarbons rapidly depletes DO. An additional mechanism of DO depletion appears to be oxygen scavenging by dissolved Fe (II). As the predomi nant TEAP at wells MW-04 and MW-05 shifted from methanogenesis to iron reduction in January 1993 following a recharge event, a low concentra tion of DO (0.08 mg/L) was detected in the previ ously anaerobic ground water at nearby well MW- 06. Prior to January 1993, there was less Fe(II) (about 2 to 4 mg/L) at well MW-06 than at wells MW-04 (about 17 to 20 mg/L) or MW-05 (about 20 to 34 mg/L). It appears that the amount of Fe(II) in the ground water at well MW-06 was insufficient to scavenge all of the DO introduced by the recharge. Thus oxidation of Fe(II) appar ently is a mechanism that tends to buffer anaero bic conditions in the contaminated aquifer.
Vroblesky and Chapelle (1994) examined data from the site and reported that during times when little or no sulfate or oxygen was introduced to the ground water by recharge from rainfall or alternate sources, the available DO, Fe(III), and sulfate could be depleted by respiring bacteria, leaving methanogenesis as the predominant TEAP. Nitrate was typically at low or undetect- able concentrations except when added through the engineered bioremediation system. Introduc tion of oxygen, from rainfall infiltration, into the methanogenic parts of the aquifer could cause precipitation of Fe(III) as grain coatings. Once the oxygen was depleted, Fe(III)-reducing bacte ria could take advantage of the precipitated Fe(III) to sequester most of the electron flow from degradation of organic compounds. If the water table was lowered below the zone of Fe(III) avail ability, electron flow could be sequestered by less efficient TEAP's, such as sulfate reduction.
Introduction of sulfate into a methanogenic part of the aquifer typically caused a shift in the predominant TEAP to sulfate reduction (Vrob lesky and others, 1996). The rate of transition
from methanogenesis to sulfate reduction varied across the study area. The transition was rapid (<10 days) following recharge by infiltrating rain fall that increased the concentration of sulfate to about 30 mg/L at well MWGS-31A in January 1992. A substantially slower transition rate (about 3 months) was observed in a nearby part of the aquifer containing higher contaminant concentrations where the rainfall infiltration only increased the sulfate concentration to 2.6 mg/L (well MWGS-34B in January 1992).
Differences in TEAP's and in the amount of time needed to shift from one TEAP to another were observed over short horizontal (<16.5 ft) and vertical (<11.5 ft) distances (Vroblesky and Chapelle, 1994). The areal distribution of TEAP's across the site also varied. The data indi cated that introduction of sulfate from recharge events or lateral transport could cause the pre dominant TEAP to shift from methanogenesis to sulfate reduction in large areas of the contami nated aquifer (fig. 7).
These changes in TEAP were important because biodegradation rates of a variety of organic contaminants have been shown to differ under differing TEAP's. The data suggested that during times when little or no sulfate and oxygen were being replenished to the aquifer by recharge or lateral transport, the least efficient metabolism of petroleum contaminants occurred in the most contaminated parts of the aquifer. The data also indicated that addition of alternate electron accep tors that are more microbially efficient than indig enous electron acceptors supplied by rainfall, or by engineering, could cause a shift in the aquifer to a more efficient TEAP, potentially increasing the biodegradation efficiency of a contaminated aquifer. This finding provides the basis for the engineered introduction of nitrate as a remedia tion alternative used in this investigation.
Several investigations have been published on the biodegradation of petroleum hydrocarbons under denitrifying conditions. Publications since 1990 include, but are not limited to, Evans and others (1991); Schocher and others (1991); Hutchins and Wilson (1991); and Gersberg and
Hydrogeologic and Chemical Factors Affecting Contaminant Movement and Remediation at the Facility 23

EXPLANATION
---- BOUNDARY BETWEEN TERMINAL-ELECTRON ACCEPTING PROCESSES
SULFATE-REDUCTION ZONES
EXPLANATION
---- BOUNDARY BETWEEN TERMINAL-ELECTRON ACCEPTING PROCESSES
WELL
\ ZONE . * *--'* i
* ̂ -REDUCTION ZONE ,
ti*
200 i
400 i
600 i
800 FEET
TOO 200 METERS
Figure 7. Areal distribution of terminal electron-accepting processes, based on interpretations of hydrogen measurements in ground water, Defense Fuel Supply Point, Hanahan, S.C., June 1991 (a) and November 1992 (b) (from Vroblesky and Chapelle, 1994).
24 Remediation of Petroleum Hydrocarbon-Contaminated Ground Water in the Vicinity of a Jet-Fuel Tank Farm, Hanahan, South Carolina

others (1991; 1995). These investigations have shown that denitrifying bacteria can degrade tolu ene anaerobically, but cannot degrade benzene easily unless oxygen is present (Hutchins, 1991), and that biodegradation of xylene under denitrify ing conditions was highly variable. Attributing the contaminant removal to microorganisms has been notoriously difficult because of complexities inherent in aquifer systems (Madsen, 1991), but a small number of studies have been able to provide evidence showing that denitrification can effec tively enhance contaminant removal from aqui fers (Berry-Spark and others, 1986; Sheehan and others, 1988; Hutchins and Wilson, 1991; Mad- sen, 1991; Gersberg and others, 1995).
GROUND-WATER REMEDIATION IN THE NORTHERN PART OF THE FACILITY
Ground-water remediation in the northern part of the facility was directed toward the plume emanating from the tank-1 basin, the plume ema nating from near tank 3 and moving north and northwestwardly, and, to a lesser extent, the ground-water contamination west of tank 4. The ground-water remediation included microbiologic and hydraulic controls. The addition of nutrient- rich water to the aquifer north of tanks 2 and 3 provided a mechanism to enhance microbial deg radation of the contamination, and extraction wells in the path of the contamination provided engineered hydraulic control. Nutrient-amended water was not added continuously to the contami nation north of tank 1 because the most contami nated zone at that location was beneath a clay layer and not accessible by infiltration-gallery- supplied water.
Some onsite effects of remediation can be seen by comparing the areal distribution of BTEX north of tank 3 before and after initiation of the engineered remediation system. Immediately prior to operation of the extraction wells, concen trations of BTEX in the shallow part of the surfi- cial aquifer (less than 17-ft depth bis) were greater than 1,000 (ig/L north of tank 3 and
greater than 100 (ag/L northwest of the tank (fig. 8). Following operation of engineered hydraulic remediation and engineered bioremediation, the BTEX concentrations northwest of tank 3 decreased to less than 100 (ig/L (fig. 9). The deeper part of the surficial aquifer (about 16-30 ft bis) was below the zone affected by the nutrient- amended infiltration-gallery water and little change in concentrations was noted. Extraction- well EW-13 was not in operation during much of this investigation because of the potential to induce unwanted transport of nearby free-phase fuel; consequently, the BTEX concentrations in the deeper part of the surficial aquifer near well EW-13 (wells MWGS-32B and MWGS-33B) increased (figs. 10 and 11).
Bioremediation
Bioremediation of contaminated ground water along the northern side of the facility included both natural and engineered aspects. Natural bioremediation is defined as the microbial degradation of organic compounds in the aquifer without the engineered addition of nutrients (elec tron acceptors). In natural bioremediation, micro bial populations utilized electron acceptors that were present in the aquifer water or sediments or were delivered to the aquifer by rainfall infiltra tion. The engineered approach at this site was the delivery of electron acceptors to the aquifer by injection of nutrient-rich water to the aquifer through infiltration galleries. Evidence that the subsurface microbes degraded petroleum-hydro carbon contamination at the facility can be seen in laboratory and field data.
Laboratory Evidence
The laboratory evidence indicating that the subsurface microbes at the facility degraded petroleum hydrocarbons came from a series of studies initiated early in this project. The labora tory studies were designed to determine the biore mediation potential at the facility. Using sediment from the facility, the first laboratory
Ground-Water Remediation in the Northern Part of the Facility 25

rl ss
oo
0)
33
a5
'TJ
0)
fl£ 3 a I
5 5' a> (D
Doa
woo
d C
ourt
EX
PL
AN
AT
ION
50 -
- -
L
INE
OF
EQ
UA
L B
TE
X C
ON
CE
NT
RA
TIO
N I
N T
HE
SH
ALL
OW
PA
RT
OF
THE
SU
RFI
CIA
L A
QU
IFE
R-D
ash
ed
whe
re i
nfer
red.
Int
erva
l, in
mic
rogr
ams
per
liter
, is
var
iabl
e.
WE
LL
, W
ELL N
UM
BE
R,
AN
D B
TE
X C
ON
CE
NT
RA
TIO
N O
R
CO
NC
EN
TR
AT
ION
RA
NG
E,
IN M
ICR
OG
RA
MS
PE
R L
ITE
R
Col
lect
ion
Pip
e fo
r Fr
ench
Dra
in
Figu
re 8
. D
istri
butio
n of
com
bine
d be
nzen
e, t
olue
ne,
ethy
lben
zene
, an
d to
tal x
ylen
es in
the
sha
llow
par
t of
the
surfi
cial
aqu
ifer
(dep
th
of le
ss th
an 1
7 fe
et b
elow
land
sur
face
) no
rth o
f tan
k 3,
Def
ense
Fue
l Sup
ply
Poi
nt,
Han
ahan
, S
.C.,
Janu
ary
1992
.

30 (D (D a
200
Col
lect
ion
Pip
e fo
r Fr
ench
Dra
in
EX
PL
AN
AT
ION
50 -
- -
L
INE
OF
EQ
UA
L B
TE
X C
ON
CE
NT
RA
TIO
N I
N T
HE
SH
ALL
OW
PA
RT
OF
THE
SU
RFI
CIA
L A
QU
IFE
R-D
ash
ed
whe
re in
ferr
ed.
Inte
rval
, in
mic
rogr
ams
per
liter
, is
var
iabl
e.
WE
LL,
WE
LL N
UM
BE
R,
AN
D B
TE
X C
ON
CE
NT
RA
TIO
N O
R
CO
NC
EN
TR
AT
ION
RA
NG
E,
IN M
ICR
OG
RA
MS
PE
R L
ITE
R
300
400
FEET
100
MET
ERS
MW
GS
-33A
M
WG
S-3
4A194-2
04\
<12
__
__
__
__
__
__
_
r _
__
__
_ 1 - ̂
«^. ̂
a^
MW
GS
-39
^20
5-21
5
^^=
-\^^ ^
r^~
^\
^^
^
^^
MW
GS
-32A
M
WG
S-4
1A
MW
GS
-40A
<12
13
0-13
2 21
0-29
0
Figu
re 9
. D
istri
butio
n of
com
bine
d be
nzen
e, t
olue
ne,
ethy
lben
zene
, an
d to
tal x
ylen
es in
the
sha
llow
par
t of
the
surfi
cial
aqu
ifer
(dep
th
of le
ss th
an 1
7 fe
et b
elow
land
sur
face
) no
rth o
f tan
k 3,
Def
ense
Fue
l S
uppl
y P
oint
, H
anah
an,
Sou
th C
arol
ina,
Jul
y to
Aug
ust
1995
.

I
MQ
) 0
0
Q> »
3DP
»
it o 5' T
JQ
) <V I <v i X
»<
a 3 o Q> 3-
o 3 6 o
Doq
woo
d C
ourt
EX
PL
AN
AT
ION
500 - -
LIN
E O
F E
QU
AL B
TE
X C
ON
CE
NT
RA
TIO
N I
N T
HE
D
EE
P P
AR
T O
F T
HE
SU
RF
ICIA
L A
QU
IFE
R-D
ash
ed
w
here
infe
rred.
Inte
rva
l, in
mic
rog
ram
s p
er
liter,
is
varia
ble
MW
GS O
SA
WE
LL
, W
EL
L N
UM
BE
R,
AN
D B
TE
X C
ON
CE
NT
RA
TIO
N O
R
40
42
CO
NC
EN
TR
AT
ION
RA
NG
E,
IN M
ICR
OG
RA
MS
PE
R L
ITE
R
Col
lect
ion
Pipe
fo
r Fr
ench
Dra
in
Figu
re 1
0.
Dis
tribu
tion
of c
ombi
ned
benz
ene,
tol
uene
, et
hylb
enze
ne,
and
tota
l xyl
enes
in th
e de
ep p
art o
f the
sur
ficia
l aqu
ifer
(abo
ut
15-3
0 fe
et b
elow
land
sur
face
) no
rth o
f tan
k 3,
Def
ense
Fue
l Sup
ply
Poin
t, H
anah
an,
Sou
th C
arol
ina,
Jul
y 19
92.

O
o Q.
D) 33
(D i (D 3 o D) 3. (D n D) o
EX
PL
AN
AT
ION
500 - -
LIN
E O
F E
QU
AL
BT
EX
CO
NC
EN
TR
AT
ION
IN
TH
E
DE
EP
PA
RT
OF
TH
E S
UR
FIC
IAL
AQ
UIF
ER
-Dash
ed
wh
ere
in
ferr
ed
. In
terv
al,
in m
icro
gra
ms
per
liter,
is
varia
ble
MW
GS-O
SA
WE
LL
, W
EL
L N
UM
BE
R,
AN
D B
TE
X C
ON
CE
NT
RA
TIO
N O
R
< 12
C
ON
CE
NT
RA
TIO
N R
AN
GE
, IN
MIC
RO
GR
AM
S P
ER
LIT
ER
Col
lect
ion
Pip
e fo
r Fr
ench
Dra
in
«1
1\ ?f r
lb?t
i0?
°f ?
om?
ned
benz
ene,
tolu
ene,
eth
ylbe
nzen
e, a
nd to
tal x
ylen
es in
the
deep
par
t of t
he s
urfic
ial a
quife
r (a
bout
- 3
0 fe
et b
elow
land
sur
face
) no
rth o
f tan
k 3,
Def
ense
Fue
l Sup
ply
Poin
t, H
anah
an,
Sou
th C
arol
ina,
Jul
y to
Aug
ust
1995
.

study reported significant carbon dioxide (CO2) production under anaerobic and aerobic condi tions, indicating that the indigenous bacteria were capable of JP-4 degradation (F.H Chapelle, U.S. Geological Survey, written commun., 1988). The same study showed that bacterial populations in contaminated areas were more acclimated to JP-4 utilization than those in uncontaminated areas. Adding nitrate to the microcosms did little to improve aerobic degradation, but substantially improved anaerobic degradation.
Further laboratory studies (Aelion and Bra dley, 1991; Bradley and others, 1992) using sedi ment from the facility confirmed that the subsurface microorganisms at the facility were capable of degrading some components of the contamination. The studies showed that the indigenous microbes from the contaminated sedi ments had acclimated to the contamination and remained active despite the potentially toxic effects of JP-4. The investigations concluded that the reason nitrate addition substantially improved anaerobic degradation in the previous study was because insufficient nitrate was present in the aquifer to allow the subsurface microbial commu nity to maintain nitrate reduction.
Field Evidence
Field evidence from the facility supported the laboratory evidence that the native microbial community was capable of degrading petroleum contamination with increased efficiency if nutri ents were added to the aquifer. The nutrients were added to the aquifer by recharge water from infil tration-gallery 2. Well EW-11, screened in con taminated ground water approximately 20-ft downgradient from infiltration-gallery 2, provides an example of engineered bioremediation.
Prior to December 13, 1993, the anaerobic ground water at well EW-11 contained an average of 130 ng/L of toluene (fig. 12A), 170 j^g/L of ethylbenzene (fig. 12A), and 460 j-ig/L of total xylenes (Petkewich and others, in press) (average of 14 samples collected from February 17 to November 18, 1993). Benzene concentrations
were low and often less than 20 ^g/L. Although low concentrations of nitrate from infiltration- gallery 2 (0.08 to 0.14 mg/L as NO3) began show ing up in the ground water at well EW-11 by October 13, 1993, nitrate arrived at well EW-11 in an appreciable amount (12 mg/L as NO3) between November 18 and December 13, 1993 (fig. 12B).
With the arrival of nitrate at well EW-11, by December 13, 1993, contaminant concentrations in the ground water at the well sharply decreased. Between November 18 and December 13, the tol uene concentration declined from 76 to less than 20 j^g/L (fig. 12A), the ethylbenzene concentra tion declined from 230 to 45 jag/L (fig. 12A), and the total xylene concentrations declined from 650 to 130 ng/L (Petkewich and others, in press). These declines cannot be attributed to simple dilution. The chloride concentration at well EW-11 was about the same on August 4, 1993 (89 mg/L), as on December 13, 1993 (83 mg/L) (fig. 12B), suggesting that the amount of dilution from infiltration-gallery water was similar on both dates. However, the toluene, ethylbenzene, and total xylene concentrations were substantially lower on the second date. The major geochemical difference was the presence of nitrate on December 13, 1993 (fig. 12B). In addition, the NO3/C1 molar ratio in ground water at well EW-11 (0.085) on December 13 was lower than in the injection water (0.093), indicating a loss of nitrate. By January 11, 1994, the NO3/C1 ratio in ground water at well EW-11 (0.012) was still lower than in the injection water (0.069) indicat ing additional loss of nitrate. These data strongly suggest that the engineered addition of nitrate to the ground water allowed the microbial commu nity at well EW-11 to initiate nitrate reduction and that microbial degradation under nitrate-reducing conditions contributed to the toluene, ethylben zene, and total xylene depletion.
Additional evidence that the contaminants were being degraded by the microbial community at well EW-11 can be seen in the increase in DIC concentrations. Biodegradation of BTEX com pounds in an aquifer contributes carbon dioxide to the ground water, which is reflected as DIC.
30 Remediation of Petroleum Hydrocarbon-Contaminated Ground Water in the Vicinity of a Jet-Fuel Tank Farm, Hanahan, South Carolina

FMAMJ JASOND1993
J F M A M J J1994
Nitrate- A - Chloride O DIG
i-° # a; su
FMAMJ J ASOND1993
J F M A M J J1994
350
300
250
200
ifS d-C^J
s^
§150 §
Uloo S
50
Figure 12. Ground-water chemistry at well EW-11, Defense Fuel Supply Point, Hanahan, S.C., 1993-94.
Ground-Water Remediation in the Northern Part of the Facility 31

Although similar amounts of dilution from infil tration-gallery water existed at well EW-11 on August 4 and December 13, 1993, the DIG con centration was higher on the second date (fig. 12B). In fact, the DIG concentration had been increasing since August 4, despite the temporary cessation of water infiltration at infiltration-gal lery 2 between July 22 and October 11, 1993. Thus, the DIG concentration increase on those dates was not caused by the input of DIG from infiltration-gallery water. The implication is that introduction of nutrients increased biodegradation rates.
A general decline in ground-water contami nant concentrations at well EW-11 continued after December 18, 1993 (fig. 12A). During the period of nitrate addition between December 18, 1993, and July 14, 1994, the eight samples collected showed an average toluene concentration of 30 |ig/L, an average ethylbenzene concentration of 64 |ig/L, and an average total xylene concen tration of 200 jag/L. In later months (August 23, 1994 to September 27, 1995) the concentrations continued to decline. The twelve samples col lected during this time period showed an average toluene concentration of 11 ng/L, an average eth ylbenzene concentration of 47 |ig/L and an aver age total xylene concentration of 88 jag/L. Increases in chloride concentration following December 18, 1993, however, suggested that dilu tion eventually became a contributing factor leading to contaminant depletion at well EW-11 (fig. 12B).
The effects of engineered bioremediation also can be seen in ground water at other wells in the northern part of the facility. Data from wells MW-12 and MW-12A show that both the opera tion of extraction wells and the injection of infiltration-gallery water enhanced aquifer biore mediation. Wells MW-12 and MW-12A are adja cent to each other but screened at different depths, approximately 45 ft east of well EW-11 (pi. 1). Following start-up of well EW-11 on January 27, 1992, and prior to injection of infiltration-gallery water, the concentrations of toluene, ethylben
zene, and total xylenes in ground water at well MW-12 decreased.
The data suggested that not all of the con taminant depletion at well MW-12, deepest of the pair, was due to advective capture by EW-11. The ground-water chemistry at well MW-12 suggested that biodegradation efficiency increased in the aquifer following start-up of well EW-11. In the ground water at well MW-12, the concentration of toluene, a readily biodegradable compound, declined from greater than 1,400 jj,g/L prior to operation of well EW-11 to less than 250 jag/L by April 1992 and remained below 250 jag/L during June, July, and September (fig. 13A). The con centrations of benzene and total xylenes, how ever, did not similarly decrease (fig. 13B), as would be expected if advective removal were the only depletion mechanism. These data imply that biodegradation was a depletion mechanism for toluene.
Effects of the engineered bioremediation can be seen at well MW-12A following start-up of the infiltration gallery. Although it is clear that injected water was reaching the screened interval at well MW-12A by June 30,1993, based on chlo ride concentrations (fig. 14A), nutrient concentra tions in the anaerobic ground water at well MW-12A were substantially below injectate con centrations. Nitrate typically was absent at well MW-12A (<0.01 mg/L) during the period of nitrate injection (Petkewich and others, in press). The only nitrate measured was 0.09 mg/L on October 13, 1993. In addition, SO4/C1 ratios at well MW-12A were substantially lower than in the injection water (fig. 14A). Thus, nitrate and sulfate in the injection water were being depleted in the aquifer along the flowpath between the infiltration gallery and well MW-12 A. The most probable explanation is that they were depleted by microbial reduction coupled to organic contaminant biodegradation. Support for this hypothesis can be seen in the lack of measurable toluene concentrations following injection of nutrient-amended water (fig. 14B). Thus, the decreases in contaminant concentration at well
32 Remediation of Petroleum Hydrocarbon-Contaminated Ground Water in the Vicinity of a Jet-Fuel Tank Farm, Hanahan, South Carolina

2,000
DJ FMAMJ JASONDJ FMAMJ JAS 1990 1991 1992
w 200
u§
I I I I I I I I I I f I
Benzene * Total xylenes
1 I I I T
J_____L
1,200 ~gWB!
HU
SDJ FMAMJ JASOND
1990 1991J FMAMJ JAS
1992
Figure 13. Toluene (a), and benzene and total xylene (b) concentrations in ground water at well MW-12, Defense Fuel Supply Point, Hanahan, S.C., 1990-92.
MW-12A following start-up of infiltration-gallery 2 appeared to be partly due to enhanced microbial degradation.
The ground-water contamination north of tank 3 also was affected by injectant water from infiltration-gallery 2. A leak in the separation valve between infiltration-galleries 2 and 3 allowed nitrate-amended water to enter infiltra tion-gallery 3 and discharge to the ground water in the vicinity of wells MWGS-32A and MWGS- 33 A (pi. 1). Because increases in nitrate, oxygen, sulfate, and chloride concentrations were detected in ground water from these wells at approxi mately the same time (Petkewich and others, in press), the contaminant-depletion mechanism cannot be easily differentiated. The arrival time of injection water at well MWGS-33A is repre sented by the increase in specific conductance during late August 1993 and again during November 1993 (fig. 15). The arrival date at well MWGS-32A probably was slightly sooner (less than a month) than at well MWGS-33A. Despite the uncertainty regarding the specific removal
mechanism of the contamination, it is clear that contaminant concentrations markedly decreased during the engineered remediation. The toluene concentration decreased from greater than 100 ng/L at well MWGS-33A (fig. 15A) and greater than 700 ng/L at well MWGS-32A (fig. 15B) prior to injecting water to typically less than 2 |ug/L at each well after injection.
Well MWGS-41A (pi. 1) also received injection water from the infiltration gallery. In the months prior to injection, the toluene concentra tion in ground water at well MWGS-41A ranged from 560 to 2,800 ng/L (fig. 16A). Following a short-lived injection of infiltration-gallery water in late July 1993, as reflected in specific conduc tance readings at nearby well MWGS-33A (fig. 15 A), the concentration of toluene decreased from 2,500 to 330 jag/L. By the next sampling, amended water was entering the aquifer continu ously, as noted by the increase in chloride concen tration (fig. 16B), and the toluene concentration declined to <2 jag/L (fig. 16A).
Ground-Water Remediation in the Northern Part of the Facility 33

SO4 /CLatMWGS-12A
SO4 /CLatIG-2Chloride
u
J FMAMJ JASONDJ FMAMJ JASO
0.16 9
0.14 «30.12 w
0.10 §0.08 30.06 |0.04 [30.02 t£
0.00 g
w
1992 1993
J FMAMJ JASONDJ FMAMJ JASO1992 1993
Figure 14. Chloride concentrations and sulfate/chloride ratios (a), and toluene concentrations (b) at well MW-12A, Defense Fuel Supply Point, Hanahan, S.C., 1992-93.
Although much of the toluene loss at well MWGS-41A probably was due to dilution effects, microbial populations appear to have been active as well. During the period of continuous injection from December 1993 to January 1995, DO was present in the ground water at MWGS-41 A (fig. 16C). During that period, the ratios of SO4/C1 in the aquifer at well MWGS-41 A were similar to or higher than the SO4/C1 ratios in the injection water (fig. 16C), indicating no loss of sulfate along the flowpath from the injection gallery to the well (about 3 ft, horizontally). Once the aquifer became anaerobic, however, the ratio in ground water decreased to values less than in the injection water (fig. 16C), implying a depletion of sulfate along the ground-water flowpath. This is consis tent with a microbial population switching from aerobic respiration to anaerobic sulfate reduction.
Hydraulic Remediation
Hydraulic remediation at the facility con sisted of engineered and natural controls on the
amount of water entering and leaving the contam inated aquifer. Controls on the natural hydraulic remediation of the ground-water contamination were discussed earlier. Through engineered con trols, solute-transport pathways were altered, allowing extraction wells to act as collection points for the removal of ground-water contami nation.
An example of engineered hydraulic reme diation can be seen in the mobilization and cap ture of stratigraphically trapped free-phase fuel. Prior to initiating the operation of the extraction wells, the free-phase fuel stratigraphically trapped beneath the water table north of tank 1, appeared to be relatively immobile (fig. 6). Because it had remained undetected for approximately 17 years, it had been a long-term source of dissolved BTEX contamination in the ground-water north of tank 1.
In an effort to mobilize and recover the stratigraphically trapped fuel, extraction wells
34 Remediation of Petroleum Hydrocarbon-Contaminated Ground Water in the Vicinity of a Jet-Fuel Tank Farm, Hanahan, South Carolina

1,000 =
<
u§
1 I 1 I 1 I _ ~K~
Specific conductance (gaps indicate missing record)
Toluene
O < 2 |ig/L Toluene
3,000
1,000
O oouo
J FMAMJ JASONDJ FMAMJ JASOND1993 1994
100
50 55
l l l I I I I I I i i i i i i I l I I I I I I
J FMAMJ JASONDJ FMAMJ JASOND1993 1994
Figure 15. Toluene concentrations at wells MWGS-33A (a) and MWGS-32A (b), and specific conductance at well MWGS-33A (a), Defense Fuel Supply Point, Hanahan, B.C., 1993-94.
north of the fuel were turned on, and contami nated ground water was pumped offsite to a treat ment facility. The extraction wells initially contained no free-phase fuel, but by August 1992, free-phase fuel began appearing in extraction wells and other observation wells (W-103, MWGS-29A, MWGS-30A, EW-06, and EW-07) (pi. 1). The presence of jet fuel implied that the cones of depression around the extraction wells had allowed part of the jet fuel to escape its strati- graphic trap. Hydrophobic skimmer pumps were installed in the extraction wells to remove the accumulating jet fuel. The amount of product removed to date by the skimmer pumps in those wells is not known with certainty. Recovery efforts are ongoing.
Hydraulic effects from the extraction wells near tank 1 also can be seen west of the tank. Prior to operation of extraction-well EW-02 (pi. 1), the concentrations of BTEX ranged from less than 10 ng/L to about 150 ng/L at well EW-02 and were greater than 100 u.g/L at well MW-07,
approximately 60 ft northeast of well EW-02. Within a few months following the start-up of extraction-well EW-02, the concentrations of BTEX in ground water at well MW-07 declined to values generally less than 50 ng/L (fig. 17A), and by the end of this investigation (September 1995), the BTEX concentrations at MW-07 were below detection limits (2 jig/L for benzene, toluene, and ethylbenzene, and 4 ng/L for total xylenes). These data imply that extraction well EW-02 was capturing the contaminated ground water that oth erwise may have been transported along flow- paths in the vicinity of well MW-07. Supporting evidence that EW-02 was capturing contaminated ground water from the surrounding area can be seen in the increased contaminant concentrations at well EW-02 following its start-up (fig. 17B).
The ground-water contamination in the northeastern part of the facility also was hydrauli- cally affected by operation of extraction wells. Evidence for capture of ground-water contamina tion by the extraction wells can be seen in the
Hydraulic Remediation 35

0)
O
Q) »
3D
=»
<D
|a 5' "O
fi>
<D o. <D § X o I
DIS
SOL
VE
D O
XY
GE
N, I
N
MIL
LIG
RA
MS
PER
LIT
ER
CH
LO
RID
E, I
N
MIL
LIG
RA
MS
PER
LIT
ER
TO
LU
EN
E, I
N
MIC
RO
GR
AM
S PE
R L
ITE
R
'
=f
Q)
C
O
O
_L? Z
o>
(Q
O
"=
oi
"""*
CD"
CD
2.^
S
CD
N)
=r.
3^-
v O
CD
O
CO
^-,
^
0)
W
§= ill
?o
^cp
_ C
/>^^
C/3
± §
^
>
^-
"9.
Q)
9:
^
3
^
13
^8
O
CO
^
-
Si|
0)
Q.
S^S
o
^=r
O
fD)
=
. ^
3
Q.
O-
CD
OC/
3 --
, 3
X
D)
OO
=r.
CDJ
O
3_L
w
=f
CO
tt
S. '
co Ol
u>
-P>.
SUL
FAT
E/C
HL
OR
IDE
RA
TIO
,IN
MIL
LIM
OL
ES
PER
MIL
LIM
OL
E

2,500
2.000
1,500
<J 1,000
X 500
CO
1995
O <10ng/LBTEX
1991 1992 1993 1995
Figure 17. Concentration of combined benzene, toluene, ethylbenzene, and total xylenes in ground water recovered from wells MW-07 (a) and EW-02 (b), Defense Fuel Supply Point, Hanahan, B.C., 1991-95.
contaminant concentration changes at extraction- well EW-11. On the three sample-collection dates prior to full start-up of well EW-11 (January 27, 1992), the toluene concentration ranged from 72 to 95 ug/L. In the months following start-up of well EW-11, the toluene concentration in water pumped from the well increased to 600 jig/L, indicating that the well was collecting ground- water contamination from the surrounding area. Similar increases were noted in the concentrations of ethylbenzene and total xylenes.
GROUND-WATER REMEDIATION IN GOLD CUP SPRINGS SUBDIVISION
In general, concentrations of ground-water contaminants decreased in Gold Cup Springs sub division during the course of this investigation. The ground-water quality north of tanks 2 and 3 was influenced by engineered bioremediation and hydraulic remediation. Because localized shallow
clay layers north of tank 1 would have impeded the downward movement of nutrient-amended infiltration-gallery water, the engineered remedia tion system north of tank 1 relied on hydraulic controls. Nevertheless, the data suggest that bioremediation and hydraulic remediation were contaminant-depletion mechanisms in the subdi vision north of the facility. Some effects of the remediation can be seen by examining changes in the distribution of BTEX concentrations in Gold Cup Springs subdivision north of tank 1. Fifty-four days following start-up of the extrac tion-well system north of tank 1, the BTEX con centrations in the subdivision were higher than 3,000 jug/L at wells PW-02 and MWGS-22 and higher than 4,000 jug/L at well MW-04 (fig. 18 and pi. 1). After approximately 3 years of extrac tion-well operation, however, the BTEX concen trations had declined by about 60 percent at wells PW-02 and MWGS-22 and by more than 80 percent at well MW-04 (fig. 19). Despite the general decrease in contamination north of tank 1,
Ground-Water Remediation in Gold Cup Springs Subdivision 37

I w
0)
00
3
n>
3-
0)
j]3
fl>
o o
0)
3
3 a c 3 I O
O 03 3-
o 3 6
o => oT 3 o> Q. O
o Q.
0)
EX
PL
AN
AT
ION
LIN
E O
F E
QU
AL
BTE
X C
ON
CE
NTR
ATI
ON
IN
GR
OU
ND
W
AT
ER
-Das
hed
whe
re i
nfer
red.
Int
erva
l, in
m
icro
gram
s pe
r lit
er,
is v
aria
ble.
WE
LL
, W
EL
L N
UM
BE
R,
AN
D B
TE
X C
ON
CE
NT
RA
TIO
N O
R
CO
NC
EN
TR
AT
ION
RA
NG
E,
IN M
ICR
OG
RA
MS
PE
R L
ITE
R
AP
PR
OX
IMA
TE
AR
EA
OF
FR
EE
-PH
AS
E
FU
EL
IN
TH
E S
UR
FIC
AL
AQ
UIF
ER
Col
lect
ion
Pip
e \
for
Fren
ch D
rain
Loca
ted
July
199
2M
WG
S-2
7B
MW
GS
-30A
Figu
re 1
8.
Dis
tribu
tion
of c
ombi
ned
benz
ene,
tol
uene
, et
hylb
enze
ne,
and
tota
l xyl
enes
in g
roun
d w
ater
nor
th o
f tan
k 1,
D
efen
se F
uel S
uppl
y P
oint
, H
anah
an,
Sou
th C
arol
ina,
Jun
e to
Jul
y 19
92.

o
3 3 a,
o> 30
(D (D a O
o_
a.
O o
0) o (Q
(0 0) i
EX
PL
AN
AT
ION
LIN
E O
F E
QU
AL
BTE
X C
ON
CE
NTR
ATI
ON
IN G
RO
UN
D
WA
TE
R-D
ash
ed w
here
inf
erre
d. I
nter
val
500
mic
rogr
ams
per
liter
.
WE
LL
, W
EL
L N
UM
BE
R,
AN
D B
TE
X C
ON
CE
NT
RA
TIO
N O
R
CO
NC
EN
TR
AT
ION
RA
NG
E,
IN M
ICR
OG
RA
MS
PE
R L
ITE
R
AP
PR
OX
IMA
TE
AR
EA
OF
FR
EE
-PH
AS
E
FU
EL
IN
TH
E S
UR
FIC
AL
AQ
UIF
ER
^ -
50
0*
^J
MW
-06
. V
1
4Q
-
MW
GS
-22
It*
Col
lect
ion
Pip
e fo
r Fr
ench
Dra
in
Figu
re 1
9.
Dis
trib
utio
n of
com
bine
d be
nzen
e, t
olue
ne,
ethy
lben
zene
, an
d to
tal x
ylen
es in
gro
und
wat
er n
orth
of t
ank
1,
Def
ense
Fue
l S
uppl
y P
oint
, H
anah
an,
Sou
th C
arol
ina,
Aug
ust
1995
.

the presence of free-phase fuel in ground-water at the tank-1 basin allowed continued occasional releases of dissolved petroleum-hydrocarbon con tamination to move through the subdivision.
Bioremediation
Laboratory and field evidence indicated that the petroleum-hydrocarbon contamination in Gold Cup Springs subdivision was being actively bioremediated. Because nutrients were not con tinuously added to the ground water north of tank 1, microbial ground-water remediation in that area was dominated by natural processes. Although it is difficult to differentiate the water- quality changes resulting from hydraulic remedia tion relative to bioremediation in ground water beneath the subdivision north of tanks 2 and 3, both were shown to be important contaminant- depletion mechanisms in upgradient areas, and the data imply that both were active influences on ground-water quality near down-gradient areas as well.
Laboratory Evidence
A laboratory investigation using sediment collected from the vicinity of extraction-well EW-18 (Chapelle and others, 1996) showed that the subsurface microbes were capable of degrad ing toluene under sulfate-reducing conditions, which was the prevailing TEAP at the collection site. The laboratory-derived depletion rate (ktol) was -0.01 per day (d' 1 )- Although toluene biode- graded under sulfate-reducing conditions, it was not significantly biodegraded under nitrate-reduc ing, Fe(III)-reducing, or methanogenic condi tions. These data implied that the microbial populations had adapted to the presence of con tamination and to sulfate reduction as the prevail ing TEAP condition.
Biodegradation of benzene using aquifer sediments from Gold Cup Springs subdivision also was examined. Two investigations of the contaminated aquifer sediments found that ben zene degraded at low but measurable rates under
sulfate-reducing, but not methanogenic conditions (Chapelle and others, 1996; Derek Lovley, Uni versity of Massachusetts, written commun., 1995).
The rate of benzene uptake under sulfate- reducing conditions north of tank 1 was highly variable. In some studies of sediment from the facility, the rates of anaerobic benzene degrada tion were so slow that they could not be detected by monitoring benzene loss with time in the aqui fer (Chapelle and others, 1996) or in laboratory incubations (Derek Lovley, University of Massa chusetts, unpublished data, 1995). In these instances, benzene degradation was detectable only by the more sensitive technique of monitor ing production of 14CO2 from [ 14C]-benzene (Derek Lovley, University of Massachusetts, writ ten commun., 1995).
In one sediment sample collected from the facility, however, located near well MWGS-20, and incubated under strict anaerobic conditions, benzene (about 3 micromoles per liter [pM]) was consumed rapidly in all four replicate vials with out a lag (fig. 20). Benzene continued to be con sumed with repeated feedings, represented in figure 20 by the repeated declines in concentra tion after each injection of new benzene. The ini tial concentration of benzene in the microcosm was about 3 |nM. Benzene increases in figure 20 represent refeeding of benzene to the sediment. Because of slight differences in the rates of ben zene uptake in replicate incubations, the data from one sediment incubation is shown. However, this same pattern was observed in all four of the repli cate incubations (Derek Lovley, University of Massachusetts, written commun., 1995).
When the TEAP in the microcosms was evaluated with [2- 14C]-acetate (Lovley and others, 1994a), there was production of 14CO2 , but not radio-labeled methane ( 14CH4), indicating that methanogenesis was not actively metabolizing the substrate. The addition of 1 mM molybdate inhibited sulfate reduction, and a corresponding decrease in 14CO2 production was observed.
40 Remediation of Petroleum Hydrocarbon-Contaminated Ground Water in the Vicinity of a Jet-Fuel Tank Farm, Hanahan, South Carolina

200
180 - Concentration between benzene additions
O Concentration immediately following injection of benzene
Figure 20. Benzene consumption in sediments under sulfate-reducing conditions following initial feeding and subsequent re-feedings, Defense Fuel Supply Point, Hanahan, S.C.
Thus, sulfate reduction was the predominant TEAP in the microcosms. This was surprising because Fe(III) reduction was the typical TEAP at the location where the sample was collected. Microbial activity in the microcosms apparently had depleted the available Fe(III) and shifted to sulfate reduction.
The TEAP shift is of interest for a variety of reasons. Rapid anaerobic benzene degradation coupled to Fe(III) reduction previously has not been observed in these sediments unless an Fe(III)-chelator was added to make Fe(III) more available for reduction (Lovley and others, 1994b). One laboratory study (using sediment from a site in California), however, has shown that sulfate-reducing bacteria sometimes are capa ble of rapidly degrading benzene anaerobically (Lovley and others, 1995). The typical persis tence of benzene under sulfate-reducing condi tions at many field sites implies that rapid degradation of benzene under sulfate-reduction requires unique conditions not yet identified. As
will be shown in-a later section, the shift from iron reduction to sulfate reduction that preceded rapid benzene removal from the laboratory micro cosms, was mimicked under field conditions at well MW-04. The subsequent rapid anaerobic depletion of benzene at well MW-04 suggested that the depletion mechanism was microbially related.
Field Evidence
Field evidence supporting biodegradation of the petroleum hydrocarbon contamination in ground water north of the facility could be seen in the depletion of toluene along the flowpath. The rate of toluene depletion (ktol) along a flowpath northward from tank 1 into Gold Cup Springs subdivision was -0.0075 to -0.03 d' 1 under pre dominantly sulfate-reducing conditions. The depletion rate corresponded approximately with the lab-derived ktol rates (-0.1 d' 1 ) for sulfate reduction (Chapelle and others, 1996). The agreement between laboratory- and field-derived
Ground-Water Remediation in Gold Cup Springs Subdivision 41

rate constants implied that toluene disappearance along the flowpath was the product of microbial degradation under predominantly sulfate-reduc- ing conditions (Chapelle and others, 1996).
Additional evidence that concentrations of ground-water contaminants have decreased in Gold Cup Springs subdivision can be seen in the surface-water-quality data collected from SW-12, a sampling point for a french-drain system that collects shallow ground water from the southeast side of Valley Drive, north of tank 3 (pi. 1). The 1992 ethylbenzene and toluene concentrations were greater than 15 jag/L (fig. 21 A), benzene concentrations were greater than 25 jig/L (fig. 2 IB), and total xylene concentrations were greater than 50 jig/L (fig. 2 IB). Concentrations declines were observed in the next two samplings (January and July 1993). For the next several samplings, the total BTEX concentration varied between about 25 to 60 }ig/L. As of the final sam pling (August 1995) during this investigation, benzene, toluene, and ethylbenzene were not detected (less than 2 jig/L) and the total xylenes concentration had decreased to 8.5 }ig/L (fig. 21A and 2IB). Because SW-12 collected drainage water from a broad area, it is difficult to relate specific causes to the concentration decreases; however, in the months prior to the decline, extraction wells upgradient from the French-drain system were operated intermittently, and nutrient- enriched infiltration-gallery water had been released intermittently to the aquifer. Once infil tration-gallery water was allowed to recharge the aquifer continuously (April 1993), the concentra tion of toluene at SW-12 decreased from 22 |ug/L (November 2, 1992) to undetectable (<0.2 jig/L) concentrations (July 1, 1993).
A high concentration of chloride (240 mg/L) was detected in French-drain water at SW-12 and 260 mg/L at SW-01 in August 1995, indicating that the drains were collecting water introduced to the aquifer from infiltration-gallery 2. Moreover, the SO4/C1 ratios in SW-01 and SW-12 (0.105 and 0.111 rnM/mM, respectively) were lower than in the infiltration-gallery water (0.129 rnM/mM), implying a loss of sulfate to a
greater extent than can be accounted for by dis persion. The probable sulfate-removal mecha nism was sulfate reduction coupled to oxidation of organic contamination. Thus, the data imply that the decreases in ground-water contaminant concentration at SW-12 were the result of engi neered hydraulic remediation and engineered bioremediation.
Additional evidence suggested the possibil ity that benzene was being microbially degraded under anaerobic conditions in ground water beneath Gold Cup Springs subdivision. A labora tory experiment, discussed in an earlier section, showed subsurface microbes from the facility were capable of rapidly degrading benzene under sulfate-reducing conditions in sediments that had previously been iron reducing. This finding was of particular interest because rapid depletion of benzene was observed in ground water at MW-04 following that same sequence of TEAP shift. Evi dence for potential microbially mediated benzene loss can be seen in the temporal concentration changes of benzene, hydrogen, sulfate, and iron(II) at well MW-04 (fig. 22).
The dominant constituents of the BTEX fraction in the ground water at well MW-04 were benzene and total xylenes. Until April 1993, benzene concentrations ranged from 860 to 1,700 jig/L in the ground water at well MW-04 (fig. 22A).
The concentrations of benzene sharply decreased between April 1993 and July 1994. The changes in hydrogen concentration in the aquifer at well MW-04 suggested that the benzene depletion was related to the predominant TEAP. When ground water at the well was sampled in June 1991 prior to the decrease in benzene con centrations, the hydrogen concentration (5.4 nM) indicated that the predominant TEAP was metha- nogenesis (fig. 22B). The lack of measurable sul fate in the ground water provided supporting evidence that methanogenesis was the predomi nant TEAP (fig. 22C).
By July 8, 1992, the sulfate concentration had increased to 0.41 mg/L, and the hydrogen concentration had declined to 3 nM, suggesting
42 Remediation of Petroleum Hydrocarbon-Contaminated Ground Water in the Vicinity of a Jet-Fuel Tank Farm, Hanahan, South Carolina
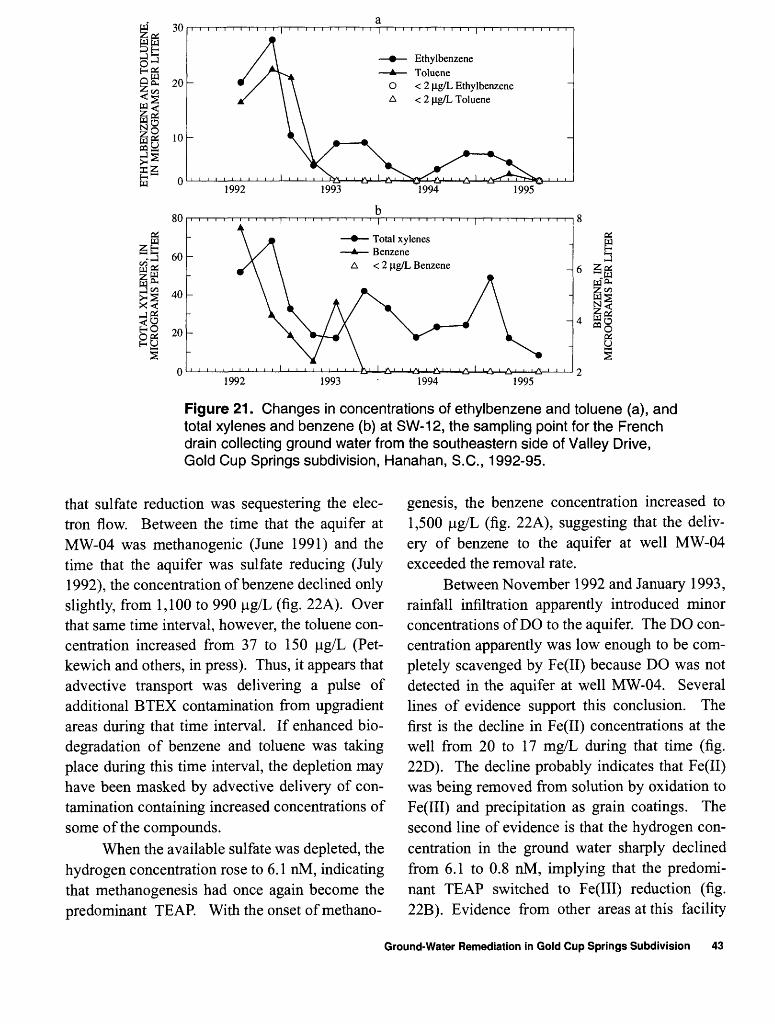
EthylbenzeneA TolueneO < 2 ng/L EthylbenzeneA < 2 ug/L Toluene
Total xylenesA BenzeneA < 2 ug/L Benzene
1992 1993 1995
Figure 21. Changes in concentrations of ethylbenzene and toluene (a), and total xylenes and benzene (b) at SW-12, the sampling point for the French drain collecting ground water from the southeastern side of Valley Drive, Gold Cup Springs subdivision, Hanahan, S.C., 1992-95.
that sulfate reduction was sequestering the elec tron flow. Between the time that the aquifer at MW-04 was methanogenic (June 1991) and the time that the aquifer was sulfate reducing (July 1992), the concentration of benzene declined only slightly, from 1,100 to 990 |ug/L (fig. 22A). Over that same time interval, however, the toluene con centration increased from 37 to 150 |ug/L (Pet- kewich and others, in press). Thus, it appears that advective transport was delivering a pulse of additional BTEX contamination from upgradient areas during that time interval. If enhanced bio- degradation of benzene and toluene was taking place during this time interval, the depletion may have been masked by advective delivery of con tamination containing increased concentrations of some of the compounds.
When the available sulfate was depleted, the hydrogen concentration rose to 6.1 nM, indicating that methanogenesis had once again become the predominant TEAR With the onset of methano
genesis, the benzene concentration increased to 1,500 |ug/L (fig. 22A), suggesting that the deliv ery of benzene to the aquifer at well MW-04 exceeded the removal rate.
Between November 1992 and January 1993, rainfall infiltration apparently introduced minor concentrations of DO to the aquifer. The DO con centration apparently was low enough to be com pletely scavenged by Fe(II) because DO was not detected in the aquifer at well MW-04. Several lines of evidence support this conclusion. The first is the decline in Fe(II) concentrations at the well from 20 to 17 mg/L during that time (fig. 22D). The decline probably indicates that Fe(II) was being removed from solution by oxidation to Fe(III) and precipitation as grain coatings. The second line of evidence is that the hydrogen con centration in the ground water sharply declined from 6.1 to 0.8 nM, implying that the predomi nant TEAP switched to Fe(III) reduction (fig. 22B). Evidence from other areas at this facility
Ground-Water Remediation in Gold Cup Springs Subdivision 43

ll
00
D)
3
32. o o 3
Q.
0)
10 10
-n
oT
CD
C
S"
CDg
®
CO
0)
O
5'3
£
-3S
o
ffS
§-~
?^S
o
CO
CO
O O
~ §
IRO
N (
H),
IN
MIL
LIG
RA
MS
PER
LIT
ER
SUL
FAT
E I
N
MIL
LIG
RA
MS
PER
LIT
ER
ON
oo
O
to
HY
DR
OG
EN
, IN
N
AN
OM
OL
ES
OS
BE
NZ
EN
E, I
N
MIC
RO
GR
AM
S PE
R L
ITE
RH
-
H-
(0
0)
<-H
(D

has demonstrated that oxidation of Fe(II) to Fe(III) can cause the predominant TEAP to shift to iron reduction (Vroblesky and Chapelle, 1994).
Despite the apparent shift from methano- genic conditions to Fe(III)-reducing conditions and the potential for dilution of the contamination by rainwater infiltration between November 1992 and January 1993, the benzene concentration in ground water at well MW-04 declined only slightly (fig. 22A). The concentration was 1,500 fig/L under methanogenic conditions in November 1992 and 1,300 fig/L at the onset of Fe(III)-reducing conditions in January 1993. Thus, dilution of the benzene contamination by rainwater infiltration during this time was consid ered to be minimal. The persistence of high ben zene concentrations three months later implies that benzene was not being degraded under Fe(III)-reducing conditions. The apparent lack of benzene degradation under Fe(III)-reducing con ditions is consistent with laboratory findings that benzene degradation was not observed under Fe(III)-reducing conditions in the absence of an iron chelator (Lovley and others, 1994b).
A marked change in microbial metabolism took place in June 1993, however. As the avail able Fe(III) apparently was depleted, the hydro gen concentration in ground water at well MW-04 increased to 1.2 nM, implying that sulfate reduc tion had become the predominant TEAP (fig. 22B). Sulfate reduction remained the predomi nant TEAP until January 1994. During the time that sulfate reduction was the predominant TEAP, benzene concentrations substantially declined (fig- 22A).
The data suggest that when sulfate reduction was the predominant TEAP in 1993, benzene removal mechanisms outpaced the rate at which benzene was being delivered to the site by advective ground-water transport. The observed decline in benzene concentrations under sulfate- reducing conditions is consistent with laboratory results (Lovley and others, 1995) that showed the capability of sulfate-reducing bacteria to anaerobically mineralize benzene. In the field and laboratory observations, the capacity for rapid
anaerobic benzene uptake was associated with a shift from Fe(III) reduction to sulfate reduction. It is yet to be determined whether this TEAP shift promotes benzene degradation and, if so, what factors associated with the shift promote benzene degradation.
Hydraulic Remediation
In addition to the line of extraction wells on the facility that intercepted contaminated ground water prior to being transported offsite, extrac tion-well EW-18 (pi. 1), in Gold Cup Springs sub division, provided a mechanism for hydraulic capture of contaminated ground water further downgradient. Some effects of well EW-18 can be seen in the changing ground-water quality observed at well MWGS-22, east of well EW-18. Following start-up of extraction-well EW-18, the BTEX concentrations in MWGS-22 declined (fig. 23). The decline was sharpest for benzene and ethylbenzene (fig. 23A), decreasing from concen trations between 230 to 430 jig/L to concentra tions ranging from 40 to 260 fig/L, respectively. Toluene and total xylene concentrations also showed general decreases, although part of the toluene decrease took place prior to operation of well EW-18 (fig. 23B).
The benzene and ethylbenzene concentra tions decreased rapidly soon after start-up. Occa sional short-term increases in concentrations indicated that pulses of contamination continued to be released from upgradient contamination sources; however, the overall trend in contami nant concentration was downward. Thus, the data indicate that operation of extraction-well EW-18 decreased the ground-water-contaminant concen tration in the vicinity of well MWGS-22.
In contrast to the apparent effectiveness of EW-18 for removal of contaminated ground water in its immediate vicinity, the operation of EW-18 appears to have had little noticeable effect on the contaminant concentrations discharging to surface water downgradient from EW-18 at surface- water-collection-site SW-09 (pi. 1). Although only one time point for SW-09 was available
Ground-Water Remediation in Gold Cup Springs Subdivision 45

o JH OSQ g<ioo 5
38
Benzene
A- Ethylbenzene
1990 1991 1992 1993 1994 1995
Figure 23. Benzene and ethylbenzene (a), and total xylenes and toluene (b) in ground water at well MWGS-22, Defense Fuel Supply Point, Hanahan, B.C., 1990-95.
prior to EW-18 start-up, no rapid change in con centration at SW-09 was noted following start-up of EW-18 (Petkewich and others, in press). Pulses of contamination continued to discharge at the sampling point as late as 1994. The probable explanation is that the sampling point at SW-09 is the discharge pipe for a drain that collects water from near Valley Drive and is connected to a drainage system south of Valley Drive (upgradient from well EW-18). Because a large fraction of the discharging water at SW-09 was derived from upgradient of EW-18, it is not surprising that the operation of EW-18 had little effect on concentra tions in the discharging water.
A decrease in contaminant concentrations discharging from ground water to surface water was observed, however, at surface-water site SW-01 (pi. 1) downgradient from the extraction wells north of tank 2. The dominant BTEX constituent at SW-01 was total xylenes. In the months following start-up of the tank-2 extraction wells, the concentration of total xylenes at SW-01
decreased from 36 jag/L (prior to start-up in January 1992) to 25 jag/L in April 1992 and 13 jag/L in July 1992 (Petkewich and others, in press).
CONCLUSIONS
The surficial aquifer beneath the Defense Fuel Supply Point in Hanahan, S.C., contained ground water contaminated with petroleum hydrocarbons. The principle contaminants were BTEX compounds. The USGS, in cooperation with the U.S. Department of Defense, investigated the potential for in s/ta bioremediation of the ground-water contamination.
During the course of the investigation, sev eral factors were identified to affect contaminant movement and remediation at the facility. At well MWGS-32A, rainwater infiltration temporarily diluted the ground-water contamination, while recharging water in a contaminant-source area
46 Remediation of Petroleum Hydrocarbon-Contaminated Ground Water in the Vicinity of a Jet-Fuel Tank Farm, Hanahan, South Carolina

upgradient from well MWGS-32A leached con taminants out of the soil zone and increased con taminant concentrations in the ground water. Seasonal differences in ground-water levels locally changed ground-water flow directions and changed the locations of gaining and losing reaches of the stream immediately east of the facility. The presence of a gaining reach adjacent to areas of ground-water contamination in the facility and a losing reach further downstream implies the possibility that ground-water contami nation from the facility could discharge to the stream, be transported downstream, and enter the aquifer at a new point in the losing reach.
Exploratory drilling north of tank 1 showed that a petroleum spill in an area containing dis continuous clay layers can result in free-phase fuel becoming stratigraphically trapped beneath the water table. Because the petroleum was iso lated beneath clay layers, advective transport of nutrients to the contaminated horizon was limited. Thus, the JP-4 at tank 1 was relatively unweath- ered compared to the free-phase fuel present in the tank 3 basin. Moreover, the presence of an overlying clay layer made delivery of nutrients to the contaminated horizon impractical north of tank 1 using the infiltration-gallery approach in operation at the facility.
The chemical factors influencing biodegra- dation of the contamination were related to the type and amount of electron acceptors available for microbial activity. Because the most efficient electron acceptors typically were depleted in the contaminated horizons, relatively inefficient elec tron-accepting processes, such as sulfate reduc tion and methanogenesis, tended to dominate at the most contaminated zones. However, introduc tion of more efficient electron acceptors, such as oxygen or nitrate, by rainwater infiltration or arti ficial recharge could allow the predominant elec tron accepting activity to shift to oxygen or nitrate reduction, increasing the biodegradation efficiency.
The investigation involved design, opera tion, and monitoring of an engineered ground- water-remediation system that utilized bioremedi-
ation and hydraulic-remediation approaches. The bioremediation system involved delivering nitrate- and oxygen-amended water to the con taminated aquifer through infiltration galleries. The hydraulic controls involved contaminated- water removal by extraction wells in addition to the hydraulic effects associated with injecting water from the infiltration galleries.
Substantial decreases in ground-water-con taminant concentrations were observed during the operation of the remediation system. In the shal low surficial aquifer north of tank 3 at wells MWGS-32A and MWGS-33A, BTEX concentra tions decreased from greater than 1,000 jag/L prior to operation of the system to less than 100 jag/L during operation. Ground-water con tamination persisted in parts of the aquifer not affected by the infiltration-gallery water, such as in the deeper part of the surficial aquifer (about 16-30 ft bis) north of tank 3, and in source areas upgradient from the remediation system that con tinued to leach occasional hydrocarbon pulses to the aquifer.
Laboratory and field evidence support the conclusion that bioremediation was an important removal mechanism for the ground-water con tamination. The laboratory studies measured microbial degradation potential and rates using sediment collected from the study area. The field evidence included monitoring microbially active constituents in ground-water. Sharp decreases in toluene, ethylbenzene, and total xylene concentra tions at extraction-well EW-11 accompanied the arrival of nitrate injected upgradient from the well. The chloride and DIG concentrations and NO3/C1 ratios at extraction-well EW-11 suggested that the engineered addition of nitrate to the ground water allowed the native microbial com munity to initiate nitrate reduction, which contrib uted to contaminant-concentration decreases.
Ground-water remediation at several wells on the facility appeared to be the result of both engineered bioremediation and hydraulic remedi ation. These wells include MW-12, MW-12A, MWGS-32A, MWGS-33A, and MWGS-41A. Hydraulic control was the principle engineered
Conclusions 47

remediation aspect used north of tank 1 because localized shallow clay layers restricted downward movement of nutrient-amended infiltration-gal lery water to target areas. The hydraulic remedi ation in that area allowed mobilization and capture of stratigraphically trapped free-phase fuel.
Hydraulic effects of the remediation can be seen in other areas in the facility as well. Within a few months following the start-up of extraction- well EW-02, the concentrations of BTEX in ground water at nearby well MW-07 declined from greater than 100 ng/L to less than 50 ng/L, and by the end of this investigation (September 1995), the BTEX concentrations at well MW-07 were below detection limits (2 |ag/L for benzene, toluene, and ethylbenzene, and 4 ng/L for total xylenes). Increasing BTEX concentrations at extraction wells, such as EW-02, following start up indicated that the wells were capturing contamination.
In general, concentrations of ground-water contaminants also decreased in Gold Cup Springs subdivision during this investigation. After approximately 3 years of using engineered hydraulic remediation north of tank 1, the BTEX concentrations had declined by about 60 percent at wells PW-02 and MWGS-22 and by more than 80 percent at well MW-04. Although occasional pulses of dissolved contamination from the tank 1 source area continued to migrate through the sub division, the operation of extraction-well EW-18 in Gold Cup Springs subdivision resulted in a general decrease in BTEX concentrations at nearby well MWGS-22.
Although it is difficult to differentiate the water-quality changes resulting from hydraulic remediation relative to bioremediation in ground water beneath the subdivision north the facility, both were shown to be important contaminant- depletion mechanisms in upgradient areas, and the data imply that both were active influences on ground-water quality near down-gradient areas as well. The laboratory evidence included observed biodegradation in microcosms using sediment from the subdivision. Field evidence included
loss of sulfate along flowpaths (as evidenced by changes in the SO4/C1 ratio) and biodegradation rates calculated from toluene disappearance along flowpaths. Decreases in contaminant concentra tions north of tanks 2 and 3 were observed at ground-water-discharge points (SW-01 and SW-12) following operation of the remediation system.
Free-phase jet fuel in ground water upgradi ent from the remediation system (north of tanks 1 and 3) continued to release dissolved petroleum hydrocarbons. At times, the releases apparently were sufficient to allow contaminant migration past the engineered remediation system and into the subdivision. The data from this investigation indicate that an approach combining engineered and natural bioremediation and hydraulic remedi ation can be effective in removing petroleum hydrocarbon contamination from ground water, but attaining maximum effectiveness of the sys tem requires removal of the free-phase fuel.
SELECTED REFERENCES
Aelion, C.M., and Bradley, P.M., 1991, Aerobic biodegradation potential of subsurface micro organisms from a jet fuel-contaminated aquifer: Applied and Environmental Microbi ology, v. 57, p. 57-63.
Beller, H.R., Reinhard, Martin, and Grbic-Galic, Dunja, 1992, Metabolic by-products of anaer obic toluene degradation by sulfate-reducing enrichment cultures: Applied Environmental Microbiology, v. 58, p. 3192-3195.
Berry-Spark, K.L., Barker, J.F., Major, D., and Mayfield, C.I., 1986, Remediation of gaso line-contaminated ground waters - a con trolled experiment: in Proceedings, Petroleum Hydrocarbons and Organic Chemicals in Ground Water - Prevention, Detection, and Restoration, National Water Well Associa tion/American Petroleum Institute, Dublin, Ohio, p. 613-623.
48 Remediation of Petroleum Hydrocarbon-Contaminated Ground Water in the Vicinity of a Jet-Fuel Tank Farm, Hanahan, South Carolina

Bouwer, Herman, and Rice, R.C., 1976, A slug test for determining hydraulic conductivity of unconfmed aquifers with completely or par tially penetrating wells: Water Resources Research, v. 12, p. 432-428.
Bradley, P.M., Aelion, C.M., and Vroblesky, D.A., 1992, Influence of environmental factors on denitrification in sediment contaminated with JP-4 fuel: Ground Water, v. 30, no. 6, p. 843-848.
Bradley, P.M., Chapelle, F.H., and Vroblesky, D.A., 1993a, Effects of Pb and terminal-elec tron-accepting processes on organic acid concentrations in contaminated aquifer sedi ments: Proceedings of the 7th Toxic Sub stances Hydrology (Toxics) Technical Meeting, sponsored by U.S. Geological Sur vey, September 20-24, 1993, Colorado Springs, CO.
Bradley, P.M., Chapelle, F.H., and Vroblesky, D.A., 1993b, Does lead affect microbial metabolism in aquifer sediments under differ ent terminal electron accepting conditions?: Geomicrobiology Journal, v. 11, p. 85-94.
Chapelle, F.H., Bradley, P.M., Lovley, D.R., and Vroblesky, D.A., 1996, Measuring rates of biodegradation in a contaminated aquifer using field and laboratory methods: Ground Water, v. 34, no. 4, p. 691-698.
Chapelle, F.H., and Lovley, D.R., 1990, Hydrogen concentrations in ground water as an indica tor of bacterial processes in deep aquifer sys tems: in Proceedings of the First International Symposium on the Microbiology of the Deep Subsurface, U.S. Environmental Protection Agency, Orlando, Florida.
1992, Competitive exclusion of sulfate reduction by Fe(III)-reducing bacteria: A mechanism for producing discrete zones of high-iron ground water: Ground Water, v, 30, p. 29-36.
Chapelle, F.H., and McMahon, P.B., 1991, Geochemistry of dissolved inorganic carbon in a coastal plain aquifer: Sulfate from confin ing beds as an oxidant in microbial CO2 pro duction, Journal of Hydrology, v. 127, p. 85-108.
Chapelle, F.H., McMahon, P.B., Dubrovsky, N.M., Fujii, R.F., Oaksford, E.T., and Vrob lesky, D.A., 1995, Deducing the distribution of terminal electron-accepting processes in hydrologically diverse ground water sys tems: Water Resources Research, v. 31, no 2., p. 359-371.
Conrad, R., Lupton, F.S., and Zeikus, J.G., 1987, Hydrogen metabolism in a mildly acidic lake sediment (Lake Mendota): FEMS Microbiol ogy and Ecology, v. 45, p. 107-115.
Dames & Moore, Inc., 1982, Environmental hydrogeological study, project CHS 80-16, Defense Fuel Support Point, Charleston, South Carolina: Consultant's report to Defense Fuel Supply Center, August 24, 1982, 49 p.
Daubel, K.J., 1984, Water quality biological study no. 32-24-0592-85, Gold Cup Lake Develop ment surface-water contamination, Defense Fuel Support Point, Charleston, South Caro lina: Letter report to the Director of the Defense Logistics Agency, July 16-17, 1984, 8 p.
Edwards, E.A., and Grbic-Galic, Dunjab, 1992, Complete mineralization of benzene by aqui fer microorganisms under strictly anaerobic conditions: Applied and Environmental Microbiology, v. 60, p. 313-322.
Evans, P.J., Mang, D.T., and Young, L.Y., 1991, Degradation of toluene and m-xylene and transformation of o-xylene by denitrifying enrichment cultures: Applied and Environ mental Microbiology, v. 57, p. 450-454.
Gersberg, R.M., Dawsey, W.J., Bradley, M.D., 1991, Biodegradation of monoaromatic hydrocarbons in ground water under denitri fying conditions: Bulletin of Environmental Contaminant Toxicology, v. 47, p. 230-237.
Selected References 49

Gersberg, R.M., Korth, K.G., Rice, L.E., Randall, J.D., Bogardt, A.H., Dawsey, W.J., and Hem- mingsen, B.B., 1995, Chemical and microbial evaluation of in situ bioremediation of hydro carbons in anoxic ground water enriched with nutrients and nitrate: World Journal of Micro biology & Biotechnology, v. 11, p. 549-558.
Gohn, G.S., Higgins, B.B., Smithe, C.C., and Owens, J.P., 1977, Lithostratigraphy of the deep corehole (Clubhouse Crossroads Core- hole 1) near Charleston, S.C., in Rankin, D.W. ed., Studies related to the 1886 Charles ton SC earthquake - A preliminary Report, U.S. Geological Survey Professional Paper 1028-E,p. 59-70.
Haag, Franziska, Reinhard, Martin, and McCarty, P.L., 1991, Degradation of toluene and /?-xylene in anaerobic microcosms - evidence for sulfate as a terminal electron acceptor: Environmental Toxicology and Chemistry, v. 10, p. 1379-1389.
Hach Company, 1983, Water Analysis Handbook: Loveland, Colorado, Hach Company, 689 p.
Holmer, Marianne, and Kristensen, Erik, 1994, Coexistence of sulfate reduction and methane production in an organic-rich sediment: Marine Ecology, Progress Series 107, v. 1-2, p. 177-184.
Hutchins, S.R., 1991, Biodegradation of monoar- omatic hydrocarbons by aquifer microorgan isms using oxygen, nitrate, or nitrous oxide as the terminal electron acceptor: Applied and Environmental Microbiology, v. 57, p. 2403-2407.
Hutchins, S.R., and Wilson, J.T., 1991, Labora tory and field studies on BTEX biodegrada- tion in a fuel-contaminated aquifer under denitrifying conditions, in, in situ Biorecla- mation, eds. Hinchee, R.E., and Olfenbuttel, R.F., Butterworth-Heinemann, Boston, MA, p. 157-172.
Kimberlin, D.K., and Trimmell, M.L., 1988, Uti lization of optoelectronic sensing to deter mine hydrocarbon thicknesses within confined aquifers, in Proceedings of the Con ference on Petroleum Hydrocarbons and
Organic Chemicals in Ground Water - Pre vention, Detection and Restoration, National Water Well Association and American Petro leum Institute, November 9-11, 1988, Hous ton, Texas, p. 255-274.
Lovley, D.R., and Goodwin, Steve, 1988, Hydro gen concentrations as an indicator of the predominant terminal electron-accepting reactions in aquatic sediments: Geochimica et Cosmochimica Acta, v. 52, p. 2993-3003.
Lovley, D.R., Chapelle, F.H., and Woodward, J.C., 1994a, Use of dissolved H2 concentra tions to determine distribution of microbially catalyzed redox reactions in anoxic ground water: Environmental Science & Technol ogy, v. 28, no. 7, p. 1205-1210.
Lovley, D.R., Woodward, J.C., and Chapelle, F.H., 1994b, Stimulated anoxic biodegrada- tion of aromatic hydrocarbons using Fe(III) ligands: Nature, v. 370, p. 128-131.
Lovley, D.R., Coates, J.D., Woodward, J.C., and Phillips, E.J.P., 1995, Benzene oxidation cou pled to sulfate reduction: Applied and Environmental Microbiology, v. 61, no. 3, p. 953-958.
Madsen, E.L., 1991, Determining in situ biodeg- radation - Facts and challenges: Environ mental Science & Technology, v. 25, p. 1663-1673.
McClelland Engineers, Inc., 1987a, Final report, confirmation study, characterization step, Defense Fuel Support Point, Charleston, South Carolina: Consultant's Report to South ern Division Naval Facilities Engineering Command, March 1987, 39 p.
1987b, Addendum #1, confirmation study, characterization step, Defense Fuel Support Point, Charleston, South Carolina: Consult ant's Report to Southern Division Naval Facilities Engineering Command, May 1987, 24 p.
McMahon, P.B., Vroblesky, D.A., Bradley, P.M., and Chapelle, F.H., 1995, Evidence for enhanced mineral dissolution in organic-acid rich shallow ground water: Ground Water, v. 33, no. 2, p. 207-216.
50 Remediation of Petroleum Hydrocarbon-Contaminated Ground Water in the Vicinity of a Jet-Fuel Tank Farm, Hanahan, South Carolina

Meadows, J.K., 1987, Ground-water conditions in the Santee Limestone and Black Mingo For mation near Moncks Corner, Berkeley County, South Carolina: South Carolina Water Resources Commission Report 156, 38 p.
Mihelcic, James, and Luthy, R.G., 1988, Degrada tion of polycyclic aromatic hydrocarbon com pounds under various redox conditions in soil-water systems: Applied and Environmen tal Microbiology, v. 54, p. 1182-1187.
National Oceanic and Atmospheric Administra tion, 1995, Climatological data annual sum mary, South Carolina, 1994: v. 97, no. 13, 26 p.
Newcome, Roy, Jr., 1989, Ground-water resources of South Carolina's Coastal Plain 1988, an overview: South Carolina Water Resources Commission Report No. 167, 127 p.
1993, Pumping tests of the Coastal Plain aquifers in South Carolina: South Carolina Water Resources Commission Report 174, 52 p.
Odermatt, J.R., 1994, Natural chromatographic separation of benzene, toluene, ethylbenzene, and xylenes (BTEX compounds) in a gasoline contaminated ground water aquifer: Organic Geochemistry, v. 21, no. 10, p. 1141-1150.
Pardieck, D.L., Bouwer, E.J., and Stone, A.T., 1992, Hydrogen peroxide use to increase oxi- dant capacity for in situ bioremediation of contaminated soils and aquifers - a review: Journal of Contaminant Hydrology, v. 9, p. 221-242.
Park, A.D., 1985, The ground-water resources of Charleston, Berkeley, and Dorchester Coun ties, South Carolina: South Carolina Water Resources Commission Report 139, 146 p.
Petkewich, M.D., Vroblesky, D.A., Robertson, J.F., and Bradley, P.M., in press, Water-qual ity, water-level, and lake-bottom-sediment data collected from the Defense Fuel Supply Point and adjacent properties, Hanahan, South Carolina, 1990-96: U.S. Geological Survey Open-File Report 96-488.
Rabus, Ralf, Nordhaus, Ralph, Ludwig, Wolf gang, and Widdel, Friedrich, 1993, Complete oxidation of toluene under strictly anoxic conditions by a new sulfate-reducing bacte rium: Applied and Environmental Microbiol ogy, v. 59, p. 1444-1451.
RMT, Inc., 1987, Final report, off-site air moni toring and data collection, Defense Fuel Sup ply Point, Charleston, South Carolina: Consultant's report to Defense Fuel Supply Center, July 1987, 33 p.
1988a, Final Report, aquifer evaluation, Defense Fuel Supply Point, Charleston, South Carolina: Consultant's report to Defense Fuel Supply Center, January 1988, 22 p.
1988b, Final Report, remedial alterna tives report, Defense Fuel Supply Point, Charleston, South Carolina: Consultant's report to Defense Fuel Supply Center, February 1988, 44 p.
1989a, Monitoring well installation report, Defense Fuel Supply Point, Charleston, South Carolina: Consultant's report to Southern Division Naval Facilities Engineering Com mand, Charleston, South Carolina, August 1989, 9 p.
1989b, Monitoring well inventory report, Defense Fuel Supply Point, Charleston, South Carolina: Consultant's report to Southern Division Naval Facilities Engineering Com mand, Charleston, South Carolina, September 1989, 8 p.
1989c, Round 1 analytical report, Defense Fuel Supply Point, Charleston, South Caro lina: Consultant's report to Southern Division Naval Facilities Engineering Command, Charleston, South Carolina, September 1989, 10 p.
1989d, JP-4 remediation at the Defense Fuel Supply Point, Charleston, South Caro lina: Consultant's report to Southern Division Naval Facilities Engineering Command, Charleston, South Carolina, 118 p.
Selected References 51

1990, Round 2 analytical report, Defense Fuel Supply Point, Charleston, South Caro lina: Consultant's report to Southern Division Naval Facilities Engineering Command, Charleston, South Carolina, January 1990, 29 p.
-1991, Operations and maintenance manual, ground-water remediation system, Defense Fuel Supply Point Site, Charleston, South Carolina, 19 p.
Schocher, R.J.; Seyfried, Birgit; Vazquez, Fran cisco; and Zeyer, Josef, 1991, Anaerobic deg radation of toluene by pure cultures of denitrifying bacteria: Archives of Microbiol ogy, v. 157, p. 7-12.
Science Applications International Corporation, 1985, Installation restoration program, Phase II ~ Confirmation/quantification, stage 1, Charleston Air Force Base, South Carolina: Consultants report to Military Airlift Com mand, Scott AFB, Illinois, p. 4-20.
Sheehan, P.J., Schneiter, R.W., and Gersberg, R.M., 1988, Bioreclamation of gasoline-con taminated ground water without oxygen addi tions: in Proceedings of the Second National Outdoor Action Conference on Aquifer Res toration, Ground Water Monitoring and Geo physical Methods, National Water Well Association, Dublin, Ohio, p. 183-199.
Smolenski, W.J., and Suflita, J.M., 1987, Biodeg- radation of cresol isomers in anoxic aquifers: Applied and Environmental Microbiology v. 53, p. 710-716.
Stookey, L.L., 1970, FerroZine, a new spectro- photometric reagent for iron: Analytical Chemistry, v. 42, p. 779-781.
Sturnm, Werner, and Morgan, J.J., 1981, Aquatic chemistry (2d ed.), John Wiley & Sons, New York, 780 p.
Trimmell, M.L., 1987, Installation of hydrocar bon detection wells and volumetric calcula tions within a confined aquifer: Presented at the Petroleum Hydrocarbons and Organic Chemicals in Ground Water - Prevention, Detection and Restoration Conference and Exposition, National Water Well Association
and American Petroleum Institute, Houston, Texas.
U.S. Army Environmental Hygiene Agency, 1975, Water-quality geohydrologic consulta tion no. 24-020-76, Defense Fuel Support Point, Charleston, South Carolina, 12-13 November 1975, 31 p.
1977, Water-quality geohydrologic con sultation no. 24-0026-77, Defense Fuel Sup port Point, Charleston, South Carolina, November 1975-May 1977, 38 p.
1979, Biodegradation of fuel system icing inhibitor discharges from Defense Fuel Sup port Point oil/water separators: Water quality treatability study No. 32-24-0183-80, Octo ber 22- November 28, 1979, 24 p.
1980, Environmental quality survey no. 32-24-1651-81, Defense Fuel Support Point, Charleston, South Carolina, January 1980, 16 p.
1985, Environmental quality survey no. 32-24-1602-85, Defense Fuel Support Point, Charleston, South Carolina, 25-28 February 1985,28 p.
-1988, Environmental quality survey andspill plans, implementation review study no. 32-24-7070-88, Defense Fuel Support Point, Charleston, South Carolina, 1-5 February 1988, 13 p.
U.S. Environmental Protection Agency, 1983, Methods for chemical analysis of water and waste, EPA-600/4-79-020: U.S. Environmen tal Protection Agency, Washington, D.C.
1986, Test methods for evaluating solid waste, Physical/chemical methods, SW-846 (3rd ed.): U.S. Environmental Protection Agency, Washington, D.C., 1919 p.
1991, Maximum contaminant levels, in U.S. Code of Federal Regulations, Title 40, Part 141, National primary drinking water regulations: July 1, 1991.
1996, Drinking water regulations and health advisories: EPA 822-R-96-001, Febru ary 1996, 15 p.
52 Remediation of Petroleum Hydrocarbon-Contaminated Ground Water in the Vicinity of a Jet-Fuel Tank Farm, Hanahan, South Carolina
Vroblesky, D.A., Robertson, J.F., Fernandez, Mario, and Aelion, C.M., 1992, The perme able-membrane method of passive soil-gas collection: Sixth National Outdoor Action Conference, National Water Well Associa tion, May 5 to 13, 1992, Las Vegas, Nevada.
Vroblesky, D.A., and Chapelle, F.H., 1994, Tem poral and spatial changes of terminal electron accepting processes in a petroleum-hydrocar bon-contaminated aquifer and the signifi cance for contaminant biodegradation: Water Resources Research, v. 30, no. 5, p. 1561-1570.
Vroblesky, D.A., Robertson, J.F., and Rhodes, L.C., 1995, Stratigraphic trapping of shallow petroleum contamination: Ground-Water Monitoring and Remediation, Spring, 1995, p. 177-183.
Vroblesky, D.A., Bradley, P.M., and Chapelle, F.H., 1996, Influence of electron donor on the minimum sulfate concentration required for sulfate reduction in a petroleum hydrocarbon- contaminated aquifer: Environmental Science and Technology, v. 30, no. 4, p. 1377-1381
Ward, L.W, Blackwelder, B.W, Gohn, G.S., and Poore, R.Z., 1979, Stratigraphic revision of Eocene, Oligocene, and lower Miocene for mations of South Carolina: Geologic Notes, v. 23, no. 1, p. 2-23.
Wood, W.W., 1976, Guidelines for collection and field analysis of ground-water samples for selected unstable constituents: U.S. Geologi cal Survey Techniques of Water-Resources Investigations, book 1, chap. D2, 24 p.
Selected References 53

4
Remediatiol
lanahan, South
C D
) -»
3 ° Petroleum
Hy
lina
a 5
o tu o 6 0 i 3 5" 21 I O 1 i &> -t 5" 5 (D o' 5' f u c_ 2. Tl c 2. tu 3 Tl
tu I
law
ic i.
wui
ion u
uuui
i v
jcia
iio
iw
i u
i_/o
d V
CUK
JI i
vv
cuo
iii
oic
uic
u u
y m
e i
^.o
. vji
cuiu
yiv
^ai
oui
vcy
ai
11 ic
i_/c
icii
oc i
uci
uu|j|jiy
i
wnn,
Han
ahan
, S.
C.
[All
dept
hs a
re r
elat
ive
to l
and
surf
ace
datu
m;
PVC
, pol
yvin
yl c
hlor
ide;
SS,
sta
inle
ss s
teel
; eac
h re
spec
tive
wel
l clu
ster
, MW
GS-
23, M
WG
S-25
, an
d M
WG
S-26
occ
upie
s a
sing
le b
oreh
ole]
Wel
l id
entif
icat
ion
(fig-
1)
MW
GS-
5A
MW
GS-
20
MW
GS-
21
MW
GS-
22
MW
GS-
23A
MW
GS-
23B
MW
GS-
23C
MW
GS-
23D
MW
GS-
23E
MW
GS-
24A
MW
GS-
24B
MW
GS-
24C
MW
GS-
24D
MW
GS-
24E
MW
GS-
25A
MW
GS-
25B
MW
GS-
25C
Dat
e co
mpl
eted
6/21
/90
6/25
/90
6/25
/90
6/22
/90
8/24
/90
8/24
/90
8/24
/90
8/24
/90
8/24
/90
8/25
/90
8/25
/90
8/25
/90
8/25
/90
8/25
/90
8/25
/90
8/25
/90
8/25
/90
Cas
ing
diam
eter
(i
nche
s)
2 2 2 2 .25
.25
.25
.25
.25
.25
.25
.25
-
.25
.25
.25
.25
0.25
Cas
ing
mat
eria
l
PVC
PVC
PVC
PVC ss ss ss ss ss ss ss ss ss ss ss ss ss
Cas
ing
dept
h (f
eet)
28.0
20.0
20.0
25.0 7.8
12.8
17.8
22.8
27.8 7.8
12.8
17.8
22.8
27.8 7.8
12.8
17.8
Scre
ened
in
terv
al
dept
h (f
eet)
18.0
-28.
0
5.0
- 20
.0
5.0
- 20
.0
5.0
- 25
.0
7.6
-7.8
12.6
-12.
8
17.6
-17.
8
22.6
- 2
2.8
27.6
-27.
8
7.6
-7.8
12.6
-12.
8
17.6
-17.
8
22.6
- 2
2.8
27.6
- 2
7.8
7.6
- 7.
8
12.6
- 12
.8
17.6
-17.
8
Rra
x/p
l-W
ll C
IV w
l
pack
ed
inte
rval
de
pth
(fee
t)
16.0
-28.
0
3.0
- 20
.0
3.0
- 20
.0
3.0
- 25
.0
5.0
- 8.
6
10.0
- 13
.0
15.0
-28.
6
15.0
-28.
6
15.0
-28.
6
5.4
- 9.
8
10.0
- 1
4.0
15.0
-29.
8
15.0
-29.
8
15.0
-29.
8
5.8
-24.8
5.8
- 24
.8
5.8
-24.8
Ben
toni
te
inte
rval
de
pth
(fee
t)
13.5
-16.
0
1.0-
3.0
1.0-
3.0
1.0
-3.0
3.0
- 5.
0
8.6
- 10
.0
13.0
-15.
0
13.0
-15.
0
13.0
-15.
0
3.8
-5.4
9.8-
10.
0
14.0
-15.
0
14.0
-15.
0
14.0
-15.
0
3.8
-5.8
3.8
-5.8
3.8
-5.8

Tabl
e 1.
Con
stru
ctio
n de
tails
for o
bser
vatio
n w
ells
inst
alle
d by
the
U.S
. G
eolo
gica
l Sur
vey
at th
e D
efen
se F
uel S
uppl
y Po
int,
Han
ahan
, S
.C.-
Con
tinue
d
[All
dept
hs a
re r
elat
ive
to l
and
surf
ace
datu
m;
PVC
, pol
yvin
yl c
hlor
ide;
SS,
sta
inle
ss s
teel
; eac
h re
spec
tive
wel
l clu
ster
, MW
GS-
23, M
WG
S-25
, an
d M
WG
S-26
occ
upie
s a
sing
le b
oreh
ole]
D) cr
to _i U1
Wel
l id
entif
icat
ion
(fig.
D
MW
GS-
25D
MW
GS-
26A
MW
GS-
26B
MW
GS-
26C
MW
GS-
26D
MW
GS-
26E
MW
GS-
27A
MW
GS-
27B
MW
GS-
27C
MW
GS-
28A
MW
GS-
28B
MW
GS-
28C
MW
GS-
28D
MW
GS-
28E
MW
GS-
29A
MW
GS-
29B
MW
GS-
30A
MW
GS-
30B
Dat
e C
asln
g«
"«
tSS
8/25
/90
.25
8/25
/90
.25
8/25
/90
.25
8/25
/90
.25
8/25
/90
.25
8/25
/90
.25
7/24
/91
1
7/24
/91
1
7/24
/91
1
7/24
/91
1
7/24
/91
1
7/24
/91
1
7/24
/91
1
7/24
/91
1
9/1
1/91
2
9/11
/91
2
9/11
/91
2
9/11
/91
2
Cas
ing
mat
eria
l
ss SS ss ss ss ss
PVC
PVC
PVC
PVC
PVC
PVC
PVC
PVC
PVC
PVC
PVC
PVC
Cas
ing
dept
h (f
eet)
22.8 7.8
12.8
17.8
22.8
27.8
13.8
16.5
23.0
16.5
23.0
15.5
20.5
25.5
18.0
21.2
16.6
21.5
Scre
ened
in
terv
al
dept
h (f
eet)
22.6
-
7.6-
12.6
-
17.6
-
22.6
-
27.6
-
10.3
-
15.2
-
21.0
-
12.5
-
21.0
-
13.5
-
18.5
-
23.5
-
7.0
-
18.7
-
6.0-
19.0
-
22.8
7.8
12.8
17.8
22.8
27.8
13.3
16.0
22.0
16.0
22.0
15.0
19.5
24.5
17.0
20.7
16.0
21.0
Gra
vel-
pack
ed
inte
rval
de
pth
(fee
t)
5.8-
5.8-
5.8-
5.8
-
5.8-
5.8-
8.0-
14.5
-
17.0
-
10.5
-
19.0
-
10.0
-
14.7
-
15.0
-
4.0
-
18.3
-
4.0
-
17.8
-24.8
29.8
29.8
29.8
29.8
29.8
13.8
16.5
23.0
16.5
23.0
16.0
21.0
26.0
18.0
21.2
16.6
21.5
Ben
toni
te
inte
rval
de
pth
(fee
t)
3.8-
3.8-
3.8-
3.8
-
3.8
-
3.8-
5.9-
12.0
-
13.9
-
8.5-
16.0
-
8.0-
11.8
-
12.0
-
2.0
-
16.3
-
1.9-
16.3
-
5.8
5.8
5.8
5.8
5.8
5.8
8.0
14.5
17.0
10.5
19.0
10.0
14.7
15.0
4.0
18.3
4.0
17.8

I 0
1 jo
o>
3
CD
Remediation
of
Petroleum
Hydrocar
lan, South
Carolin
a o 6 o i 5' » Ground
Wal 5 5" CD o' 5' a CD C-
<D Tl
C 2. CD n CD i
Tab
le "
\. C
onst
ruct
ion
deta
ils fo
r obs
erva
tion
wel
ls in
stal
led
by th
e U
.S. G
eolo
gica
l H
anah
an,
S.C
.-C
ontin
ued
Surv
ey a
t the
Del
;ense
Fue
l Sup
p>ly
Poin
t,
[All
dept
hs a
re r
elat
ive
to l
and
surf
ace
datu
m;
PVC
, pol
yvin
yl c
hlor
ide;
SS,
sta
inle
ss s
teel
; ea
ch r
espe
ctiv
e w
ell
clus
ter,
MW
GS-
23, M
WG
S-25
, an
d M
WG
S-26
occ
upie
s a
sing
le b
oreh
ole]
Wel
l id
entif
icat
ion
(fig.
1)
NW
GS-
31A
MW
GS-
31B
MW
GS-
32A
MW
GS-
32B
MW
GS-
33A
MW
GS-
33B
MW
GS-
34A
MW
GS-
34B
MW
GS-
35
MW
GS-
36
MW
GS-
37
MW
GS-
38
MW
GS-
39
MW
GS-
40A
MW
GS-
40B
MW
GS-
41A
MW
GS-
41B
MW
GS-
42
Dat
e co
mpl
eted
10/2
2/91
10/2
2/91
12/1
8/91
12/1
8/91
12/1
8/91
12/1
8/91
12/1
8/91
12/1
8/91
2/26
/92
2/25
/92
2/28
/92
2/28
/92
2/28
/92
6/30
/92
6/30
/92
6/29
/92
6/29
/92
6/20
/94
Cas
ing
diam
eter
(i
nche
s)
2 2 2 2 2 2 2 2 4 4 4 4 4 2 2 2 2 2
Cas
ing
mat
eria
l
PVC
PVC
PVC
PVC
PVC
PVC
PVC
PVC
PVC
PVC
PVC
PVC
PVC
PVC
PVC
PVC
PVC
PVC
Cas
ing
dept
h (f
eet)
14.5
25.0
14.5
20.7
14.5
21.0
15.0
21.0
22.6
18.0
21.4
24.2
23.5
15.0
19.9
15.5
22.0
23.0
Scre
ened
in
terv
al
dept
h (f
eet)
4.5-
14.5
20.0
- 25
.0
4.5
- 14
.5
15.7
-20.
7
4.5
- 14
.5
16.0
-21.
0
5.0-
15.0
16.0
-21.
0
12.6
-22.
6
8.0-
18.0
11.4
-21.
4
14.2
- 2
4.2
13.5
-23.
5
5.0-
15.0
14.9
- 19
.9
5.5-
15.5
17.0
-22.
0
19.0
- 20
.5
21.0
-22.
5
Gra
vel-
pa
cked
in
terv
al
dept
h (f
eet)
3.5
- 14
.5
19.0
-25.
0
3.5
- 14
.5
13.0
-20.
7
2.5
- 14
.5
14.0
-21.
0
3.5-
15.0
14.0
-21.
0
12.2
-22.
6
6.0-
19.5
11.3
-21.
4
13.9
- 2
4.4
11.0
-23.
5
4.0-
15.0
14.0
- 19
.9
4.0-
15.5
14.0
- 22
.0
18.0
-23.
0
Ben
toni
te
inte
rval
de
pth
(fee
t)
1.5-
3.5
17.0
- 19
.0
1.5-
3.5
10.8
- 1
3.0
1.0-
2.5
11.0
-14.
0
1.5-
3.5
12.0
-14.
0
5.0-
12.
2
1.5-
6.0
9.3-
11.3
11.8
-13.
9
9.0-
11.0
3.0-
4.0
12.0
- 14
.0
3.0-
4.0
9.0
- 14
.0
0.0-
18.0
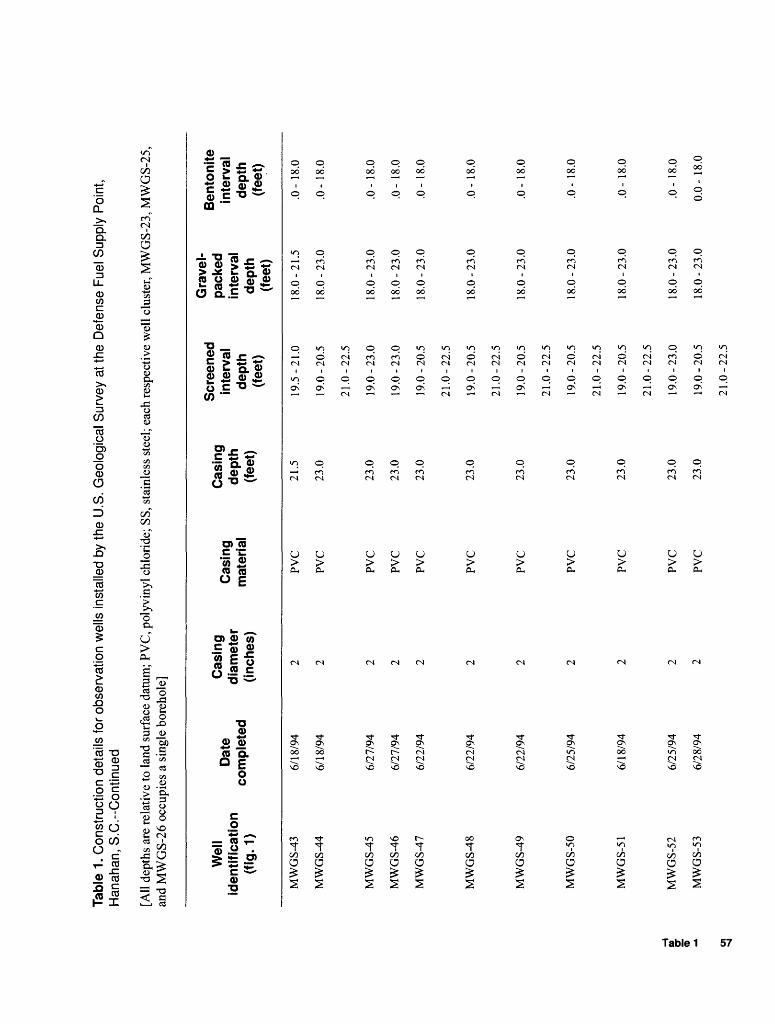
Tabl
e 1.
Con
stru
ctio
n de
tails
for o
bser
vatio
n w
ells
inst
alle
d by
the
U.S
. G
eolo
gica
l Sur
vey
at th
e D
efen
se F
uel S
uppl
y Po
int,
Han
ahan
, S
.C.--
Con
tinue
d
[All
dept
hs a
re r
elat
ive
to la
nd s
urfa
ce d
atum
; PV
C, p
olyv
inyl
chl
orid
e; S
S, s
tain
less
ste
el; e
ach
resp
ectiv
e w
ell
clus
ter,
MW
GS-
23, M
WG
S-25
, an
d M
WG
S-26
occ
upie
s a
sing
le b
oreh
ole]
Wel
l id
entif
icat
ion
(fig.
1)
MW
GS-
43
MW
GS-
44
MW
GS-
45
MW
GS-
46
MW
GS-
47
MW
GS-
48
MW
GS-
49
MW
GS-
50
MW
GS-
51
» M
WG
S-52
MW
GS-
53
Ol
ki
Dat
e ,C
asin
g .
. .
diam
eter
co
mpl
eted
(j
nche
s)
6/18
/94
2
6/18
/94
2
6/27
/94
2
6/27
/94
2
6/22
/94
2
6/22
/94
2
6/22
/94
2
6/25
/94
2
6/18
/94
2
6/25
/94
2
6/28
/94
2
Cas
ing
mat
eria
l
PVC
PVC
PVC
PVC
PVC
PVC
PVC
PVC
PVC
PVC
PVC
Cdep
tnh9
in*
(feet
)
21.5
19
.5
23.0
19
.0
21.0
23.0
19
.0
23.0
19
.0
23.0
19
.0
21.0
23.0
19
.0
21.0
23.0
19
.0
21.0
23.0
19
.0
21.0
23.0
19
.0
21.0
23.0
19
.0
23.0
19
.0
21.0
(ened
^£
*
Sn
dept
h 'e
i; (f
eet)
-21.
0 18
.0-2
1.5
-20.
5 18
.0-2
3.0
-22.
5
-23.
0 18
.0-2
3.0
-23.
0 18
.0-2
3.0
-20.
5 18
.0-2
3.0
-22.
5
-20.
5 18
.0-2
3.0
-22.
5
-20.
5 18
.0-2
3.0
-22.
5
-20.
5 18
.0-2
3.0
-22.
5
-20.
5 18
.0-2
3.0
-22.
5
-23.
0 18
.0-2
3.0
-20.
5 18
.0-2
3.0
-22.
5
Ben
toni
te
inte
rval
de
pth
(fee
t)
.0-1
8.0
.0-1
8.0
.0-1
8.0
.0-
18.0
.0-1
8.0
.0-1
8.0
.0-1
8.0
.0-1
8.0
.0-1
8.0
.0-1
8.0
0.0-
18.
0

I $
50)
00
3
D>̂̂
Remediation
of
Petroleum
Hydrocai
lan, South
Carolin
a O1 o 6
o i 5' i 0 o Q.
to 5 5' (0 o| ^ D> s n (0 i1 n D> 3
Tabl
e 1.
Con
stru
ctio
n de
tails
for o
bser
vatio
n w
ells
inst
alle
d by
the
U.S
. Geo
logi
cal
Han
ahan
, S.C
.-Con
tinue
dSu
rvey
at t
he D
efen
se F
uel S
uppl
y Po
int,
[All
dept
hs a
re r
elat
ive
to l
and
surf
ace
datu
m; P
VC
, pol
yvin
yl c
hlor
ide;
SS,
sta
inle
ss s
teel
; eac
h re
spec
tive
wel
l clu
ster
, MW
GS-
23, M
WG
S-25
, an
d M
WG
S-26
occ
upie
s a
sing
le b
oreh
ole]
Wel
l id
entif
icat
ion
(fig
.1)
MW
GS-
54
MW
GS-
55
MW
GS-
56
MW
GS-
57
MW
GS-
58
MW
GS-
59
MW
GS-
60
MW
GS-
61
MW
GS-
62
MW
GS-
63
WT-
01
WT
-02
WT
-03
WT
-04
Dat
e co
mpl
eted
6/28
/94
6/24
/94
6/28
/94
6/28
/94
6/29
/94
6/29
/94
6/29
/94
6/29
/94
6/23
/94
6/25
/94
2/12
/91
2/12
/91
2/13
/91
2/13
/91
Cas
ing
diam
eter
(i
nche
s)
2 2 2 2 2 2 2 2 2 2 2 2 2 2
Cas
ing
mat
eria
l
PVC
PVC
PVC
PVC
PVC
PVC
PVC
PVC
PVC
PVC
PVC
PVC
PVC
PVC
Cas
ing
dept
h (f
eet)
21.5
23.0
23.0
23.0
23.0
23.0
23.0
23.0
23.0
23.0 5.7
7.0
5.2
7.3
Scre
ened
in
terv
al
dept
h (f
eet)
19.5
-21.
0
19.0
- 20
.5
21.0
-22.
5
19.0
- 20
.5
21.0
-22.
5
19.0
-20.
5
21.0
-22.
5
19.0
-23.
0
19.0
-23.
0
19.0
-23.
0
19.0
-23.
0
19.0
-20.
5
21.0
-22.
5
19.0
-23.
0
3.2-
5.2
4.5
- 6.5
2.7-
4.7
4.8
- 6.8
Gra
vel-
pa
cked
in
terv
al
dept
h (f
eet)
18.0
-21.
5
18.0
-23.
0
18.0
-23.
0
18.0
-23.
0
18.0
-23.
0
18.0
-23.
0
18.0
-23.
0
18.0
-23.
0
18.0
-23.
0
18.0
-23.
0
2.0-
5.7
4.0
- 7.0
2.0-
5.2
3.0-
7.3
Ben
toni
te
inte
rval
de
pth
(fee
t)
.0-1
8.0
.0-1
8.0
.0-1
8.0
.0-
18.0
.0-1
8.0
.0-1
8.0
.0-
18.0
.0-1
8.0
.0-1
8.0
.0-1
8.0
1.0-
2.0
3.0
- 4.0
1.0-
2.0
2.0-
3.0

Tabl
e 1.
Con
stru
ctio
n de
tails
for
obs
erva
tion
wel
ls in
stal
led
by th
e U
.S.
Geo
logi
cal S
urve
y at
the
Def
ense
Fue
l Sup
ply
Poi
nt,
Han
ahan
, S
.C.-
Con
tinue
d
[All
dept
hs a
re r
elat
ive
to l
and
surf
ace
datu
m; P
VC
, pol
yvin
yl c
hlor
ide;
SS,
sta
inle
ss s
teel
; eac
h re
spec
tive
wel
l clu
ster
, MW
GS-
23, M
WG
S-25
, an
d M
WG
S-26
occ
upie
s a
sing
le b
oreh
ole]
Scr
eene
d G
rave
l" W
ell
n
. C
asin
g -
. C
asin
g sc
reen
ed
pack
ed
uaie
.
L/as
ino
inte
rval
.
identif
icatio
n
. .
. di
amet
er
. .
dept
h .
. in
terv
al
(fig
.1)
com
plet
ed
(jnch
es)
mat
eria
l (f
eet)
de
pth
dept
h
(eel)
(fee
t)
WT
-05
2/13
/91
2 P
VC
9.
9 7.4
-9.4
5.0
-9.9
WT
-06
2/
13/9
1 2
PV
C
7.0
4.5
-6.5
3.0
-7.0
WT
-07
2/
21/9
1 2
PV
C
6.5
4.0
-6.0
3.0
-6.5
WT
-08
2/21
/91
2 P
VC
4.
5 2.0
-4.0
1
.5-4
.5
WT
-09
2/
21/9
1 2
PV
C
4.5
2.0
-4.0
1
.5-4
.5
WT
-10
2/
22/9
1 2
PV
C
4.2
1.7
-3.7
1
.5-4
.2
WT
-11
9/13
/91
2 P
VC
11
.4
8.9
-10
.9
4.0
-11
.5
Ben
toni
te
inte
rval
de
pth
(fee
t)
3.0
-5.0
2.0
-3.0
2.0
-3.0
1.0
-1.5
1.0
-1.5
1.0
-1.5
2.0
-4.0
51
o- (D en
to

Table 2. Construction details for privately owned wells and monitoring wells installed during previous investigations in the vicinity of the Defense Fuel Supply Point, Hanahan, S.C.
[All depths are relative to land surface datum; , information not available; Depths of W-series, B-series, and PW wells based on tapedown measurements]
Well identification
(fig- D
MW-04
MW-05
MW-06
MW-07
MW-08
MW-09
MW-10
MW-11
MW-11A
MW-12(east)
MW-12A(west)
MW-15
MW-16
MW-17
MW-18
MW-19
W-001
W-002
W-003
W-103
W-105
W-107
W-108
Casing diameter (inches)
2
2
2
2
2
2
2
2
2
2
2
2
2
2
2
2
2
2
2
6
2
6
6
Casing depth (feet)
26.0
12.0
21.7
18.0
12.0
11.9
12.0
17.5
34.0
31.5
17.0
15.0
13.5
15.0
19.0
29.5
19.5
14.0
28.0
35.0
21.3
29.4
34.5
Screened interval depth
(feet)
6
2
1
.0-
.0-
.7-
8.0-
2
1
2
.0-
.9-
.0-
2.5-
26.5-
26.5-
7.
5.
3.
5.
9.
9.
0-
0-
5-
0-
0-
5-
~
--
~
26.0
12
21
18
12
11
12
17
31
31
17.
15.
13.
.0
.7
.0
.0
.9
.0
.5
.5
.5
0
0
5
15.0
19.0
19.5
Gravel-pack interval depth (feet)
4.4-
2
2
7
1
2
2
1
23
23
5.
3.
1.
3.
7.
6.
.3-
.0-
.5-
.6-
.0-
.2-
.0-
.0-
.0-
0-
0-
5-
0-
0-
5-
-
-
-
28.5
17.0
22.0
18.5
17.0
13.0
13.0
20.0
34.0
34.0
19.5
17.5
15.0
17.5
19.5
20.0
Bentonite interval depth (feet)
3.3
1.6
0.9
5.3
0.8
1.0
1.0
0.0
22.0
22.0
3.0
2.0
0.0
1.0-
4.5
4.8-
-
-
-
-4.4
-2.3
-2.0
-7.5
-1.6
-2.0
-2.2
-1.0
-23.0
-23.0
-5.0
-3.0
-1.5
-3.0
-7.0
-6.5
-
-
-
30-foot length
30-f
~
~
bot ler»gth
-
-
_
-
-
_
-
-
_
60 Remediation of Petroleum Hydrocarbon-Contaminated Ground Water in the Vicinity of a Jet-Fuel Tank Farm, Hanahan, South Carolina

Table 2. Construction details for privately owned wells and monitoring wells installed during previous investigations in the vicinity of the Defense Fuel Supply Point, Hanahan, S.C.--Continued
[All depths are relative to land surface datum; --, information not available; Depths of W-series, B-series, and PW wells based on tapedown measurements]
Well identification
(fig-1)
B-102
B-103
B-105
B-106
B-109
PW-01A
PW-01B
PW-02
PW-05
NWS- 12-1
NWS- 12-2
NWS- 12-3
NWS- 12-4
NWS- 12-5
NWS- 12-7
Casing diameter (inches)
6
6
6
6
6
1.5
1.5
1.5
1.5
2
2
2
2
2
2
Casing depth (feet)
33.2
33.2
34.1
34.1
33.3
16.5
17.9
15.0
19.4
20.0
18.0
12.0
13.0
13.0
38.0
Screened interval depth
(feet)
30-foot length
30-foot length
30-foot length
30-foot length
30-foot length
~
~
~
~
15.0-20.0
13.0-18.0
7.0- 12.0
8.0-13.0
8.0-13.0
8.0-38.0
Gravel-pack interval depth (feet)
--
~
--
--
~
~
~
--
--
13.0-20.0
11.0- 18.0
5.0- 12.0
6.0- 13.0
6.0- 13.0
5.0-38.0
Bentonite interval depth (feet)
~
~
~
~
~
~
~
-
~
-
~
~
--
~
3.0-5.0
Table 2 61