newtowncreek.infonewtowncreek.info/docs2/2 Remedial Investigation... · 0 1 2 3 4 Distance in Miles...
82
ATTACHMENT E METAL BIOAVAILABILITY AND SPECIATION SUPPORTING INFORMATION • Attachment E1a Comparison of In Situ, Pre- and Post-Toxicity Test AVS and SEM Data by Creek Mile • Attachment E1b Statistical Comparison between In Situ, Pre- and Post-Toxicity Test AVS and SEM Data (see separate Excel file) • Attachment E2 Metals Speciation Results
Transcript of newtowncreek.infonewtowncreek.info/docs2/2 Remedial Investigation... · 0 1 2 3 4 Distance in Miles...

ATTACHMENT E METAL BIOAVAILABILITY AND SPECIATION SUPPORTING INFORMATION
• Attachment E1a Comparison of In Situ, Pre- and Post-Toxicity Test AVS and SEMData by Creek Mile
• Attachment E1b Statistical Comparison between In Situ, Pre- and Post-ToxicityTest AVS and SEM Data (see separate Excel file)
• Attachment E2 Metals Speciation Results

ATTACHMENT E1A COMPARISON OF IN SITU, PRE- AND POST-TOXICITY TEST AVS AND SEM DATA BY CREEK MILE

0 1 2 3 4Distance in Miles
−800
−600
−400
−200
0
SE
M (
sum
med
)−A
VS
(µm
ol/g
)
DK WC MC EK/EB
^
ReferenceAreas
Notes: Non−detects included at method detection limit and plotted with an open symbolonly where all values used in calculation were non−detects. Data Bins: NCP2_SurfaceSediment_wKM_20151207.bin
Newtown CreekDutch KillsWhale CreekMaspeth CreekEnglish KillsEast Branch
In SituPre−TestPost−Test
Reference AreasGerritsen Creek (non−Ind/non−CSO)Head of Bay (Ind/non−CSO)
Spring Creek (non−Ind/CSO)Westchester Creek (Ind/CSO)
Figure E1-1Simultaneously Extracted Metals (Summed) − Acid Volatile Sulfide
in Study Area and Reference Areas − Phase 2Baseline Ecological Risk Assessment
Newtown Creek RI/FS
LHB/EG/CF − \\austin2\D_drive\Projects\Newtown_Creek\Data_Review\Sediment\IDL\surfsed_spatial_wallRefAreas_SEMonAVS_wPrePostTest_20150814.pro Thu Jan 21 10:19:28 2016

ATTACHMENT E1B STATISTICAL COMPARISON BETWEEN IN SITU, PRE- AND POST-TOXICITY TEST AVS AND SEM DATA
See separate Excel file

ATTACHMENT E2 METALS SPECIATION RESULTS

Photo by Bill Rhodes
METALS SPECIATION RESULTS REMEDIAL INVESTIGATION/FEASIBILITY STUDY, NEWTOWN CREEK
Prepared by Anchor QEA, LLC
123 Tice Boulevard, Suite 205
Woodcliff Lake, New Jersey 07677
October 2018

METALS SPECIATION RESULTS NEWTOWN CREEK RI/FS
Prepared by Anchor QEA, LLC
123 Tice Boulevard, Suite 205
Woodcliff Lake, New Jersey 07677
October 2018

Metals Speciation Results October 2018 Newtown Creek RI/FS i 181037-01.01
TABLE OF CONTENTS 1 INTRODUCTION .................................................................................................................. 1
2 METALS SPECIATION SAMPLES ....................................................................................... 1
2.1 Mineralogy ........................................................................................................................2
2.2 Sequential Extraction .......................................................................................................2
2.3 Electron Microprobe Data ...............................................................................................4
3 REFERENCES ........................................................................................................................ 6
List of Tables Table 1 Summary of Metals Speciation Samples and Analyses Table 2 Phase 2 Surface Sediment Triad Samples Mineralogy by X-Ray Diffraction Table 3 Phase 2 Surface Sediment Triad Samples Total Metals by X-Ray Fluorescence Table 4 Phase 1 Archived Core Samples Mineralogy by X-Ray Diffraction Table 5 Phase 1 Archived Cores Samples Total Metals by X-Ray Fluorescence Table 6 Phase 2 Surface Sediment Triad Sample Sequential Extraction Table 7 Phase 1 Archived Core Sample Sequential Extraction Table 8 Surface Sediment Duplicate Sample Reproducibility Table 9 Subsurface Sediment Duplicate Sample Reproducibility Table 10 Electron Microprobe Narrative Summary
List of Figures Figure 1 Selected Metals Speciation Stations Figure 2a Summary Data and Back-scatter Electron Maps for Station EK006 Points 1 and 2 Figure 2b Summary Data and Back-scatter Electron Maps for Station EK006 Points 3 and 4 Figure 2c Summary Data and Back-scatter Electron Maps for Station EK006 Points 5 and 6 Figure 2d Summary Data and Back-scatter Electron Maps for Station EK006 Points 7 and 8 Figure 2e Summary Data and Back-scatter Electron Maps for Station EK006 Points 9
and 10 Figure 2f Summary Data and Back-scatter Electron Maps for Station EK006 Points 11
and 12

Metals Speciation Results October 2018 Newtown Creek RI/FS ii 181037-01.01
Figure 2g Summary Data and Back-scatter Electron Maps for Station EK006 Points 13 and 14
Figure 3a Summary Data and Back-scatter Electron Maps for Station EK059 Points 3 and 4 Figure 3b Summary Data and Back-scatter Electron Maps for Station EK059 Point 5 Figure 4a Summary Data and Back-scatter Electron Maps for Station NC064 142 – 155 cm
Points 1 and 2 Figure 4b Summary Data and Back-scatter Electron Maps for Station NC064 142 – 155 cm
Points 3 and 4 Figure 4c Summary Data and Back-scatter Electron Maps for Station NC064 142 – 155 cm
Points 5 and 6 Figure 4d Summary Data and Back-scatter Electron Maps for Station NC064 142 – 155 cm
Points 7 and 8 Figure 4e Summary Data and Back-scatter Electron Maps for Station NC064 142 – 155 cm
Points 9 and 10 Figure 4f Summary Data and Back-scatter Electron Maps for Station NC064 142 – 155 cm
Points 11 and 12 Figure 4g Summary Data and Back-scatter Electron Maps for Station NC064 142 – 155 cm
Point 13 Figure 5a Summary Data and Back-scatter Electron Maps for Station NC070 15 – 25 cm
Point 1 Figure 5b Summary Data and Back-scatter Electron Maps for Station NC070 15 – 25 cm
Point 2 Figure 5c Summary Data and Back-scatter Electron Maps for Station NC070 15 – 25 cm
Point 4
List of Charts Chart 1 Station DK040 Sequential Extraction Results Chart 2 Station EB036 Sequential Extraction Results Chart 3 Station EK059 Sequential Extraction Results Chart 4 Station EK006 Sequential Extraction Results Chart 5 Station MC017 Sequential Extraction Results Chart 6 Station NC161 Sequential Extraction Results Chart 7 Station NC046 Sequential Extraction Results

Metals Speciation Results October 2018 Newtown Creek RI/FS iii 181037-01.01
Chart 8 Station NC293 Sequential Extraction Results Chart 9 Station WC012 Sequential Extraction Results Chart 10 Station DK004 15 – 25 cm Sequential Extraction Results Chart 11 Station DK004 45 – 55 cm Sequential Extraction Results Chart 12 Station DK004 135 – 145 cm Sequential Extraction Results Chart 13 Station NC054 15 – 25 cm Sequential Extraction Results Chart 14 Station NC054 167 – 180 cm Sequential Extraction Results Chart 15 Station NC054 295 – 307 cm Sequential Extraction Results Chart 16 Station NC064 15 – 25 cm Sequential Extraction Results Chart 17 Station NC064 81 – 91 cm Sequential Extraction Results Chart 18 Station NC064 142 – 155 cm Sequential Extraction Results Chart 19 Station NC070 15 – 25 cm Sequential Extraction Results Chart 20 Station NC070 85 – 95 cm Sequential Extraction Results Chart 21 Station NC070 125 – 136 cm Sequential Extraction Results Chart 22 Station NC079 15 – 25 cm Sequential Extraction Results Chart 23 Station NC079 75 – 85 cm Sequential Extraction Results Chart 24 Station NC079 150 – 160 cm Sequential Extraction Results

Metals Speciation Results October 2018 Newtown Creek RI/FS 1 181037-01.01
1 INTRODUCTION
Consistent with the Phase 2 Remedial Investigation Work Plan – Volume 1 (Phase 2 RI Work Plan Volume 1), Phase 2 Field Sampling and Analysis Plan – Volume 1 (Phase 2 FSAP Volume 1), and Phase 2 Quality Assurance Project Plan (Phase 2 QAPP), metals speciation work—including characterization of mineralogy, sequential extraction, and electron microprobe analysis of select samples—was performed on select Phase 2 benthic triad sediment samples, as well as Phase 1 archive sediment samples (Anchor QEA 2014a, 2014b, 2014c).
2 METALS SPECIATION SAMPLES
Phase 1 archive cores and Phase 2 benthic triad locations were selected as described in the Phase 2 RI Work Plan Volume 1 and Phase 2 FSAP Volume 1. The following are excerpts from Section 3.3.4.2 of the Phase 2 RI Work Plan Volume 1:
To evaluate metal speciation, archived Phase 1 subsurface sediment samples from five stations in the Study Area and from nine of the Phase 2 triad locations will be submitted for mineralogical analysis. The five archived Phase 1 locations are shown on Figure 3-5, with summary information provided in Table 3-6. These stations were selected to include elevated metals concentrations at multiple depths in different portions of the Study Area. In addition to the five sample locations, 9 of the 36 Phase 2 surface sediment triad locations are to be selected for mineralogical analysis; locations will be selected following review of the contaminant concentration data. Based on the results of the XRD analyses, a subset of samples will be selected for electron microprobe analysis and sequential extraction.

Metals Speciation Results October 2018 Newtown Creek RI/FS 2 181037-01.01
The following is an excerpt from Table B5-4 of the Phase 2 FSAP:
It is anticipated that seven sample intervals will be selected from each core for XRD analysis based on the Phase 1 data from the co-located core and the results of the X-ray fluorescence analysis. Following the XRD analysis, select samples will be submitted for EMPA and SX analysis.
Attachments:
Table 1 Summary of Metals Speciation Samples and Analyses Figure 1 Selected Metals Speciation Stations
2.1 Mineralogy
Samples were submitted to Activation Laboratories, Ltd., for mineral identification and quantification by X-ray diffraction, as described in the Phase 2 RI Work Plan Volume 1, Phase 2 FSAP Volume 1, and Phase 2 QAPP. Total metals were analyzed by fusion X-ray fluorescence in conjunction with X-ray diffraction as a quality assurance measure and are included in this report.
Attachments:
Table 2 Phase 2 Surface Sediment Triad Samples Mineralogy by X-Ray Diffraction Table 3 Phase 2 Surface Sediment Triad Samples Total Metals by X-Ray Fluorescence Table 4 Phase 1 Archived Core Samples Mineralogy by X-Ray Diffraction Table 5 Phase 1 Archived Cores Samples Total Metals by X-Ray Fluorescence
2.2 Sequential Extraction
Sequential extraction is designed to fractionate metals in a sample according to their reactivity/bioavailability by subjecting the sample to a sequence of progressively aggressive chemical treatments that target specific chemical forms. The sequential extraction results are tabulated and presented graphically for select metals, with comparison to the total metals concentrations reported for these samples in the composited triad samples.

Metals Speciation Results October 2018 Newtown Creek RI/FS 3 181037-01.01
Attachments:
Table 6 Phase 2 Surface Sediment Triad Sample Sequential Extraction Table 7 Phase 1 Archived Core Sample Sequential Extraction Table 8 Surface Sediment Duplicate Sample Reproducibility Table 9 Subsurface Sediment Duplicate Sample Reproducibility Chart 1 Station DK040 Sequential Extraction Results Chart 2 Station EB036 Sequential Extraction Results Chart 3 Station EK059 Sequential Extraction Results Chart 4 Station EK006 Sequential Extraction Results Chart 5 Station MC017 Sequential Extraction Results Chart 6 Station NC161 Sequential Extraction Results Chart 7 Station NC046 Sequential Extraction Results Chart 8 Station NC293 Sequential Extraction Results Chart 9 Station WC012 Sequential Extraction Results Chart 10 Station DK004 15 – 25 cm Sequential Extraction Results Chart 11 Station DK004 45 – 55 cm Sequential Extraction Results Chart 12 Station DK004 135 – 145 cm Sequential Extraction Results Chart 13 Station NC054 15 – 25 cm Sequential Extraction Results Chart 14 Station NC054 167 – 180 cm Sequential Extraction Results Chart 15 Station NC054 295 – 307 cm Sequential Extraction Results Chart 16 Station NC064 15 – 25 cm Sequential Extraction Results Chart 17 Station NC064 81 – 91 cm Sequential Extraction Results Chart 18 Station NC064 142 – 155 cm Sequential Extraction Results Chart 19 Station NC070 15 – 25 cm Sequential Extraction Results Chart 20 Station NC070 85 – 95 cm Sequential Extraction Results Chart 21 Station NC070 125 – 136 cm Sequential Extraction Results Chart 22 Station NC079 15 – 25 cm Sequential Extraction Results Chart 23 Station NC079 75 – 85 cm Sequential Extraction Results Chart 24 Station NC079 150 – 160 cm Sequential Extraction Results

Metals Speciation Results October 2018 Newtown Creek RI/FS 4 181037-01.01
2.3 Electron Microprobe Data
Electron microprobe analysis allows determination of grain-scale mineralogy and trace metal distribution to support interpretation of the sequential extraction data. Back-scatter electron (BSE) images were collected of the grains analyzed by the electron microprobe. Average atomic mass and brightness are positively correlated on a BSE image. Attachments
Table 10 Electron Microprobe Narrative Summary Figure 2a Summary Data and Back-scatter Electron Maps for Station EK006 Points 1 and 2 Figure 2b Summary Data and Back-scatter Electron Maps for Station EK006 Points 3 and 4 Figure 2c Summary Data and Back-scatter Electron Maps for Station EK006 Points 5 and 6 Figure 2d Summary Data and Back-scatter Electron Maps for Station EK006 Points 7 and 8 Figure 2e Summary Data and Back-scatter Electron Maps for Station EK006 Points 9 and 10 Figure 2f Summary Data and Back-scatter Electron Maps for Station EK006 Points 11
and 12 Figure 2g Summary Data and Back-scatter Electron Maps for Station EK006 Points 13
and 14 Figure 3a Summary Data and Back-scatter Electron Maps for Station EK059 Points 3 and 4 Figure 3b Summary Data and Back-scatter Electron Maps for Station EK059 Point 5 Figure 4a Summary Data and Back-scatter Electron Maps for Station NC064 142 – 155 cm
Points 1 and 2 Figure 4b Summary Data and Back-scatter Electron Maps for Station NC064 142 – 155 cm
Points 3 and 4 Figure 4c Summary Data and Back-scatter Electron Maps for Station NC064 142 – 155 cm
Points 5 and 6 Figure 4d Summary Data and Back-scatter Electron Maps for Station NC064 142 – 155 cm
Points 7 and 8 Figure 4e Summary Data and Back-scatter Electron Maps for Station NC064 142 – 155 cm
Points 9 and 10 Figure 4f Summary Data and Back-scatter Electron Maps for Station NC064 142 – 155 cm
Points 11 and 12

Metals Speciation Results October 2018 Newtown Creek RI/FS 5 181037-01.01
Figure 4g Summary Data and Back-scatter Electron Maps for Station NC064 142 – 155 cm Point 13
Figure 5a Summary Data and Back-scatter Electron Maps for Station NC070 15 – 25 cm Point 1
Figure 5b Summary Data and Back-scatter Electron Maps for Station NC070 15 – 25 cm Point 2
Figure 5c Summary Data and Back-scatter Electron Maps for Station NC070 15 – 25 cm Points 4

Metals Speciation Results October 2018 Newtown Creek RI/FS 6 181037-01.01
3 REFERENCES
Anchor QEA (Anchor QEA, LLC), 2014a. Phase 2 Remedial Investigation Work Plan – Volume 1. Final. Remedial Investigation/Feasibility Study, Newtown Creek. May 2014.
Anchor QEA, 2014b. Phase 2 Field Sampling and Analysis Plan – Volume 1. Final. Remedial Investigation/Feasibility Study, Newtown Creek. May 2014.
Anchor QEA, 2014c. Phase 2 Quality Assurance Project Plan. Final. Remedial Investigation/Feasibility Study, Newtown Creek. July 2014.

TABLES

Table 1Summary of Metals Speciation Samples and Analyses
Sample StationInterval
(centimeters)X‐Ray
DiffractionX‐Ray
FluorescenceSequential Extraction
Electron Microprobe
15 – 25 Y Y Y35 – 45 Y Y45 – 55 Y Y Y85 – 95 Y Y
105 – 115 Y Y135 – 145 Y Y Y185 – 195 Y Y15 – 25 Y Y Y90 – 100 Y Y155 – 167 Y Y167 – 180 Y Y Y212 – 225 Y Y295 – 307 Y Y Y363 – 375 Y Y15 – 25 Y Y Y25 – 34 Y Y81 – 91 Y Y Y
110 – 119 Y Y142 – 155 Y Y Y Y200 – 212 Y Y282 – 294 Y Y15 – 25 Y Y Y Y25 – 35 Y Y55 – 65 Y Y85 – 95 Y Y Y
115 – 125 Y Y125 – 136 Y Y Y206 – 216 Y Y15 – 25 Y Y Y25 – 35 Y Y45 – 55 Y Y75 – 85 Y Y Y85 – 95 Y Y
150 – 160 Y Y Y348 – 360 Y Y
Phase 1 Archive Subsurface Cores
NC079SC
NC070SC
NC064SC
NC054SC
DK004SC
Metals Speciation Results Newtown Creek RI/FS 1 of 2
October 2018181037-01.01

Table 1Summary of Metals Speciation Samples and Analyses
Sample StationInterval
(centimeters)X‐Ray
DiffractionX‐Ray
FluorescenceSequential Extraction
Electron Microprobe
DK040SG 15 – 25 Y YEB036SG 15 – 25 Y YEK006SG 15 – 25 Y Y Y YEK059SG 15 – 25 Y Y Y YMC017SG 15 – 25 Y Y YNC046SG 15 – 25 Y Y YNC161SG 15 – 25 Y Y YNC293SG 15 – 25 Y YWC012SG 15 – 25 Y Y Y
Notes:
Fusion X‐ray fluorescence (Activation Laboratories) was not performed on three benthic triad samples (DK040SG, EB036SG, and NC293SG) due to limited nitrogen atmosphere desiccated material.
Screening level X‐ray fluorescence was performed on the Phase 1 archive cores in 10‐centimeter (cm) intervals: DK004 15 – 195 cm; NC054 15 – 550 cm; NC064 15 – 433 cm; NC070 15 – 384 cm; and NC079 15 – 372 cm.
Phase 2 Benthic Triad Samples
Metals Speciation Results Newtown Creek RI/FS 2 of 2
October 2018181037-01.01

Table 2Phase 2 Surface Sediment Triad Samples Mineralogy by X‐Ray Diffraction
DK040 DK040SPEC‐000015‐20141111 29.8 22.2 4.6 2.6 ‐‐ U 2.0 1.4 19.0 5.9 0.8 6.5 ‐‐ U 5.2 ‐‐ U
EB036 EB036SPEC‐000015‐20141111 42.8 18.0 3.2 0.5 ‐‐ U 0.5 0.9 13.6 3.6 1.7 9.0 0.6 5.6 ‐‐ U
EK006 EK006SPEC‐000015‐20141111 28.0 31.2 4.5 1.7 1.1 1.0 1.7 10.0 11.2 ‐‐ U 4.3 ‐‐ U 3.3 2.0
EK059 EK059SPEC‐000015‐20141111 35.8 35.2 3.3 0.9 1.2 ‐‐ U 1.1 8.6 5.2 ‐‐ U 5.0 ‐‐ U 2.4 1.3
MC017 MC017SPEC‐000015‐20141111 33.0 27.9 2.0 2.6 1.5 ‐‐ U 1.0 13.3 6.8 ‐‐ U 8.6 1 2.3 ‐‐ U
NC046 NC161SPEC‐000015‐20141111 19.5 27.5 18.2 2.2 ‐‐ U 3.6 5.5 10.9 6.6 1.0 1.0 3 U 2.9 1.1
NC293 NC046SPEC‐000015‐20141111 25.0 28.6 13.8 2.3 ‐‐ U 4.3 6.0 7.5 6.0 0.5 1.8 0.3 2.7 1.2
NC161 NC293SPEC‐000015‐20141111 40.3 21.4 10.1 1.6 ‐‐ U 2.6 3.2 8.2 4.6 ‐‐ U 3.8 ‐‐ U 2.7 1.5
WC012 WC012SPEC‐000015‐20141111 20.0 27.6 15.2 2.3 ‐‐ U 4.0 5.1 12.2 7.5 ‐‐ U 1.6 ‐‐ U 3.5 1.0Notes: Minerals:Only detected minerals are shown. quartz = SiO2 calcite = CaCO3
1 = Surface sediment samples were collected from 0 to 15 centimeters. muscovite = KAl3Si3O10(OH)2 gypsum = CaSO4‐2(H2O)
% = percent biotite = K(Mg,Fe)3[AlSi3O10(OH,F)2 dolomite = CaMg(CO3)2U= nondetect amphibole = (Na,K)(Ca,Mg,Fe2+)2(Mg,Fe2+,Al3+,Fe3+)5(Si
4+,Al3+)8O22(OH)2 halite = NaClkaolinite = Al2Si2O5(OH)4 chlorite = (Fe, Mg, Al)3(Si, Al)4O10(OH)2(Mg, Fe, Al)3(OH)6plagioclase = (Na,Ca)AlSi3O8 pyrite = FeS2potassium feldspar = KAlSi3O8
Muscovite Plagioclase PyriteQuartzAmorphous Amphibole Biotite Calcite Chlorite Dolomite Gypsum HalitePotassium feldsparKaolinite
(%) (%) (%)(%)Station
ID Sample ID1 (%) (%) (%)(%)(%)(%) (%)(%) (%)(%)
Metals Speciation Results Newtown Creek RI/FS 1 of 1
October 2018181037-01.01

Table 3Phase 2 Surface Sediment Triad Samples Total Metals by X‐Ray Fluorescence
DK040 DK040SPEC‐000015‐20141111* ‐‐ ‐‐ ‐‐ ‐‐ ‐‐ ‐‐ ‐‐ ‐‐ ‐‐ ‐‐ ‐‐ ‐‐ ‐‐ ‐‐ ‐‐
EB036 EB036SPEC‐000015‐20141111* ‐‐ ‐‐ ‐‐ ‐‐ ‐‐ ‐‐ ‐‐ ‐‐ ‐‐ ‐‐ ‐‐ ‐‐ ‐‐ ‐‐ ‐‐
EK006 EK006SPEC‐000015‐20141111 43,000 14,500 616 40 U 2,380 43,200 11,300 302 566 2,920 12,600 231,000 18,800 3,480 134
EK059 EK059SPEC‐000015‐20141111 38,300 13,000 958 40 U 3,030 40,600 9,890 287 825 3,270 12,500 216,000 15,400 3,360 140
MC017 MC017SPEC‐000015‐20141111 38,800 28,400 137 40 U 359 36,500 15,700 263 149 2,140 13,400 186,000 17,700 3,720 84.0
NC046 NC046SPEC‐000015‐20141111 71,100 11,100 68.4 40 U 256 44,900 14,600 534 94.3 1,660 22,700 249,000 20,400 4,320 84.0
NC293 NC293SPEC‐000015‐20141111* ‐‐ ‐‐ ‐‐ ‐‐ ‐‐ ‐‐ ‐‐ ‐‐ ‐‐ ‐‐ ‐‐ ‐‐ ‐‐ ‐‐ ‐‐
NC161 NC161SPEC‐000015‐20141111 67,600 10,700 137 40 U 264 44,100 13,700 620 173 1,570 23,300 251,000 20,900 4,380 95.2
WC012 WC012SPEC‐000015‐20141111 69,100 9,650 137 40 U 296 42,200 14,600 457 165 1,310 23,300 244,000 23,900 4,440 106
Notes:1 = Surface sediment samples were collected from 0 to 15 centimeters.2 = Reported oxide concentrations converted to metals as mg/kg* = sample mass insufficient for fusion X‐ray fluorescence analysis.mg/kg = milligram per kilogramU = nondetect at method detection limit
(mg/kg) (mg/kg)(mg/kg) (mg/kg) (mg/kg) (mg/kg) (mg/kg) (mg/kg)Sodium Titanium Vanadium
(mg/kg) (mg/kg) (mg/kg) (mg/kg) (mg/kg) (mg/kg) (mg/kg)Magnesium Manganese Nickel Phosphorus Potassium Silicon
Station ID Sample ID1, 2IronAluminum Calcium Chromium Cobalt Copper
Metals Speciation ResultsNewtown Creek RI/FS 1 of 1
October 2018181037-01.01

Table 4Phase 1 Archived Core Samples Mineralogy by X‐Ray Diffraction
DK004BSPEC‐015025‐20140922 15 – 25 33.2 24.0 12.1 2.1 0.6 8.6 5.4 2.0 3.9 ‐‐ U ‐‐ U 1.7 3.3 2.4 ‐‐ U ‐‐ U 0.7DK004BSPEC‐035045‐20140922 35 – 45 43.5 27.3 8.1 1.0 0.9 5.2 3.6 1.9 2.4 ‐‐ 0.3 1.5 ‐‐ U 1.4 ‐‐ U ‐‐ U 2.9DK004BSPEC‐045055‐20140922 45 – 55 69.6 17.1 2.6 ‐‐ U ‐‐ U 3.9 0.5 ‐‐ U 0.9 ‐‐ U 0.8 1.1 ‐‐ U 0.8 ‐‐ U ‐‐ U 2.7DK004BSPEC‐085095‐20140922 85 – 95 52.0 19.2 6.9 1.6 ‐‐ U 5.3 4.1 1.4 2.5 1.6 0.5 1.1 ‐‐ U 2.5 ‐‐ U ‐‐ U 1.3DK004BSPEC‐105115‐20140922 105 – 115 53.0 19.0 6.3 1.9 2.4 6.0 3.3 1.9 2.5 0.4 ‐‐ U 1.0 ‐‐ U 1.5 ‐‐ U ‐‐ U 0.8DK004BSPEC‐135145‐20140922 135 – 145 50.8 20.3 5.3 1.7 ‐‐ U 5.5 5.0 0.6 2.8 0.3 ‐‐ U 4.3 ‐‐ U 2.1 ‐‐ U ‐‐ U 1.3DK004BSPEC‐185195‐20140922 185 – 195 46.9 24.5 8.9 1.8 1.7 6.3 3.4 1.6 2.4 0.6 ‐‐ U 0.8 ‐‐ U 0.6 ‐‐ U ‐‐ U 0.5NC054ASPEC‐015025‐20140924 15 – 25 39.4 22.5 14.7 1.2 ‐‐ U 7.5 3.3 1.5 3.7 ‐‐ ‐‐ U 3.0 ‐‐ U 2.2 ‐‐ U ‐‐ U 1.0NC054ASPEC‐090100‐20140924 90 – 100 47.0 19.7 9.8 1.7 ‐‐ U 5.1 4.7 2.1 2.1 ‐‐ U 3.0 1.8 1.5 0.8 ‐‐ U ‐‐ U 0.7NC054ASPEC‐155167‐20140924 155 – 167 52.5 20.4 9.6 3.4 ‐‐ U 4.3 2.1 2.0 4.0 ‐‐ U ‐‐ U 0.9 ‐‐ U 0.3 ‐‐ U ‐‐ U 0.5NC054ASPEC‐167180‐20140924 167 – 180 48.7 17.5 8.4 2.9 ‐‐ U 12.3 2.8 2.6 2.3 ‐‐ U ‐‐ U 1.6 ‐‐ U ‐‐ U ‐‐ U ‐‐ U 0.9NC054ASPEC‐212225‐20140923 212 – 225 47.2 27.1 7.9 2.0 ‐‐ U 5.0 3.7 1.9 1.9 0.5 ‐‐ U 0.7 ‐‐ U 0.6 ‐‐ U ‐‐ U 1.5NC054ASPEC‐295307‐20140923 295 – 307 43.8 24.3 8.0 2.6 ‐‐ U 9.2 4.3 2.9 2.4 ‐‐ U 0.9 1.2 ‐‐ U ‐‐ U ‐‐ U ‐‐ U 0.4NC054ASPEC‐363375‐20140922 363 – 375 9.6 58.6 5.6 ‐‐ U ‐‐ U 14.2 8.7 0.5 1.2 ‐‐ U ‐‐ U ‐‐ U ‐‐ U ‐‐ U ‐‐ U ‐‐ U 1.6NC064BSPEC‐015025‐20140919 15 – 25 37.2 28.7 9.1 ‐‐ U ‐‐ U 10.5 4.2 1.8 2.2 ‐‐ ‐‐ U 3.5 ‐‐ U 1.9 ‐‐ U ‐‐ U 0.9NC064BSPEC‐025034‐20140919 25 – 34 53.8 19.4 8.2 ‐‐ U ‐‐ U 6.4 2.3 1.0 1.7 0.5 ‐‐ U 1.3 ‐‐ U 2.9 0.6 0.6 1.3NC064BSPEC‐081091‐20140925 81 – 91 46.9 18.6 7.8 1.0 ‐‐ U 6.3 6.2 0.9 1.8 2.7 0.3 1.2 ‐‐ U 3.1 0.9 1.3 1.0NC064BSPEC‐110119‐20140925 110 – 119 54.9 18.6 7.5 ‐‐ ‐‐ U 5.7 2.2 1.0 2.3 2.6 ‐‐ U ‐‐ U ‐‐ U 3.4 0.4 0.5 0.9NC064BSPEC‐142155‐20140925 142 – 155 43.6 23.6 9.7 1.0 ‐‐ U 5.8 6.0 1.3 2.4 3.0 ‐‐ U ‐‐ U ‐‐ U 1.7 0.6 0.9 0.4NC064BSPEC‐200212‐20140925 200 – 212 48.2 27.9 6.9 1.5 ‐‐ U 5.9 2.6 3.4 2.2 0.3 ‐‐ U 0.5 ‐‐ U ‐‐ U ‐‐ U ‐‐ U 0.6NC064BSPEC‐282294‐20140922 282 – 294 5.4 24.8 23.9 3.4 1.3 16.6 4.8 4.9 11.2 ‐‐ U 1.1 2.1 ‐‐ U ‐‐ U ‐‐ U ‐‐ U 0.5NC070BSPEC‐015025‐20140924 15 – 25 48.6 20.5 9.7 2.1 ‐‐ U 6.1 3.7 ‐‐ U 2.3 ‐‐ U 0.5 1.9 ‐‐ U 3.0 0.3 0.5 0.8NC070BSPEC‐025035‐20140924 25 – 35 49.5 19.9 7.1 1.3 ‐‐ U 8.0 5.0 0.7 2.2 0.5 0.5 1.7 ‐‐ U 2.5 0.3 0.3 0.5NC070BSPEC‐055065‐20140924 55 – 65 53.5 21.4 7.5 ‐‐ ‐‐ U 5.1 3.5 ‐‐ U 2.5 0.8 0.7 1.2 ‐‐ U 1.8 0.4 0.5 1.1NC070BSPEC‐085095‐20140924 85 – 95 52.9 19.4 6.2 1.0 ‐‐ U 5.4 4.2 1.3 2.3 1.0 0.9 1.1 ‐‐ U 1.7 0.3 0.7 1.6NC070BSPEC‐115125‐20140922 115 – 125 49.6 18.7 7.9 ‐‐ U ‐‐ U 6.5 3.3 2.0 2.3 3.0 0.7 1.1 ‐‐ U 3.3 0.3 0.6 0.7NC070BSPEC‐125136‐20140922 125 – 136 48.4 21.4 7.4 1.5 ‐‐ U 6.6 3.2 2.1 2.6 1.5 0.7 1.4 ‐‐ U 1.9 ‐‐ U 0.6 0.7NC070BSPEC‐206216‐20140923 206 – 216 29.7 35.9 10.2 0.9 ‐‐ U 8.7 8.2 1.2 3.2 ‐‐ U ‐‐ U ‐‐ U ‐‐ U 0.7 ‐‐ U ‐‐ U 1.3NC079ASPEC‐015025‐20140919 15 – 25 5.0 47.9 12.9 ‐‐ U 2.9 17.2 8.3 ‐‐ U 2.6 ‐‐ U ‐‐ U 2.2 ‐‐ U ‐‐ U ‐‐ U ‐‐ U 1.0NC079ASPEC‐025035‐20140919 25 – 35 9.2 55.6 1.9 2.1 3.1 14.6 8.6 0.5 0.6 ‐‐ U ‐‐ U 2.2 ‐‐ U ‐‐ U ‐‐ U ‐‐ U 1.6NC079ASPEC‐045055‐20140919 45 – 55 7.8 57.3 2.3 1.3 1.9 20.4 7.0 1.2 0.5 ‐‐ U ‐‐ U ‐‐ U ‐‐ U ‐‐ U ‐‐ U ‐‐ U 0.3NC079ASPEC‐075085‐20140919 75 – 85 7.6 34.1 15.6 2.2 2.7 12.7 5.8 12.4 2.3 ‐‐ U ‐‐ U 3.9 ‐‐ U ‐‐ U ‐‐ U ‐‐ U 0.7NC079ASPEC‐085095‐20140919 85 – 95 7.5 39.2 9.6 2.6 3.3 16.7 8.5 6.0 1.8 ‐‐ U ‐‐ U 3.3 ‐‐ U ‐‐ U ‐‐ U ‐‐ U 1.5NC079ASPEC‐150160‐20140917 150 – 160 8.7 70.1 1.8 ‐‐ U 0.8 10.9 6.7 ‐‐ U 0.3 ‐‐ U ‐‐ U 0.7 ‐‐ U ‐‐ U ‐‐ U ‐‐ U ‐‐ UNC079ASPEC‐348360‐20140917 348 – 360 10.0 60.6 2.4 1.5 2.1 12.4 7.7 ‐‐ U 0.7 ‐‐ U ‐‐ U 2.6 ‐‐ U ‐‐ U ‐‐ U ‐‐ U ‐‐ U
Notes: Minerals:Only minerals with detections in this sample set are shown. quartz = SiO2 plagioclase = (Na,Ca)AlSi3O8 apatite = Ca5(PO4)3(OH,F,Cl) halite = NaCl
% = percent muscovite = KAl3Si3O10(OH)2 potassium feldspar = KAlSi3O8 calcite = CaCO3 chalcopyrite = CuFeS2cm = centimeter biotite = K(Mg,Fe)3(AlSi3O10)(OH,F)2 kaolinite = Al2Si2O5(OH)4 dolomite = CaMg(CO3)2 cubanite = CuFe2S3U = nondetect amphibole = (Na,K)(Ca,Mg,Fe2+)2(Mg,Fe2+,Al3+,Fe3+)5(Si
4+,Al3+)8O22(OH)2 chlorite = (Fe, Mg, Al)3(Si, Al)4O10(OH)2(Mg, Fe, Al)3(OH)6 gypsum = CaSO4‐2(H2O) pyrite = FeS2
NC070
NC079
Sample Depth (cm)
Potassium feldsparAmphibole(%)
AmorphousStation ID Sample ID
DK004
NC054
Biotite Plagioclase
NC064
Apatite(%) (%) (%)(%) (%)
Muscovite(%)(%) (%) (%)(%)
PyriteQuartz(%) (%) (%) (%)
CubaniteDolomite Gypsum HaliteKaolinite (%)(%)
Calcite ChalcopyriteChlorite
Metals Speciation ResultsNewtown Creek RI/FS 1 of 1
October 2018181037-01.01

Table 5Phase 1 Archived Core Samples Total Metals by X‐Ray Fluorescence
DK004BSPEC‐015025‐20140922 15 – 25 40 U 375 78.6 234,400 64,900 42,900 434 14,400 12,600 19,800 20,400 4,140 1,180 137 95.2 20.8DK004BSPEC‐035045‐20140922 35 – 45 40 U 2,200 401 240,400 48,600 42,200 364 10,700 12,900 13,700 14,000 3,480 2,270 547 129 24.4DK004BSPEC‐045055‐20140922 45 – 55 40 U 1,170 275 200,600 36,000 32,400 271 7,300 13,400 8,980 8,720 2,580 2,050 479 207 38.4DK004BSPEC‐085095‐20140922 85 – 95 147 2,720 1,010 177,600 51,500 49,400 325 9,110 16,500 17,500 14,000 5,270 6,370 1,030 190 32.8DK004BSPEC‐105115‐20140922 105 – 115 80.8 2,870 841 190,600 53,800 43,600 325 9,230 16,100 16,700 13,700 4,560 7,510 1,640 185 30.9DK004BSPEC‐135145‐20140922 135 – 145 80.8 3,390 849 170,200 55,700 41,500 263 9,650 16,000 16,600 13,700 4,140 9,690 2,260 218 34.3DK004BSPEC‐185195‐20140922 185 – 195 110 1,630 904 209,100 56,100 41,300 318 8,380 12,500 14,100 15,000 4,260 4,320 821 123 28.3NC054ASPEC‐015025‐20140924 15 – 25 40 U 559 86.4 227,100 62,900 42,100 441 20,200 17,200 19,500 21,700 4,080 1,660 137 101 21.9NC054ASPEC‐090100‐20140924 90 – 100 40 U 1,610 354 198,500 49,100 43,200 573 28,500 39,800 13,100 12,700 3,540 4,230 411 112 26.6NC054ASPEC‐155167‐20140924 155 – 167 40 U 5,860 1,520 192,900 55,900 45,300 403 12,000 25,800 8,230 14,800 3,960 9,250 958 179 29.0NC054ASPEC‐167180‐20140924 167 – 180 40 U 5,160 1,380 199,100 52,000 45,800 418 10,600 25,400 7,340 14,900 3,960 8,990 889 162 28.1NC054ASPEC‐212225‐20140923 212 – 225 40 U 2,820 2,010 210,000 45,400 39,500 318 7,060 41,600 6,080 13,000 3,120 17,900 479 118 26.1NC054ASPEC‐295307‐20140923 295 – 307 40 U 2,880 684 210,300 60,100 42,900 511 9,470 15,900 7,050 14,600 4,320 3,930 274 72.8 27.8NC054ASPEC‐363375‐20140922 363 – 375 40 U 599 189 334,300 44,000 30,000 488 7,300 9,650 8,230 15,400 2,940 1,220 205 56.0 9.55NC064BSPEC‐015025‐20140919 15 – 25 40 U 2,370 338 249,600 52,600 38,200 333 13,300 15,500 16,100 16,000 3,720 2,530 342 101 21.3NC064BSPEC‐025034‐20140919 25 – 34 40 U 15,300 3,390 174,000 46,600 42,500 333 9,410 35,600 13,800 13,600 3,480 16,200 889 174 29.9NC064BSPEC‐081091‐20140925 81 – 91 40 U 24,800 3,760 170,100 43,900 44,100 294 8,380 41,500 10,500 11,700 3,240 19,100 821 168 28.9NC064BSPEC‐110119‐20140925 110 – 119 40 U 8,470 2,760 174,100 50,100 42,100 333 8,810 40,400 11,200 13,900 3,540 18,800 889 151 29.2NC064BSPEC‐142155‐20140925 142 – 155 40 U 17,400 2,890 176,100 50,000 43,900 349 7,900 28,200 10,000 11,800 3,420 12,700 479 123 31.5NC064BSPEC‐200212‐20140925 200 – 212 36.7 5,410 1,120 225,300 58,800 40,600 356 9,050 13,400 9,500 14,600 5,330 4,360 274 78.4 25.3NC064BSPEC‐282294‐20140922 282 – 294 40 U 351 70.7 264,000 83,600 50,500 782 20,000 20,800 11,400 27,600 5,690 1,000 68.4 95.2 8.51NC070BSPEC‐015025‐20140924 15 – 25 58.7 12,100 2,040 169,400 49,500 46,100 333 11,800 21,800 15,400 14,900 4,140 9,780 1,230 202 32.6NC070BSPEC‐025035‐20140924 25 – 35 80.8 14,900 3,020 163,700 48,700 48,700 294 10,800 22,300 13,900 14,400 4,320 10,800 1,440 207 33.2NC070BSPEC‐055065‐20140924 55 – 65 125 14,500 3,470 170,800 45,700 45,500 318 9,830 20,400 12,300 12,900 5,330 10,500 1,440 207 33.4NC070BSPEC‐085095‐20140924 85 – 95 95.4 12,200 4,240 161,400 46,400 47,200 333 9,830 21,100 11,700 11,900 5,030 11,100 1,510 213 35.4NC070BSPEC‐115125‐20140922 115 – 125 36.7 18,900 3,890 155,800 46,000 46,400 263 8,740 32,900 11,000 13,700 3,420 16,000 1,090 185 33.4NC070BSPEC‐125136‐20140922 125 – 136 51.4 11,600 4,790 159,400 46,000 50,000 325 9,650 21,900 11,700 12,600 4,080 11,000 1,370 207 35.3NC070BSPEC‐206216‐20140923 206 – 216 40 U 168 70.7 328,800 53,500 29,900 472 8,560 6,360 11,600 19,300 3,480 742 68.4 72.8 8.23NC079ASPEC‐015025‐20140919 15 – 25 40 U 144 314 335,900 55,700 23,500 387 11,100 14,000 12,900 21,200 2,640 655 205 39.2 5.08NC079ASPEC‐025035‐20140919 25 – 35 40 U 40 U 20 U 366,200 46,600 20,900 449 8,930 13,900 11,500 16,400 3,060 611 68.4 33.6 2.50NC079ASPEC‐045055‐20140919 45 – 55 40 U 40 U 20 U 370,200 48,000 22,900 534 7,480 10,400 12,600 16,600 3,240 611 70 U 39.2 1.81NC079ASPEC‐075085‐20140919 75 – 85 40 U 40 U 20 U 290,700 81,000 39,200 573 16,200 15,500 11,100 22,700 5,450 786 68.4 84.0 6.71NC079ASPEC‐085095‐20140919 85 – 95 40 U 40 U 20 U 309,600 69,300 32,300 581 16,000 20,700 12,100 19,500 4,860 786 70 U 78.4 5.61NC079ASPEC‐150160‐20140917 150 – 160 40 U 40 U 31.4 402,400 29,300 11,400 194 5,970 10,400 8,010 12,700 959 175 137 22.4 1.52NC079ASPEC‐348360‐20140917 348 – 360 40 U 40 U 20 U 379,600 36,300 16,100 325 8,440 13,000 9,790 15,200 1,800 305 70 U 33.6 1.85
Notes:1 = Reported percent oxides converted to mg/kg.% = percentcm = centimetermg/kg = milligram per kilogramU = nondetect at method detection limit
NC070
NC079
Sample ID 1IronCobalt Copper Nickel Silicon AluminumStation
IDSample
Depth (cm)
DK004
NC054
NC064
Phosphorus Chromium VanadiumLoss on Ignition
(mg/kg) (mg/kg) (mg/kg) (mg/kg) (mg/kg) (mg/kg)Manganese Magnesium Calcium Sodium Potassium Titanium
(mg/kg) (mg/kg) (mg/kg) (%)(mg/kg) (mg/kg) (mg/kg) (mg/kg) (mg/kg) (mg/kg)
Metals Speciation Results Newtown Creek RI/FS 1 of 1
October 2018181037-01.01

Table 6Phase 2 Surface Sediment Triad Sample Sequential Extraction
DK040SPEC‐000015‐20141111‐EXCH Exchangeable 1.3 J 0.4 U 0.1 U 498 0.1 U 0.04 U 1,200 0.1 U 0.3 U 0.246 J 4.6 J 0.1 U
DK040SPEC‐000015‐20141112‐CARB Carbonate Bound 130 0.4 U 2.10 197 0.1 U 0.04 U 4,300 3.4 0.503 J 0.229 J 7,800 2.22
DK040SPEC‐000015‐20141113‐RED Reducible 780 1.37 J 1.74 68.7 0.078 J 0.251 J 4,100 2.1 0.782 J 0.240 J 3,800 19.0
DK040SPEC‐000015‐20141114‐OXID Oxidizable 1,500 0.4 U 1.77 8.77 0.1 U 2.01 270 21 1.94 153 1,700 78.20
DK040SPEC‐000015‐20141114‐RES Residual 3,070 9.93 1.89 54.4 0.3 U 0.09 U 1,060 U 7.6 0.993 J 18.6 4,160 39.4
EB2036SPEC‐000015‐20141111‐EXCH Exchangeable 11 0.7 U 0.2 U 611 0.1 U 0.06 U 2,700 0.21 J 0.4 U 0.648 J 33 0.2 U
EB2036SPEC‐000015‐20141112‐CARB Carbonate Bound 350 0.7 U 3.87 354 J 0.1 U 0.06 U 8,000 J 5.5 1.78 1.34 11,000 92.6
EB2036SPEC‐000015‐20141113‐RED Reducible 3,800 J 0.7 U 5.02 394 J 0.19 J 2.74 11,000 J 16 J 2.08 102 J 6,300 J 309
EB2036SPEC‐000015‐20141114‐OXID Oxidizable 1,600 J 0.66 J 0.7 U 14.2 0.1 U 0.787 380 31 J 2.48 213 J 1,500 29.2
EB2036SPEC‐000015‐20141114‐RES Residual 6,550 5.80 9.55 297 0.2 U 0.0720 J 770 U 21 2.45 48.4 8,020 98.7
EK059SPEC‐000015‐20141111‐EXCH Exchangeable 2.3 J 0.7 U 0.2 U 594 0.1 U 0.06 U 1,300 0.2 U 0.5 U 0.459 J 3.6 J 0.2 U
EK059SPEC‐000015‐20141112‐CARB Carbonate Bound 200 1.87 J 9.55 427 0.1 U 1.51 3,100 50 0.883 J 2.11 11,000 155
EK059SPEC‐000015‐20141113‐RED Reducible 2,800 6.05 J 14.8 318 0.28 J 73.3 4,000 210 1.77 J 57.3 4,700 464
EK059SPEC‐000015‐20141114‐OXID Oxidizable 2,300 6 UJ 22.8 15.9 0.1 U 87.3 340 500 11.9 2,410 9,000 354
EK059SPEC‐000015‐20141114‐RES Residual 3,530 36.6 16.5 335 0.2 U 1.60 800 U 84 2.20 139 5,610 479
EK2006SPEC‐000015‐20141111‐EXCH Exchangeable 14 0.8 U 0.2 U 759 0.1 U 0.100 J 1,500 1.1 0.5 U 2.45 27 1.31
EK2006SPEC‐000015‐20141112‐CARB Carbonate Bound 260 1.93 J 12.6 552 J 0.1 U 7.25 9,800 J 31 1.31 J 11.8 9,700 248
EK2006SPEC‐000015‐20141113‐RED Reducible 4,100 J 1.25 J 15.5 514 J 0.33 J 43.9 4,900 J 270 J 3.05 592 J 5,700 J 469
EK2006SPEC‐000015‐20141114‐OXID Oxidizable 1,100 J 1.04 J 12.3 11.2 0.1 U 22.7 160 210 J 7.97 1,320 J 9,000 113
EK2006SPEC‐000015‐20141114‐RES Residual 5,670 13.4 20.2 279 0.2 U 1.52 790 U 75 2.98 111 6,530 175
MC017SPEC‐000015‐20141111‐EXCH Exchangeable 2.6 J 0.7 U 0.2 U 611 0.1 U 0.06 U 1,900 0.2 U 0.4 U 0.407 J 12 0.2 U
MC017SPEC‐000015‐20141112‐CARB Carbonate Bound 310 0.7 U 3.35 394 0.1 U 0.06 U 7,700 7.3 1.04 J 0.655 J 11,000 28.8
MC017SPEC‐000015‐20141113‐RED Reducible 190 0.7 U 3.84 165 0.1 U 0.372 J 12,000 0.88 0.593 J 0.637 J 4,300 9.73
MC017SPEC‐000015‐20141114‐OXID Oxidizable 5,000 3.79 J 4.29 16.8 0.30 J 5.61 2,300 64 6.97 536 5,200 86.7
MC017SPEC‐000015‐20141114‐RES Residual 2,720 5.93 4.92 124 0.1 U 0.162 J 440 U 14 1.62 37.1 5,000 186
NC046SPEC‐000015‐20141111‐EXCH Exchangeable 2 U 0.7 U 0.2 U 724 0.1 U 0.06 U 1,200 0.2 U 0.4 U 0.310 J 9.7 0.2 U
NC046SPEC‐000015‐20141112‐CARB Carbonate Bound 120 0.7 U 3.36 211 0.10 J 1.35 3,500 5.3 0.681 J 3.70 4,900 55.2
NC046SPEC‐000015‐20141113‐RED Reducible 2,000 0.7 U 3.31 196 0.29 J 1.42 3,100 6.5 1.27 J 40.4 4,100 44.4
NC046SPEC‐000015‐20141114‐OXID Oxidizable 2,600 0.81 J 2.84 13.8 0.10 J 0.336 J 160 26 2.71 82.3 5,300 22.9
NC046SPEC‐000015‐20141114‐RES Residual 5,760 2.19 3.00 71.2 0.2 U 0.07 U 850 U 12 2.79 13.2 9,590 12.5
NC161SPEC‐000015‐20141111‐EXCH Exchangeable 2.1 J 0.9 U 0.2 U 909 0.1 U 0.07 U 1,500 0.2 U 0.5 U 0.372 J 15 0.2 U
NC161SPEC‐000015‐20141112‐CARB Carbonate Bound 85.00 0.9 U 3.81 286 0.13 J 0.255 J 4,900 5.0 0.702 J 0.500 J 7,000 42.6
NC161SPEC‐000015‐20141113‐RED Reducible 2,600 0.9 U 4.88 193 0.37 J 2.46 3,100 7.2 1.66 J 37.3 5,100 59.7
NC161SPEC‐000015‐20141114‐OXID Oxidizable 4,700 0.9 U 6.85 19.3 0.19 J 0.553 210 51 6.05 116 10,000 42.4
NC161SPEC‐000015‐20141114‐RES Residual 15,100 10.9 6.08 68.3 0.32 J 0.0560 J 590 U 25 5.78 25.9 23,100 22.9
Antimony(mg/kg)Station ID Sample ID1
Sequential Extraction Phase
Aluminum(mg/kg)
Arsenic(mg/kg)
Barium(mg/kg)
Beryllium(mg/kg)
Cadmium(mg/kg)
Calcium(mg/kg)
Chromium(mg/kg)
Cobalt(mg/kg)
Copper(mg/kg)
Iron(mg/kg) (mg/kg)
Lead
NC046
NC161
DK040
EB036
EK059
EK006
MC017
Metals Speciation ResultsNewtown Creek RI/FS 1 of 4
October 2018181037-01.01

Table 6Phase 2 Surface Sediment Triad Sample Sequential Extraction
DK040SPEC‐000015‐20141111‐EXCH Exchangeable
DK040SPEC‐000015‐20141112‐CARB Carbonate Bound
DK040SPEC‐000015‐20141113‐RED Reducible
DK040SPEC‐000015‐20141114‐OXID Oxidizable
DK040SPEC‐000015‐20141114‐RES Residual
EB2036SPEC‐000015‐20141111‐EXCH Exchangeable
EB2036SPEC‐000015‐20141112‐CARB Carbonate Bound
EB2036SPEC‐000015‐20141113‐RED Reducible
EB2036SPEC‐000015‐20141114‐OXID Oxidizable
EB2036SPEC‐000015‐20141114‐RES Residual
EK059SPEC‐000015‐20141111‐EXCH Exchangeable
EK059SPEC‐000015‐20141112‐CARB Carbonate Bound
EK059SPEC‐000015‐20141113‐RED Reducible
EK059SPEC‐000015‐20141114‐OXID Oxidizable
EK059SPEC‐000015‐20141114‐RES Residual
EK2006SPEC‐000015‐20141111‐EXCH Exchangeable
EK2006SPEC‐000015‐20141112‐CARB Carbonate Bound
EK2006SPEC‐000015‐20141113‐RED Reducible
EK2006SPEC‐000015‐20141114‐OXID Oxidizable
EK2006SPEC‐000015‐20141114‐RES Residual
MC017SPEC‐000015‐20141111‐EXCH Exchangeable
MC017SPEC‐000015‐20141112‐CARB Carbonate Bound
MC017SPEC‐000015‐20141113‐RED Reducible
MC017SPEC‐000015‐20141114‐OXID Oxidizable
MC017SPEC‐000015‐20141114‐RES Residual
NC046SPEC‐000015‐20141111‐EXCH Exchangeable
NC046SPEC‐000015‐20141112‐CARB Carbonate Bound
NC046SPEC‐000015‐20141113‐RED Reducible
NC046SPEC‐000015‐20141114‐OXID Oxidizable
NC046SPEC‐000015‐20141114‐RES Residual
NC161SPEC‐000015‐20141111‐EXCH Exchangeable
NC161SPEC‐000015‐20141112‐CARB Carbonate Bound
NC161SPEC‐000015‐20141113‐RED Reducible
NC161SPEC‐000015‐20141114‐OXID Oxidizable
NC161SPEC‐000015‐20141114‐RES Residual
Station ID Sample ID1Sequential
Extraction Phase
NC046
NC161
DK040
EB036
EK059
EK006
MC017
130,000 5.08 0.001 U 0.22 U 3,000 0.2 U 0.1 U 18,000 0.2 U 0.6 U 0.0782 J 9.83
11,000 29.3 0.001 U 3.20 610 1.03 0.1 U 150,000 0.2 U 0.6 U 2.50 12.1
2,400 18.4 0.001 U 4.92 110 J 0.2 U 0.1 U 12,000 0.2 U 0.6 U 3.21 198
430 23.9 0.1603 9.61 130 J 0.877 0.99 17 U 0.2 U 0.6 U 4.23 282
1,080 J 21.7 1.320 4.79 711 J 0.9 U 92 195 J 0.09 U 53 13.9 23.8 J
220,000 2.36 0.0008197 UJ 0.3 U 4,800 0.2 U 0.2 U 21,000 J 0.3 U 0.8 U 0.189 J 3.70 J
22,000 28.9 0.0008197 J 8.85 1,300 J 0.836 J 0.2 U 250,000 J 0.3 U 0.98 J 4.86 127
6,600 J 42.4 J 0.0008197 UJ 9.34 200 J 0.2 U 0.2 U 13,000 J 0.3 U 0.98 J 16.0 763 J
620 23.7 J 0.0008197 UJ 9.51 170 J 1.67 0.2 U 160 J 0.3 U 52 6.19 243
1,940 52.7 3.914 15.3 956 J 3.49 11 300 J 0.084 J 50 31.6 72.8
220,000 4.40 0.001 U 1.13 J 4,100 0.3 U 0.2 U 15,000 0.4 U 0.9 U 0.117 J 27.9
24,000 28.8 0.001 U 57.5 1,100 2.06 0.2 U 250,000 0.4 U 1.3 J 23.2 542
1,900 30.5 0.001 U 75.3 160 J 1 U 0.35 J 11,000 0.4 U 11 34.7 2,000
660 77.1 2.578 476 200 J 4.28 2.6 27 U 0.4 U 3.8 J 17.7 2,080
1,250 J 31.3 4.582 23 790 J 2.44 J 45 137 J 0.097 J 206 30.7 73.1
300,000 2.23 0.001000 J 1.02 J 5,900 0.3 U 0.2 U 24,000 J 0.4 U 1 U 0.480 J 6.40
12,000 33.4 0.005000 J 48.3 1,400 J 1.35 J 0.2 U 350,000 J 0.4 U 1.0 J 26.8 1,040
2,500 J 48.9 J 0.001 UJ 70.6 240 J 0.3 U 0.2 U 8,400 J 0.4 U 10 37.5 1,730 J
420 69.3 J 0.001000 J 275 130 J 2.78 0.2 U 140 J 0.4 U 30 8.60 800
1,900 49.7 7.172 61.7 1,170 J 1.80 J 24 177 J 0.11 J 90 22.0 81.8
190,000 7.12 0.001 U 0.4 U 4,200 0.3 U 0.2 U 22,000 0.4 U 0.9 U 0.09 U 20.2
20,000 31.2 0.001 U 8.20 1,100 1.99 0.2 U 240,000 0.4 U 1.1 J 4.22 81.3
6,600 25.4 0.001 U 6.85 150 J 0.3 U 0.2 U 16,000 0.4 U 0.9 U 3.76 370
1,300 61.7 0.002655 J 36.8 230 2.27 0.2 U 360 0.4 U 1.6 J 17.9 827
840 22.5 2.342 6.56 456 J 0.4 U 4.1 116 J 0.046 J 54 14.3 67.1
210,000 10.5 0.001 U 0.354 J 4,500 0.3 U 0.2 U 19,000 0.4 U 0.9 U 0.115 J 17.3
14,000 87.2 0.001 U 2.94 1,200 1.90 0.2 U 240,000 0.4 U 0.97 J 5.08 132
2,500 70.3 0.001 U 4.40 380 0.3 U 0.2 U 22,000 0.4 U 0.9 U 6.81 172
970 77.1 0.04159 9.91 300 1.51 0.2 U 180 0.4 U 0.9 U 0.973 57.3
2,240 79.0 1.242 8.88 1,040 J 0.7 U 4.5 121 U 0.076 J 22 17.6 25.7 J
240,000 35.3 0.001 U 0.4 U 5,200 0.3 U 0.2 U 23,000 0.4 U 1 U 0.191 J 20.1
16,000 171 0.001 U 3.26 1,200 2.14 0.2 U 290,000 0.4 U 1.2 J 7.27 66.0
2,700 100 0.001 U 4.84 450 0.3 U 0.2 U 26,000 0.4 U 1 U 9.35 221
1,800 166 0.1160 18.3 520 2.07 0.2 U 190 J 0.4 U 1 U 1.23 120
5,880 158 1.166 18.9 2,410 0.5 U 15 173 J 0.15 J 71 33.7 51.5
Mercury(mg/kg)
Magnesium(mg/kg)
Manganese(mg/kg)
Nickel(mg/kg)
Potassium(mg/kg)
Selenium(mg/kg)
Silver(mg/kg)
Sodium(mg/kg)
Zinc(mg/kg)
Thallium(mg/kg)
Tin(mg/kg)
Vanadium(mg/kg)
Metals Speciation ResultsNewtown Creek RI/FS 2 of 4
October 2018181037-01.01

Table 6Phase 2 Surface Sediment Triad Sample Sequential Extraction
Antimony(mg/kg)Station ID Sample ID1
Sequential Extraction Phase
Aluminum(mg/kg)
Arsenic(mg/kg)
Barium(mg/kg)
Beryllium(mg/kg)
Cadmium(mg/kg)
Calcium(mg/kg)
Chromium(mg/kg)
Cobalt(mg/kg)
Copper(mg/kg)
Iron(mg/kg) (mg/kg)
Lead
NC293SPEC‐000015‐20141111‐EXCH Exchangeable 1 U 0.6 U 0.1 U 472 0.1 U 0.05 U 1,300 0.1 U 0.4 U 0.297 J 10 0.1 U
NC293SPEC‐000015‐20141112‐CARB Carbonate Bound 200 0.6 U 8.62 326 0.087 J 0.449 3,400 16 0.645 J 1.29 11,000 69.8
NC293SPEC‐000015‐20141113‐RED Reducible 470 0.6 U 11.1 171 0.12 J 12.0 6,700 4.5 1.33 J 6.46 4,300 36.3
NC293SPEC‐000015‐20141114‐OXID Oxidizable 3,600 1.37 J 13.2 22.3 0.23 J 15.6 870 130 7.32 1,490 4,500 136
NC293SPEC‐000015‐20141114‐RES Residual 10,700 2.13 19.5 205 0.26 J 0.599 810 U 41 4.32 122 15,200 308
WC012SPEC‐000015‐20141111‐EXCH Exchangeable 2 U 0.6 U 0.2 U 698 0.1 U 0.05 U 1,200 0.2 U 0.4 U 0.209 J 5.7 J 0.2 U
WC012SPEC‐000015‐20141112‐CARB Carbonate Bound 170 0.6 U 2.84 298 0.10 J 0.628 3,300 6.2 0.403 J 0.643 J 4,700 55.6
WC012SPEC‐000015‐20141113‐RED Reducible 1,900 0.6 U 2.88 86.0 0.21 J 2.87 1,800 7.0 1.04 J 44.2 2,600 51.7
WC012SPEC‐000015‐20141114‐OXID Oxidizable 2,500 0.6 U 3.18 10.9 0.093 J 0.736 120 31 3.08 102 5,000 27.9WC012SPEC‐000015‐20141114‐RES Residual 10,800 11.9 3.82 63.4 0.32 J 0.06 U 730 U 21 4.73 27.3 15,200 18.2
Notes:1 = Surface sediment samples were collected from 0 to 15 centimeters.J = estimated valuemg/kg = milligram per kilogramU = nondetect at method detection limit
NC293
WC012
Metals Speciation ResultsNewtown Creek RI/FS 3 of 4
October 2018181037-01.01

Table 6Phase 2 Surface Sediment Triad Sample Sequential Extraction
Station ID Sample ID1Sequential
Extraction Phase
NC293SPEC‐000015‐20141111‐EXCH Exchangeable
NC293SPEC‐000015‐20141112‐CARB Carbonate Bound
NC293SPEC‐000015‐20141113‐RED Reducible
NC293SPEC‐000015‐20141114‐OXID Oxidizable
NC293SPEC‐000015‐20141114‐RES Residual
WC012SPEC‐000015‐20141111‐EXCH Exchangeable
WC012SPEC‐000015‐20141112‐CARB Carbonate Bound
WC012SPEC‐000015‐20141113‐RED Reducible
WC012SPEC‐000015‐20141114‐OXID OxidizableWC012SPEC‐000015‐20141114‐RES Residual
Notes:1 = Surface sediment samples were collected from 0 to 15 centimeters.J = estimated valuemg/kg = milligram per kilogramU = nondetect at method detection limit
NC293
WC012
Mercury(mg/kg)
Magnesium(mg/kg)
Manganese(mg/kg)
Nickel(mg/kg)
Potassium(mg/kg)
Selenium(mg/kg)
Silver(mg/kg)
Sodium(mg/kg)
Zinc(mg/kg)
Thallium(mg/kg)
Tin(mg/kg)
Vanadium(mg/kg)
170,000 5.38 0.001 U 0.739 J 3,600 0.2 U 0.1 U 18,000 0.3 U 0.7 U 0.0870 J 17.0
22,000 40.1 0.001 U 27.0 1,400 1.52 0.1 U 190,000 0.3 U 0.87 J 14.0 341
5,400 39.7 0.001 U 28.6 570 0.2 U 0.1 U 26,000 0.3 U 0.7 U 13.5 942
720 72.5 0.1739 193 180 3.21 0.1 U 190 0.3 U 1.7 J 3.88 739
3,420 106 5.276 28.3 1,720 1.22 J 8.0 176 J 0.17 J 31 49.7 68.9
190,000 6.50 0.001 U 0.3 U 4,100 0.2 U 0.2 U 19,000 0.3 U 0.8 U 0.101 J 12.1
17,000 45.9 0.001 U 4.75 1,200 1.67 0.2 U 220,000 0.3 U 0.85 J 7.12 97.7
1,300 44.4 0.001 U 5.26 270 0.2 U 0.2 U 18,000 0.3 U 0.8 U 6.76 207
930 74.7 0.07287 14.7 290 1.36 0.2 U 23 U 0.3 U 0.8 U 1.12 86.83,970 129 2.524 15.8 1,860 0.6 U 16 163 J 0.14 J 69 28.7 44.3
Metals Speciation ResultsNewtown Creek RI/FS 4 of 4
October 2018181037-01.01

Table 7Phase 1 Archived Core Samples Sequential Extraction
DK004BSPEC‐015025‐20141216‐EXCH Exchangeable 18 J 12.8 J 1 UJ 1150 0.5 UJ 0.4 UJ 1,300 1 UJ 2.7 UJ 2.28 J 28 J 1.2 J 350,000DK004BSPEC‐015025‐20141217‐CARB Carbonate Bound 240 4 U 2.88 421 J 0.5 U 2.93 3,300 J 8.0 2.7 U 17.8 5,900 132 8,300DK004BSPEC‐015025‐20141218‐RED Reducible 3,700 J 13.7 J 5.00 376 J 0.5 U 2.01 J 2,500 J 25 J 2.7 U 203 J 5,000 J 93.7 2,100 JDK004BSPEC‐015025‐20141219‐OXID Oxidizable 2,000 J 10.5 J 1.09 U 12.4 0.5 U 0.489 J 130 42 J 3.70 J 71.8 J 6,700 8.59 1,100DK004BSPEC‐015025‐20141219‐RES Residual 6,750 2.42 7.63 65.2 0.268 J 0.178 J 620 U 14.5 3.41 12.5 8,280 8.14 2,640DK004BSPEC‐045055‐20141216‐EXCH Exchangeable 10 J 2.68 J 0.1 UJ 631 0.1 UJ 0.186 J 790 0.79 J 0.4 UJ 1.31 J 8.6 1.54 220,000DK004BSPEC‐045055‐20141217‐CARB Carbonate Bound 210 3.04 J 2.31 328 J 0.1 U 37.9 4,300 J 26 3.85 105 1,600 440 4,100DK004BSPEC‐045055‐20141218‐RED Reducible 2,700 J 1.19 J 7.14 324 J 0.17 J 19.0 4,200 J 150 J 9.00 361 J 4,000 J 488 2,200 JDK004BSPEC‐045055‐20141219‐OXID Oxidizable 710 J 2.96 J 8.07 6.29 0.1 U 17.6 160 120 J 8.43 476 J 13,000 114 260DK004BSPEC‐045055‐20141219‐RES Residual 3,470 20.1 9.15 156 0.2 U 1.25 530 U 49.5 3.77 46.3 5,560 194 1,320DK004BSPEC‐135145‐20141216‐EXCH Exchangeable 29 3.36 J 0.2 UJ 380 0.1 UJ 0.527 J 1,800 3.6 0.5 UJ 4.58 48 1.85 J 310,000DK004BSPEC‐135145‐20141217‐CARB Carbonate Bound 790 7.75 J 11.2 485 J 0.1 U 136 3,200 J 110 6.88 21.9 10,000 235 8,700DK004BSPEC‐135145‐20141218‐RED Reducible 8,200 J 7.55 J 41.1 1,080 J 0.57 147 7,100 J 1,300 J 12.5 1,800 J 10,000 J 856 1,500 JDK004BSPEC‐135145‐20141219‐OXID Oxidizable 1,500 J 3.91 J 4.75 14.8 0.1 U 113 140 400 J 16.9 1,080 J 4,700 77.1 560DK004BSPEC‐135145‐20141219‐RES Residual 7,490 60.6 38.9 502 0.4 J 2.55 1,300 U 105 8.18 78.6 8,110 134 2,380NC054ASPEC‐015025‐20141216‐EXCH Exchangeable 11 J 0.602 J 0.2 UJ 352 0.1 UJ 0.05 UJ 1,700 0.26 J 0.4 UJ 0.767 J 14 0.158 J 230,000NC054ASPEC‐015025‐20141217‐CARB Carbonate Bound 220 0.6 U 3.43 235 J 0.11 J 0.662 3,500 J 6.3 0.541 J 1.68 5,500 71.3 11,000NC054ASPEC‐015025‐20141218‐RED Reducible 3,600 J 0.6 U 3.67 499 J 0.27 J 3.59 3,900 J 26 J 1.82 227 J 4,400 J 123 2,900 JNC054ASPEC‐015025‐20141219‐OXID Oxidizable 1,700 J 0.6 U 2.23 6.98 0.1 U 0.962 140 45 J 3.36 185 J 5,900 14.2 830NC054ASPEC‐015025‐20141219‐RES Residual 11,200 5.56 9.72 319 0.347 J 0.144 J 750 U 27.8 5.71 39.9 15,300 58.3 4,480NC054ASPEC‐167180‐20141216‐EXCH Exchangeable 13 J 0.69 J 0.5 UJ 595 0.1 UJ 0.0603 J 1,600 0.95 J 0.4 UJ 2.47 20 0.897 J 250,000NC054ASPEC‐167180‐20141217‐CARB Carbonate Bound 260 3.01 J 15.7 441 J 0.1 U 10.9 3,800 J 49 3.11 5.83 10,000 136 8,500NC054ASPEC‐167180‐20141218‐RED Reducible 4,700 J 2.53 J 35.3 434 J 0.46 44.0 10,000 J 360 J 4.06 1,160 J 7,200 J 491 1,900 JNC054ASPEC‐167180‐20141219‐OXID Oxidizable 1,300 J 0.94 J 16.1 14.1 0.1 U 20.5 140 220 J 12.6 2,800 J 5,900 182 530NC054ASPEC‐167180‐20141219‐RES Residual 8,590 17.8 46.4 91.5 0.358 J 0.583 J 1,160 U 78.2 4.49 154 11,200 312 3,390NC054ASPEC‐295307‐20141216‐EXCH Exchangeable 2.9 2.79 J 1 U 1,540 0.1 UJ 0.1 UJ 1,600 0.40 J 0.7 UJ 2.03 J 27 1.47 J 460,000NC054ASPEC‐295307‐20141217‐CARB Carbonate Bound 390 14.9 40.9 616 J 0.1 U 0.786 5,300 J 9.4 2.21 J 8.14 13,000 603 8,900NC054ASPEC‐295307‐20141218‐RED Reducible 5,600 J 1.56 J 55.7 1,030 J 0.37 J 4.11 5,900 J 31 J 3.86 589 J 5,900 J 869 1,700 JNC054ASPEC‐295307‐20141219‐OXID Oxidizable 1,700 J 2.77 J 44.6 23.6 0.1 U 2.59 230 57 J 10.8 1,540 J 5,100 220 690NC054ASPEC‐295307‐20141219‐RES Residual 8,050 54.1 72.1 1,440 0.3 U 0.1 U 1,120 U 35.7 3.90 94.0 8,760 182 2,990
DK004B
NC054A
15 – 25
45 – 55
135 – 145
15 – 25
167 – 180
295 – 307
Aluminum (mg/kg)
Antimony (mg/kg)
Arsenic (mg/kg)
Barium (mg/kg)
Beryllium (mg/kg)
Cadmium (mg/kg)
Calcium (mg/kg)
Chromium (mg/kg)
Cobalt (mg/kg)
Copper (mg/kg)
Iron (mg/kg)
Lead (mg/kg)
Magnesium (mg/kg)
Station ID Sample ID
Sample Depth (cm)
Sequential Extraction Phase
Metals Speciation ResultsNewtown Creek RI/FS 1 of 6
October 2018181037-01.01
Table 7Phase 1 Archived Core Samples Sequential Extraction
DK004BSPEC‐015025‐20141216‐EXCH ExchangeableDK004BSPEC‐015025‐20141217‐CARB Carbonate BoundDK004BSPEC‐015025‐20141218‐RED ReducibleDK004BSPEC‐015025‐20141219‐OXID OxidizableDK004BSPEC‐015025‐20141219‐RES ResidualDK004BSPEC‐045055‐20141216‐EXCH ExchangeableDK004BSPEC‐045055‐20141217‐CARB Carbonate BoundDK004BSPEC‐045055‐20141218‐RED ReducibleDK004BSPEC‐045055‐20141219‐OXID OxidizableDK004BSPEC‐045055‐20141219‐RES ResidualDK004BSPEC‐135145‐20141216‐EXCH ExchangeableDK004BSPEC‐135145‐20141217‐CARB Carbonate BoundDK004BSPEC‐135145‐20141218‐RED ReducibleDK004BSPEC‐135145‐20141219‐OXID OxidizableDK004BSPEC‐135145‐20141219‐RES ResidualNC054ASPEC‐015025‐20141216‐EXCH ExchangeableNC054ASPEC‐015025‐20141217‐CARB Carbonate BoundNC054ASPEC‐015025‐20141218‐RED ReducibleNC054ASPEC‐015025‐20141219‐OXID OxidizableNC054ASPEC‐015025‐20141219‐RES ResidualNC054ASPEC‐167180‐20141216‐EXCH ExchangeableNC054ASPEC‐167180‐20141217‐CARB Carbonate BoundNC054ASPEC‐167180‐20141218‐RED ReducibleNC054ASPEC‐167180‐20141219‐OXID OxidizableNC054ASPEC‐167180‐20141219‐RES ResidualNC054ASPEC‐295307‐20141216‐EXCH ExchangeableNC054ASPEC‐295307‐20141217‐CARB Carbonate BoundNC054ASPEC‐295307‐20141218‐RED ReducibleNC054ASPEC‐295307‐20141219‐OXID OxidizableNC054ASPEC‐295307‐20141219‐RES Residual
DK004B
NC054A
15 – 25
45 – 55
135 – 145
15 – 25
167 – 180
295 – 307
Station ID Sample ID
Sample Depth (cm)
Sequential Extraction Phase
3.64 J 0.001 UJ 2 UJ 6,700 1.6 UJ 1 UJ 28,000 J 2 UJ 5 J 0.6 J 4 UJ40.3 0.001 UJ 7.77 J 1,000 J 1.6 U 1 U 360,000 J 2 U 5 U 10.6 30477.6 J 0.001 UJ 10.7 J 400 J 1.6 U 1 U 7,400 J 2 U 7.8 J 13.3 253 J100 J 0.001 UJ 18.5 320 J 1.6 U 1 U 160 U 2 U 49 2.28 J 61.182.5 1.787 12.4 1,280 0.5 U 13 302 J 0.73 27 18.3 35.41.93 0.0007 UJ 6.61 4,500 0.2 UJ 0.1 UJ 16,000 J 0.3 UJ 0.7 UJ 0.414 J 5.60 J29.6 0.0007 UJ 63.9 710 J 0.843 J 0.1 U 260,000 J 0.3 U 0.71 J 17.3 73650.4 J 0.0007 UJ 46.8 190 J 0.2 U 0.1 U 4,200 J 0.3 U 10 33.4 625 J78.6 J 0.001 J 124 93 J 2 0.1 U 140 J 0.3 U 14 6.63 28338.4 2.265 17.3 825 J 2.47 18 354 J 0.09 J 93 21.4 50.17.75 0.001 UJ 8.63 7,000 0.3 UJ 0.2 UJ 25,000 J 0.4 UJ 1 UJ 0.462 J 11.042.9 0.001 UJ 189 1,400 J 1.60 J 0.2 U 370,000 J 0.4 U 1.6 J 27.9 1,32060.1 J 0.001 UJ 149 520 J 0.3 U 0.2 U 9,300 J 0.4 U 82 65.9 1,620 J60.2 J 0.02 J 301 290 J 8.86 0.2 U 250 J 0.4 U 51 18.5 80261.4 9.090 20.5 1,700 J 8.37 142 876 J 0.24 J 319 34.2 71.61.51 0.0008 UJ 0.308 J 5,200 0.2 UJ 0.2 UJ 23,000 J 0.3 UJ 0.8 UJ 0.331 J 1.84 J33.0 0.0008 UJ 6.83 1,300 J 0.805 J 0.2 U 260,000 J 0.3 U 0.98 J 10.0 12366.2 J 0.0008 UJ 11.9 360 J 0.2 U 0.2 U 12,000 J 0.3 U 0.9 J 12.0 307 J88.7 J 0.0008 UJ 27.7 220 J 1.22 0.2 U 110 J 0.3 U 23 2.63 88149 1.816 23.8 1,860 0.6 U 17 278 J 0.18 J 59 30.8 69.99.22 0.0009 UJ 8.62 J 5,100 0.3 UJ 0.2 UJ 13,000 J 0.3 UJ 0.9 UJ 0.241 J 6.50 J55.5 0.0009 UJ 221 1,100 J 1.16 J 0.2 U 280,000 J 0.3 U 2 J 25.9 1,51075.2 J 0.0009 UJ 182 290 J 0.3 U 0.2 U 9,500 J 0.3 U 12 41.3 1,810 J61.8 J 0.004 J 560 170 J 3.95 0.2 U 100 J 0.3 U 25 10.1 87992.3 14.41 61.6 2,000 5.03 41 331 J 0.23 J 76 30.8 86.615.6 0.001 UJ 3.34 J 9,100 0.4 UJ 0.3 UJ 19,000 J 0.6 UJ 1.4 UJ 0.300 J 4.96 J127 0.001 UJ 123 1,400 J 1.91 J 0.3 U 500,000 J 0.6 U 4.1 J 12.9 799122 J 0.001 UJ 98.4 830 J 0.4 U 0.3 U 10,000 J 0.6 U 13 J 16.0 989 J86.1 J 0.6 J 270 300 J 22.1 0.3 U 190 J 0.6 U 57 2.00 89382.7 4.325 21.0 1,980 25.8 21 428 J 0.23 J 519 23.0 168
Manganese (mg/kg)
Mercury (mg/kg)
Sodium (mg/kg)
Nickel (mg/kg)
Potassium (mg/kg)
Selenium (mg/kg)
Zinc (mg/kg)
Thallium (mg/kg)
Tin (mg/kg)
Vanadium (mg/kg)
Silver (mg/kg)
Metals Speciation ResultsNewtown Creek RI/FS 2 of 6
October 2018181037-01.01

Table 7Phase 1 Archived Core Samples Sequential Extraction
Aluminum (mg/kg)
Antimony (mg/kg)
Arsenic (mg/kg)
Barium (mg/kg)
Beryllium (mg/kg)
Cadmium (mg/kg)
Calcium (mg/kg)
Chromium (mg/kg)
Cobalt (mg/kg)
Copper (mg/kg)
Iron (mg/kg)
Lead (mg/kg)
Magnesium (mg/kg)
Station ID Sample ID
Sample Depth (cm)
Sequential Extraction Phase
NC064BSPEC‐015025‐20141216‐EXCH Exchangeable 17 1.09 J 0.7 U 859 0.1 U 0.102 J 1,300 1.1 0.5 U 8.58 37 1.45 310,000NC064BSPEC‐015025‐20141217‐CARB Carbonate Bound 230 7.3 J 19.8 455 J 0.1 U 14.1 2,700 J 33 1.74 J 48.6 8,000 145 8,800NC064BSPEC‐015025‐20141218‐RED Reducible 4,200 J 1.86 J 37.1 444 J 0.39 J 20.1 11,000 J 200 J 4.03 1,670 J 5,800 J 453 1,900 JNC064BSPEC‐015025‐20141219‐OXID Oxidizable 1,200 J 1.26 J 46.2 12.9 0.1 U 9.93 130 140 J 10.9 4,450 J 6,500 120 510NC064BSPEC‐015025‐20141219‐RES Residual 8,220 38.6 81.6 104 0.312 J 0.3 J 1,100 U 45.6 3.95 182 9,680 238 2,950NC064BSPEC‐081091‐20141216‐EXCH Exchangeable 8.2 J 1.86 J 0.2 U 507 0.1 U 0.719 1,200 1.9 0.816 J 8.67 19 0.693 J 250,000NC064BSPEC‐081091‐20141217‐CARB Carbonate Bound 250 8.15 J 12.3 426 J 0.1 U 21.1 3,700 J 72 7.68 420 3,300 81.7 11,000NC064BSPEC‐081091‐20141218‐RED Reducible 4,300 J 5.32 J 137 554 J 0.43 J 13.1 26,000 J 380 J 4.67 4,590 J 11,000 J 791 1,500 JNC064BSPEC‐081091‐20141219‐OXID Oxidizable 840 J 3.17 J 93 13.9 0.1 U 9.47 180 200 J 14.5 16,400 J 11,000 179 310NC064BSPEC‐081091‐20141219‐RES Residual 7,890 81 172 141 0.28 J 0.523 790 U 76.3 4.75 503 11,600 230 3,120NC064BSPEC‐142155‐20141216‐EXCH Exchangeable 9.1 J 2 J 0.6 U 646 0.1 U 0.06 U 1,100 0.48 J 0.5 U 6.50 22 0.778 J 280,000NC064BSPEC‐142155‐20141217‐CARB Carbonate Bound 230 10.2 31 473 J 0.1 U 7.07 2,600 J 31 4.25 80.8 7,600 127 17,000NC064BSPEC‐142155‐20141218‐RED Reducible 3,600 J 2.76 J 119 483 J 0.44 J 8.64 16,000 J 120 J 4.17 2,920 J 8,200 J 683 1,300 JNC064BSPEC‐142155‐20141219‐OXID Oxidizable 920 J 3.54 J 83.3 12.1 0.1 U 6.15 130 100 J 12.4 10,200 J 9,000 148 320NC064BSPEC‐142155‐20141219‐RES Residual 7,530 70.3 138 290 0.352 J 0.765 770 U 46.1 4.19 465 10,000 158 2,720NC070BSPEC‐015025‐20141216‐EXCH Exchangeable 29 0.96 J 0.2 U 526 0.1 U 0.149 J 1,700 1.2 0.5 U 5.26 28 1.07 280,000NC070BSPEC‐015025‐20141217‐CARB Carbonate Bound 520 5.69 J 14.3 538 J 0.1 U 43.6 3,400 J 73 9.06 46.3 9,300 220 15,000NC070BSPEC‐015025‐20141218‐RED Reducible 6,800 J 2.95 J 74 662 J 0.58 59.9 11,000 J 510 J 9.9 3,020 J 11,000 J 770 2,500 JNC070BSPEC‐015025‐20141219‐OXID Oxidizable 1,300 J 2.12 J 23.1 19.4 0.1 U 35.3 180 360 J 26.4 6,660 J 6,700 154 520NC070BSPEC‐015025‐20141219‐RES Residual 8,190 117 138 183 0.4 U 1.33 1,400 U 131 8.41 270 11,200 248 3,020NC070BSPEC‐085095‐20141216‐EXCH Exchangeable 13 2.69 J 0.2 U 370 0.1 U 0.156 J 1,600 1.3 0.5 U 5.33 25 0.716 J 260,000NC070BSPEC‐085095‐20141217‐CARB Carbonate Bound 400 15.2 39.1 416 J 0.1 U 14.9 3,200 J 88 7.63 10.5 14,000 150 18,000NC070BSPEC‐085095‐20141218‐RED Reducible 7,000 J 4.64 J 84.4 860 J 0.76 128 11,000 J 690 J 15.8 2,110 J 9,200 J 741 2,000 JNC070BSPEC‐085095‐20141219‐OXID Oxidizable 1,100 J 3.41 J 20.5 28.6 0.1 U 77.7 140 440 J 52 7,860 J 6,200 223 390NC070BSPEC‐085095‐20141219‐RES Residual 7,700 71.9 195 259 0.235 J 1.66 730 U 149 19.6 312 11,700 472 2,800NC070BSPEC‐125136‐20141216‐EXCH Exchangeable 21 3.12 J 0.2 U 720 0.1 U 0.296 J 1,700 2.2 0.6 U 9.37 43 1.67 370,000NC070BSPEC‐125136‐20141217‐CARB Carbonate Bound 440 26.4 40.7 622 J 0.1 U 33.0 3,300 J 100 6.95 19.6 15,000 198 12,000NC070BSPEC‐125136‐20141218‐RED Reducible 6,200 J 5.44 J 88.6 843 J 0.67 107 12,000 J 690 J 8.98 2,860 J 9,400 J 749 1,600 JNC070BSPEC‐125136‐20141219‐OXID Oxidizable 1,100 J 4.78 J 29.6 22 0.1 U 53.2 120 370 J 29.9 6,440 J 6,300 207 440NC070BSPEC‐125136‐20141219‐RES Residual 8,640 53.9 131 178 0.284 J 1.57 800 U 133 6.88 535 13,000 314 3,180
NC064B
NC070B
15 – 25
81 – 91
142 – 155
15 – 25
85 – 95
125 – 136
Metals Speciation ResultsNewtown Creek RI/FS 3 of 6
October 2018181037-01.01

Table 7Phase 1 Archived Core Samples Sequential Extraction
Station ID Sample ID
Sample Depth (cm)
Sequential Extraction Phase
NC064BSPEC‐015025‐20141216‐EXCH ExchangeableNC064BSPEC‐015025‐20141217‐CARB Carbonate BoundNC064BSPEC‐015025‐20141218‐RED ReducibleNC064BSPEC‐015025‐20141219‐OXID OxidizableNC064BSPEC‐015025‐20141219‐RES ResidualNC064BSPEC‐081091‐20141216‐EXCH ExchangeableNC064BSPEC‐081091‐20141217‐CARB Carbonate BoundNC064BSPEC‐081091‐20141218‐RED ReducibleNC064BSPEC‐081091‐20141219‐OXID OxidizableNC064BSPEC‐081091‐20141219‐RES ResidualNC064BSPEC‐142155‐20141216‐EXCH ExchangeableNC064BSPEC‐142155‐20141217‐CARB Carbonate BoundNC064BSPEC‐142155‐20141218‐RED ReducibleNC064BSPEC‐142155‐20141219‐OXID OxidizableNC064BSPEC‐142155‐20141219‐RES ResidualNC070BSPEC‐015025‐20141216‐EXCH ExchangeableNC070BSPEC‐015025‐20141217‐CARB Carbonate BoundNC070BSPEC‐015025‐20141218‐RED ReducibleNC070BSPEC‐015025‐20141219‐OXID OxidizableNC070BSPEC‐015025‐20141219‐RES ResidualNC070BSPEC‐085095‐20141216‐EXCH ExchangeableNC070BSPEC‐085095‐20141217‐CARB Carbonate BoundNC070BSPEC‐085095‐20141218‐RED ReducibleNC070BSPEC‐085095‐20141219‐OXID OxidizableNC070BSPEC‐085095‐20141219‐RES ResidualNC070BSPEC‐125136‐20141216‐EXCH ExchangeableNC070BSPEC‐125136‐20141217‐CARB Carbonate BoundNC070BSPEC‐125136‐20141218‐RED ReducibleNC070BSPEC‐125136‐20141219‐OXID OxidizableNC070BSPEC‐125136‐20141219‐RES Residual
NC064B
NC070B
15 – 25
81 – 91
142 – 155
15 – 25
85 – 95
125 – 136
Manganese (mg/kg)
Mercury (mg/kg)
Sodium (mg/kg)
Nickel (mg/kg)
Potassium (mg/kg)
Selenium (mg/kg)
Zinc (mg/kg)
Thallium (mg/kg)
Tin (mg/kg)
Vanadium (mg/kg)
Silver (mg/kg)
2.69 0.001 UJ 4.95 6,000 0.3 U 0.2 U 23,000 J 0.4 U 1 U 0.408 J 9.9845.9 0.008 J 194 1,400 J 1.55 J 0.2 U 350,000 J 0.4 U 1.5 J 18.7 1,13066.4 J 0.001 UJ 274 300 J 0.3 U 0.2 U 9,300 J 0.4 U 9.2 J 28.8 1,190 J68.3 J 0.003 J 930 160 J 5.36 0.2 U 110 J 0.4 U 37 8.63 60080.2 4.934 57.5 1,790 3.96 44 290 J 0.18 J 138 26.8 72.48.59 0.0009 J 86.7 4,700 0.3 U 0.2 U 16,000 J 0.4 U 0.9 U 0.237 J 33.250.5 0.0009 UJ 1110 1,100 J 1.16 J 0.2 U 300,000 J 0.4 U 2 J 11.5 2,89075.4 J 0.0009 UJ 518 260 J 0.3 U 0.2 U 12,000 J 0.4 U 19 64.1 1,200 J50.8 J 0.006 J 1550 88 J 5.74 0.2 U 110 J 0.4 U 17 10.7 81891.0 6.253 77.2 1,730 5.84 66 229 J 0.20 J 168 31.3 91.07.02 0.0009 J 21.8 5,000 0.3 U 0.2 U 17,000 J 0.4 U 0.9 U 0.417 J 8.0366.4 0.0009 UJ 588 1,300 J 1.05 J 0.2 U 310,000 J 0.4 U 1.6 J 16.1 1,84096.3 J 0.0009 UJ 322 270 J 0.3 U 0.2 U 11,000 J 0.4 U 13 29.1 1,370 J49.5 J 0.002 J 1150 110 J 11.1 0.2 U 110 J 0.42 J 21 6.44 97273.9 8.632 43.4 1,620 12.4 35 217 J 0.29 J 198 21.3 1288.65 0.001 UJ 12.7 5,500 0.3 U 0.2 U 23,000 J 0.4 U 1 U 0.297 J 13.651.3 0.001 UJ 358 1,800 J 1.38 J 0.2 U 320,000 J 0.4 U 1.8 J 35.0 3,62080.2 J 0.001 UJ 291 390 J 0.3 U 0.2 U 14,000 J 0.4 U 18 65.3 2,650 J66.0 J 0.006 J 1030 150 J 8.84 0.2 U 140 J 0.4 U 28 13.2 1,53085.3 9.995 200 1,780 J 5.48 143 307 J 0.21 J 304 31.0 1327.58 0.0009 UJ 11.2 5,000 0.3 U 0.2 U 21,000 J 0.4 U 0.9 U 0.303 J 11.657.9 0.0009 UJ 383 1,900 J 1.28 J 0.2 U 310,000 J 0.4 U 1.9 J 37.0 3,39090.3 J 0.0009 UJ 502 460 J 0.3 U 0.2 U 13,000 J 0.4 U 26 68.7 5,410 J62.6 J 0.006 J 2480 140 J 7.25 0.2 U 150 J 0.4 U 5 U 20.4 18884.7 10.08 167 1,620 6.40 77 386 J 0.24 J 193 34.9 1469.51 0.001 J 17.5 6,800 0.4 U 0.3 U 25,000 J 0.5 U 1 U 0.420 J 21.966.8 0.001 UJ 616 1,900 J 1.70 J 0.3 U 430,000 J 0.5 U 2.6 J 44.1 4,47095.1 J 0.001 UJ 574 370 J 0.4 U 0.3 U 12,000 J 0.5 U 28 63.1 4,800 J60.1 J 0.01 J 2480 150 J 6.85 0.3 U 140 J 0.5 U 47 17.5 2,53094.8 9.189 103 1,730 10.7 86 224 J 0.22 J 192 34.5 160
Metals Speciation ResultsNewtown Creek RI/FS 4 of 6
October 2018181037-01.01
Table 7Phase 1 Archived Core Samples Sequential Extraction
Aluminum (mg/kg)
Antimony (mg/kg)
Arsenic (mg/kg)
Barium (mg/kg)
Beryllium (mg/kg)
Cadmium (mg/kg)
Calcium (mg/kg)
Chromium (mg/kg)
Cobalt (mg/kg)
Copper (mg/kg)
Iron (mg/kg)
Lead (mg/kg)
Magnesium (mg/kg)
Station ID Sample ID
Sample Depth (cm)
Sequential Extraction Phase
NC079ASPEC‐015025‐20141216‐EXCH Exchangeable 3.6 J 0.8 U 0.2 U 1,310 0.1 U 0.07 U 380 0.96 J 0.5 U 0.824 J 6.3 J 0.196 U 300,000NC079ASPEC‐015025‐20141217‐CARB Carbonate Bound 30 0.8 U 0.2 U 229 J 0.1 U 0.471 J 2,000 J 1.5 0.5 U 9.60 170 4.73 2,400NC079ASPEC‐015025‐20141218‐RED Reducible 680 J 0.8 U 0.6 U 64.5 J 0.1 U 0.07 U 3,400 J 3.8 J 0.784 J 10.6 J 1,100 J 1.54 2,000 JNC079ASPEC‐015025‐20141219‐OXID Oxidizable 690 J 0.8 U 0.2 U 3.78 0.1 U 0.07 U 96 4.1 J 1.94 J 11.2 J 4,600 0.284 J 530NC079ASPEC‐015025‐20141219‐RES Residual 2,970 0.116 J 1.15 18.3 0.1 U 0.04 U 440 U 5.52 1.60 1.63 J 4,080 0.625 J 1,670NC079ASPEC‐075085‐20141216‐EXCH Exchangeable 9 J 0.8 U 0.2 U 1,280 0.1 U 0.07 U 670 0.35 J 0.5 U 0.524 J 11 0.194 U 300,000NC079ASPEC‐075085‐20141217‐CARB Carbonate Bound 43 0.8 U 0.447 J 222 J 0.1 U 0.379 J 4,600 J 0.82 J 0.5 U 0.874 J 150 2.41 8,000NC079ASPEC‐075085‐20141218‐RED Reducible 1,700 J 0.8 U 1.2 U 148 J 0.23 J 0.07 U 2,300 J 7.2 J 2.10 7.06 J 2,700 J 1.90 1,700 JNC079ASPEC‐075085‐20141219‐OXID Oxidizable 1,500 J 0.8 U 0.2 U 11.1 0.1 U 0.07 U 170 7.3 J 4.07 16.6 J 9,200 1.05 970NC079ASPEC‐075085‐20141219‐RES Residual 10,300 0.163 J 3.71 56 0.43 J 0.05 U 695 J 23.5 5.90 7.20 17,000 3.05 5,960NC079ASPEC‐150160‐20141216‐EXCH Exchangeable 5.8 J 0.7 U 0.2 U 1,280 0.1 U 0.06 U 320 0.33 J 0.5 U 0.752 J 19 0.183 U 280,000NC079ASPEC‐150160‐20141217‐CARB Carbonate Bound 17 0.7 U 0.2 U 182 J 0.1 U 0.358 J 570 J 0.23 J 0.5 U 1.58 64 0.385 J 1,500NC079ASPEC‐150160‐20141218‐RED Reducible 240 J 0.7 U 0.2 U 5.17 J 0.1 U 0.06 U 4,600 J 0.74 J 0.5 U 1.92 J 480 J 0.330 J 2,700 JNC079ASPEC‐150160‐20141219‐OXID Oxidizable 280 J 0.7 U 0.2 U 1.17 0.1 U 0.06 U 54 1.2 J 0.587 J 2.31 J 1,300 0.183 U 170NC079ASPEC‐150160‐20141219‐RES Residual 1,280 0.007 U 0.1 U 8.37 0.1 U 0.04 U 420 U 2.01 J 0.634 J 0.696 J 1,460 0.264 U 692
NC1064BSPEC‐081091‐20141216‐EXCH Exchangeable 12 1.19 J 0.6 U 553 0.1 U 0.570 1,200 1.3 0.588 J 17.9 28 1.37 270,000NC1064BSPEC‐081091‐20141217‐CARB Carbonate Bound 200 7.57 J 10.8 426 J 0.1 U 17.5 3,700 J 71 7.15 420 2,800 68.1 9,600NC1064BSPEC‐081091‐20141218‐RED Reducible 3,900 J 5.56 J 132 565 J 0.39 J 11.5 25,000 J 370 J 4.42 4,610 J 11,000 J 771 1,400 JNC1064BSPEC‐081091‐20141219‐OXID Oxidizable 750 J 2.88 J 94.7 13.3 0.1 U 8.74 160 190 J 14.1 15,500 J 11,000 175 290NC1064BSPEC‐081091‐20141219‐RES Residual 7,070 67.1 153 122 0.258 J 0.364 J 720 U 64.6 4.20 489 11,100 148 2,730
Notes:cm = centimeterJ = estimated valuemg/kg = milligram per kilogramU = nondetect at method detection limitUJ = nondetect at method detection limit; estimated value
150 – 160
NC079A
81 – 91NC064B
15 – 25
75 – 85
Metals Speciation ResultsNewtown Creek RI/FS 5 of 6
October 2018181037-01.01

Table 7Phase 1 Archived Core Samples Sequential Extraction
Station ID Sample ID
Sample Depth (cm)
Sequential Extraction Phase
NC079ASPEC‐015025‐20141216‐EXCH ExchangeableNC079ASPEC‐015025‐20141217‐CARB Carbonate BoundNC079ASPEC‐015025‐20141218‐RED ReducibleNC079ASPEC‐015025‐20141219‐OXID OxidizableNC079ASPEC‐015025‐20141219‐RES ResidualNC079ASPEC‐075085‐20141216‐EXCH ExchangeableNC079ASPEC‐075085‐20141217‐CARB Carbonate BoundNC079ASPEC‐075085‐20141218‐RED ReducibleNC079ASPEC‐075085‐20141219‐OXID OxidizableNC079ASPEC‐075085‐20141219‐RES ResidualNC079ASPEC‐150160‐20141216‐EXCH ExchangeableNC079ASPEC‐150160‐20141217‐CARB Carbonate BoundNC079ASPEC‐150160‐20141218‐RED ReducibleNC079ASPEC‐150160‐20141219‐OXID OxidizableNC079ASPEC‐150160‐20141219‐RES Residual
NC1064BSPEC‐081091‐20141216‐EXCH ExchangeableNC1064BSPEC‐081091‐20141217‐CARB Carbonate BoundNC1064BSPEC‐081091‐20141218‐RED ReducibleNC1064BSPEC‐081091‐20141219‐OXID OxidizableNC1064BSPEC‐081091‐20141219‐RES Residual
Notes:cm = centimeterJ = estimated valuemg/kg = milligram per kilogramU = nondetect at method detection limitUJ = nondetect at method detection limit; estimated value
150 – 160
NC079A
81 – 91NC064B
15 – 25
75 – 85
Manganese (mg/kg)
Mercury (mg/kg)
Sodium (mg/kg)
Nickel (mg/kg)
Potassium (mg/kg)
Selenium (mg/kg)
Zinc (mg/kg)
Thallium (mg/kg)
Tin (mg/kg)
Vanadium (mg/kg)
Silver (mg/kg)
1.43 0.0010 UJ 1.25 J 5,500 0.3 U 0.2 U 11,000 J 0.4 U 1 U 0.539 J 1.81 J22.5 0.0010 UJ 4.18 560 J 1.32 J 0.2 U 330,000 J 0.4 U 1.4 J 1.62 26.120.8 J 0.0010 UJ 2.48 120 J 0.3 U 0.2 U 1,200 J 0.4 U 1 U 4.12 18.6 J89.1 J 0.0010 UJ 6.12 220 J 0.3 U 0.2 U 78 J 0.4 U 41 0.833 J 11.833.4 0.0228 3.80 1,160 0.4 U 0.056 J 121 J 0.071 J 0.86 8.52 18.40.932 J 0.0010 UJ 0.398 J 5,600 0.3 U 0.2 U 12,000 J 0.4 U 1 U 1.17 1.54 J29.1 0.0010 UJ 0.806 J 750 J 1.10 J 0.2 U 330,000 J 0.4 U 1.7 J 4.14 3.87 J46.3 J 0.0010 UJ 4.05 380 J 0.3 U 0.2 U 5,600 J 0.4 U 1 U 13.0 17.4 J150 J 0.0010 UJ 8.67 550 J 0.3 U 0.2 U 120 J 0.4 U 37 0.1 U 14.0148 0.0195 14.8 3,340 0.5 U 0.063 J 189 J 0.23 J 1.2 35.6 54.22.11 0.0009 UJ 0.422 J 5,000 0.3 U 0.2 U 9,200 J 0.4 U 0.9 U 0.312 J 1.23 J14.1 0.0009 UJ 0.596 J 460 J 0.972 J 0.2 U 320,000 J 0.4 U 1.7 J 0.615 J 2.75 J12.1 J 0.0009 UJ 0.771 J 40 U 0.3 U 0.2 U 700 J 0.4 U 7 1.43 6.60 J27.1 J 0.0009 UJ 1.97 J 56 J 0.3 U 0.2 U 60 J 0.4 U 32 1.06 3.76 J17.6 0.003 J 2.15 176 J 0.3 U 0.010 J 75 J 0.04 U 0.254 J 1.45 4.90 J8.21 0.002 J 67.6 5,100 0.3 U 0.2 U 17,000 J 0.4 U 0.9 U 0.342 J 26.851.1 0.0009 UJ 1040 1,100 J 1.04 J 0.2 U 280,000 J 0.4 U 1.8 J 9.56 2,52071.5 J 0.0009 UJ 489 250 J 0.3 U 0.2 U 12,000 J 0.4 U 18 62.1 1,180 J48.6 J 0.008 J 1530 88 J 5.54 0.2 U 84 J 0.4 U 1.8 J 10.4 84876.4 6.732 68.6 1,590 6.02 51 192 J 0.23 J 143 27.8 79.3
Metals Speciation ResultsNewtown Creek RI/FS 6 of 6
October 2018181037-01.01

Table 8Surface Sediment Duplicate Sample Reproducibility
Aluminum (mg/kg) 1.7 J 1.6 J 2.3 151 170 12.4 2,300 2,250 2.2 1,740 2,090 18.3 1,720 4,590 91.0Antimony (mg/kg) 0.63 U 0.62 U ‐‐ 0.63 U 3.9 J ‐‐ 1.1 J 0.62 U ‐‐ 0.63 U 2.5 J ‐‐ 9.4 2.6 113Arsenic (mg/kg) 0.16 U 0.15 U ‐‐ 6.2 7.1 12.8 13.7 12.7 7.6 14.5 17.8 20.5 4.9 11.9 83.0Barium (mg/kg) 617 612 0.76 265 296 10.8 225 208 7.7 14.1 14.3 1.6 160 321 66.9Beryllium (mg/kg) 0.08 U 0.08 U ‐‐ 0.08 U 0.08 U ‐‐ 0.27 J 0.23 J 14.8 0.10 J 0.08 J 28.3 0.15 U 0.21 U ‐‐Cadmium (mg/kg) 0.06 U 0.05 U ‐‐ 0.36 J 0.43 15.6 27.6 27.2 1.4 27.9 30.0 7.2 0.35 0.57 48.3Calcium (mg/kg) 1,190 1,160 2.6 3,010 3,250 7.7 3,800 3,410 10.8 452 325 32.5 514 U 718 U ‐‐Chromium (mg/kg) 0.16 U 0.15 U ‐‐ 22.2 24.0 7.9 78.4 77.4 1.3 182 263 36.4 18.4 48.3 89.7Cobalt (mg/kg) 0.40 U 0.39 U ‐‐ 0.46 J 0.50 J 9.1 1.7 1.5 J 13.1 5.8 7.1 20.5 1.3 1.9 36.0Copper (mg/kg) 0.25 J 0.26 J 3.8 1.2 1.1 11.4 16.5 19.7 18.0 1,046 1,293 21.2 40.1 85.6 72.4Iron (mg/kg) 3.3 J 3.1 J 7.2 7,210 7,590 5.1 4,440 3,870 13.7 5,940 7,743 26.4 2,530 6,780 91.3Lead (mg/kg) 0.16 U 0.15 U ‐‐ 73.0 82.9 12.6 223 222 0.17 226 235 4.2 108 203 61.1Magnesium (mg/kg) 206,000 194,000 6.0 13,500 13,900 2.9 2,060 1,860 10.2 459 542 16.5 603 J 1,590 90.0Manganese (mg/kg) 3.6 3.7 3.1 21.2 22.4 5.3 27.8 24.9 11.2 48.7 65.7 29.7 16.5 35.4 72.8Mercury (mg/kg) 0.00 U 0.00 U ‐‐ 0.00 U 0.00 U ‐‐ 0.00 U 0.00 U ‐‐ 0.91 1.4 44.7 3.2 7.1 76.4Nickel (mg/kg) 0.60 J 0.62 J 2.8 21.2 23.8 12.0 41.7 38.2 9.0 185 228 20.5 15.4 20.9 30.3Potassium (mg/kg) 3,880 3,870 0.26 792 929 15.9 198 170 J 15.0 111 J 155 J 33.1 346 J 952 J 93.4Selenium (mg/kg) 0.24 U 0.23 U ‐‐ 1.6 1.9 14.8 0.24 U 0.23 U ‐‐ 2.5 3.3 29.3 0.42 U 1.5 J ‐‐Silver (mg/kg) 0.16 U 0.15 U ‐‐ 0.16 U 0.15 U ‐‐ 0.16 U 0.15 U ‐‐ 0.55 J 0.85 43.6 10.2 6.9 38.3Sodium (mg/kg) 17,400 17,800 2.3 190,000 232,000 19.9 17,400 16,300 6.5 23.8 U 23.2 U ‐‐ 73.3 J 126 J 52.9Thallium (mg/kg) 0.32 U 0.31 U ‐‐ 0.32 U 0.31 U ‐‐ 0.32 U 0.31 U ‐‐ 0.32 U 0.31 U ‐‐ 0.05 U 0.10 J ‐‐Tin (mg/kg) 0.79 U 0.77 U ‐‐ 0.87 J 2.2 J 85.3 1.2 J 1.2 J 4.2 2.6 J 2.6 J 0.70 62.6 23.6 90.5Vanadium (mg/kg) 0.12 J 0.15 J 21.3 15.0 16.9 12.0 20.8 19.7 5.4 6.5 7.8 19.0 12.7 27.7 74.3Zinc (mg/kg) 13.4 10.5 24.6 290 325 11.5 1,545 1,430 7.7 959 1,110 14.6 20.8 51.0 84.1Notes:Mass loss was noted for F5 during the EK006 analysis. The sample was re‐analyzed and reported as EK2006.RPD not calculated for nondetect results.F1 = ExchangeableF2 = Weak Acid Soluble (Carbonate Bound)F3 = Reducible (Iron/Manganese Oxide Bound)F4 = Oxidizable (Sulfide/Organic Matter Bound)F5 = ResidualJ = estimated valuemg/kg = milligram per kilogramRPD = relative percent differenceU = nondetect at method detection limit
F1 F1EK006SG Duplicate
F2 RPD RPDF2EK006SG Duplicate
RPDEK006SPEC‐000015‐20141111 RPD RPD F5 F5EK006SG Duplicate
F3 F3EK006SG Duplicate
F4 F4EK006SG Duplicate
Metals Speciation Results Newtown Creek RI/FS 1 of 1
October 2018181037-01.01

Table 9Subsurface Sediment Duplicate Sample Reproducibility
Aluminum (mg/kg) 8.14 J 12.3 40.4 245 201 19.6 4,286 J 3,938 J 8.47 840 J 744 J 12.1 7,890 7,070 11.0Antimony (mg/kg) 1.85 J 1.19 J 43.6 8.13 J 7.55 J 7.32 5.31 J 5.55 J 4.39 3.16 J 2.87 J 9.54 81.0 67.1 18.8Arsenic (mg/kg) 0.175 U 0.630 U ‐‐ 12.2 10.8 12.9 136 131 3.88 92.7 94.5 1.91 172 153 11.7Barium (mg/kg) 506 551 8.65 425 J 425 J 0.043 552 J 564 J 2.08 13.9 13.3 4.46 141 122 14.4Beryllium (mg/kg) 0.087 U 0.088 U ‐‐ 0.087 U 0.088 U ‐‐ 0.429 J 0.394 J 8.47 0.087 U 0.088 U ‐‐ 0.280 0.258 8.18Cadmium (mg/kg) 0.717 0.569 23.1 21.0 17.4 18.6 13.0 11.5 12.8 9.45 8.72 8.05 0.523 0.364 35.9Calcium (mg/kg) 1,230 1,230 0.000 3,670 J 3,676 J 0.151 26,200 J 24,500 J 6.71 175 158 10.5 791 720 9.40Chromium (mg/kg) 1.92 1.31 37.8 71.7 70.9 1.18 376 J 368 J 2.31 201 J 193 J 4.40 76.3 64.6 16.6Cobalt (mg/kg) 0.814 J 0.586 J 32.5 7.65 7.13 7.06 4.65 4.41 5.36 14.4 14.1 2.41 4.75 4.20 12.3Copper (mg/kg) 8.64 17.9 69.5 419 419 0.043 4,575 J 4,594 J 0.425 16,400 J 15,500 J 5.64 503 489 2.82Iron (mg/kg) 19.2 28.0 37.1 3,324 2,800 17.1 11,372 J 10,502 J 7.96 10,500 10,500 0.000 11,600 11,100 4.41Lead (mg/kg) 0.691 J 1.37 65.6 81.4 67.9 18.1 789 769 2.54 178 174 2.44 230 148 43.4Magnesium (mg/kg) 254,000 271,000 6.48 10,500 9,626 8.68 1,487 J 1,400 J 6.02 306 289 5.84 3,120 2,730 13.3Manganese (mg/kg) 8.56 8.19 4.45 50.4 51.0 1.25 75.1 J 71.3 J 5.21 50.6 J 48.5 J 4.37 91.0 76.4 17.4Mercury (mg/kg) 0.001 J 0.002 J 66.7 0.001 U 0.001 U 0.043 0.001 U 0.001 U ‐‐ 0.006 J 0.008 J 25.0 6.25 6.73 7.38Nickel (mg/kg) 86.4 67.5 24.6 1,102 1,033 6.51 517 488 5.70 1,548 1,523 1.67 77.2 68.6 11.8Potassium (mg/kg) 4,720 5,100 7.74 1,050 J 1,138 J 8.04 262 J 254 J 3.35 87.5 J 87.5 J 0.043 1,730 1,590 8.43Selenium (mg/kg) 0.262 U 0.263 U ‐‐ 1.15 J 1.03 J 11.2 0.262 U 0.263 U ‐‐ 5.72 5.53 3.38 5.84 6.02 3.04Silver (mg/kg) 0.175 U 0.175 U ‐‐ 0.175 U 0.175 U 0.043 0.175 U 0.175 U ‐‐ 0.175 U 0.175 U ‐‐ 66.0 50.9 25.8Sodium (mg/kg) 15,700 J 16,600 J 5.57 297,000 J 280,000 J 5.89 12,200 J 12,300 J 0.816 105 J 84.0 J 22.2 229 192 17.6Thallium (mg/kg) 0.350 U 0.350 U ‐‐ 0.350 U 0.350 U ‐‐ 0.350 U 0.350 U ‐‐ 0.350 U 0.350 U ‐‐ 0.198 0.234 16.7Tin (mg/kg) 0.875 U 0.875 U ‐‐ 2.01 J 1.75 J 13.9 19.2 18.4 4.61 16.6 1.84 J 160 168 143 16.1Vanadium (mg/kg) 0.236 J 0.341 J 36.4 11.5 9.54 18.3 63.9 62.0 3.15 10.7 10.3 3.29 31.3 27.8 11.8Zinc (mg/kg) 33.1 26.7 21.3 2,880 2,500 14.1 1,200 J 1,170 J 2.53 816 846 3.62 91.0 79.3 13.7Notes:F1 = ExchangeableF2 = Weak Acid Soluble (Carbonate Bound)F3 = Reducible (Iron/Manganese Oxide Bound)F4 = Oxidizable (Sulfide/Organic Matter Bound)F5 = ResidualJ = estimated valuemg/kg = milligram per kilogramRPD = relative percent differenceU = nondetect at method detection limit
F4 F5 F5F4F1 F1 F2 F2 F3 F3 RPDNC064BSPEC‐081091‐20141216 RPD RPD RPD RPDDuplicate NC064BS Duplicate NC064BS DuplicateNC064BS Duplicate NC064BS Duplicate NC064BS
Metals Speciation Results Newtown Creek RI/FS 1 of 1
October 2018181037-01.01

Table 10Electron Microprobe Narrative Summary
Sample ID Comments
EK006Fourteen points were analyzed, identified as quartz (Point 7), various aluminosilicates (Points 3, 4, 5, 8, 9, 10, 11, 12, 13, and 14), and sulfides (Points 2 and 10). Point 1 is likely carbon given the very similar average atomic mass to the epoxy matrix (see Figure 2a). Point 6 is a lead mineral, likely lead carbonate noting the large balance value on this analysis (carbon and oxygen not reported)
EK059Five points were analyzed, including a quartz grain (Point 4B), three aluminosilicates (Points 3A, 3B, and 4A), and an apparent iron oxide (oxygen not reported). Points 1 and 2 were identified in the original survey; however, the grain appears to have been lost during the final polishing prior to analysis.
NC064 142‐155Sixteen points were analyzed; nine (Points 1B, 2, 3B, 5, 6B, 7, 8, 9, and 13) were identified as copper and iron sulfides (including chalcopyrite, cubanite, and pyrite), one as silica (Point 1A), four aluminosilicates (Points 3A, 4, 6A, and 10A), carbon (Point 11) based on average atomic mass, and a carbon/aluminosilicate interface (Point 12).
NC070 15‐25Seven points were analyzed, including four identified as sulfides (Points 1A, 1B, 2D, and 4), including covellite and chalcopyrite, and three as aluminosilicates (Points 2A, 2B, and 2C). Point 3 was identified in the original survey; however, the grain appears to have been lost during the final polishing prior to analysis.
Metals Speciation ResultsNewtown Creek RI/FS 1 of 1
October 2018181037-01.01

FIGURES

DUTCHDUTCHKILLSKILLS
WHALEWHALECREEKCREEK
MASPETHMASPETHCREEKCREEK
ENGLISHENGLISHKILLSKILLS
EASTEASTBRANCHBRANCH
EAST RIVER
EAST RIVER
Calvary Cemetery§̈¦495
§̈¦278
§̈¦495
§̈¦278MEEKER AVE
11TH ST
MANHATTAN AVE
49TH AVE
58TH ST
NORMAN AVE
HUMBOLDT ST
KINGSLAND AVE
VANDERVOORT AVE
METROPOLITAN AVE
GREENPOINT AVE
GRAND AVE
SKILLMAN AVE
MAURICE AVE
LOMBARDY ST
BRIDGEWATER ST
HUNTERS POINT AVE
MASPETH AVE
57TH PL
MCGUINNESS BLVD
GREENPOINT AVE GR
AND ST
!(
!(
!(
!(
!(
!(
!(
!(
!(
!(
!(
!(
!(
!(
!(
!(
!(
!(
!(!(
!(
!(
!(
!(
!(
!(
!(
!(
!(
!(
!(
!(
!(
!(
!(
!(
!(
!(
!(
!(
!(
NEWTOWN CREEKNEWTOWN CREEK
DK004SC
NC079SC
NC064SC
NC070SCNC054SC
NC169SG
EK076SG
DK037SG
DK001SG
NC174SG
MC005SGNC162SG
NC167SG
WC010SG
NC013SGNC071SG
NC168SG
NC181SG
MC023SG
NC153SG
NC065SGNC165SG
EB006SG
NC180SG
NC037SGNC164SG
EK057SG
NC154SG
NC156SG
EK072SG
EK065SG
NC158SG
NC293SG
EK059SG
EB036SG
NC046SG
DK040SG
MC017SGNC161SG
WC012SG
EK006SG
Manhattan
Brooklyn
Queens
LEGENDNewtown Creek Study AreaNavigation ChannelWaterbodyOpen Space
!( Phase 2 Surface Sediment Triad StationsPhase 2 Surface Sediment Triad SamplesSelected for Speciation Analysis
!( Phase 1 Archived CoresSelected for Speciation Analysis
Q:\Jo
bs\11
0782
-01_N
ewTo
wnCr
eek\M
aps\A
Q_Me
eting
s\201
4_10
\AQ_P
h2_T
riad_
Metal
s_Sp
eciat
ion.m
xd c
kiblin
ger 4
/1/20
15 11
:20:55
AM
[
Figure 1Selected Metals Speciation Stations
Metals Speciation ResultsNewtown Creek RI/FS
0 500 1,000 1,500Feet

Figure 2aSummary Data and Back-scatter Electron Maps for Station EK006 Points 1 and 2
Metals Speciation ResultsNewtown Creek RI/FS
Weight Percent Al As Ba Cd Ca Cr Cu Fe Pb Mg Mn Ni K Si Na S Ti V Zn
EK006 Point 1 0.021 <0.020 0.008 0.011 0.022 0.001 0.005 0.052 0.027 <0.003 0.001 0.010 0.001 0.017 0.003 0.407 0.008 0.000 <0.003
EK006 Point 2 0.313 <0.037 <0.002 <0.010 0.150 0.008 0.042 28.1 <0.010 0.088 0.259 0.018 0.116 0.627 0.035 33.2 0.104 0.009 0.276
Al Aluminum Cd Cadmium Cu Copper Mg Magnesium K Potassium S Sulfur Zn Zinc As Arsenic Ca Calcium Fe Iron Mn Manganese Si Silicon Ti Titanium Ba Barium Cr Chromium Pb Lead Ni Nickel Na Sodium V Vanadium
Point 1 Point 2

Figure 2bSummary Data and Back-scatter Electron Maps for Station EK006 Points 3 and 4
Metals Speciation ResultsNewtown Creek RI/FS
Point 3 Point 4
Al Aluminum Cd Cadmium Cu Copper Mg Magnesium K Potassium S Sulfur Zn Zinc As Arsenic Ca Calcium Fe Iron Mn Manganese Si Silicon Ti Titanium Ba Barium Cr Chromium Pb Lead Ni Nickel Na Sodium V Vanadium
Weight Percent Al As Ba Cd Ca Cr Cu Fe Pb Mg Mn Ni K Si Na S Ti V Zn
EK006 Point 3 13.8 <0.007 <0.002 <0.010 16.6 <0.002 <0.001 8.08 <0.021 <0.003 0.100 <0.001 <0.002 18.0 <0.008 0.134 0.090 <0.002 <0.003
EK006 Point 4 11.2 <0.017 0.707 <0.010 3.50 <0.006 0.048 3.92 <0.010 0.634 0.273 0.014 0.965 23.5 1.00 <0.010 1.66 0.154 <0.009

Figure 2cSummary Data and Back-scatter Electron Maps for Station EK006 Points 5 and 6
Metals Speciation ResultsNewtown Creek RI/FS
Point 5 Point 6
Al Aluminum Cd Cadmium Cu Copper Mg Magnesium K Potassium S Sulfur Zn Zinc As Arsenic Ca Calcium Fe Iron Mn Manganese Si Silicon Ti Titanium Ba Barium Cr Chromium Pb Lead Ni Nickel Na Sodium V Vanadium
Weight Percent Al As Ba Cd Ca Cr Cu Fe Pb Mg Mn Ni K Si Na S Ti V Zn
EK006 Point 5 0.097 0.033 <0.002 <0.003 0.319 0.056 0.122 0.468 <0.010 0.021 0.005 0.027 0.030 5.96 0.006 0.490 0.046 0.004 0.935
EK006 Point 6 1.50 <0.020 <0.003 <0.001 0.191 <0.002 0.210 2.33 21.4 0.092 0.013 0.014 0.377 9.52 0.497 2.16 <0.010 <0.002 0.781

Figure 2dSummary Data and Back-scatter Electron Maps for Station EK006 Points 7 and 8
Metals Speciation ResultsNewtown Creek RI/FS
Point 7 Point 8
Al Aluminum Cd Cadmium Cu Copper Mg Magnesium K Potassium S Sulfur Zn Zinc As Arsenic Ca Calcium Fe Iron Mn Manganese Si Silicon Ti Titanium Ba Barium Cr Chromium Pb Lead Ni Nickel Na Sodium V Vanadium
Weight Percent Al As Ba Cd Ca Cr Cu Fe Pb Mg Mn Ni K Si Na S Ti V Zn
EK006 Point 7 <0.001 <0.001 <0.013 <0.007 <0.001 <0.002 <0.001 <0.019 <0.010 <0.003 <0.005 <0.002 <0.002 47.2 <0.008 0.507 0.007 <0.002 <0.009
EK006 Point 8 7.99 <0.033 <0.043 <0.010 0.207 <0.002 0.109 11.7 <0.010 5.46 0.019 <0.007 0.837 11.1 0.818 1.08 2.32 0.140 0.093

Figure 2eSummary Data and Back-scatter Electron Maps for Station EK006 Points 9 and 10
Metals Speciation ResultsNewtown Creek RI/FS
Point 9 Point 10
Al Aluminum Cd Cadmium Cu Copper Mg Magnesium K Potassium S Sulfur Zn Zinc As Arsenic Ca Calcium Fe Iron Mn Manganese Si Silicon Ti Titanium Ba Barium Cr Chromium Pb Lead Ni Nickel Na Sodium V Vanadium
Weight Percent Al As Ba Cd Ca Cr Cu Fe Pb Mg Mn Ni K Si Na S Ti V Zn
EK006 Point 9 17.4 <0.020 0.166 <0.018 1.45 0.020 <0.015 2.65 <0.013 0.696 <0.005 0.019 2.09 25.6 0.743 <0.010 1.02 0.065 <0.010
EK006 Point 10 0.114 <0.020 <0.002 <0.010 0.115 <0.002 0.034 29.0 <0.118 0.033 0.018 0.026 0.034 0.106 0.092 29.9 <0.010 <0.002 0.079

Figure 2fSummary Data and Back-scatter Electron Maps for Station EK006 Points 11 and 12
Metals Speciation ResultsNewtown Creek RI/FS
Point 11 Point 12
Al Aluminum Cd Cadmium Cu Copper Mg Magnesium K Potassium S Sulfur Zn Zinc As Arsenic Ca Calcium Fe Iron Mn Manganese Si Silicon Ti Titanium Ba Barium Cr Chromium Pb Lead Ni Nickel Na Sodium V Vanadium
Weight Percent Al As Ba Cd Ca Cr Cu Fe Pb Mg Mn Ni K Si Na S Ti V Zn
EK006 Point 11 18.0 <0.013 <0.004 <0.010 0.018 <0.002 <0.001 0.181 <0.010 0.015 <0.005 <0.005 0.081 16.9 0.017 0.161 0.008 <0.002 <0.014
EK006 Point 12 7.11 <0.029 <0.047 <0.010 0.936 <0.009 <0.002 1.78 <0.010 0.221 0.035 <0.005 0.971 35.2 0.286 <0.010 1.89 0.085 <0.007

Figure 2gSummary Data and Back-scatter Electron Maps for Station EK006 Points 13 and 14
Metals Speciation ResultsNewtown Creek RI/FS
Point 13 Point 14
Al Aluminum Cd Cadmium Cu Copper Mg Magnesium K Potassium S Sulfur Zn Zinc As Arsenic Ca Calcium Fe Iron Mn Manganese Si Silicon Ti Titanium Ba Barium Cr Chromium Pb Lead Ni Nickel Na Sodium V Vanadium
Weight Percent Al As Ba Cd Ca Cr Cu Fe Pb Mg Mn Ni K Si Na S Ti V Zn
EK006 Point 13 17.5 <0.009 0.120 <0.004 1.00 0.105 <0.001 10.9 <0.010 0.285 <0.005 0.103 0.888 19.3 0.288 <0.010 1.61 0.184 <0.012
EK006 Point 14 11.6 <0.020 <0.057 <0.018 0.523 <0.003 <0.001 0.088 <0.010 <0.003 <0.005 <0.006 3.52 32.3 6.92 <0.010 0.008 <0.002 <0.008

A
B
A
B
Figure 3aSummary Data and Back-scatter Electron Maps for Station EK059 Points 3 and 4
Metals Speciation ResultsNewtown Creek RI/FS
Point 3 Point 4
Al Aluminum Cd Cadmium Cu Copper Mg Magnesium K Potassium S Sulfur Zn Zinc As Arsenic Ca Calcium Fe Iron Mn Manganese Si Silicon Ti Titanium Ba Barium Cr Chromium Pb Lead Ni Nickel Na Sodium V Vanadium
Weight Percent Al As Ba Cd Ca Cr Cu Fe Pb Mg Mn Ni K Si Na S Ti V Zn
EK059 Point 3-A <0.001 <0.020 <0.006 <0.010 <0.002 <0.004 <0.009 0.024 <0.035 <0.003 <0.005 <0.005 <0.001 47.4 <0.008 <0.010 0.010 <0.002 <0.014
EK059 Point 3-B 1.33 <0.020 <0.002 0.013 0.093 0.013 0.018 0.066 <0.007 <0.003 0.014 0.006 0.012 4.84 0.039 0.188 0.162 0.013 0.023
EK059 Point 4-A 2.55 <0.036 27.8 <0.010 0.251 <0.002 0.021 4.05 <0.010 1.15 <0.005 <0.002 0.421 20.1 0.192 9.09 0.458 <0.002 0.023
EK059 Point 4-B 4.27 <0.067 <0.083 <0.010 4.12 0.022 1.02 30.1 1.16 2.60 0.369 0.840 0.148 14.1 0.612 0.025 0.205 0.013 5.17

Figure 3bSummary Data and Back-scatter Electron Maps for Station EK059 Point 5
Metals Speciation ResultsNewtown Creek RI/FS
Point 5
Al Aluminum Cd Cadmium Cu Copper Mg Magnesium K Potassium S Sulfur Zn Zinc As Arsenic Ca Calcium Fe Iron Mn Manganese Si Silicon Ti Titanium Ba Barium Cr Chromium Pb Lead Ni Nickel Na Sodium V Vanadium
Weight Percent Al As Ba Cd Ca Cr Cu Fe Pb Mg Mn Ni K Si Na S Ti V Zn
EK059 Point 5 0.244 <0.013 <0.024 <0.033 0.626 0.029 0.566 45.8 <0.250 0.786 0.030 0.447 0.016 1.03 0.033 <0.010 7.76 0.004 1.41

AB
Figure 4aSummary Data and Back-scatter Electron Maps for Station NC064 142 – 155 cm Points 1 and 2
Metals Speciation ResultsNewtown Creek RI/FS
Point 1 Point 2
Al Aluminum Cd Cadmium Cu Copper Mg Magnesium K Potassium S Sulfur Zn Zinc As Arsenic Ca Calcium Fe Iron Mn Manganese Si Silicon Ti Titanium Ba Barium Cr Chromium Pb Lead Ni Nickel Na Sodium V Vanadium
Weight Percent Al As Ba Cd Ca Cr Cu Fe Pb Mg Mn Ni K Si Na S Ti V Zn
NC064 142155 Point 1-A <0.003 <0.020 <0.004 <0.010 <0.001 <0.002 <0.025 0.032 <0.013 <0.003 <0.005 <0.005 <0.002 47.4 <0.008 <0.010 <0.010 <0.002 <0.007
NC064 142155 Point 1-B 0.721 0.299 <0.039 <0.012 0.292 0.019 25.3 24.7 0.301 0.055 <0.005 0.064 0.040 0.296 0.124 31.1 <0.010 <0.002 0.163
NC064 142155 Point 2 0.016 0.084 <0.002 <0.010 0.055 <0.002 26.4 23.5 0.519 0.049 <0.005 0.139 0.007 0.217 <0.008 29.5 <0.010 <0.002 <0.003

A
B
Figure 4bSummary Data and Back-scatter Electron Maps for Station NC064 142 – 155 cm Points 3 and 4
Metals Speciation ResultsNewtown Creek RI/FS
Point 3 Point 4
Al Aluminum Cd Cadmium Cu Copper Mg Magnesium K Potassium S Sulfur Zn Zinc As Arsenic Ca Calcium Fe Iron Mn Manganese Si Silicon Ti Titanium Ba Barium Cr Chromium Pb Lead Ni Nickel Na Sodium V Vanadium
Weight Percent Al As Ba Cd Ca Cr Cu Fe Pb Mg Mn Ni K Si Na S Ti V Zn
NC064 142155 Point 3-A 16.0 <0.020 0.160 <0.010 4.64 0.017 <0.001 7.30 <0.030 0.731 0.038 <0.007 1.66 21.4 0.253 0.025 1.51 0.089 <0.010
NC064 142155 Point 3-B 4.76 0.351 0.047 <0.010 0.138 0.013 10.4 16.8 0.184 0.826 0.027 0.259 1.27 8.59 0.219 14.9 0.302 0.016 2.21
NC064 142155 Point 4-A 4.85 <0.020 <0.002 <0.010 7.94 <0.005 <0.009 13.7 <0.025 6.53 0.380 <0.005 0.378 18.3 0.850 <0.010 0.293 0.030 0.043

A
B
Figure 4cSummary Data and Back-scatter Electron Maps for Station NC064 142 – 155 cm Points 5 and 6
Metals Speciation ResultsNewtown Creek RI/FS
Point 5 Point 6
Al Aluminum Cd Cadmium Cu Copper Mg Magnesium K Potassium S Sulfur Zn Zinc As Arsenic Ca Calcium Fe Iron Mn Manganese Si Silicon Ti Titanium Ba Barium Cr Chromium Pb Lead Ni Nickel Na Sodium V Vanadium
Weight Percent Al As Ba Cd Ca Cr Cu Fe Pb Mg Mn Ni K Si Na S Ti V Zn
NC064 142155 Point 5 0.504 0.506 <0.008 <0.035 0.148 0.011 24.0 23.8 <0.010 0.090 <0.005 0.167 0.053 0.780 0.059 27.3 <0.010 0.005 <0.003
NC064 142155 Point 6-A 8.92 <0.020 0.211 <0.010 <0.006 0.024 <0.001 15.2 <0.010 4.75 0.198 <0.003 7.28 15.0 0.038 <0.010 1.50 0.085 0.041
NC064 142155 Point 6-B 0.007 <0.037 <0.002 <0.025 0.038 <0.002 <0.001 43.8 <0.010 0.020 0.134 0.020 0.036 0.087 0.043 52.7 0.138 <0.002 <0.011

Figure 4dSummary Data and Back-scatter Electron Maps for Station NC064 142 – 155 cm Points 7 and 8
Metals Speciation ResultsNewtown Creek RI/FS
Point 7 Point 8
Al Aluminum Cd Cadmium Cu Copper Mg Magnesium K Potassium S Sulfur Zn Zinc As Arsenic Ca Calcium Fe Iron Mn Manganese Si Silicon Ti Titanium Ba Barium Cr Chromium Pb Lead Ni Nickel Na Sodium V Vanadium
Weight Percent Al As Ba Cd Ca Cr Cu Fe Pb Mg Mn Ni K Si Na S Ti V Zn
NC064 142155 Point 7 0.332 <0.020 <0.002 <0.010 0.061 0.006 0.057 34.8 <0.049 0.024 0.205 0.110 0.020 0.425 0.039 42.9 0.160 <0.004 0.057
NC064 142155 Point 8 0.031 <0.009 <0.003 <0.010 0.391 <0.002 <0.013 49.5 <0.039 0.069 <0.008 0.870 0.019 0.140 0.054 37.4 0.120 <0.002 <0.010

Figure 4eSummary Data and Back-scatter Electron Maps for Station NC064 142 – 155 cm Points 9 and 10
Metals Speciation ResultsNewtown Creek RI/FS
Point 9 Point 10
Al Aluminum Cd Cadmium Cu Copper Mg Magnesium K Potassium S Sulfur Zn Zinc As Arsenic Ca Calcium Fe Iron Mn Manganese Si Silicon Ti Titanium Ba Barium Cr Chromium Pb Lead Ni Nickel Na Sodium V Vanadium
Weight Percent Al As Ba Cd Ca Cr Cu Fe Pb Mg Mn Ni K Si Na S Ti V Zn
NC064 142155 Point 9 0.631 0.113 <0.007 <0.010 0.064 <0.002 31.1 27.7 <0.010 0.011 0.022 0.077 0.009 0.147 <0.008 32.3 <0.010 <0.003 <0.003
NC064 142155 Point 10 16.6 <0.031 <0.055 <0.013 1.03 0.035 0.045 20.8 <0.010 0.472 <0.008 <0.005 1.75 16.1 0.436 <0.010 0.709 0.086 <0.018

Figure 4fSummary Data and Back-scatter Electron Maps for Station NC064 142 – 155 cm Points 11 and 12
Metals Speciation ResultsNewtown Creek RI/FS
Point 11 Point 12
Al Aluminum Cd Cadmium Cu Copper Mg Magnesium K Potassium S Sulfur Zn Zinc As Arsenic Ca Calcium Fe Iron Mn Manganese Si Silicon Ti Titanium Ba Barium Cr Chromium Pb Lead Ni Nickel Na Sodium V Vanadium
Weight Percent Al As Ba Cd Ca Cr Cu Fe Pb Mg Mn Ni K Si Na S Ti V Zn
NC064 142155 Point 11 0.012 <0.020 0.005 0.020 0.007 0.004 <0.001 0.025 <0.010 <0.003 0.003 <0.005 <0.0001 0.043 <0.008 0.876 0.094 0.008 0.001
NC064 142155 Point 12 8.06 <0.044 <0.049 <0.017 0.229 0.028 0.050 2.78 <0.010 0.394 <0.006 0.027 1.64 18.2 0.187 0.816 0.282 0.043 0.073

Figure 4gSummary Data and Back-scatter Electron Maps for Station NC064 142 – 155 cm Point 13
Metals Speciation ResultsNewtown Creek RI/FS
Point 13
Al Aluminum Cd Cadmium Cu Copper Mg Magnesium K Potassium S Sulfur Zn Zinc As Arsenic Ca Calcium Fe Iron Mn Manganese Si Silicon Ti Titanium Ba Barium Cr Chromium Pb Lead Ni Nickel Na Sodium V Vanadium
Weight Percent Al As Ba Cd Ca Cr Cu Fe Pb Mg Mn Ni K Si Na S Ti V Zn
NC064 142155 Point 13 0.215 <0.020 0.098 <0.010 1.19 <0.002 <0.001 48.8 <0.032 0.075 0.243 0.011 <0.002 1.01 0.013 12.7 6.88 1.14 0.014

A
B
Figure 5aSummary Data and Back-scatter Electron Maps for Station NC070 15 – 25 cm Point 1
Metals Speciation ResultsNewtown Creek RI/FS
Point 1
Al Aluminum Cd Cadmium Cu Copper Mg Magnesium K Potassium S Sulfur Zn Zinc As Arsenic Ca Calcium Fe Iron Mn Manganese Si Silicon Ti Titanium Ba Barium Cr Chromium Pb Lead Ni Nickel Na Sodium V Vanadium
Weight Percent Al As Ba Cd Ca Cr Cu Fe Pb Mg Mn Ni K Si Na S Ti V Zn
NC070 015025 Point 1-A <0.001 0.148 <0.014 <0.007 0.035 <0.004 58.1 0.716 <0.084 0.022 0.023 0.093 0.029 0.083 <0.008 31.2 <0.010 <0.002 0.039
NC070 015025 Point 1-B 1.39 1.78 <0.002 <0.010 0.170 0.015 18.8 8.77 <0.010 0.194 0.006 0.125 0.176 0.996 0.280 16.8 <0.010 0.242 0.199

A
B
C D
Figure 5bSummary Data and Back-scatter Electron Maps for Station NC070 15 – 25 cm Point 2
Metals Speciation ResultsNewtown Creek RI/FS
Point 2
Al Aluminum Cd Cadmium Cu Copper Mg Magnesium K Potassium S Sulfur Zn Zinc As Arsenic Ca Calcium Fe Iron Mn Manganese Si Silicon Ti Titanium Ba Barium Cr Chromium Pb Lead Ni Nickel Na Sodium V Vanadium
Weight Percent Al As Ba Cd Ca Cr Cu Fe Pb Mg Mn Ni K Si Na S Ti V Zn
NC070 015025 Point 2-A 4.60 <0.020 0.120 <0.015 5.42 <0.003 9.33 6.60 8.09 2.82 0.221 0.188 0.522 17.3 0.507 0.051 0.696 0.062 2.11
NC070 015025 Point 2-B 3.02 <0.068 <0.039 <0.010 12.4 <0.005 5.75 5.94 2.60 7.06 0.277 0.241 0.205 21.6 0.331 0.083 0.646 0.048 1.37
NC070 015025 Point 2-C 2.38 0.617 0.114 <0.031 4.55 0.417 17.4 9.64 8.51 2.83 0.292 0.467 0.311 16.1 0.439 <0.010 0.687 0.047 2.55
NC070 015025 Point 2-D 0.877 0.173 <0.005 <0.013 0.426 0.033 14.0 12.8 <0.781 0.141 <0.004 0.073 0.028 3.00 0.124 25.1 0.125 0.046 0.217
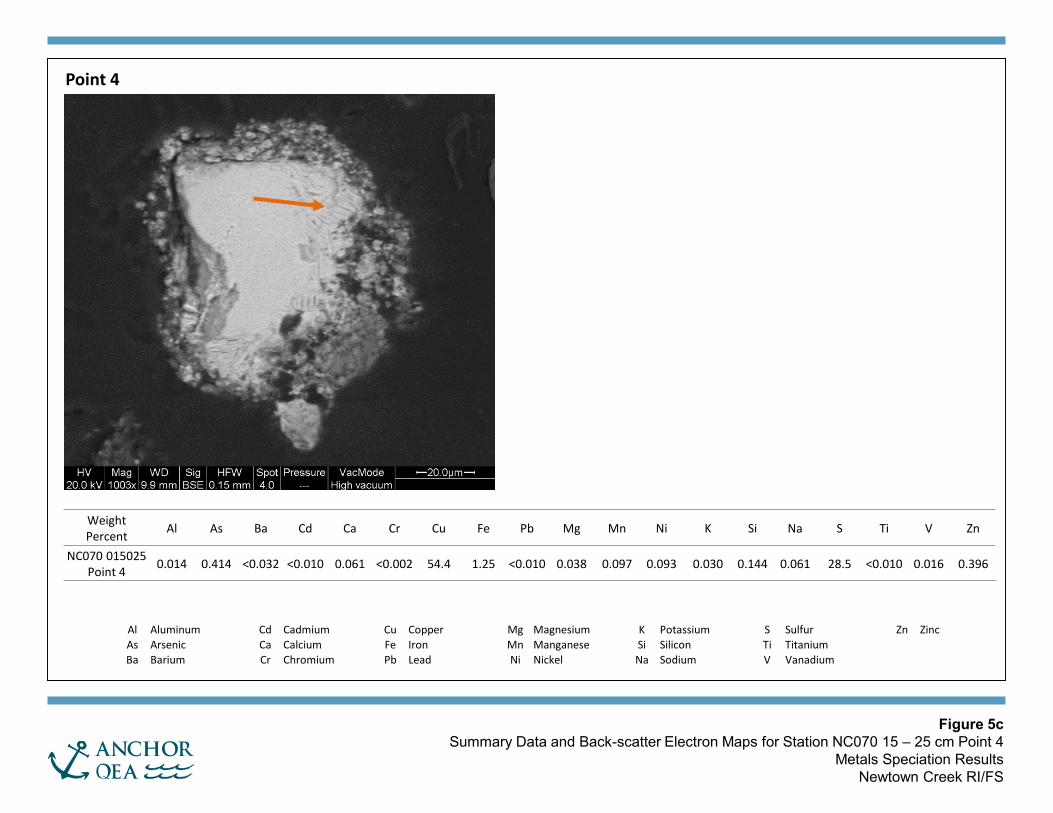
Figure 5cSummary Data and Back-scatter Electron Maps for Station NC070 15 – 25 cm Point 4
Metals Speciation ResultsNewtown Creek RI/FS
Point 4
Al Aluminum Cd Cadmium Cu Copper Mg Magnesium K Potassium S Sulfur Zn Zinc As Arsenic Ca Calcium Fe Iron Mn Manganese Si Silicon Ti Titanium Ba Barium Cr Chromium Pb Lead Ni Nickel Na Sodium V Vanadium
Weight Percent Al As Ba Cd Ca Cr Cu Fe Pb Mg Mn Ni K Si Na S Ti V Zn
NC070 015025 Point 4 0.014 0.414 <0.032 <0.010 0.061 <0.002 54.4 1.25 <0.010 0.038 0.097 0.093 0.030 0.144 0.061 28.5 <0.010 0.016 0.396

CHARTS

Chart 1Station DK040 Sequential Extraction Results
Metals Speciation Results Newtown Creek RI/FS
October 2018 181037-01.01
Note: Only fractions with detectable concentrations are shown in the pie charts.
F1
F2
F3
F4
F5
Exchangeable
Weak Acid Soluble (Carbonate Bound)
Reducible (Iron/Manganese Oxide Bound)
Oxidizable (Sulfide/Organic Matter Bound)
Residual
Pie Chart Legend:
Decr
easi
ngBi
oava
ilabi
lity
0.03%
44.6%
21.7%
9.9%
23.8%
Iron
10.7%
85.4%
3.9%Cadmium 0.1% 0.1% 0.1%
88.8%
10.8%
Copper 1.6%
13.7%
56.3%
28.4%
Lead
4.1
273
26,600
274
0.37
50 34
981
0
1
10
100
1,000
10,000
100,000
Cadmium Copper Iron Lead Mercury Nickel Silver Zinc
Conc
entr
atio
n (m
g/kg
)Total Metals
10.8%
89.2%
Mercury
14.2%
21.8%
42.7%
21.3%
Nickel 1.1%
98.9%
Silver 1.87%2.3%
37.6%
53.7%
4.5%Zinc

Chart 2Station EB036 Sequential Extraction Results
Metals Speciation Results Newtown Creek RI/FS
October 2018 181037-01.01
Note: Only fractions with detectable concentrations are shown in the pie charts.
F1
F2
F3
F4
F5
Exchangeable
Weak Acid Soluble (Carbonate Bound)
Reducible (Iron/Manganese Oxide Bound)
Oxidizable (Sulfide/Organic Matter Bound)
Residual
Pie Chart Legend:
Decr
easi
ngBi
oava
ilabi
lity
0.12%
42.0%
23.1%5.4%
29.4%
Iron
76.1%
21.9%
2.0%Cadmium 0.2% 0.4%
28.0%
58.2%
13.2%
Copper
17.5%
58.4%
5.5%
18.6%
Lead
68
6,320
54,200
1,080
1.2
833
2.8
4,370
1
10
100
1,000
10,000
100,000
Cadmium Copper Iron Lead Mercury Nickel Silver Zinc
Conc
entr
atio
n (m
g/kg
)Total Metals
100.0%
Mercury
20.6%
21.7%22.1%
35.6%
Nickel
100.0%
Silver 0.31%
10.5%
63.1%
20.1%
6.0%Zinc

Chart 3Station EK059 Sequential Extraction Results
Metals Speciation Results Newtown Creek RI/FS
October 2018 181037-01.01
Note: Only fractions with detectable concentrations are shown in the pie charts.
F1
F2
F3
F4
F5
Exchangeable
Weak Acid Soluble (Carbonate Bound)
Reducible (Iron/Manganese Oxide Bound)
Oxidizable (Sulfide/Organic Matter Bound)
Residual
Pie Chart Legend:
Decr
easi
ngBi
oava
ilabi
lity
0.01%
35.9%
15.6%29.9%
18.6%
Iron 0.9%
44.8%53.3%
1.0%Cadmium 0.02% 0.1% 2.2%
92.4%
5.3%Copper
10.7%
32.0%
24.4%
32.9%
Lead
177
2,900
32,500
1,420
6.9
717
28
4,770
1
10
100
1,000
10,000
100,000
Cadmium Copper Iron Lead Mercury Nickel Silver Zinc
Conc
entr
atio
n (m
g/kg
)Total Metals
36.1%
63.9%
Mercury 0.2%
9.1%
11.9%
75.2%
3.6%Nickel 0.7% 5.6%
93.7%
Silver 0.59%
11.5%
42.3%44.1%
1.5%Zinc

Chart 4Station EK006 Sequential Extraction Results
Metals Speciation Results Newtown Creek RI/FS
October 2018 181037-01.01
Note: Only fractions with detectable concentrations are shown in the pie charts.
F1
F2
F3
F4
F5
Exchangeable
Weak Acid Soluble (Carbonate Bound)
Reducible (Iron/Manganese Oxide Bound)
Oxidizable (Sulfide/Organic Matter Bound)
Residual
Pie Chart Legend:
Decr
easi
ngBi
oava
ilabi
lity
0.09%
31.3%
18.4%29.1%
21.1%
Iron 0.1%
9.6%
58.2%
30.1%
2.0%Cadmium 0.1% 0.6%
29.1%
64.8%
5.4%Copper 0.1%
24.6%
46.6%
11.2%
17.4%
Lead
93
2,400
33,800
1,040
4.9
526
14
4,630
1
10
100
1,000
10,000
100,000
Cadmium Copper Iron Lead Mercury Nickel Silver Zinc
Conc
entr
atio
n (m
g/kg
)Total Metals
0.1%
99.9%
Mercury 0.2%
10.6%
15.5%
60.2%
13.5%
Nickel
100.0%
Silver 0.17%
28.4%
47.3%
21.9%
2.2%Zinc
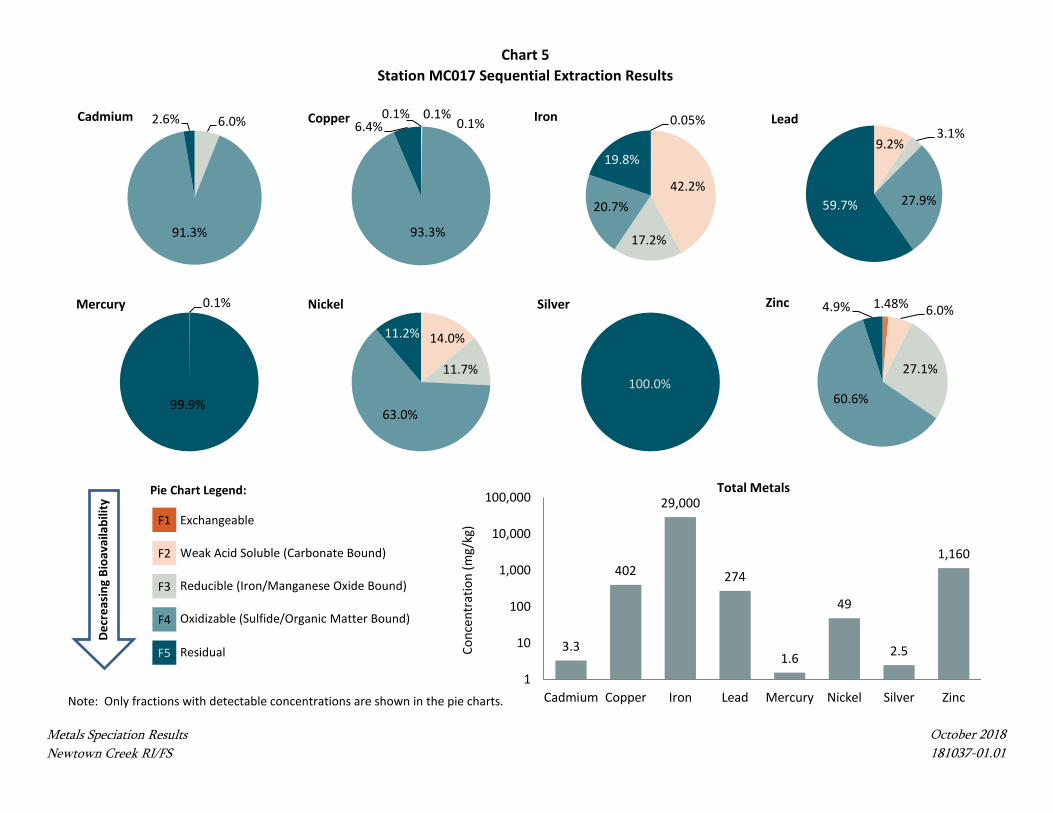
Chart 5Station MC017 Sequential Extraction Results
Metals Speciation Results Newtown Creek RI/FS
October 2018 181037-01.01
Note: Only fractions with detectable concentrations are shown in the pie charts.
F1
F2
F3
F4
F5
Exchangeable
Weak Acid Soluble (Carbonate Bound)
Reducible (Iron/Manganese Oxide Bound)
Oxidizable (Sulfide/Organic Matter Bound)
Residual
Pie Chart Legend:
Decr
easi
ngBi
oava
ilabi
lity
0.05%
42.2%
17.2%
20.7%
19.8%
Iron 6.0%
91.3%
2.6%Cadmium 0.1% 0.1%0.1%
93.3%
6.4%Copper
9.2%3.1%
27.9%59.7%
Lead
3.3
402
29,000
274
1.6
49
2.5
1,160
1
10
100
1,000
10,000
100,000
Cadmium Copper Iron Lead Mercury Nickel Silver Zinc
Conc
entr
atio
n (m
g/kg
)Total Metals
0.1%
99.9%
Mercury
14.0%
11.7%
63.0%
11.2%
Nickel
100.0%
Silver 1.48% 6.0%
27.1%
60.6%
4.9%Zinc

Chart 6Station NC161 Sequential Extraction Results
Metals Speciation Results Newtown Creek RI/FS
October 2018 181037-01.01
Note: Only fractions with detectable concentrations are shown in the pie charts.
F1
F2
F3
F4
F5
Exchangeable
Weak Acid Soluble (Carbonate Bound)
Reducible (Iron/Manganese Oxide Bound)
Oxidizable (Sulfide/Organic Matter Bound)
Residual
Pie Chart Legend:
Decr
easi
ngBi
oava
ilabi
lity
0.03%
15.4%
11.2%
22.6%
50.8%
Iron 7.7%
74.0%
16.7%
1.7%Cadmium 0.2% 0.3%
20.7%
64.4%
14.4%
Copper
25.4%
35.6%
25.3%
13.7%
Lead
1.6
139
29,700
129
0.76
32
3.7
284
0
1
10
100
1,000
10,000
100,000
Cadmium Copper Iron Lead Mercury Nickel Silver Zinc
Conc
entr
atio
n (m
g/kg
)Total Metals
9.0%
91.0%
Mercury 7.2%
10.7%
40.4%
41.8%
Nickel
100.0%
Silver 4.20%
13.8%
46.2%
25.1%
10.8%Zinc

Chart 7Station NC046 Sequential Extraction Results
Metals Speciation Results Newtown Creek RI/FS
October 2018 181037-01.01
Note: Only fractions with detectable concentrations are shown in the pie charts.
F1
F2
F3
F4
F5
Exchangeable
Weak Acid Soluble (Carbonate Bound)
Reducible (Iron/Manganese Oxide Bound)
Oxidizable (Sulfide/Organic Matter Bound)
Residual
Pie Chart Legend:
Decr
easi
ngBi
oava
ilabi
lity
0.04%
20.4%
17.1%
22.3%
40.2%
Iron
42.4%
44.6%
10.6%
2.3%Cadmium 0.2% 2.6%
28.9%
58.8%
9.4%
Copper
40.9%
32.9%
17.0%
9.3%
Lead
2.3
211
36,600
175
1.0
40
4.1
409
0
1
10
100
1,000
10,000
100,000
Cadmium Copper Iron Lead Mercury Nickel Silver Zinc
Conc
entr
atio
n (m
g/kg
)Total Metals
3.2%
96.8%
Mercury 1.3%
11.1%
16.6%
37.4%
33.6%
Nickel
100.0%
Silver 4.27%
32.6%
42.5%
14.2%
6.4%Zinc

Chart 8Station NC293 Sequential Extraction Results
Metals Speciation Results Newtown Creek RI/FS
October 2018 181037-01.01
Note: Only fractions with detectable concentrations are shown in the pie charts.
F1
F2
F3
F4
F5
Exchangeable
Weak Acid Soluble (Carbonate Bound)
Reducible (Iron/Manganese Oxide Bound)
Oxidizable (Sulfide/Organic Matter Bound)
Residual
Pie Chart Legend:
Decr
easi
ngBi
oava
ilabi
lity
0.03%
31.2%
12.3%12.9%
43.6%
Iron 1.6%
42.0%54.4%
2.1%Cadmium 0.02% 0.1% 0.4%
92.0%
7.5%
Copper
12.7%6.6%
24.7%56.0%
Lead
41
2,810
42,300
652
3.1
479
11
2,850
1
10
100
1,000
10,000
100,000
Cadmium Copper Iron Lead Mercury Nickel Silver Zinc
Conc
entr
atio
n (m
g/kg
)Total Metals
3.2%
96.8%
Mercury 0.3%
9.7%10.3%
69.6%
10.2%
Nickel
100.0%
Silver 0.81%
16.2%
44.7%
35.1%
3.3%Zinc
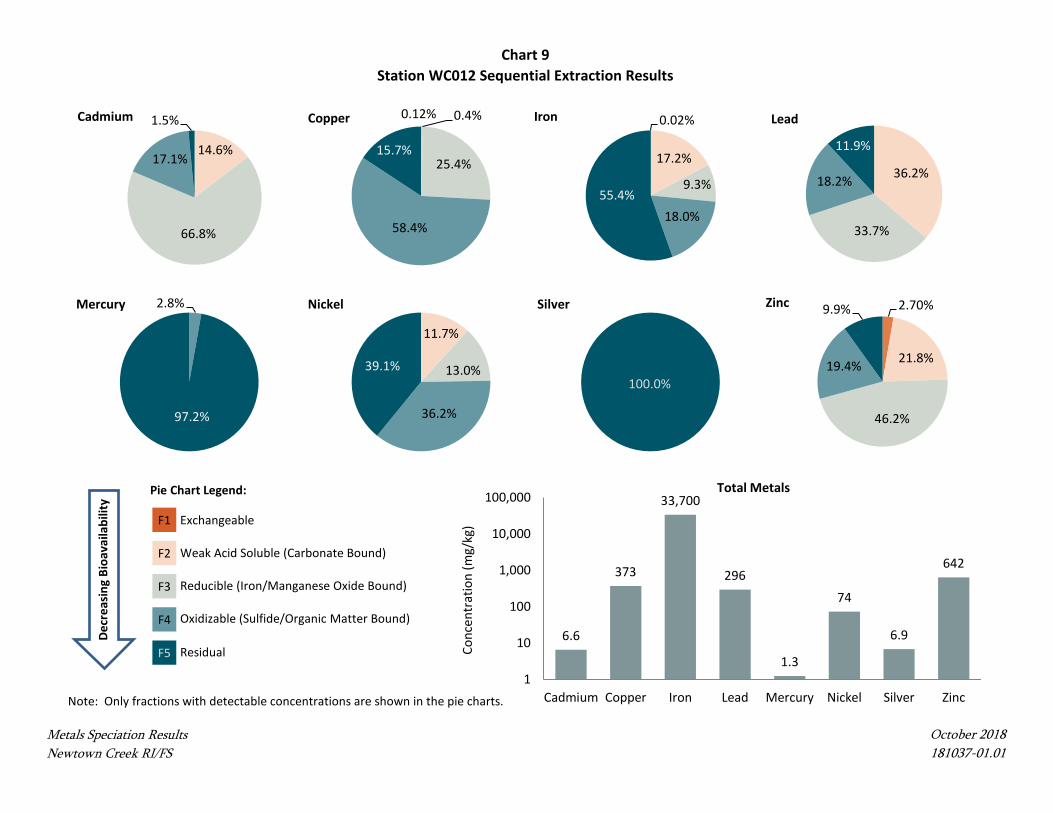
Chart 9Station WC012 Sequential Extraction Results
Metals Speciation Results Newtown Creek RI/FS
October 2018 181037-01.01
Note: Only fractions with detectable concentrations are shown in the pie charts.
F1
F2
F3
F4
F5
Exchangeable
Weak Acid Soluble (Carbonate Bound)
Reducible (Iron/Manganese Oxide Bound)
Oxidizable (Sulfide/Organic Matter Bound)
Residual
Pie Chart Legend:
Decr
easi
ngBi
oava
ilabi
lity
0.02%
17.2%
9.3%
18.0%55.4%
Iron
14.6%
66.8%
17.1%
1.5%Cadmium 0.12% 0.4%
25.4%
58.4%
15.7%
Copper
36.2%
33.7%
18.2%
11.9%
Lead
6.6
373
33,700
296
1.3
74
6.9
642
1
10
100
1,000
10,000
100,000
Cadmium Copper Iron Lead Mercury Nickel Silver Zinc
Conc
entr
atio
n (m
g/kg
)Total Metals
2.8%
97.2%
Mercury
11.7%
13.0%
36.2%
39.1%
Nickel
100.0%
Silver 2.70%
21.8%
46.2%
19.4%
9.9%Zinc

Chart 10Station DK004 15 – 25 cm Sequential Extraction Results
Metals Speciation ResultsNewtown Creek RI/FS
October 2018 181037-01.01
Note: Only detected fractions are shown in the pie charts.
F1
F2
F3
F4
F5
Exchangeable
Weak Acid Soluble (Carbonate Bound)
Reducible (Iron/Manganese Oxide Bound)
Oxidizable (Sulfide/Organic Matter Bound)
Residual
Pie Chart Legend:
Decr
easi
ngBi
oava
ilabi
lity
0.11%
22.6%
19.3%
26.0%
32.0%
Iron
52.3%35.8%
8.7%
3.2%Cadmium 0.7% 5.8%
66.0%
23.3%
4.1%Copper 0.49%
54.1%38.5%
3.5% 3.4%Lead
5.6
306
25,843
242
1.8
4913
651
1
10
100
1,000
10,000
100,000
Cadmium Copper Iron Lead Mercury Nickel Silver Zinc
Conc
entr
atio
n (m
g/kg
)
Sum of Fractions 1-5
100.0%
Mercury
15.7%
21.6%
37.4%
25.2%
Nickel
100.0%
Silver
46.5%38.7%
9.3%
5.4%Zinc

Chart 11Station DK004 45 – 55 cm Sequential Extraction Results
Metals Speciation ResultsNewtown Creek RI/FS
October 2018 181037-01.01
Note: Only detected fractions are shown in the pie charts.
F1
F2
F3
F4
F5
Exchangeable
Weak Acid Soluble (Carbonate Bound)
Reducible (Iron/Manganese Oxide Bound)
Oxidizable (Sulfide/Organic Matter Bound)
Residual
Pie Chart Legend:
Decr
easi
ngBi
oava
ilabi
lity
0.04% 6.8%
16.6%
53.4%
23.1%
Iron 0.2%
49.9%
25.0%
23.2%
1.6%Cadmium 0.1%
10.6%
36.5%48.1%
4.7%Copper 0.12%
35.6%
39.4%
9.2%
15.7%
Lead
75.8
988
24,041
1,235
2.3
258
18
1,697
1
10
100
1,000
10,000
100,000
Cadmium Copper Iron Lead Mercury Nickel Silver Zinc
Conc
entr
atio
n (m
g/kg
)
Sum of Fractions 1-5
0.1%
99.9%
Mercury 2.6%
24.7%
18.1%47.9%
6.7%Nickel
100.0%
Silver 0.3%
43.3%
36.8%
16.6%
3.0%Zinc

Chart 12Station DK004 135 – 145 cm Sequential Extraction Results
Metals Speciation ResultsNewtown Creek RI/FS
October 2018 181037-01.01
Note: Only detected fractions are shown in the pie charts.
F1
F2
F3
F4
F5
Exchangeable
Weak Acid Soluble (Carbonate Bound)
Reducible (Iron/Manganese Oxide Bound)
Oxidizable (Sulfide/Organic Matter Bound)
Residual
Pie Chart Legend:
Decr
easi
ngBi
oava
ilabi
lity
0.14%
30.6%
30.9%
14.1%
24.3%
Iron 0.1%
34.1%
36.8%
28.3%
0.6%Cadmium 0.2% 0.7%
60.3%36.1%
2.6%Copper 0.14%
18.0%
65.6%
5.9%
10.3%Lead
399.9
2,987
33,441
1,305
9.1
669
142
3,820
1
10
100
1,000
10,000
100,000
Cadmium Copper Iron Lead Mercury Nickel Silver Zinc
Conc
entr
atio
n (m
g/kg
)
Sum of Fractions 1-5
0.2%
99.8%
Mercury 1.3%
28.3%
22.4%
45.0%
3.1%Nickel
100.0%
Silver 0.3%
34.5%
42.3%
21.0%
1.9%Zinc
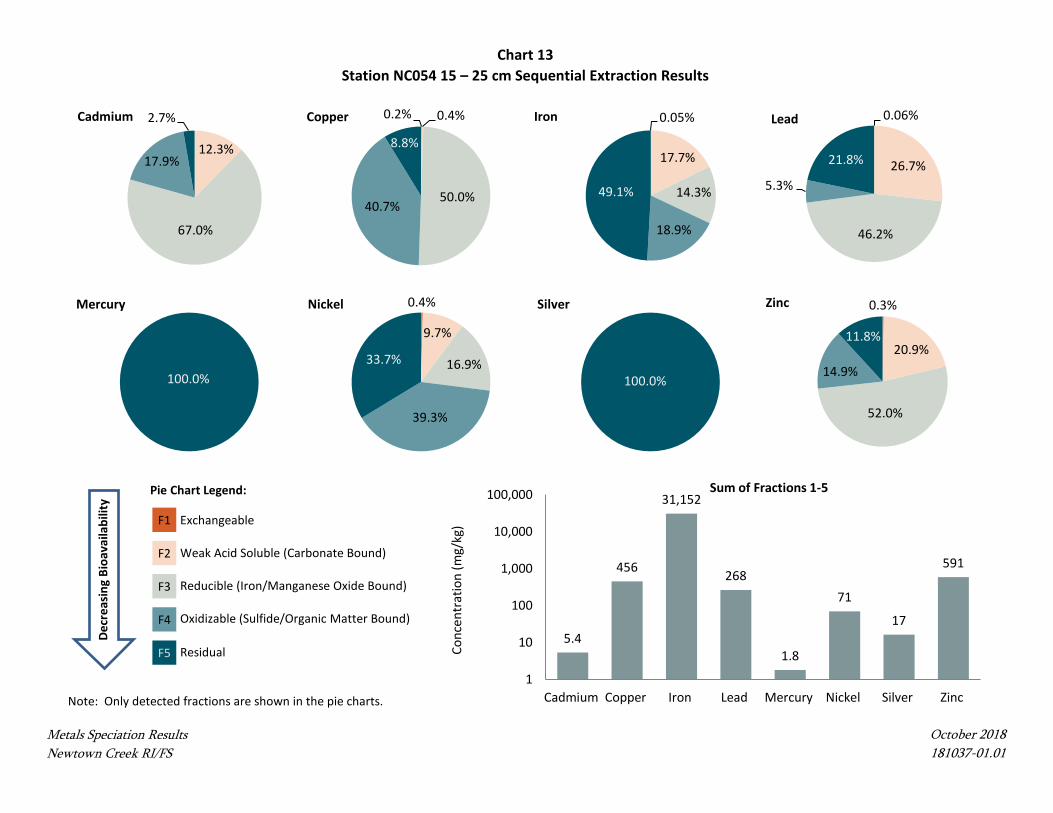
Chart 13Station NC054 15 – 25 cm Sequential Extraction Results
Metals Speciation ResultsNewtown Creek RI/FS
October 2018 181037-01.01
Note: Only detected fractions are shown in the pie charts.
F1
F2
F3
F4
F5
Exchangeable
Weak Acid Soluble (Carbonate Bound)
Reducible (Iron/Manganese Oxide Bound)
Oxidizable (Sulfide/Organic Matter Bound)
Residual
Pie Chart Legend:
Decr
easi
ngBi
oava
ilabi
lity
0.05%
17.7%
14.3%
18.9%
49.1%
Iron
12.3%
67.0%
17.9%
2.7%Cadmium 0.2% 0.4%
50.0%40.7%
8.8%
Copper 0.06%
26.7%
46.2%
5.3%
21.8%
Lead
5.4
456
31,152
268
1.8
71
17
591
1
10
100
1,000
10,000
100,000
Cadmium Copper Iron Lead Mercury Nickel Silver Zinc
Conc
entr
atio
n (m
g/kg
)
Sum of Fractions 1-5
100.0%
Mercury 0.4%
9.7%
16.9%
39.3%
33.7%
Nickel
100.0%
Silver 0.3%
20.9%
52.0%
14.9%
11.8%
Zinc

Chart 14Station NC054 167 – 180 cm Sequential Extraction Results
Metals Speciation ResultsNewtown Creek RI/FS
October 2018 181037-01.01
Note: Only detected fractions are shown in the pie charts.
F1
F2
F3
F4
F5
Exchangeable
Weak Acid Soluble (Carbonate Bound)
Reducible (Iron/Manganese Oxide Bound)
Oxidizable (Sulfide/Organic Matter Bound)
Residual
Pie Chart Legend:
Decr
easi
ngBi
oava
ilabi
lity
0.06%
29.8%
20.6%17.1%
32.4%
Iron 0.1%
14.4%
57.8%
27.0%
0.8%Cadmium 0.1% 0.1%
28.2%
67.9%
3.7%Copper 0.08%
12.1%
43.7%16.2%
27.9%
Lead
76
4,111
34,569
1,118
14
1,029
41
4,274
1
10
100
1,000
10,000
100,000
Cadmium Copper Iron Lead Mercury Nickel Silver Zinc
Conc
entr
atio
n (m
g/kg
)
Sum of Fractions 1-5
100.0%
Mercury 0.8%
21.4%
17.6%54.2%
6.0%Nickel
100.0%
Silver 0.2%
35.2%
42.2%
20.5%
2.0%Zinc

Chart 15Station NC054 295 – 307 cm Sequential Extraction Results
Metals Speciation ResultsNewtown Creek RI/FS
October 2018 181037-01.01
Note: Only detected fractions are shown in the pie charts.
F1
F2
F3
F4
F5
Exchangeable
Weak Acid Soluble (Carbonate Bound)
Reducible (Iron/Manganese Oxide Bound)
Oxidizable (Sulfide/Organic Matter Bound)
Residual
Pie Chart Legend:
Decr
easi
ngBi
oava
ilabi
lity
0.08%
38.8%
18.1%
15.9%
27.1%
Iron
10.4%
54.2%
34.1%
1.3%Cadmium 0.1% 0.4%
26.3%
69.0%
4.2%Copper 0.08%
32.1%
46.3%
11.7%
9.7%
Lead
7.6
2,228
32,271
1,869
4.9
514
21
2,843
1
10
100
1,000
10,000
100,000
Cadmium Copper Iron Lead Mercury Nickel Silver Zinc
Conc
entr
atio
n (m
g/kg
)
Sum of Fractions 1-5
11.9%
88.1%
Mercury 0.6%
23.8%
19.1%52.4%
4.1%Nickel
100.0%
Silver 0.2%
28.0%
34.6%
31.3%
5.9%Zinc
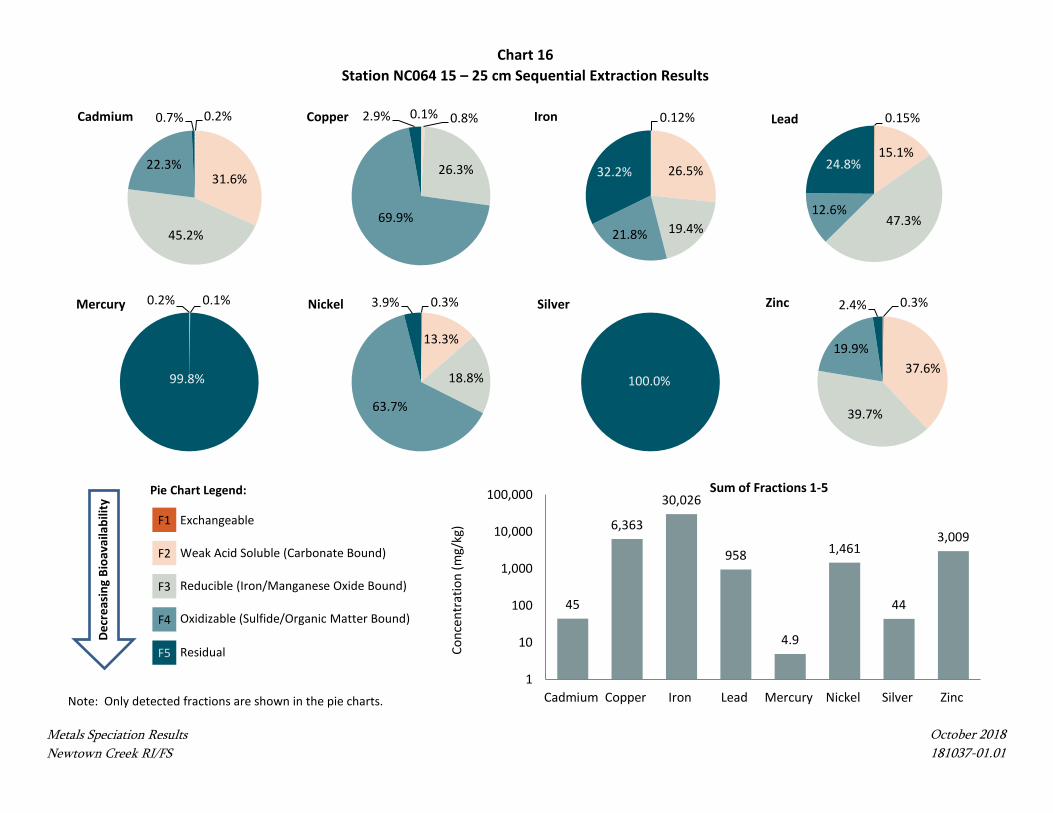
Chart 16Station NC064 15 – 25 cm Sequential Extraction Results
Metals Speciation ResultsNewtown Creek RI/FS
October 2018 181037-01.01
Note: Only detected fractions are shown in the pie charts.
F1
F2
F3
F4
F5
Exchangeable
Weak Acid Soluble (Carbonate Bound)
Reducible (Iron/Manganese Oxide Bound)
Oxidizable (Sulfide/Organic Matter Bound)
Residual
Pie Chart Legend:
Decr
easi
ngBi
oava
ilabi
lity
0.12%
26.5%
19.4%21.8%
32.2%
Iron 0.2%
31.6%
45.2%
22.3%
0.7%Cadmium 0.1% 0.8%
26.3%
69.9%
2.9%Copper 0.15%
15.1%
47.3%12.6%
24.8%
Lead
45
6,363
30,026
958
4.9
1,461
44
3,009
1
10
100
1,000
10,000
100,000
Cadmium Copper Iron Lead Mercury Nickel Silver Zinc
Conc
entr
atio
n (m
g/kg
)
Sum of Fractions 1-5
0.2% 0.1%
99.8%
Mercury 0.3%
13.3%
18.8%
63.7%
3.9%Nickel
100.0%
Silver 0.3%
37.6%
39.7%
19.9%
2.4%Zinc

Chart 17Station NC064 81 – 91 cm Sequential Extraction Results
Metals Speciation ResultsNewtown Creek RI/FS
October 2018 181037-01.01
Note: Only detected fractions are shown in the pie charts.
F1
F2
F3
F4
F5
Exchangeable
Weak Acid Soluble (Carbonate Bound)
Reducible (Iron/Manganese Oxide Bound)
Oxidizable (Sulfide/Organic Matter Bound)
Residual
Pie Chart Legend:
Decr
easi
ngBi
oava
ilabi
lity
0.05%
9.0%
30.9%
28.5%
31.5%
Iron 1.6%
47.0%
29.1%
21.1%
1.2%Cadmium 0.04% 1.9%
20.9%
74.8%
2.3%Copper 0.05% 6.4%
61.7%13.9%
18.0%
Lead
45
21,863 36,812
1,280
6.3
3,331
66
5,017
1
10
100
1,000
10,000
100,000
Cadmium Copper Iron Lead Mercury Nickel Silver Zinc
Conc
entr
atio
n (m
g/kg
)
Sum of Fractions 1-5
0.1%
99.9%
Mercury 2.6%
33.1%
15.5%
46.5%
2.3%Nickel
100.0%
Silver 0.7%
57.4%23.9%
16.3%
1.8%Zinc

Chart 18 Station NC064 142 – 155 cm Sequential Extraction Results
Metals Speciation ResultsNewtown Creek RI/FS
October 2018 181037-01.01
Note: Only detected fractions are shown in the pie charts.
F1
F2
F3
F4
F5
Exchangeable
Weak Acid Soluble (Carbonate Bound)
Reducible (Iron/Manganese Oxide Bound)
Oxidizable (Sulfide/Organic Matter Bound)
Residual
Pie Chart Legend:
Decr
easi
ngBi
oava
ilabi
lity
0.06%
21.8%
23.7%25.8%
28.6%
Iron
31.3%
38.2%
27.2%
3.4%Cadmium 0.05% 0.6%
21.4%
74.6%
3.4%Copper 0.05% 6.4%
61.7%
13.9%
18.0%
Lead
23
13,70134,925
1,121
8.6
2,131
35
4,336
1
10
100
1,000
10,000
100,000
Cadmium Copper Iron Lead Mercury Nickel Silver Zinc
Conc
entr
atio
n (m
g/kg
)
Sum of Fractions 1-5
100.0%
Mercury 1.0%
27.7%
15.2%
54.1%
2.0%Nickel
100.0%
Silver 0.2%
42.6%
31.7%
22.5%
3.0%Zinc

Chart 19Station NC070 15 – 25 cm Sequential Extraction Results
Metals Speciation ResultsNewtown Creek RI/FS
October 2018 181037-01.01
Note: Only detected fractions are shown in the pie charts.
F1
F2
F3
F4
F5
Exchangeable
Weak Acid Soluble (Carbonate Bound)
Reducible (Iron/Manganese Oxide Bound)
Oxidizable (Sulfide/Organic Matter Bound)
Residual
Pie Chart Legend:
Decr
easi
ngBi
oava
ilabi
lity
0.07%
24.4%
28.5%17.6%
29.4%
Iron 0.1%
31.1%
42.7%
25.2%
1.0%Cadmium 0.1% 0.5%
30.2%
66.6%
2.7%Copper 0.08%
15.8%
55.2%
11.1%
17.8%
Lead
140
9,96938,060
1,389
10
1,886
143
7,929
1
10
100
1,000
10,000
100,000
Cadmium Copper Iron Lead Mercury Nickel Silver Zinc
Conc
entr
atio
n (m
g/kg
)
Sum of Fractions 1-5
0.1%
99.9%
Mercury 0.7%
18.9%
15.4%54.4%
10.6%
Nickel
100.0%
Silver 0.2%
45.5%
33.3%
19.3%
1.7%Zinc

Chart 20Station NC070 85 – 95 cm Sequential Extraction Results
Metals Speciation ResultsNewtown Creek RI/FS
October 2018 181037-01.01
Note: Only detected fractions are shown in the pie charts.
F1
F2
F3
F4
F5
Exchangeable
Weak Acid Soluble (Carbonate Bound)
Reducible (Iron/Manganese Oxide Bound)
Oxidizable (Sulfide/Organic Matter Bound)
Residual
Pie Chart Legend:
Decr
easi
ngBi
oava
ilabi
lity
0.06%
33.6%
22.4%15.2%
28.6%
Iron 0.1%6.7%
57.5%
35.0%
0.7%Cadmium 0.1% 0.1%
20.5%
76.3%
3.0%Copper 0.05%
9.5%
46.7%14.0%
29.8%
Lead
221
10,28040,841
1,585
10
3,534
77
9,126
1
10
100
1,000
10,000
100,000
Cadmium Copper Iron Lead Mercury Nickel Silver Zinc
Conc
entr
atio
n (m
g/kg
)
Sum of Fractions 1-5
0.1%
99.9%
Mercury 0.3%
10.8%
14.2%
70.0%
4.7%Nickel
100.0%
Silver 0.1%
37.0%
59.2%
2.1%1.6%Zinc

Chart 21Station NC070 125 – 136 cm Sequential Extraction Results
Metals Speciation ResultsNewtown Creek RI/FS
October 2018 181037-01.01
Note: Only detected fractions are shown in the pie charts.
F1
F2
F3
F4
F5
Exchangeable
Weak Acid Soluble (Carbonate Bound)
Reducible (Iron/Manganese Oxide Bound)
Oxidizable (Sulfide/Organic Matter Bound)
Residual
Pie Chart Legend:
Decr
easi
ngBi
oava
ilabi
lity
0.10%
34.1%
21.6%14.5%
29.7%
Iron 0.2%
16.9%
54.8%
27.3%
0.8%Cadmium 0.1% 0.2%
29.0%
65.3%
5.4%Copper 0.11%
13.5%
51.0%14.1%
21.3%
Lead
196
9,928
43,717
1,477
9.2
3,814
86
12,054
1
10
100
1,000
10,000
100,000
Cadmium Copper Iron Lead Mercury Nickel Silver Zinc
Conc
entr
atio
n (m
g/kg
)
Sum of Fractions 1-5
0.1%
99.9%
Mercury 0.5%
16.2%
15.1%
65.4%
2.7%Nickel
100.0%
Silver 0.2%
37.3%
40.1%
21.1%
1.3%Zinc

Chart 22Station NC079 15 – 25 cm Sequential Extraction Results
Metals Speciation ResultsNewtown Creek RI/FS
October 2018 181037-01.01
Note: Only detected fractions are shown in the pie charts.
F1
F2
F3
F4
F5
Exchangeable
Weak Acid Soluble (Carbonate Bound)
Reducible (Iron/Manganese Oxide Bound)
Oxidizable (Sulfide/Organic Matter Bound)
Residual
Pie Chart Legend:
Decr
easi
ngBi
oava
ilabi
lity
0.06% 1.7%
10.8%
46.3%
41.1%
Iron
92.3%
7.7%Cadmium 2.4%
28.4%
31.3%
33.0%
4.8%Copper
65.9%21.5%
4.0%8.7%
Lead
100.0%
Mercury 7.0%
23.4%
13.9%34.3%
21.3%
Nickel
100.0%
Silver 2.4%
34.0%
24.3%
15.3%
24.0%
Zinc
0.5
34
9,936
7
0.02
18
0.06
77
0
0
1
10
100
1,000
10,000
Cadmium Copper Iron Lead Mercury Nickel Silver Zinc
Conc
entr
atio
n (m
g/kg
)
Sum of Fractions 1-5
0.01
0.1

Chart 23Station NC079 75 – 85 cm Sequential Extraction Results
Metals Speciation ResultsNewtown Creek RI/FS
October 2018 181037-01.01
Note: Only detected fractions are shown in the pie charts.
F1
F2
F3
F4
F5
Exchangeable
Weak Acid Soluble (Carbonate Bound)
Reducible (Iron/Manganese Oxide Bound)
Oxidizable (Sulfide/Organic Matter Bound)
Residual
Pie Chart Legend:
Decr
easi
ngBi
oava
ilabi
lity
0.04% 0.5%
9.3%
31.6%58.5%
Iron
87.9%
12.1%
Cadmium 1.6% 2.7%
21.9%
51.4%
22.4%
Copper
28.6%
22.6%12.4%
36.4%
Lead
100.0%
Mercury 1.4% 2.8%
14.1%
30.1%51.6%
Nickel
100.0%
Silver 1.7% 4.2%
19.1%
15.3%59.7%
Zinc
0.43
32
29,045
8.4
0.02
29
0.06
91
0
0
1
10
100
1,000
10,000
100,000
Cadmium Copper Iron Lead Mercury Nickel Silver Zinc
Conc
entr
atio
n (m
g/kg
)
Sum of Fractions 1-5
0.01
0.001

Chart 24Station NC079 150 – 160 cm Sequential Extraction Results
Metals Speciation ResultsNewtown Creek RI/FS
October 2018 181037-01.01
Note: Only detected fractions are shown in the pie charts.
F1
F2
F3
F4
F5
Exchangeable
Weak Acid Soluble (Carbonate Bound)
Reducible (Iron/Manganese Oxide Bound)
Oxidizable (Sulfide/Organic Matter Bound)
Residual
Pie Chart Legend:
Decr
easi
ngBi
oava
ilabi
lity
0.58% 1.9%
14.5%
38.9%
44.1%
Iron
90.9%
9.1%
Cadmium 10.4%
21.8%
26.4%
31.9%
9.6%
Copper
39.4%
33.7%
26.9%
Lead
100.0%
Mercury 7.1%
10.1%
13.0%
33.4%
36.3%
Nickel
100.0%
Silver 6.4%
14.3%
34.3%19.6%
25.4%
Zinc
0.39
7.3
3,310
1.0
0.003
5.9
0.01
19
0
0
0
1
10
100
1,000
10,000
Cadmium Copper Iron Lead Mercury Nickel Silver Zinc
Conc
entr
atio
n (m
g/kg
)
Sum of Fractions 1-5
0.1
0.01
0.001


![GPU-Efficient Recursive Filtering and Summed-Area Tableshhoppe.com › recursive.pdfGPU shared memory [Harris et al.2008;Hensley2010]. In fact, summed-area tables can be computed with](https://static.fdocuments.net/doc/165x107/5f03bc287e708231d40a82b0/gpu-efficient-recursive-filtering-and-summed-area-a-recursivepdf-gpu-shared-memory.jpg)