Remedial Education at - National Center for Education ... · PDF fileRemedial Educa tion a t...
95
Remedial Education at Degree-Granting Postsecondary Institutions in Fall 2000 U.S. Department of Education Institute of Education Sciences NCES 2004-010 Statistical Analysis Report
-
Upload
phungxuyen -
Category
Documents
-
view
215 -
download
0
Transcript of Remedial Education at - National Center for Education ... · PDF fileRemedial Educa tion a t...

U.S. Department of EducationED Pubs8242-B Sandy CourtJessup, MD 20794-1398
Official BusinessPenalty for Private Use, $300
U.S. POSTAGE PAIDU.S. DEPARTMENT OF
EDUCATIONPERMIT NO. G-17
Re
me
dia
l Edu
ca
tion
at D
eg
ree
-Gra
ntin
g Po
stsec
on
da
ry Institu
tion
s in Fa
ll 20002003
Remedial Education atDegree-GrantingPostsecondaryInstitutions in Fall 2000
U.S. Department of EducationInstitute of Education SciencesNCES 2004-010
Statistical Analysis Report

Remedial Education at Degree-Granting Postsecondary Institutions in Fall 2000
U.S. Department of Education Institute of Education Sciences NCES 2004-010
Statistical Analysis Report
November 2003
Basmat ParsadLaurie Lewis Westat
Bernard Greene Project Officer National Center for Education Statistics

U.S. Department of Education Rod Paige Secretary
Institute of Education Sciences Grover J. Whitehurst Director
National Center for Education Statistics Val Plisko Associate Commissioner The National Center for Education Statistics (NCES) is the primary federal entity for collecting, analyzing, and reporting data related to education in the United States and other nations. It fulfills a congressional mandate to collect, collate, analyze, and report full and complete statistics on the condition of education in the United States; conduct and publish reports and specialized analyses of the meaning and significance of such statistics; assist state and local education agencies in improving their statistical systems; and review and report on education activities in foreign countries. NCES activities are designed to address high priority education data needs; provide consistent, reliable, complete, and accurate indicators of education status and trends; and report timely, useful, and high quality data to the U.S. Department of Education, the Congress, the states, other education policymakers, practitioners, data users, and the general public. We strive to make our products available in a variety of formats and in language that is appropriate to a variety of audiences. You, as our customer, are the best judge of our success in communicating information effectively. If you have any comments or suggestions about this or any other NCES product or report, we would like to hear from you. Please direct your comments to:
National Center for Education Statistics Institute of Education Sciences U.S. Department of Education 1990 K Street NW Washington, DC 20006
November 2003 The NCES World Wide Web Home Page is: http://nces.ed.gov The NCES World Wide Web Electronic Catalog is: http://nces.ed.gov/pubsearch Suggested Citation U.S. Department of Education, National Center for Education Statistics. Remedial Education at Degree-Granting Postsecondary Institutions in Fall 2000, NCES 2004-010, by Basmat Parsad and Laurie Lewis. Project Officer: Bernard Greene. Washington, DC: 2003. For ordering information on this report, write:
U.S. Department of Education ED Pubs P.O. Box 1398 Jessup, MD 20794–1398
Call toll free 1–877–4ED–PUBS; or order online at www.edpubs.org Content Contact: Bernard Greene (202) 502-7348 [email protected]

iii
EXECUTIVE SUMMARY
This study was conducted through the National Center for Education Statistics (NCES) Postsecondary Education Quick Information System (PEQIS). It was designed to provide current national estimates of the prevalence and characteristics of remedial courses and enrollments in degree-granting 2-year and 4-year postsecondary institutions that enrolled freshmen in fall 2000, and to report changes in remediation from fall 1995. For the purposes of this study, remedial education courses were defined as courses in reading, writing, or mathematics for college-level students lacking those skills necessary to perform college-level work at the level required by the institution.1 Key Findings This report presents data from the 2000 PEQIS survey and comparisons with the 1995 PEQIS survey on remedial course offerings, student participation in remedial programs, institutional structure of remedial programs, and the delivery of remedial courses through distance education. This study examined two issues not covered in the 1995 survey: types of technology used in the delivery of remedial education through distance education courses, and the use of computers as a hands-on instructional tool for on-campus remedial education. The data are presented by institutional type: public 2-year, private 2-year, public 4-year, and private 4-year.2
1 Respondents were asked to include any courses meeting the defini-
tion, regardless of the course name. Institutions may use other names for remedial courses, including “developmental,” “compensatory,” or “basic skills.”
2 Differences by institutional type are reported only when they are statistically significant.
Remedial Course Offerings In fall 1995 and 2000, institutions provided information about their remedial course offerings in the areas of greatest need for underprepared students—reading, writing, and mathematics3 (Merisotis and Phipps 2000). In fall 2000, about three-fourths (76 percent) of the Title IV degree-granting 2- and 4-year institutions that enrolled freshmen offered at least one remedial reading, writing, or mathematics course (table 1).4 A higher proportion of institutions offered remedial courses in mathematics (71 percent) and writing (68 percent) than in reading (56 percent). Remedial course offerings were generally limited to a small number of courses; the average (mean) number of different remedial courses offered by an institution was 2.0 for reading, 2.0 for writing, and 2.5 for mathematics (table 2). Public 2-year colleges were more likely than other types of institutions to provide remedial education. In fall 2000, public 2-year institutions (98 percent) were more likely than other types of institutions (59 to 80 percent) to offer one or more college-level remedial reading, writing, or mathematics courses (table 1), and they offered a greater number of different remedial courses, on average (table 2). Public 4-year institutions were also significant providers of remedial education in fall 2000.
3 Institutions were instructed on the front of the questionnaire to re-
spond for their regular undergraduate programs, except for question 13, which asked about services/courses to business and industry. Thus, remedial courses offered to business and industry were not considered in the institution’s reporting of remedial course offerings in other sections of the questionnaire.
4 All analyses in this report are based on institutions that enrolled freshmen at the time of the survey.

iv
Compared with private 4-year institutions, public 4-year institutions were more likely to offer one or more remedial reading, writing, or mathematics courses (80 vs. 59 percent) (table 1), and they offered a greater number of different remedial reading, writing, and mathematics courses, on average (table 2). Remedial education services or courses were offered to local business and industry by 21 percent of the institutions enrolling freshmen in fall 2000 (figure 7 and table 3).5 Among institutions that provided remedial services to business and industry, a higher proportion provided remediation in mathematics (93 percent) than in reading (81 percent). Public 2-year colleges were more likely than public or private 4-year institutions to offer remedial services or courses to local business and industry (56 percent vs. 8 and 3 percent, respectively) (figure 7). Between 1995 and 2000, no differences were detected in the overall proportion of institutions that offered at least one college-level remedial reading, writing, or mathematics course, although the proportion of institutions that offered remedial writing courses declined from 71 percent to 68 percent (table 1). No differences were detected in the average number of different remedial reading, writing, or mathematics courses offered during this time period (table 2). Participation in Remedial Courses In fall 2000, 28 percent of entering freshmen enrolled in one or more remedial reading, writing, or mathematics courses (table 4). The proportion of freshmen who enrolled in remedial courses was larger for mathematics than writing (22 vs. 14 percent), and it was smallest for reading (11 percent). The time that students spent in remediation was generally limited to 1 year or less; in fall 2000, a majority (60 percent) of
5 Remedial courses offered to local business and industry do not
include courses in the institutions’ regular undergraduate programs.
institutions that offered remedial courses indicated that the average time a student spent in remediation was less than 1 year, about one-third (35 percent) indicated that the average time was 1 year, and 5 percent reported an average time of more than 1 year (table 5). 6 Public 2-year colleges enrolled more of their entering freshmen in remedial courses (table 4), and they reported longer average time periods that students spent in remediation (table 5), compared with other types of institutions in fall 2000. For example, 42 percent of freshmen at public 2-year colleges and 12 to 24 percent of freshmen at other types of institutions enrolled in at least one remedial reading, writing, or mathematics course. Compared with private 4-year institutions, public 4-year institutions also enrolled a higher pro-portion of freshmen in one or more remedial reading, writing, or mathematics courses (table 4), and they reported longer average time periods that students spent in remediation (table 5). Between 1995 and 2000, no differences were detected in the proportion of entering freshmen who enrolled in at least one remedial reading, writing, or mathematics course (table 4). Data on the reported time spent in remediation, however, suggest an increase in the average length of time that students spent in remedial education courses. For example, between 1995 and 2000, the proportion of institutions that reported an average of 1 year of remediation for students increased from 28 percent to 35 percent, while the proportion indicating an average of less than 1 year of remediation for students decreased from 67 percent to 60 percent (table 5).
6 Students may also choose to limit the time they spend in remedia-
tion in order to qualify for federal student aid. Based on federal policy, students may not be considered eligible for federal financial aid if they are enrolled solely in remedial programs or if remedial coursework exceeds one academic year (Higher Education Act of 1965, as amended).

v
Institutional Structure of Remedial Programs Institutions were asked about the following strategies for organizing and delivering remedial programs: the approach for selecting students who need remedial coursework, whether enrollment in remedial courses is mandatory or optional for students who were determined to need remedia-tion, the kinds of restrictions placed on remedial coursetaking, the types of credit awarded for remedial coursework, and the primary provider of remedial courses at the institution. In fall 2000, the most common approach to select students for remedial coursework was to give placement tests to all entering students; 57 to 61 percent of institutions used this approach for remedial reading, writing, and mathematics courses (table 6). Institutions also tended to have mandatory placement policies for students who were determined to need remediation (table 7). In fall 2000, 75 to 82 percent of the institutions required students who were determined to need remediation to enroll in remedial reading, writing, or mathematics courses. Most institutions have some kind of restrictions on the extent to which remedial students can participate in regular courses and the type of credit awarded for remedial coursework. In fall 2000, 82 to 88 percent of institutions placed some restrictions on the regular courses that students could take while they were enrolled in remedial reading, writing, or mathematics courses (table 10). In addition, the most frequent type of credit given for remedial courses was institutional credit (e.g., counts toward financial aid, campus housing, or full-time student status, but does not count toward degree completion); 73 to 78 percent of the institutions most frequently gave institutional credit for remedial reading, writing, or mathe-matics coursework, 10 to 14 percent most often gave elective degree credit, and 2 to 4 percent most often gave subject degree credit (table 8).
In fall 2000, about one-fourth (26 percent) of the institutions reported that there was a limit on the length of time a student may take remedial courses at their institution (table 9). Time limits on remediation were set by institutional policy in 71 percent of these institutions, and by state policy or law in 24 percent of institutions with such limits. Finally, institutions tended to rely on their traditional academic departments as the primary providers of remedial education in fall 2000; a majority of institutions cited their traditional academic departments as the most frequent providers of remedial writing (70 percent), mathematics (72 percent), and reading courses (57 percent) (table 11). Between 1995 and 2000, institutions tended to move toward more restrictive remedial policies on student participation in regular coursework during remediation. For each subject area, there was an increase in the proportion of institutions that had some restrictions on the regular courses that students could take while they were enrolled in remedial courses (table 10). In addition, between 1995 and 2000, there was an increase in the proportion of institutions that required students who needed remedial mathematics to participate in such courses (from 75 to 81 percent) (table 7). Use of Advanced Technology in Remedial Education The institutional strategies for delivering remedial education courses examined in this report include the use of advanced technology in the delivery of remedial courses through distance education and on-campus instruction. In fall 2000, 13 percent of the institutions offered remedial courses through distance education, compared to 3 percent in 1995 (figures 9 and 10), and about one-third (31 to 35 percent) of the institutions reported that computers were used frequently by students as a hands-on instructional tool for on-campus remedial reading, writing, and mathematics courses (table 12).

vi
Public 2-year colleges were the primary users of advanced technology in remedial education. In fall 2000, public 2-year colleges were more likely than other types of institutions to offer their remedial courses through distance education (25 percent vs. 8 percent or less) (figure 9). Public
2-year colleges were also more likely than public or private 4-year institutions to report that they frequently used computers as a hands-on instruc-tional tool for their on-campus remedial reading, writing, and mathematics courses (table 12).

vii
ACKNOWLEDGMENTS
The authors wish to thank the many individuals who contributed to the development of the survey and this report. The survey was conducted by Westat under contract to the National Center for Education Statistics (NCES) of the U.S. Department of Education; Bernard Greene was project officer. The NCES staff who reviewed the report and provided valuable suggestions include Bruce Taylor, Marilyn Seastrom, William Hussar, Val Plisko, John Ralph, Lisa Hudson, John Wirt, Tracy Hunt-White, and Nancy Borkow. Reviewers outside of NCES were Hunter Boylan
of the National Center for Developmental Education at Appalachian State University, Robert McCabe of Miami Dade Community College, Jon Oberg of Policy and Program Studies Service, and Stephanie Cronen, Lawrence Lanahan, and Leslie Scott of the American Institutes for Research, Education Statistics Services Institute. At Westat, the project director was Elizabeth Farris. Data collection efforts were directed by Debbie Alexander with assistance from Ratna Basavaraju, and the programmer was Nazik Elgaddal. Carol Litman edited the report, which was formatted by Sylvie Warren.

viii
ix
Table of Contents
Chapter Page
Executive Summary ......................................................................................... iii 1 Introduction ...................................................................................................... 1
Debate on Remedial Education ........................................................................ 1 Prevalence of Remedial Education .................................................................. 2 Institutional Structure of Remedial Programs.................................................. 3 About This Study ............................................................................................. 4
Study Methodology and Analyses....................................................... 5 Organization of This Report................................................................ 5
2 Remedial Course Offerings.............................................................................. 7
Remedial Course Offerings.............................................................................. 7
Remedial Course Offerings: Overall.................................................. 7 Remedial Course Offerings in Reading, Writing, and Mathematics .. 7 Number of Remedial Courses ............................................................. 9 Remedial Course Offerings in Other Subject Areas ........................... 12
Reasons Institutions Do Not Offer Remedial Courses..................................... 12 Remedial Course Offerings to Local Business and Industry ........................... 13
3 Participation in Remedial Education................................................................ 17
Freshman Enrollment in Remedial Courses..................................................... 17
Freshman Enrollment in Remediation: Overall ................................. 17 Freshman Enrollment in Remediation by Subject Area...................... 17
Average Length of Time in Remedial Education............................................. 18
4 Institutional Structure of Remedial Programs.................................................. 21
Selection Approach .......................................................................................... 21 Course Requirement Status .............................................................................. 23 Type of Credit .................................................................................................. 24 Limitations on Length of Time in Remedial Courses ...................................... 25 Restrictions on Regular Academic Courses..................................................... 27 Providers of Remedial Education..................................................................... 28

x
Table of Contents—Continued
Chapter Page
5 Use of Advanced Technology in Remedial Instruction ................................... 31 Distance Education........................................................................................... 31
Use of Distance Education .................................................................. 31 Technology Use in Remedial Distance Education Courses................ 32
Use of Computers for Instruction..................................................................... 33
6 Summary and Conclusions............................................................................... 35
How Prevalent is Postsecondary Remedial Education?................................... 35 How is Remedial Education Organized and Delivered?.................................. 35 How Do Institutions Differ in the Provision, Organization, and
Delivery of Remedial Education? ....................................................... 36 What Changes Have Occurred in Remedial Education From 1995? ............... 37
References ........................................................................................................ 39
List of Appendixes Appendix
A Methodology .................................................................................................... A-1 B Standard Error Tables ...................................................................................... B-1 C Questionnaires: 1995 and 2000........................................................................ C-1
List of Text Tables Text Table
1 Number of degree-granting institutions that enrolled freshmen, and the
percent of those institutions that offered remedial reading, writing, or mathematics courses, by institutional type: Fall 1995 and 2000 .................... 8
2 Mean number of different remedial courses offered by degree-granting
institutions that enrolled freshmen, by subject area and institutional type: Fall 1995 and 2000........................................................................................... 11

xi
Table of Contents—Continued
List of Text Tables—Continued Text Table Page
3 Percent of degree-granting institutions that provided remedial education
services/courses to local business and industry, and the subject area and location of those services/ courses: Fall 1995 and 2000................................. 14
4 Number of entering freshmen at degree-granting institutions, and the
percent of entering freshmen that enrolled in remedial courses, by subject area and institutional type: Fall 1995 and 2000.................................. 18
5 Among degree-granting institutions that offered remedial courses,
percentage distribution indicating the approximate average length of time a student takes remedial courses at the institution, by institutional type: Fall 1995 and 2000................................................................................. 19
6 Among degree-granting institutions that offered remedial courses in the
given subjects, percentage distribution indicating the usual selection approach for remedial courses, by subject area and institutional type: Fall 1995 and 2000........................................................................................... 22
7 Among degree-granting institutions that offered remedial courses in the
given subjects, percentage distribution indicating the most frequent requirement status for remedial courses, by subject area and institutional type: Fall 1995 and 2000................................................................................. 23
8 Among degree-granting institutions that offered remedial courses in the
given subjects, percentage distribution indicating the most frequent type of credit earned for remedial courses, by subject area and institutional type: Fall 1995 and 2000.................................................................................. 25
9 Among degree-granting institutions that offered remedial courses,
percent indicating that there is a limitation on the length of time a student may take remedial courses at the institution, and the percentage distribution indicating how the time limit on remediation is set, by institutional type: Fall 1995 and 2000............................................................. 26
10 Among degree-granting institutions that offered remedial courses in the
given subjects, percentage distribution indicating the extent of restrictions on regular academic courses that students can take while taking remedial courses, by subject area: Fall 1995 and 2000........................ 27

xii
Table of Contents—Continued
List of Text Tables—Continued Text Table Page
11 Among degree-granting institutions that offered remedial courses in the
given subjects, percentage distribution indicating the location within the institution of the most frequent provider of remedial education, by subject area and institutional type: Fall 1995 and 2000.................................. 29
12 Among Title IV degree-granting institutions that offered remedial
courses in the given subjects, percentage distribution indicating how frequently computers are used by students as a hands-on instructional tool for on-campus remedial courses, by subject area and institutional type: Fall 2000................................................................................................. 33
List of Figures Figure
1 Among Title IV degree-granting institutions that offered remedial
courses in the given subjects, percentage distribution indicating various numbers of different remedial courses offered, by subject area: Fall 2000..... 9
2 Among degree-granting institutions that offered remedial courses in the
given subjects, percentage distribution indicating various numbers of different remedial courses offered, by subject area: Fall 1995........................ 10
3 Among Title IV degree-granting institutions that offered remedial
courses, percent indicating that they offered remedial courses in academic subjects other than reading, writing, or mathematics, by institutional type: Fall 2000 ....................................................................... 12
4 Among degree-granting institutions that offered remedial courses,
percent indicating that they offered remedial courses in academic subjects other than reading, writing, or mathematics, by institutional type: Fall 1995................................................................................................. 12
5 Among Title IV degree-granting institutions that did not offer remedial
courses, percent indicating the reasons they did not offer remedial courses: Fall 2000 ........................................................................................... 13
xiii
Table of Contents—Continued
List of Figures—Continued Figure Page
6 Among degree-granting institutions that did not offer remedial courses,
percent indicating the reasons they did not offer remedial courses: Fall 1995.................................................................................................................. 13
7 Percent of Title IV degree-granting institutions that provided remedial
education services/courses to local business and industry, by institutional type: Fall 2000................................................................................................. 14
8 Percent of degree-granting institutions that provided remedial education
services/courses to local business and industry, by institutional type: Fall 1995........................................................................................................... 15
9 Among Title IV degree-granting institutions that offered remedial
courses, percent indicating that the institution offered remedial courses through distance education, by institutional type: Fall 2000 .......................... 31
10 Among degree-granting institutions that offered remedial courses,
percent indicating that the institution offered remedial courses through distance education, by institutional type: Fall 1995........................................ 32
11 Among Title IV degree-granting institutions that offered remedial
courses through distance education, percent indicating the types of technology used as a primary mode of instructional delivery for the remedial courses offered through distance education: Fall 2000.................... 32

xiv

1
1. INTRODUCTION
The place of remediation in postsecondary curricula is a contentious issue and the focus of ongoing debate in policy-related literature and the media.1 Central to this debate is the question of whether remedial course offerings are appropriate at the college level, and whether those courses should be offered at all colleges or be restricted to 2-year colleges (Ignash 1997; Levin 2001; McCabe 2000; Roueche and Roueche 1999; Shults 2000). In recent years, concerns about the costs of remedial course offerings and the academic standards at 4-year institutions have become the focus of debate. These concerns have reportedly led some state education departments to take steps to try to reduce or eliminate remedial course offerings at 4-year institutions and to restrict the use of public funds for such courses (Hoyt and Sorenson 2001; Kozeracki 2002). Research on postsecondary remediation has been diverse, ranging from case studies to national surveys. Between 1984 and 1995, the National Center for Education Statistics (NCES) conducted three national studies to provide data on the prevalence and characteristics of postsecondary remediation.2 Those NCES surveys are the most
1 According to Saxon and Boylan (2001), remedial education had
been the topic of 48 newspaper articles in the nation’s largest newspapers between 1995 and 1999. In addition, remedial issues have been debated in policy-related literature published by various national organizations such as the American Association of Community Colleges (e.g., Shults 2000) and state organizations such as the California League for Innovation in the Community College (Saxon and Boylan 2001).
2 The data from the 1984 study are not comparable to the data from the later NCES studies because of changes in definitions and analyses. The data for the 1989 and 1995 studies as presented by Mansfield and Farris (1991) and Lewis and Farris (1996) are not comparable to the data for the current (2000) study because of a change in the way that NCES categorizes postsecondary institutions, and the inclusion of institutions in Puerto Rico in the earlier studies. The data for the 1989 and 1995 surveys represent 2-year and 4-year higher education institutions that enroll freshmen. At the time those surveys were conducted, NCES defined higher education institutions as institutions that are accredited at the college level by an agency recognized by the Secretary of the U.S. Department of Education (ED). Higher education institutions were a subset of all postsecondary institutions. The data for the 2000
widely cited sources of national data on remedial education at postsecondary institutions.3 This NCES survey, conducted in fall 2000, was designed to provide new national data on postsecondary remediation and changes from 1995. While several definitions exist, the NCES studies provide a working definition of postsecondary remedial education as courses in reading, writing, or mathematics for college-level students lacking those skills necessary to perform college-level work at the level required by the institution.4 Debate on Remedial Education Proponents generally agree that remedial education is necessary to provide expanded
survey represent 2-year and 4-year Title IV-eligible, degree-granting institutions that enroll freshmen. This change was necessary because ED no longer makes a distinction between higher education institutions and other postsecondary institutions that are eligible to participate in federal Title IV financial aid programs, and thus NCES no longer categorizes institutions as higher education institutions. In order to make comparisons between the 1995 and 2000 studies for presentation in this report, the data from the 1995 study were reanalyzed with the definition of eligible institutions changed to match the definition for the 2000 study as closely as possible. The sample for the 2000 survey and comparisons between the 1995 and 2000 surveys are discussed in more detail in the survey methodology section presented in appendix A.
3 NCES collects limited data on remedial education as part of other large-scale studies. These studies are not comparable to the PEQIS studies in methodologies and populations of interest. For example, the annual Integrated Postsecondary Education Data System (IPEDS) “Institutional Characteristics” survey provides data annually on the number of institutions that offer remedial services, and the “Postsecondary Education Transcript Study” (PETS) of the High School and Beyond Survey (HS&B) provides student-level data on remedial education. Postsecondary transcript data were also collected as part of three other surveys—the National Longitudinal Study (NLS) of the High School Class of 1972, the National Education Longitudinal Study of 1988, and the Undergraduate Transcript Study (i.e., the first follow up of the Baccalaureate and Beyond (B&B) for the 1992–93 cohort of bachelor's degree recipients).
4 Respondents were asked to include any courses meeting the defini-tion, regardless of the course name. Other names for remedial education include “developmental education,” “compensatory education,” and “basic skills.”

2
educational opportunities for entering post-secondary students who lack the appropriate academic skills, although there is considerable disagreement among educators, policymakers, and the public over whether remediation should be provided at all postsecondary levels or whether it should be restricted to 2-year institutions (Crowe 1998; Ignash 1997; McCabe 2000; Phelan 2000; Roueche and Roueche 1999; Spann 2000). Some argue that remedial course offerings are inappropriate for the curricula of 4-year institutions, and they suggest that the remedial needs of underprepared students might best be served at community colleges because of the mission of those colleges to provide access to postsecondary education (Ignash 1997). Advocates for the provision of remedial education at all institutional levels argue, however, that shifting remedial education solely to 2-year colleges could drain these institutions’ financial and human resources, reduce educational opportunities for remedial students, and create revenue problems for 4-year colleges that cannot afford the enrollment loss (Roueche and Roueche 1999). Much of the recent opposition to postsecondary remediation comes from cost concerns (Hoyt and Sorenson 2001), although some proponents argue that remedial education accounts for a small fraction of the current fund revenue of public colleges (Brenneman and Haarlow 1998; Saxon and Boylan 2001). Critics contend that remedial education diverts human and financial resources from other academic priorities (Kozeracki 2002), and uses public funds to pay a second time for training in academic skills that students should have acquired in high school (Hoyt and Sorenson 2001). Based on these arguments, some educators and policymakers suggest alternatives such as shifting the cost of postsecondary remediation to high schools (Ignash 1997) and improving student preparation for college through increased collaboration between colleges and high schools (Crowe 1998). Recent media reports indicate a tightening of remedial policies in some states, including policies aimed at reducing or eliminating remedial course offerings at public 4-year postsecondary
institutions and shifting the responsibility for postsecondary remediation to community colleges or private colleges. For example, after a monitoring period of 3 years, the Board of Regents of the City University of New York (CUNY) approved its new remediation plan in 2002; this plan is aimed at raising admission standards for baccalaureate programs and eliminating most remedial courses from the system’s senior colleges, while continuing them in community colleges, immersion courses, and other programs (Hebel 2003a). Some states have also tightened existing policies, such as limitations on the time that students are permitted to spend in remediation and the use of public funds for remedial education. For example, in 1999, the California State University system implemented more restrictive time limits on remediation as part of its push to reduce the number of entering students who enroll in remedial courses to 10 percent by 2007 (Hebel 2003b). Prevalence of Remedial Education Research on the prevalence of postsecondary remedial education focuses on the extent to which institutions offer remedial courses and the extent to which students enroll in such courses. Past NCES surveys indicate that about three-fourths (74 percent) of higher education institutions offered remedial education courses in 1989, and 30 percent of freshmen enrolled in at least one remedial reading, writing, or mathematics course (Mansfield and Farris 1991).5 In fall 1995, 78 percent of higher education institutions offered remedial education courses, and 29 percent of freshmen enrolled in at least one remedial reading, writing, or mathematics course (Lewis and Farris 1996). The NCES studies also found that remediation at most institutions was typically
5 Because all postsecondary institutions do not test all entering
freshmen and some do not label their remedial courses as such, the numbers of entering students who need remedial education and the number of remedial courses offered are probably higher than reported in studies that address prevalence. Additionally, the PEQIS studies asked for the percentage of entering freshmen enrolled in remedial courses, which may differ from the percentage of students who were determined to need remediation.

3
limited to one or two courses, and students generally spent 1 year or less in those courses. Past NCES studies suggest that the primary providers of remedial education are public 2-year institutions (Mansfield and Farris 1991; Lewis and Farris 1996). Compared to other types of institutions in 1989 and 1995, public 2-year colleges were more likely to offer one or more remedial reading, writing, or mathematics courses, and they were more likely to offer remedial courses or services to local business and industry. Public 2-year colleges also offered more remedial courses, enrolled higher proportions of freshmen in remediation, and reported longer average time periods that students spend in remediation. In addition, the role of public 2-year institutions in offering remedial services to local business and industry is also consistent with the policies of those institutions to provide community services, adult learning, and workforce training and retraining (Phelan 2000). Institutional Structure of Remedial Programs Institutional strategies for structuring remedial programs include the ways in which remedial needs are determined and served, such as policies for the assessment and placement of students in remedial courses, and procedures for the delivery of those courses. Approaches may differ considerably, reflecting the missions and types of institutions, the types of students served, and the extent to which remedial education is integrated into college-level curricula and traditional academic departments (Perin 2002). Accurate assessment of students’ remedial needs has been an ongoing concern as changes in state legislation during the 1990s called for increased emphasis on the assessment of incoming students (Russell 1997), and as educators raised questions about the validity of placement tests (Berger 1997) and the lack of consensus on what constitutes college-level work across institutions (Merisotis and Phipps 2000). Critics of placement policies for remedial students also contend that
although most institutions have established assessment procedures, the procedures for evaluating students’ academic skills vary considerably across institutional missions and types (Merisotis and Phipps 2000). Past NCES studies suggest, for example, that while the most common approach to assessment or placement is to give all entering students placement tests to determine the need for remediation, these strategies are found more often at public 2-year colleges (Mansfield and Farris 1991; Lewis and Farris 1996). Strategies for serving students’ remedial needs reflect the extent to which remedial education is embedded or separate from the regular academic system.6 Potential strategies for institutions that take an integrative approach to serving students’ remedial needs include mainstreaming remedial education (i.e., offering remedial courses through traditional academic departments) and organizing remedial courses as an integral part of college-level curricula. For example, to integrate remedial education into college-level curricula, institutions could permit students to simultaneously enroll in remedial and regular academic courses; they also could offer degree credit for remedial courses. In contrast, institutions seeking less integrative strategies could offer remedial courses through a separate remedial department or division, require underprepared students to complete a separate program of basic skills prior to any other college-level work, and offer only institutional credit for remedial coursework (e.g., credit that counts toward financial aid, campus housing, or full-time student status, but does not count toward degree completion). Some educators and policymakers suggest that the integration of remedial education into traditional academic departments and college-level curricula could have positive influences on remedial students’ attitudes and expectations (McCabe 2000), and it could provide opportunities for
6 Some educators use the terms “mainstreaming” to describe the
integration of remedial education into regular academic departments and “centralization” to describe the housing of remedial education in separate organizational units. In practice, institutions may use a combination of approaches (Perin 2002).

4
underprepared students to interact with their higher achieving peers and participate more fully in college life (Perin 2002). Critics of integration contend, however, that mixing prepared and underprepared students might result in a “watering down” of regular courses and prove to be a disservice to both types of students (Roueche and Roueche 1999). Others argue that the level of cross-disciplinary communication among faculty teaching remedial students might influence student performance regardless of whether remedial programs are embedded or separate from the regular academic system (Boylan, Bliss, and Bonham 1997; Boylan 2002). Past NCES studies (Mansfield and Farris 1991; Lewis and Farris 1996) suggest that although remedial education was most often provided by the institutions’ traditional academic departments, institutions tended to organize remedial education as distinct from their regular college curricula. For example, most institutions placed some kind of restrictions on the extent to which students could participate in regular courses while they were taking remedial courses, and most did not award degree credit for remedial courses. The NCES studies on remediation also found that while institutions generally made it mandatory for students who need remedial education to enroll in such courses, most did not impose limits on the length of time that a student could spend in remediation.7 About This Study This NCES survey was designed to investigate the prevalence and nature of remedial education in postsecondary institutions in fall 2000, and to examine changes from fall 1995. The current study allows for comparisons with the 1995 data because it revisits almost all of the issues addressed in that study. This study also examines
7 Students may also choose to limit the time they spend in remedia-
tion in order to qualify for federal student aid. Based on federal policy, students may not be considered eligible for federal financial aid if they are enrolled solely in remedial programs or if remedial coursework exceeds one academic year (Higher Education Act of 1965, as amended).
additional issues—the types of technology used in the delivery of remedial education through distance education courses, and the use of computers as a hands-on instructional tool for on-campus remedial education. Specifically, this report addresses the following questions about remedial education at postsecondary institutions: • How many and what kinds of postsecondary
institutions offered remedial courses in the fall of 2000? How many and what types of courses were offered? What are the reasons for not offering remedial courses? What changes have occurred from 1995?
• How many and what kinds of postsecondary institutions offered remedial courses to local business and industry in the fall of 2000? What types of courses were offered? What changes have occurred from 1995?
• What proportion of entering freshmen were enrolled in remedial courses in fall 2000? What was the average time spent in remedial courses? What changes have occurred from 1995?
• How did institutions select students for remedial coursework in fall 2000? How many institutions required students who needed remediation to enroll in remedial courses? What types of credit could students earn from remedial courses? What kinds of restrictions were placed on remedial coursetaking? How did various institutional types differ in the provision of remedial education? What changes have occurred from 1995?
• How many and what kinds of institutions offered remedial education through distance education in fall 2000, and what changes have occurred from 1995? What kinds of technology did institutions use to deliver remedial education through distance education in 2000? To what extent did institutions use computers as a hands-on instructional tool for on-campus remedial courses in 2000?

5
Study Methodology and Analyses The study was conducted through the NCES Postsecondary Education Quick Information System (PEQIS). The PEQIS is designed to collect small amounts of policy-relevant data on a quick turnaround basis from a previously recruited, nationally representative sample of 2-year and 4-year postsecondary institutions. The survey was mailed to PEQIS survey coordinators, with the request that the person at the institution who was most knowledgeable about the institution’s remedial education courses complete the questionnaire. Of the 1,242 eligible institutions, 1,186 completed questionnaires. The unweighted survey response rate was 95 percent, and the weighted response rate was 96 percent. The questionnaire responses were weighted to produce national estimates that represent all Title IV-eligible, degree-granting institutions in the United States that enrolled freshmen. All comparative statements in this report have been tested for statistical significance using t-tests adjusted for multiple comparisons8 and are significant at the 0.05 level. However, not all statistically significant differences are reported. Throughout this report, some differences that appear large may not be statistically significant because of the large standard errors surrounding the estimates or the small size of the analysis sample. The data are presented by institutional type: public 2-year, private 2-year, public 4-year, and private 4-year, and differences by institutional type are reported only when they are statistically significant. Type was created from a combination of level (2-year, 4-year) and control (public, private). As defined by NCES, 2-year institutions are institutions at which the highest level of offering is at least 2 but less than 4 years (below the baccalaureate degree); 4-year institutions are
8 See discussion of the Bonferroni adjustment in the methodology
section, appendix A.
those at which the highest level of offering is 4 or more years (baccalaureate or higher degree).9 To retain comparability with the 1995 NCES study, the current study included 2-year and 4-year degree-granting institutions that enrolled freshman students and asked some questions about freshman students, even though remediation is not entirely a freshman phenomenon. Institutions were asked to provide information about their remedial programs if they provided any remedial reading, writing, or mathematics courses in fall 2000.10 Organization of This Report This report presents information about postsecondary remedial education in fall 2000 and changes from fall 1995. The discussion is divided into chapters that reflect the major topics addressed in the questionnaire. Chapter 2 describes remedial course offerings, including remedial courses offered to undergraduates and to local business and industry. Participation in remedial education is reported in chapter 3, including the average length of time students spent in remedial education. Chapter 4 describes the ways in which institutions structure their remedial programs, including the selection of entering students for remedial coursework, the requirement status of remedial courses, restrictions on remedial coursetaking, types of credit earned from remedial courses, and providers of remedial education at the institution. Chapter 5 reports on the use of advanced technology in remedial education, including the delivery of remedial education through distance education, technology use in distance education, and the use of computers as a hands-on instructional tool for on-campus remedial courses. The concluding chapter summarizes the findings of the study. A detailed
9 Definitions for level are from the data file documentation for the
NCES Institutional Postsecondary Education Data System (IPEDS) Institutional Characteristics file. A detailed description of the institutional categories is provided in the methodology section, appendix A.
10The sample for the 2000 survey and comparisons between the 1995 and 2000 surveys are discussed in more detail in the survey methodology presented in appendix A.

6
discussion of the survey methodology (appendix A) and tables of standard errors for all data presented in this report (appendix B) are included as technical appendixes. The 1995 and 2000 PEQIS questionnaires are presented in appendix C.

7
2. REMEDIAL COURSE OFFERINGS
In fall 1995 and 2000, institutions that enrolled freshmen were asked about their remedial course offerings. The data are presented by institutional type: public 2-year, private 2-year, public 4-year, and private 4-year.11 Institutions reported • remedial course offerings for undergraduates
in reading, writing, and mathematics, and in other academic subjects;
• the reasons for not offering remedial courses; and
• remedial education services or courses offered to local business and industry.
Remedial Course Offerings Institutions indicated whether they offered any remedial reading, writing, or mathematics courses in fall 1995 and 2000.12 Institutions that offered at least one such course were asked whether they offered remedial courses in each of the three subject areas and to report the number of courses offered in each area. Remedial Course Offerings: Overall In fall 2000, about three-fourths (76 percent) of institutions that enrolled freshmen offered at least one remedial reading, writing, or mathematics
11Differences by institutional type are reported only when they are
statistically significant.
12Institutions were instructed on the front of the questionnaire to respond for their regular undergraduate programs, except for question 13, which asked about services/courses to business and industry. Thus, remedial courses offered to business and industry were not considered in the institution’s reporting of remedial course offerings in other sections of the questionnaire.
course (table 1).13 Remediation was more likely to be offered by public 2-year colleges (98 percent) than all other institutional types, and it was more likely to be offered by public 4-year institutions (80 percent) than private 4-year institutions (59 percent).14 Overall, no difference was detected between 1995 and 2000 in the proportion of institutions that offered at least one remedial reading, writing, or mathematics course (table 1). Remedial Course Offerings in Reading, Writing, and Mathematics In fall 2000, institutions were more likely to offer at least one remedial course in mathematics and writing than in reading (table 1). Seventy-one percent of institutions offered remedial mathematics courses and 68 percent offered remedial writing courses, compared with 56 percent of institutions that offered remedial reading courses. The proportion of institutions that offered remedial reading, writing, and mathematics courses in fall 2000 differed by institutional type, with public 2-year colleges being more likely than other types of institutions to provide college-level remediation in each subject (table 1). For example, remedial mathematics courses were offered by almost all public 2-year institutions
13Analyses in this report are based on institutions that enrolled
freshmen in fall 2000. These data are compared to those for institutions that enrolled freshmen in fall 1995.
14Estimates for private 2-year institutions were based on small sample sizes and generally had large standard errors. Thus, throughout the report, differences that appear large for private 2-year institutions were often not statistically significant.

8
(97 percent) compared with 49 to 78 percent of the other types of institutions. In addition, for each subject area, remedial courses were more likely to be offered by public than private 4-year institutions; for example, a higher proportion of public than private 4-year institutions offered remedial mathematics (78 vs. 49 percent). Between 1995 and 2000, no differences were detected in the overall proportion of institutions that offered remedial courses in reading or
mathematics, although the proportion that offered remedial writing courses decreased from 71 percent to 68 percent (table 1). Changes in remedial course offerings by institutional type were observed for public 2-year colleges. For each subject area, there was a decline in the proportion of public 2-year colleges that offered remedial courses; for example, the proportion of institutions that offered remedial reading declined from 99 percent in 1995 to 96 percent in 2000.
Table 1. Number of degree-granting institutions that enrolled freshmen, and the percent of those
institutions that offered remedial reading, writing, or mathematics courses, by institutional type: Fall 1995 and 2000
Percent of institutions that offered remedial courses in:
Year and institutional type
Number of degree-granting institutions with
freshmen Reading, writing,
or mathematics Reading Writing Mathematics 2000 All institutions ............... 3,230 76 56 68 71 Public 2-year........................ 1,080 98 96 96 97 Private 2-year....................... 270 63 37 56 62 Public 4-year........................ 580 80 49 67 78 Private 4-year....................... 1,300 59 30 46 49 1995 All institutions ............... 2,990 77 57 71 72 Public 2-year........................ 940 100 99 99 99 Private 2-year....................... 330 64 30 62 62 Public 4-year........................ 540 80 52 71 78 Private 4-year....................... 1,180 62 33 52 50
NOTE: Data reported for fall 2000 are based on Title IV degree-granting institutions that enrolled freshmen in fall 2000. Data reported for fall 1995 are based on degree-granting institutions that enrolled freshmen in fall 1995. The numbers of institutions have been rounded to the nearest 10.
SOURCE: U.S. Department of Education, National Center for Education Statistics, Postsecondary Education Quick Information System, “Survey on Remedial Education in Higher Education Institutions: Fall 1995,” 1995; and “Survey on Remedial Education in Higher Education Institutions: Fall 2000,” 2001.
9
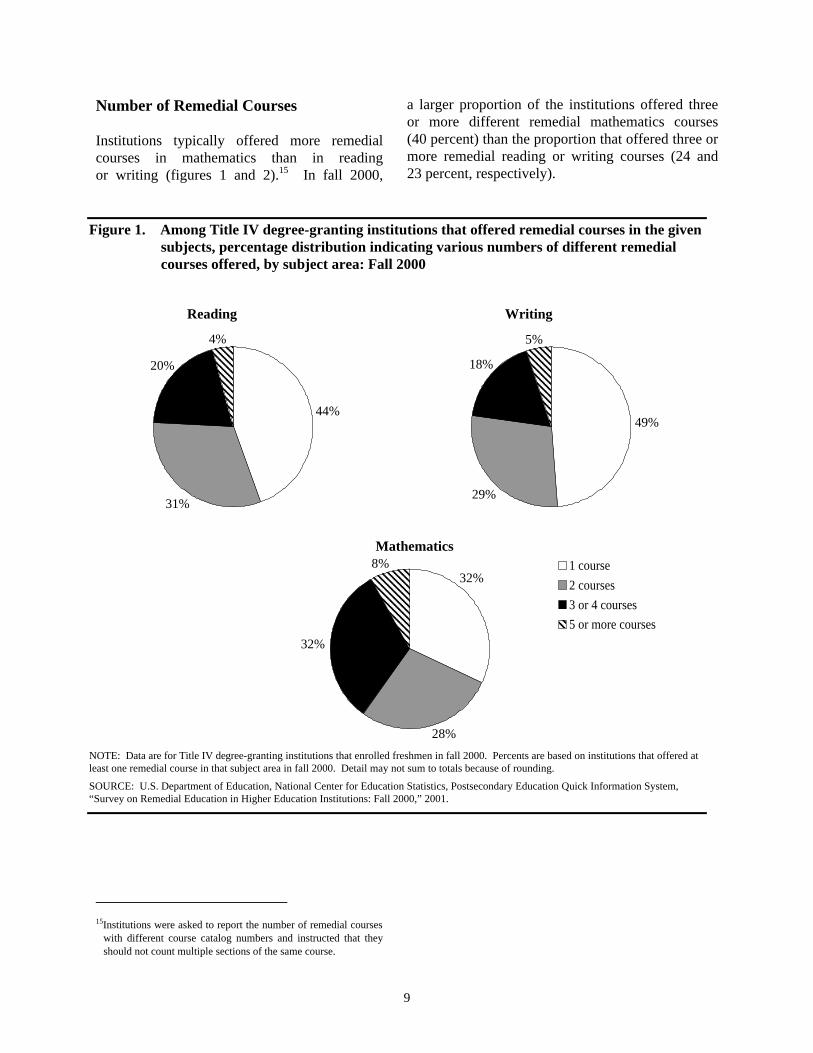
Number of Remedial Courses Institutions typically offered more remedial courses in mathematics than in reading or writing (figures 1 and 2).15 In fall 2000,
15Institutions were asked to report the number of remedial courses
with different course catalog numbers and instructed that they should not count multiple sections of the same course.
a larger proportion of the institutions offered three or more different remedial mathematics courses (40 percent) than the proportion that offered three or more remedial reading or writing courses (24 and 23 percent, respectively).
Figure 1. Among Title IV degree-granting institutions that offered remedial courses in the given subjects, percentage distribution indicating various numbers of different remedial courses offered, by subject area: Fall 2000
44%
31%
4%
20%
Reading
49%
29%
5%
18%
Writing
32%
32%
8%
28%
Mathematics
NOTE: Data are for Title IV degree-granting institutions that enrolled freshmen in fall 2000. Percents are based on institutions that offered at least one remedial course in that subject area in fall 2000. Detail may not sum to totals because of rounding.
SOURCE: U.S. Department of Education, National Center for Education Statistics, Postsecondary Education Quick Information System, “Survey on Remedial Education in Higher Education Institutions: Fall 2000,” 2001.
1 course2 courses3 or 4 courses5 or more courses

10
Figure 2. Among degree-granting institutions that offered remedial courses in the given subjects, percentage distribution indicating various numbers of different remedial courses offered, by subject area: Fall 1995
41%
33%
7%
19%
Reading
54%
25%
6%
15%
Writing
40%24%
13%
23%
Mathematics
NOTE: Data are for degree-granting institutions that enrolled freshmen in fall 1995. Percents are based on institutions that offered at least one remedial course in that subject area in fall 1995.
SOURCE: U.S. Department of Education, National Center for Education Statistics, Postsecondary Education Quick Information System, “Survey on Remedial Education in Higher Education Institutions: Fall 1995,” 1995.
The extent to which institutions offered postsecondary remediation is also reflected in the average number of courses offered by institutions (table 2). In fall 2000, institutions offered an average of 2.5 remedial mathematics courses, 2.0
remedial reading courses, and 2.0 remedial writing courses. Thus, on average, the number of different remedial mathematics courses offered was higher than the number of different courses in reading or writing.
1 course2 courses3 or 4 courses5 or more courses

11
In fall 2000, the average number of remedial courses differed by institutional type, with public 2-year colleges offering more remedial courses in each of the three subjects than did the other types of institutions (table 2). For example, public 2-year colleges offered an average of 3.4 different remedial mathematics courses, while other types of institutions offered averages of 1.5 to 2.1 such courses. Public 4-year institutions also offered more different reading, writing, and mathematics
courses (1.6 to 2.1 courses), on average, than did private 4-year institutions (1.2 to 1.5 courses). Overall, no differences were detected between 1995 and 2000 in the average number of different remedial reading, writing, or mathematics courses offered by institutions (table 2). However, the average number of remedial mathematics courses offered by private 2-year institutions increased from 1.3 in 1995 to 1.8 in 2000.
Table 2. Mean number of different remedial courses offered by degree-granting institutions that
enrolled freshmen, by subject area and institutional type: Fall 1995 and 2000
Year and institutional type Reading Writing Mathematics 2000 All institutions .................................................. 2.0 2.0 2.5 Public 2-year........................................................... 2.5 2.6 3.4 Private 2-year.......................................................... ‡ 1.6 1.8 Public 4-year........................................................... 1.6 1.6 2.1 Private 4-year.......................................................... 1.2 1.3 1.5 1995 All institutions .................................................. 2.2 2.0 2.5 Public 2-year........................................................... 2.7 2.7 3.6 Private 2-year.......................................................... ‡ ‡ 1.3 Public 4-year........................................................... 1.6 1.5 2.0 Private 4-year.......................................................... 1.5 1.4 1.5
‡ Reporting standards not met; too few cases for a reliable estimate.
NOTE: Data reported for fall 2000 are based on Title IV degree-granting institutions that enrolled freshmen in fall 2000. Data reported for fall 1995 are based on degree-granting institutions that enrolled freshmen in fall 1995. The means are based on institutions that offered remedial courses in that subject in that year.
SOURCE: U.S. Department of Education, National Center for Education Statistics, Postsecondary Education Quick Information System, “Survey on Remedial Education in Higher Education Institutions: Fall 1995,” 1995; and “Survey on Remedial Education in Higher Education Institutions: Fall 2000,” 2001.

12
Remedial Course Offerings in Other Subject Areas Of the institutions that offered at least one remedial course in fall 2000, 23 percent offered remedial courses in academic subject areas other than reading, writing, or mathematics (figure 3).16 The most frequently mentioned subjects were science (general science, biology, chemistry, and physics), English as a second language, study skills, and basic computer skills (not shown in figure). Public 2-year colleges were more likely than public or private 4-year institutions to offer such courses (37 percent vs. 15 and 11 percent, respectively). Figure 3. Among Title IV degree-granting
institutions that offered remedial courses, percent indicating that they offered remedial courses in academic subjects other than reading, writing, or mathematics, by institutional type: Fall 2000
11
15
37
23
0 20 40 60 80 100
Private 4-year
Public 4-year
Public 2-year
All institutions
Percent of institutions NOTE: Data are for Title IV degree-granting institutions that enrolled freshmen in fall 2000. Percents are based on those institutions that offered at least one remedial reading, writing, or mathematics course in fall 2000. Data for private 2-year institutions are included in the total percentage for all institutions, but they are not reported as a separate category because there were too few cases for a reliable estimate.
SOURCE: U.S. Department of Education, National Center for Education Statistics, Postsecondary Education Quick Information System, “Survey on Remedial Education in Higher Education Institutions: Fall 2000,” 2001.
16Institutions included some courses in the “other” category that are
typically not considered academic (e.g., English as a second language).
Between 1995 and 2000, no overall differences were detected in the proportion of institutions that offered remedial courses in subject areas other than reading, writing, or mathematics. However, when analyzing by institutional type, the proportion of public 4-year colleges that offered such courses declined from 27 percent to 15 percent during this time period (figures 3 and 4). Figure 4. Among degree-granting institutions
that offered remedial courses, percent indicating that they offered remedial courses in academic subjects other than reading, writing, or mathematics, by institutional type: Fall 1995
25
14
27
10
36
0 20 40 60 80 100
Private 4-year
Public 4-year
Private 2-year
Public 2-year
All institutions
Percent of institutions NOTE: Data are for degree-granting institutions that enrolled freshmen in fall 1995. Percents are based on those institutions that offered at least one remedial reading, writing, or mathematics course in fall 1995.
SOURCE: U.S. Department of Education, National Center for Education Statistics, Postsecondary Education Quick Information System, “Survey on Remedial Education in Higher Education Institutions: Fall 1995,” 1995. Reasons Institutions Do Not Offer Remedial Courses Institutions that did not offer remedial reading, writing, or mathematics courses were asked to indicate why those courses were not offered, using a list of reasons provided on the questionnaire: remedial courses were not needed by students at the institution, students at the institution who were determined to need remediation took remedial courses offered by another institution, state policy

13
or law did not allow the institution to offer remedial courses, and institutional policy did not allow the institution to offer remedial courses.17 Institutions were also given the option to specify an “other reason” for not offering remedial courses. The most common reason that institutions gave for not offering remedial courses was that students at the institution did not need such courses; 59 percent of the institutions that did not offer remedial courses in 2000 cited this reason (figure 5). Fewer institutions indicated that they did not offer remedial courses because students who were Figure 5. Among Title IV degree-granting
institutions that did not offer remedial courses, percent indicating the reasons they did not offer remedial courses: Fall 2000
15
8
26
29
59
0 20 40 60 80 100
Remedial courses were not needed
Students who need remediation
take it elsewhereInstitutional policy does
not allow remedial courses
State policy or law does not allow remedial
courses
Other reasons
Percent of institutions NOTE: Data are for Title IV degree-granting institutions that enrolled freshmen in fall 2000. Percents are based on the 24 percent of institutions that did not offer any remedial reading, writing, or mathematics courses in fall 2000. Respondents could select more than one reason.
SOURCE: U.S. Department of Education, National Center for Education Statistics, Postsecondary Education Quick Information System, “Survey on Remedial Education in Higher Education Institutions: Fall 2000,” 2001.
determined to need remediation took remedial courses at another institution (29 percent), and/or institutional policy did not allow remedial course
17Institutions could provide more than one reason for not offering
remedial reading, writing, or mathematics courses.
offerings (26 percent). Of the reasons listed, institutions were least likely to indicate that they did not offer remedial courses because their state policy or law did not allow such course offerings (8 percent). Fifteen percent of institutions indicated that they did not offer remedial courses because of reasons other than those listed in the survey. Overall, for each of the reasons examined in the survey, no differences were detected between 1995 and 2000 in the proportion of institutions that gave the reason for not offering remedial courses (figures 5 and 6). Figure 6. Among degree-granting institutions
that did not offer remedial courses, percent indicating the reasons they did not offer remedial courses: Fall 1995
9
5
22
27
66
0 20 40 60 80 100
Remedial courses were not needed
Students who need remediation
take it elsewhere
Institutional policy does not allow remedial
courses
State policy or law does not allow remedial
courses
Other reasons
Percent of institutions NOTE: Data are for degree-granting institutions that enrolled freshmen in fall 1995. Percents are based on the 23 percent of institutions that did not offer any remedial reading, writing, or mathematics courses in fall 1995. Respondents could select more than one reason.
SOURCE: U.S. Department of Education, National Center for Education Statistics, Postsecondary Education Quick Information System, “Survey on Remedial Education in Higher Education Institutions: Fall 1995,” 1995.
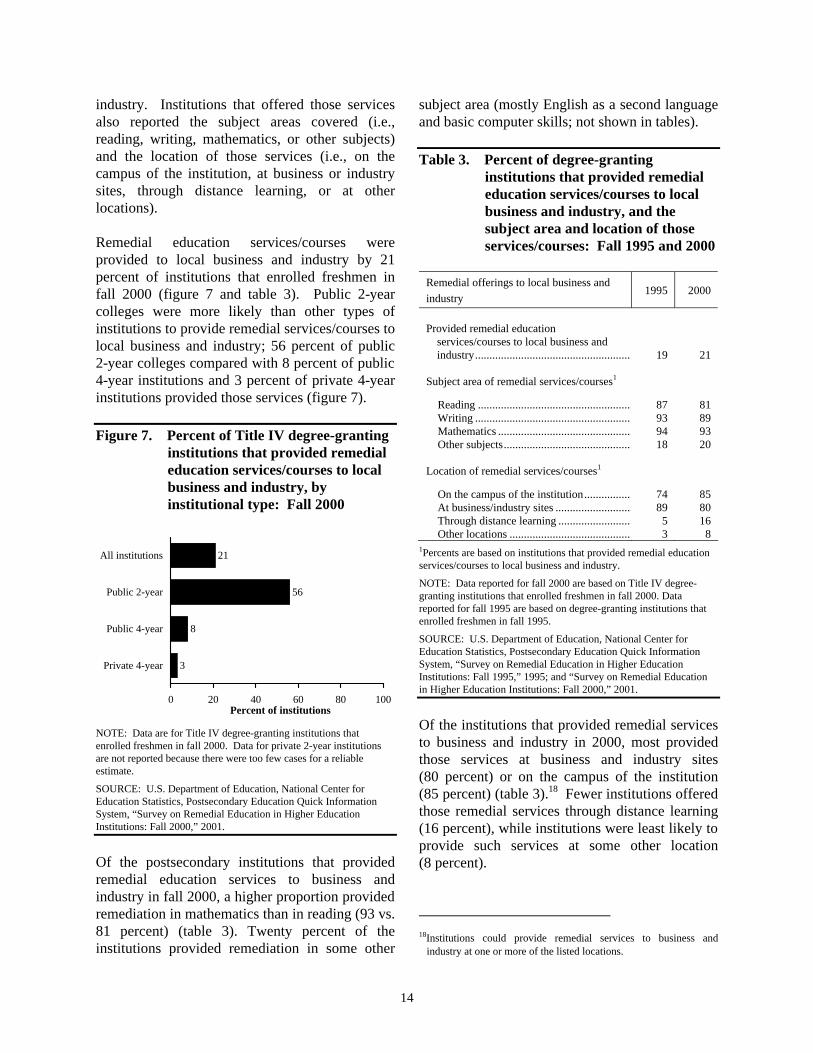
Remedial Course Offerings to Local Business and Industry Institutions reported whether they provided remedial services or courses to local business and
14
industry. Institutions that offered those services also reported the subject areas covered (i.e., reading, writing, mathematics, or other subjects) and the location of those services (i.e., on the campus of the institution, at business or industry sites, through distance learning, or at other locations). Remedial education services/courses were provided to local business and industry by 21 percent of institutions that enrolled freshmen in fall 2000 (figure 7 and table 3). Public 2-year colleges were more likely than other types of institutions to provide remedial services/courses to local business and industry; 56 percent of public 2-year colleges compared with 8 percent of public 4-year institutions and 3 percent of private 4-year institutions provided those services (figure 7). Figure 7. Percent of Title IV degree-granting
institutions that provided remedial education services/courses to local business and industry, by institutional type: Fall 2000
3
8
56
21
0 20 40 60 80 100
Private 4-year
Public 4-year
Public 2-year
All institutions
Percent of institutions NOTE: Data are for Title IV degree-granting institutions that enrolled freshmen in fall 2000. Data for private 2-year institutions are not reported because there were too few cases for a reliable estimate.
SOURCE: U.S. Department of Education, National Center for Education Statistics, Postsecondary Education Quick Information System, “Survey on Remedial Education in Higher Education Institutions: Fall 2000,” 2001.
Of the postsecondary institutions that provided remedial education services to business and industry in fall 2000, a higher proportion provided remediation in mathematics than in reading (93 vs. 81 percent) (table 3). Twenty percent of the institutions provided remediation in some other
subject area (mostly English as a second language and basic computer skills; not shown in tables). Table 3. Percent of degree-granting
institutions that provided remedial education services/courses to local business and industry, and the subject area and location of those services/courses: Fall 1995 and 2000
Remedial offerings to local business and industry
1995 2000
Provided remedial education
services/courses to local business and industry................................................................19 21
Subject area of remedial services/courses1 Reading ................................................................87 81 Writing ................................................................93 89 Mathematics ................................................................94 93 Other subjects................................................................18 20 Location of remedial services/courses1 On the campus of the institution................................74 85 At business/industry sites ................................ 89 80 Through distance learning ................................ 5 16 Other locations ................................................................3 8
1Percents are based on institutions that provided remedial education services/courses to local business and industry.
NOTE: Data reported for fall 2000 are based on Title IV degree-granting institutions that enrolled freshmen in fall 2000. Data reported for fall 1995 are based on degree-granting institutions that enrolled freshmen in fall 1995.
SOURCE: U.S. Department of Education, National Center for Education Statistics, Postsecondary Education Quick Information System, “Survey on Remedial Education in Higher Education Institutions: Fall 1995,” 1995; and “Survey on Remedial Education in Higher Education Institutions: Fall 2000,” 2001.
Of the institutions that provided remedial services to business and industry in 2000, most provided those services at business and industry sites (80 percent) or on the campus of the institution (85 percent) (table 3).18 Fewer institutions offered those remedial services through distance learning (16 percent), while institutions were least likely to provide such services at some other location (8 percent).
18Institutions could provide remedial services to business and
industry at one or more of the listed locations.

15
Between 1995 and 2000, no differences were detected in the proportion of institutions that provided remedial services to business and industry, overall, and in each of the subject areas examined (table 3 and figures 7 and 8). However, the proportion of institutions that offered remedial education services to business and industry through distance education increased from 5 percent in 1995 to 16 percent in 2000. During this time period, the proportion of institutions offering remedial services at business and industry sites declined from 89 percent to 80 percent, whereas the proportion of institutions offering such services at campuses of institutions increased from 74 percent to 85 percent.
Figure 8. Percent of degree-granting institutions that provided remedial education services/courses to local business and industry, by institutional type: Fall 1995
4
6
50
19
0 20 40 60 80 100
Private 4-year
Public 4-year
Public 2-year
All institutions
Percent of institutions NOTE: Data are for degree-granting institutions that enrolled freshmen in fall 1995. Data for private 2-year institutions are not reported because there were too few cases for a reliable estimate.
SOURCE: U.S. Department of Education, National Center for Education Statistics, Postsecondary Education Quick Information System, “Survey on Remedial Education in Higher Education Institutions: Fall 1995,” 1995.

16

17
3. PARTICIPATION IN REMEDIAL EDUCATION
In fall 1995 and 2000, postsecondary institutions were asked about student participation in remedial courses, including freshman enrollment in remedial courses and the average length of time that students spent in remedial courses.19 Freshman Enrollment in Remedial Courses In fall 2000, institutions that offered remedial reading, writing, or mathematics courses were asked about the percentage of entering freshmen that enrolled in any remedial course in one or more of these subject areas, and the percentage that enrolled in remedial courses in each subject area. This information was used with enrollment data from the Integrated Postsecondary Education Data System (IPEDS) 2000 Fall Enrollment file to calculate the number of entering freshmen enrolled in remedial education courses at each institution, and the percentage across institutions.20 19Institutions reported the percentage of entering freshmen who
enrolled in remedial reading, writing, or mathematics courses. Data on the length of time spent in remediation were based on institutional reporting of the average length of time a student took remedial courses. The data are presented by institutional type: public 2-year, private 2-year, public 4-year, and private 4-year.
20The PEQIS surveys asked institutions about the percentage of entering freshmen enrolled in remedial education. The percentages were used with information from the IPEDS 2000 Fall Enrollment file about the total number of first-time freshmen (both full and part time) enrolled at the institution. The IPEDS information about the total number of first-time freshmen was used (a) to convert the PEQIS questionnaire data on the percentage of entering freshmen enrolled in remedial education to the number of entering freshmen enrolled in remedial education at each institution, and (b) as a denominator to calculate the percentage of entering freshmen enrolled in remedial education across all institutions that enrolled freshmen. Thus, national estimates for the percentage of entering freshmen enrolled in remedial education were obtained by dividing the sum of entering freshmen enrolled in remedial education across all institutions by the sum of all first-time freshman enrollments across all institutions. To maintain comparability with previous estimates of freshman enrollment in remedial education, the information from IPEDS used in this calculation included only first-time, first-year students; other first-year students were not included. It is possible that institutions may have included both
Freshman Enrollment in Remediation: Overall Twenty-eight percent of entering freshmen enrolled in at least one remedial reading, writing, or mathematics course in fall 2000 (table 4). Freshman remedial enrollments differed by institutional type. The proportion of freshmen enrolling in at least one remedial reading, writing, or mathematics course was higher at public 2-year colleges than it was for all other types of institutions; 42 percent of freshmen at public 2-year colleges compared with 12 to 24 percent of freshmen at other types of institutions enrolled in such courses. In addition, public 4-year institutions had a higher proportion of freshmen enrolling in at least one remedial reading, writing, or mathematics course than did private 4-year institutions; 20 percent of freshmen at public 4-year institutions and 12 percent at private 4-year institutions enrolled in such courses in 2000. Between 1995 and 2000, no difference was detected in the overall proportion of entering freshmen who were enrolled in at least one remedial reading, writing, or mathematics course (table 4). Freshman Enrollment in Remediation by Subject Area In fall 2000, the proportion of entering freshmen who were enrolled in remedial courses was larger for mathematics than writing (22 vs. 14 percent), and it was smallest for reading courses (11 percent) (table 4). Differences in remedial enrollments by institu-tional type were also observed for each of the subject areas examined in the survey (table 4). Among institutions that enrolled freshmen in fall
types of first-year students in their estimates of entering freshmen enrolled in remedial education.

18
2000, remedial enrollments for reading and mathematics were higher in public 2-year colleges than in all other types of institutions; for example, 35 percent of freshmen at public 2-year colleges enrolled in remedial mathematics compared with 8 to 18 percent of freshmen who enrolled in such courses at other types of institutions. Remedial enrollments for writing were higher at public 2-year colleges than at public and private 4-year institutions in 2000 (23 percent vs. 9 and 7 percent, respectively). Between 1995 and 2000, no differences were detected in the proportion of freshmen who were enrolled in remedial reading or mathematics,
although the proportion of freshmen enrolled in remedial writing declined from 16 to 14 percent (table 4). Average Length of Time in Remedial Education In fall 1995 and 2000, institutions that offered remedial courses were asked to indicate about how long, on average, a student takes remedial courses—less than 1 year, 1 year, or more than 1 year.
Table 4. Number of entering freshmen at degree-granting institutions, and the percent of
entering freshmen enrolled in remedial courses, by subject area and institutional type: Fall 1995 and 2000
Percent of entering freshmen enrolled in remedial courses in:
Year and institutional type Number of
entering freshmen (in thousands)
Reading, writing, or mathematics Reading Writing Mathematics
2000 All institutions ............... 2,396 28 11 14 22 Public 2-year........................ 992 42 20 23 35 Private 2-year....................... 58 24 9 17 18 Public 4-year........................ 849 20 6 9 16 Private 4-year....................... 497 12 5 7 8 1995 All institutions ............... 2,100 28 12 16 22 Public 2-year........................ 936 40 19 24 32 Private 2-year....................... 53 26 11 19 23 Public 4-year........................ 721 21 8 11 17 Private 4-year....................... 389 12 5 7 8
NOTE: Data reported for fall 2000 are based on Title IV degree-granting institutions that enrolled freshmen in fall 2000. Data reported for fall 1995 are based on degree-granting institutions that enrolled freshmen in fall 1995. The PEQIS surveys asked institutions about the percentage of entering freshmen enrolled in remedial education. The percentages were used with information from the IPEDS 2000 Fall Enrollment file about the total number of first-time freshmen (both full and part time) enrolled at the institution. The IPEDS information about the total number of first-time freshmen was used (a) to convert the PEQIS questionnaire data on the percentage of entering freshmen enrolled in remedial education to the number of entering freshmen enrolled in remedial education at each institution, and (b) as a denominator to calculate the percentage of entering freshmen enrolled in remedial education across all institutions that enrolled freshmen. Thus, national estimates for the percentage of entering freshmen enrolled in remedial education were obtained by dividing the sum of entering freshmen enrolled in remedial education across all institutions by the sum of all first-time freshman enrollments across all institutions. To maintain comparability with previous estimates of freshman enrollment in remedial education, the information from IPEDS used in this calculation included only first-time, first-year students; other first-year students were not included. It is possible that institutions may have included both types of first-year students in their estimates of entering freshmen enrolled in remedial education. Detail may not sum to totals because of rounding.
SOURCE: U.S. Department of Education, National Center for Education Statistics, Postsecondary Education Quick Information System, “Survey on Remedial Education in Higher Education Institutions: Fall 1995,” 1995; and “Survey on Remedial Education in Higher Education Institutions: Fall 2000,” 2001.

19
The majority of institutions reported that students spent 1 year or less in remediation, on average (table 5). Of the institutions that offered remedial courses in fall 2000, 60 percent indicated that their students spent an average time of less than 1 year on remedial courses, 35 percent reported that their students spent an average of 1 year on such courses, and 5 percent reported an average time of more than 1 year in remediation. Time spent in remediation was generally longer at public 2-year colleges than at other types of institutions (table 5). In fall 2000, public 2-year colleges were more likely than public 4-year institutions to report that students spent an average of more than 1 year on remedial courses (10 vs. 3 percent). In addition, public 2-year colleges were more likely than public or private 4-year institutions to indicate that students spent an
average of 1 year on remedial courses (53 percent vs. 35 and 16 percent, respectively). Time spent in remediation was also longer at public 4-year than private 4-year institutions; 35 percent of public 4-year institutions and 16 percent of private 4-year institutions reported that students spent an average of 1 year in remediation. Data on the reported time spent in remediation suggest an increase in the average length of time overall that students spent in remedial education courses. Between 1995 and 2000, the proportion of institutions that reported an average of 1 year of remediation for students increased from 28 percent to 35 percent, while the proportion indicating an average of less than 1 year of remediation for students decreased from 67 percent to 60 percent (table 5).
Table 5. Among degree-granting institutions that offered remedial courses, percentage
distribution indicating the approximate average length of time a student takes remedial courses at the institution, by institutional type: Fall 1995 and 2000
Year and institutional type Less than 1 year 1 year More than 1 year 2000 All institutions ........................................... 60 35 5 Public 2-year.................................................... 37 53 10 Private 2-year................................................... 84 11! ‡ Public 4-year.................................................... 62 35 3 Private 4-year................................................... 83 16 ‡ 1995 All institutions ........................................... 67 28 5 Public 2-year.................................................... 45 44 11 Private 2-year................................................... 95 5 # Public 4-year.................................................... 69 28 3! Private 4-year................................................... 84 14 ‡
#Rounds to zero.
!Interpret data with caution; coefficient of variation greater than 50 percent.
‡Reporting standards not met; too few cases for a reliable estimate.
NOTE: Data reported for fall 2000 are based on Title IV degree-granting institutions that enrolled freshmen in fall 2000. Data reported for fall 1995 are based on degree-granting institutions that enrolled freshmen in fall 1995. Percents are based on institutions that offered at least one remedial reading, writing, or mathematics course in that year. Detail may not sum to totals because of rounding and not reporting where there are too few cases for a reliable estimate.
SOURCE: U.S. Department of Education, National Center for Education Statistics, Postsecondary Education Quick Information System, “Survey on Remedial Education in Higher Education Institutions: Fall 1995,” 1995; and “Survey on Remedial Education in Higher Education Institutions: Fall 2000,” 2001.

20

21
4. INSTITUTIONAL STRUCTURE OF REMEDIAL PROGRAMS
In fall 1995 and 2000, postsecondary institutions were asked about the way they structured remedial programs.21 Institutions reported • the approach used to select students for
remedial courses;
• the requirement status of remedial courses;
• the most frequent type of credit earned from remedial courses;
• whether they had time limits on remediation, and the approach used to set those limits;
• the extent to which remedial students were restricted from taking regular academic courses; and
• the department or other organization that most often provided remedial education.
Selection Approach Institutions may differ in the way they select students who need remedial coursework—they may give all entering students placement tests to determine the need for remediation, they may give entering students who meet various criteria (e.g., low SAT/ACT scores or low grade point averages) placement tests to determine need, they may require or encourage entering students who meet various criteria to enroll in remedial courses, or they may use some other selection approach. In fall 2000, the most common selection approach for remedial coursework was to give placement tests to all entering students; a majority of
21As with previous chapters, the data are presented by institutional
type: public 2-year, private 2-year, public 4-year, and private 4-year.
institutions (57 to 61 percent) used this approach for remedial reading, writing, and mathematics (table 6). The second most common selection approach was to give placement tests to entering students who meet various criteria; 25 to 29 percent of institutions used this approach for remedial reading, writing, and mathematics courses. Ten to 12 percent of the institutions reported that they required or encouraged entering students who met various criteria to enroll in remedial courses, while 2 to 4 percent reported some other approach to select students for remedial coursework.22 The proportion of institutions that gave all entering students placement tests to determine the need for remedial coursework differed by institutional type in fall 2000 (table 6). This approach was reported more often by public 2-year than public 4-year institutions to select students for remedial reading (63 vs. 44 percent). It was also reported more often by private 2-year colleges than private and public 4-year institutions to select students for remedial writing (86 percent vs. 54 and 50 percent, respectively), and it was reported more often by private 2-year than all other types of institutions to select students for remedial mathematics (87 percent compared with 54 to 64 percent). One possible reason for the differences is that 4-year institutions tend to rely more than 2-year institutions on SAT, ACT, and GPA scores to determine remedial needs. For example, past data show that a higher proportion of 4-year than 2-year institutions used admission test scores as an admission criterion (Snyder 2001). Differences by institutional type were also observed in the proportion of institutions that
22Other selection approaches include faculty or staff referring
students for enrollment in remedial/developmental courses, and students referring themselves for enrollment in such courses.

22
Table 6. Among degree-granting institutions that offered remedial courses in the given subjects, percentage distribution indicating the usual selection approach for remedial courses, by subject area and institutional type: Fall 1995 and 2000
Reading Writing Mathematics
Year and institutional type
All entering students
given placement
tests to determine
need
Entering students
who meet various criteria
given placement
tests to determine
need1
Entering students
who meet various
criteria are required or encouraged
to enroll2
Other selection
approach3
All entering students
given placement
tests to determine
need
Entering students
who meet various criteria
given placement
tests to determine
need1
Entering students
who meet various
criteria are required or encouraged
to enroll2
Other selection
approach3
All entering students
given placement
tests to determine
need
Entering students
who meet various criteria
given placement
tests to determine
need1
Entering students
who meet various
criteria are required or encouraged
to enroll2
Other selection
approach3
2000 All institutions 57 29 10 4 60 27 12 2 61 25 11 3 Public 2-year ........ 63 29 6 2 63 30 5 1 64 28 6 2 Private 2-year ....... ‡ ‡ ‡ ‡ 86 13! ‡ # 87 12! ‡ # Public 4-year ........ 44 32 15 9 50 30 18 1 55 27 15 3 Private 4-year ....... 49 25 20 5 54 22 21 3 54 23 18 5 1995 All institutions 58 23 10 9 60 25 9 7 64 22 8 6 Public 2-year ........ 69 20 3 8 68 22 2 8 69 22 2 8 Private 2-year ....... ‡ ‡ ‡ ‡ ‡ ‡ # ‡ 82 16 # ‡ Public 4-year ........ 37 34 17 12 49 26 18 7 53 28 14 6 Private 4-year ....... 46 23 21 10 48 28 18 6 56 24 16 6
#Rounds to zero.
!Interpret data with caution; coefficient of variation greater than 50 percent.
‡ Reporting standards not met; too few cases for a reliable estimate. 1Entering students who do not have SAT/ACT scores or who score below a certain level on the SAT/ACT or have a GPA below a certain level are given placement tests to determine need for remediation. 2Entering students who score below a certain level on the SAT/ACT or have a GPA below a certain level are required or encouraged to enroll in remedial/developmental courses. 3Other selection approaches include faculty or staff refer students for enrollment in remedial/developmental courses, students refer themselves for enrollment in remedial/developmental courses, and other approaches.
NOTE: Data reported for fall 2000 are based on Title IV degree-granting institutions that enrolled freshmen in fall 2000. Data reported for fall 1995 are based on degree-granting institutions that enrolled freshmen in fall 1995. Percents are based on institutions that offered at least one remedial course in that subject in that year. Detail may not sum to totals because of rounding and not reporting where there are too few cases for a reliable estimate.
SOURCE: U.S. Department of Education, National Center for Education Statistics, Postsecondary Education Quick Information System, “Survey on Remedial Education in Higher Education Institutions: Fall 1995,” 1995; and “Survey on Remedial Education in Higher Education Institutions: Fall 2000,” 2001.

23
required or encouraged entering students who meet various criteria to enroll in remedial courses in fall 2000 (table 6). For each subject area, this approach was reported more often by public and private 4-year institutions than public 2-year colleges. For example, this approach was used to select students for remedial writing courses by 21 percent of private 4-year institutions, 18 percent of public 4-year institutions, and 5 percent of public 2-year colleges. Between 1995 and 2000, the proportion of institutions overall that gave reading placement tests to entering students who met various criteria increased from 23 to 29 percent, and the proportion of institutions that required or encouraged entering students who met various
criteria to enroll in remedial mathematics courses increased from 8 to 11 percent (table 6). Course Requirement Status Institutions were asked whether remedial courses for students needing remediation were required, or if they were recommended but not required. In fall 2000, most institutions (75 to 82 percent) required remedial reading, writing, or mathematics courses (table 7). Differences in the requirement status of remedial courses by subject area suggest that the requirements for students enrolled in remedial writing and mathematics were more stringent than the requirements for remedial reading (table 7). In fall 2000, a higher proportion
Table 7. Among degree-granting institutions that offered remedial courses in the given subjects,
percentage distribution indicating the most frequent requirement status for remedial courses, by subject area and institutional type: Fall 1995 and 2000
Reading Writing Mathematics
Year and institutional type
Required
Recommended but not
required Required
Recommended but not
required Required
Recommended but not
required 2000 All institutions ................... 75 25 82 18 81 19 Public 2-year............................ 71 29 76 24 75 25 Private 2-year........................... ‡ ‡ 88 12! 87 13! Public 4-year............................ 77 23 84 16 81 19 Private 4-year........................... 82 18 89 11 88 12 1995 All institutions ................... 71 29 79 21 75 25 Public 2-year............................ 62 38 69 31 67 33 Private 2-year........................... ‡ ‡ ‡ ‡ 82 18! Public 4-year............................ 74 26 86 14 81 19 Private 4-year........................... 84 16 86 14 79 21
!Interpret data with caution; coefficient of variation greater than 50 percent.
‡Reporting standards not met; too few cases for a reliable estimate.
NOTE: Data reported for fall 2000 are based on Title IV degree-granting institutions that enrolled freshmen in fall 2000. Data reported for fall 1995 are based on degree-granting institutions that enrolled freshmen in fall 1995. Percents are based on institutions that offered at least one remedial course in that subject in that year.
SOURCE: U.S. Department of Education, National Center for Education Statistics, Postsecondary Education Quick Information System, “Survey on Remedial Education in Higher Education Institutions: Fall 1995,” 1995; and “Survey on Remedial Education in Higher Education Institutions: Fall 2000,” 2001.

24
of institutions required remedial writing and mathematics (82 and 81 percent, respectively) than reading courses (75 percent). The proportion of institutions that required students to participate in remedial writing and mathematics courses differed by institutional type in fall 2000, with private 4-year institutions more likely than public 2-year colleges to report this requirement for both subject areas (table 7). For example, 88 percent of private 4-year institutions compared with 75 percent of public 2-year colleges reported that students who needed remedial mathematics were required to participate in those courses. Between 1995 and 2000, there was an increase (from 75 to 81 percent) in the proportion of institutions overall that required students who were determined to need remediation in mathematics to participate in such courses (table 7). No changes were observed in the proportion of institutions that had this requirement for students who were determined to need remediation in reading or writing. Changes in the proportion of institutions that required students who were determined to need remediation to participate in such courses were also observed for public 2-year colleges (table 7). Between 1995 and 2000, the proportion of public 2-year colleges that had this requirement increased for remedial reading (from 62 to 71 percent), remedial writing (from 69 to 76 percent), and remedial mathematics (from 67 to 75 percent). In addition, the proportion of private 4-year institutions that required students to participate in remedial mathematics increased from 79 to 88 percent. Type of Credit In fall 1995 and 2000, institutions reported the most frequent type of credit they gave for remedial reading, writing, and mathematics courses from among the following options: degree credit that counts toward subject requirements, degree credit that counts toward elective
requirements, institutional credit (e.g., counts toward financial aid, campus housing, or full-time student status, but does not count toward degree completion), or no credit. Institutional credit was most often given for remedial courses in fall 2000; 73 to 78 percent of the institutions indicated that institutional credit was most frequently given for remedial reading, writing, or mathematics courses (table 8). Fewer institutions reported elective degree credit (10 to 14 percent) or subject degree credit (2 to 4 percent) as the most frequent type of credit for remedial courses. Nine to 10 percent of institutions did not give any credit for remedial reading, writing, or mathematics courses. The proportion of institutions that most frequently gave institutional credit for remedial courses differed by the type of institution (table 8). For each subject area, private 4-year institutions were less likely than other types of institutions to most frequently award institutional credit in fall 2000. For example, institutional credit was less frequently given by private 4-year institutions than public 2-year and 4-year institutions for remedial reading courses (51 percent vs. 87 and 78 percent, respectively). There were also differences by institutional type in the proportion of institutions that most frequently offered elective degree credit in fall 2000; for each subject area, this type of credit was more frequently awarded by private 4-year institutions than public 2-year or 4-year institutions (table 8). For example, elective degree credit for remedial mathematics was the most frequent type of credit in one-fourth of private 4-year institutions compared with 4 percent of public 2-year and 4-year institutions. Between 1995 and 2000, the proportion of institutions overall that most frequently offered elective degree credit for remedial reading declined from 15 to 10 percent (table 8). Changes were also observed in the proportion of public 2-year and 4-year institutions that most frequently offered elective degree credit and institutional degree credit. Between 1995 and 2000, the proportion of public 2-year colleges that most

25
frequently gave elective degree credit for remedial reading courses declined from 8 to 4 percent, while the proportion that most frequently gave institutional credit for remedial mathematics increased from 80 to 87 percent. For public 4-year institutions, there was a decrease in the proportion that most frequently offered elective degree credit for reading (from 16 percent in 1995 to 8 percent in 2000), but an increase in the proportion that most frequently offered institutional credit for remedial writing (from 70 to 82 percent) and remedial mathematics (from 75 to 83 percent) during the same time period.
Limitations on Length of Time in Remedial Courses In fall 1995 and 2000, institutions indicated whether there was a limit on the length of time students may spend on remedial courses. Institutions that had time limits on remediation also indicated whether those limits were set by state policy or law, institutional policy, or some other mechanism.
Table 8. Among degree-granting institutions that offered remedial courses in the given subjects,
percentage distribution indicating the most frequent type of credit earned for remedial courses, by subject area and institutional type: Fall 1995 and 2000
Reading Writing Mathematics
Year and institutional type
Degree credit,
subject
Degree credit,
elective
Institu-tional credit
No credit
Degree credit,
subject
Degree credit,
elective
Institu-tional credit
No credit
Degree credit,
subject
Degree credit,
elective
Institu-tional credit
No credit
2000 All institutions 2 10 78 9 4 14 73 9 4 10 77 10 Public 2-year........ 2 4 87 7 2 5 86 7 2 4 87 7 Private 2-year....... ‡ ‡ ‡ ‡ ‡ ‡ 81 9 9! ‡ 81 8 Public 4-year........ 2 8 78 12 3 7 82 8 2 4 83 11 Private 4-year....... 3 30 51 17 5! 37 45 14 6 25 54 15 1995 All institutions 3 15 72 10 4 17 68 11 5 11 71 13 Public 2-year........ 1 8 81 9 2 8 81 9 2 7 80 11 Private 2-year....... ‡ ‡ ‡ ‡ ‡ ‡ ‡ ‡ ‡ 4! 65 20 Public 4-year........ ‡ 16 73 9 6 11 70 12 ‡ 9 75 13 Private 4-year....... ‡ 36 51 11 4 40 46 9 9 23 55 14
!Interpret data with caution; coefficient of variation greater than 50 percent.
‡Reporting standards not met; too few cases for a reliable estimate.
NOTE: Data reported for fall 2000 are based on Title IV degree-granting institutions that enrolled freshmen in fall 2000. Data reported for fall 1995 are based on degree-granting institutions that enrolled freshmen in fall 1995. Percents are based on institutions that offered at least one remedial course in that subject in that year. Detail may not sum to totals because of rounding and not reporting where there are too few cases for a reliable estimate.
SOURCE: U.S. Department of Education, National Center for Education Statistics, Postsecondary Education Quick Information System, “Survey on Remedial Education in Higher Education Institutions: Fall 1995,” 1995; and “Survey on Remedial Education in Higher Education Institutions: Fall 2000,” 2001.

26
About one-fourth (26 percent) of the institutions reported that there was a limit on the length of time a student may take remedial courses at their institution in fall 2000 (table 9). Public and private 4-year institutions were more likely than public 2-year colleges to report time limits on remediation (29 and 31 percent vs. 20 percent, respectively). Time limits on remediation were typically set by institutional policy (table 9). In fall 2000, 71 percent of the institutions with time limits on remediation indicated that those limits were set by
institutional policy. Fewer institutions with time limits reported that those limits were set by state policy or law (24 percent), and only 5 percent of the institutions reported some other approach to setting time limits on remediation. In fall 2000, differences by institutional type were observed in the use of various approaches to setting time limits on remediation (table 9). For example, the use of institutional policy to set time limits on remediation was more common at private 4-year institutions than at other types of institutions, and it was least common at public
Table 9. Among degree-granting institutions that offered remedial courses, percent indicating
that there is a limitation on the length of time a student may take remedial courses at the institution, and the percentage distribution indicating how the time limit on remediation is set, by institutional type: Fall 1995 and 2000
How time limit on remediation is set2
Year and institutional type
Length of remediation is limited at
institutions offering remedial courses1
State policy or law Institutional policy Other 2000 All institutions ..................... 26 24 71 5 Public 2-year.............................. 20 46 43 10 Private 2-year............................. 31 ‡ ‡ ‡ Public 4-year.............................. 29 27 70 ‡ Private 4-year............................. 31 ‡ 94 4 1995 All institutions ..................... 25 22 75 3 Public 2-year.............................. 23 54 42 4! Private 2-year............................. 24 ‡ ‡ ‡ Public 4-year.............................. 23 6 94 # Private 4-year............................. 28 # 99 ‡
#Rounds to zero.
!Interpret data with caution; coefficient of variation greater than 50 percent.
‡Reporting standards not met; too few cases for a reliable estimate. 1Percents are based on institutions that offered at least one remedial reading, writing, or mathematics course in that year.
2Of the institutions that offered remedial courses and indicated that there was a limit on the length of time a student may take remedial courses at their institution, the percentage distribution reporting how time limits were set.
NOTE: Data reported for fall 2000 are based on Title IV degree-granting institutions that enrolled freshmen in fall 2000. Data reported for fall 1995 are based on degree-granting institutions that enrolled freshmen in fall 1995. Detail may not sum to totals because of rounding and not reporting where there are too few cases for a reliable estimate.
SOURCE: U.S. Department of Education, National Center for Education Statistics, Postsecondary Education Quick Information System, “Survey on Remedial Education in Higher Education Institutions: Fall 1995,” 1995; and “Survey on Remedial Education in Higher Education Institutions: Fall 2000,” 2001.

27
2-year colleges. Among institutions with limits on remediation, such limits were set by institutional policy at 94 percent of private 4-year institutions, 70 percent of public 4-year institutions, and 43 percent of public 2-year colleges. The use of state policy or law to set limits on remediation also varied by institutional type. Among institu-tions with limits on remediation, state policy or law was more commonly used by public 2-year colleges than public 4-year institutions (46 vs. 27 percent). Between 1995 and 2000, no differences were detected in the proportion of institutions overall that reported a limitation on the length of time that students may spend on remedial courses, or in the proportion of institutions that reported various approaches for setting those time limits (table 9). However, among public 4-year institutions, the proportion that used institutional policy to set limits on remediation decreased from 94 percent in 1995 to 70 percent in 2000, while the proportion that used state policy or law increased from 6 to 27 percent.
Restrictions on Regular Academic Courses Institutions may employ a number of strategies to restrict the extent to which students can take regular academic courses while they are taking remedial courses. Some institutions do not place any restrictions on the regular academic courses students can take while they are enrolled in remedial courses, while others do not allow students to take any regular academic courses while they are taking remedial courses. Other institutions allow students enrolled in remedial courses to take selected regular courses (e.g., a student may simultaneously enroll in remedial mathematics courses and regular English courses). In fall 2000, most institutions (82 to 88 percent) placed some restrictions on the regular academic courses that students could take while they were enrolled in remedial reading, writing, or mathematics courses (table 10). Relatively fewer institutions (12 to 18 percent) reported that they did not impose any restrictions on regular academic courses for students enrolled in remedial writing, mathematics, and reading courses. One
Table 10. Among degree-granting institutions that offered remedial courses in the given subjects,
percentage distribution indicating the extent of restrictions on regular academic courses that students can take while taking remedial courses, by subject area: Fall 1995 and 2000
Year and subject area No restrictions Some restrictions Totally restricted 2000 Reading..................................................... 18 82 # Writing...................................................... 12 88 1 Mathematics ............................................. 14 86 1 1995 Reading..................................................... 33 65 2 Writing...................................................... 30 69 2 Mathematics ............................................. 35 64 2
#Rounds to zero.
NOTE: Data reported for fall 2000 are based on Title IV degree-granting institutions that enrolled freshmen in fall 2000. Data reported for fall 1995 are based on degree-granting institutions that enrolled freshmen in fall 1995. Percents are based on institutions that offered at least one remedial course in that subject in that year. Detail may not sum to totals because of rounding.
SOURCE: U.S. Department of Education, National Center for Education Statistics, Postsecondary Education Quick Information System, “Survey on Remedial Education in Higher Education Institutions: Fall 1995,” 1995; and “Survey on Remedial Education in Higher Education Institutions: Fall 2000,” 2001.

28
percent or less of the institutions did not allow students to take any regular academic courses while they were enrolled in remedial courses. Between 1995 and 2000, institutions tended to move away from having policies that place no restrictions (and move toward policies that enforce some restrictions) on the regular academic courses that students could take while they were enrolled in remedial courses (table 10). These changes were observed for remedial reading, writing, and mathematics courses. For example, in the area of remedial mathematics, the proportion of institutions that placed no restrictions on students’ participation in regular coursework declined from 35 percent in 1995 to 14 percent in 2000, while the proportion that placed some restrictions increased from 64 percent to 86 percent. Providers of Remedial Education In fall 1995 and 2000, institutions indicated whether the most frequent providers of remedial education were a separate remedial division/department, the traditional academic department, a learning center, or some other location within the institution. In fall 2000, the institution’s traditional academic department was the most frequent provider of remedial courses in each subject area; a majority of institutions reported their traditional academic department was the most frequent provider of remedial writing (70 percent), mathematics (72 percent) and reading courses (57 percent) (table 11). Fewer institutions (19 to 28 percent) indicated that a separate remedial division/ department was the most frequent provider of remedial reading, writing, and mathematics courses. Seven to 13 percent of the institutions reported learning centers as the most frequent provider of remedial reading, writing, or mathematics courses, while 1 to 2 percent of the institutions reported some other location as the most frequent provider of remediation in the three subject areas.
The proportion of institutions that reported a separate remedial division/department as the most frequent provider of remedial writing and mathematics courses differed by institutional type in fall 2000 (table 11). Public 2-year colleges were more likely than private 2-year and 4-year institutions to report a separate remedial division as the most frequent provider of remedial writing courses (29 percent vs. 7 and 10 percent, respectively). Public 2-year colleges were also more likely than public and private 4-year institutions to report a separate remedial division/ department as the most frequent provider of remedial mathematics courses (28 percent vs. 18 and 10 percent, respectively). Differences by institutional type were also observed in the use of a traditional academic department as the most frequent provider of remedial writing and mathematics courses (table 11). Compared with public 2-year colleges in fall 2000, a higher proportion of private 4-year institutions cited their traditional academic departments as the most frequent providers of remedial writing courses (76 vs. 64 percent), and a higher proportion of private 2-year and 4-year institutions cited their traditional academic departments as the most frequent providers of remedial mathematics courses (87 and 81 percent vs. 64 percent, respectively). Between 1995 and 2000, no differences were detected in the proportion of institutions overall that used a particular location (i.e., a traditional academic department, a separate remedial division, or a learning center) as the most frequent provider of remedial reading, writing, or mathematics courses (table 11). However, the proportion of public 4-year institutions indicating that a learning center was the most frequent provider of remedial reading courses increased from 6 percent to 13 percent.

29
Table 11. Among degree-granting institutions that offered remedial courses in the given subjects, percentage distribution indicating the location within the institution of the most frequent provider of remedial education, by subject area and institutional type: Fall 1995 and 2000
Reading Writing Mathematics
Year and institutional type Separate remedial division/
department
Traditional academic
depart-ment(s)
Learning center Other
Separate remedial division/
department
Traditional academic
depart-ment(s)
Learning center Other
Separate remedial division/
department
Traditional academic
depart-ment(s)
Learning center Other
2000 All institutions ........... 28 57 13 2 21 70 8 1 19 72 7 1 Public 2-year ................... 33 58 8 ‡ 29 64 7 1 28 64 7 1 Private 2-year .................. ‡ ‡ ‡ ‡ 7 81 7 6 ‡ 87 ‡ ‡ Public 4-year ................... 29 56 13 ‡ 20 70 7 3 18 73 7 3 Private 4-year .................. 21 55 22 ‡ 10 76 13 1 10 81 9 ‡ 1995 All institutions ........... 30 55 13 3 22 67 9 2 20 70 7 2 Public 2-year ................... 34 54 10 3 29 60 8 3 27 63 8 3 Private 2-year .................. ‡ ‡ ‡ ‡ ‡ ‡ ‡ ‡ 7 87 ‡ ‡ Public 4-year ................... 32 58 6 3 20 71 6 3 19 72 6 3 Private 4-year .................. 24 50 26 ‡ 17 70 12 2 16 74 9 2
‡Reporting standards not met; too few cases for a reliable estimate.
NOTE: Data reported for fall 2000 are based on Title IV degree-granting institutions that enrolled freshmen in fall 2000. Data reported for fall 1995 are based on degree-granting institutions that enrolled freshmen in fall 1995. Percents are based on institutions that offered at least one remedial course in that subject in that year. Detail may not sum to totals because of rounding and not reporting where there are too few cases for a reliable estimate.
SOURCE: U.S. Department of Education, National Center for Education Statistics, Postsecondary Education Quick Information System, “Survey on Remedial Education in Higher Education Institutions: Fall 1995,” 1995; and “Survey on Remedial Education in Higher Education Institutions: Fall 2000,” 2001.

30

31
5. USE OF ADVANCED TECHNOLOGY IN REMEDIAL INSTRUCTION
In fall 1995 and 2000, postsecondary institutions were asked whether they offered remedial courses through distance education. Institutions were instructed to include any remedial courses delivered to remote (off-campus) locations via audio, video (live or prerecorded), or computer technologies.23 In fall 2000, institutions were also asked about • technologies that are used as primary modes
of instructional delivery for remedial courses offered through distance education; and
• the use of computers as a hands-on instructional tool for on-campus remedial reading, writing, or mathematics courses.
Distance Education Institutions indicated whether they offered remedial courses through distance education in fall 1995 and 2000. To further explore the use of distance education in 2000, institutions were asked whether they used four types of technology as a primary mode to deliver remedial instruction through distance education—two-way interactive video, one-way prerecorded video, Internet courses using synchronous (i.e., simultaneous or “real time”) computer-based instruction, and Internet courses using asynchronous (i.e., not simultaneous) computer-based instruction.24 Institutions were also given the option to specify 23As with previous chapters, the data are presented by institutional
type: public 2-year, private 2-year, public 4-year, and private 4-year.
24Two-way interactive video refers to two-way video with two-way audio, and one-way prerecorded video includes prerecorded videotapes provided to students and television broadcast or cable transmission using prerecorded video. Examples of Internet courses using synchronous computer-based instruction are interactive computer conferencing or Interactive Relay Chat; examples of Internet courses using asynchronous computer-based instruction are e-mail and most World Wide Web-based courses.
other types of technologies that were used as a primary mode to deliver remedial education through distance education. Use of Distance Education In fall 2000, 13 percent of all institutions offered remedial courses through distance education (figure 9).25 Public 2-year colleges were more Figure 9. Among Title IV degree-granting
institutions that offered remedial courses, percent indicating that the institution offered remedial courses through distance education, by institutional type: Fall 2000
4
25
13
8
0 20 40 60 80 100
Private 4-year
Public 4-year
Private 2-year
Public 2-year
All institutions
Percent of institutions
#
# Rounds to zero.
NOTE: Data are for Title IV degree-granting institutions that enrolled freshmen in fall 2000. Percents are based on those institutions that offered at least one remedial reading, writing, or mathematics course in fall 2000.
SOURCE: U.S. Department of Education, National Center for Education Statistics, Postsecondary Education Quick Information System, “Survey on Remedial Education in Higher Education Institutions: Fall 2000,” 2001.
25The most recent NCES study on distance education found that 56
percent of all 2-year and 4-year Title IV-eligible, degree-granting institutions offered any type of distance education course during the 12-month 2000-2001 academic year (Waits and Lewis 2003).

32
likely than all other institutional types to offer remedial courses through distance education; 25 percent of public 2-year colleges, 8 percent of public 4-year institutions, 4 percent of private 4-year institutions, and less than 1 percent of private 2-year institutions offered remedial courses in this way. Between 1995 and 2000, there was an increase (from 3 percent to 13 percent) in the proportion of institutions overall that offered remedial courses through distance education (figures 9 and 10). Changes were also observed for public 2-year and 4-year institutions. The proportion of public 2-year colleges offering remedial courses through distance education increased from 6 percent in 1995 to 25 percent in 2000, and the proportion of public 4-year institutions offering remedial courses in that way increased from 4 percent to 8 percent during this time period. Figure 10. Among degree-granting
institutions that offered remedial courses, percent indicating that the institution offered remedial courses through distance education, by institutional type: Fall 1995
3
4
6
0 20 40 60 80 100
Public 4-year
Public 2-year
All institutions
Percent of institutions NOTE: Data are for degree-granting institutions that enrolled freshmen in fall 1995. Percents are based on those institutions that offered at least one remedial reading, writing, or mathematics course in fall 1995. Data for private 2-year and private 4-year institutions are not reported because there were too few cases for a reliable estimate.
SOURCE: U.S. Department of Education, National Center for Education Statistics, Postsecondary Education Quick Information System, “Survey on Remedial Education in Higher Education Institutions: Fall 1995,” 1995.
Technology Use in Remedial Distance Education Courses In fall 2000, the primary mode of delivery for remedial instruction through distance education was Internet courses using asynchronous (i.e., not simultaneous) computer-based instruction; 64 percent of the institutions identified this technology as a primary mode of delivery (figure 11).26 Fewer institutions (25 to 27 percent) cited Figure 11. Among Title IV degree-granting
institutions that offered remedial courses through distance education, percent indicating the types of technology used as a primary mode of instructional delivery for the remedial courses offered through distance education: Fall 2000
8
64
25
27
26
0 20 40 60 80 100Percent of institutions
Two-way interactive video
One-way prerecorded video
Internet courses using synchronous computer-
based instructionInternet courses using
asynchronous computer-based instruction
Other technologies
NOTE: Data are for Title IV degree-granting institutions that enrolled freshmen in fall 2000. Percents are based on those institutions offering remedial courses that indicated that the institution offered remedial courses through distance education in fall 2000. Two-way interactive video refers to two-way video with two-way audio, and one-way prerecorded video includes prerecorded videotapes provided to students, and television broadcast or cable transmission using prerecorded video. Examples of Internet courses using synchronous computer-based instruction are interactive computer conferencing or Interactive Relay Chat; examples of Internet courses using asynchronous computer-based instruction are e-mail and most World Wide Web-based courses.
SOURCE: U.S. Department of Education, National Center for Education Statistics, Postsecondary Education Quick Information System, “Survey on Remedial Education in Higher Education Institutions: Fall 2000,” 2001.
26Institutions could report more than one type of technology as a
primary mode of delivery for remedial instruction through distance education.

33
the use of two-way interactive video, one-way prerecorded video, or Internet courses using synchronous computer-based instruction as a primary mode of delivery. Eight percent of the institutions identified some other technology as a primary mode of delivery of remedial courses offered through distance education. Use of Computers for Instruction In fall 2000, about one-third (31 to 35 percent) of the institutions reported that computers were used frequently by students as a hands-on instructional tool for on-campus remedial reading, writing, or mathematics courses (table 12).27 Computers were used occasionally by 40 to 41 percent of
27Institutions were instructed to exclude remedial courses offered
through distance education.
institutions for instruction in remedial reading, writing, or mathematics courses. The proportion of institutions indicating that they never or very rarely used this technology for remedial instruction in the various subject areas ranged from 24 to 29 percent. Public 2-year colleges were more likely than public or private 4-year institutions to report that they frequently used computers as a hands-on instructional tool for on-campus remedial reading, writing, and mathematics courses in fall 2000 (table 12). For example, frequent use of this technology for remedial reading instruction was reported more often by public 2-year colleges (42 percent) than public or private 4-year institutions (27 and 23 percent, respectively).
Table 12. Among Title IV degree-granting institutions that offered remedial courses in the given subjects, percentage distribution indicating how frequently computers are used by students as a hands-on instructional tool for on-campus remedial courses, by subject area and institutional type: Fall 2000
Reading Writing Mathematics
Institutional type Never or very
rarely
Occa-
sionally Fre-
quently
Never or very
rarely
Occa-
sionally Fre-
quently
Never or very
rarely
Occa-
sionally Fre-
quently
All institutions .... 26 40 34 24 41 35 29 40 31 Public 2-year............. 16 41 42 10 44 46 17 44 40 Private 2-year............ ‡ ‡ ‡ 33 46 21 39 33 28 Public 4-year............. 28 45 27 33 40 26 34 41 25 Private 4-year............ 44 33 23 39 36 25 43 33 23
‡Reporting standards not met; too few cases for a reliable estimate.
NOTE: Data are for Title IV degree-granting institutions that enrolled freshmen in fall 2000. Percents are based on institutions that offered at least one remedial course in that subject in fall 2000. Detail may not sum to totals because of rounding.
SOURCE: U.S. Department of Education, National Center for Education Statistics, Postsecondary Education Quick Information System, “Survey on Remedial Education in Higher Education Institutions: Fall 2000,” 2001.

34

35
6. SUMMARY AND CONCLUSIONS
Postsecondary remedial education has been the subject of an ongoing debate among educators, policymakers, and the public. Central to this debate are issues regarding the extent to which entering students are underprepared for college-level work, the financial and human resource costs of remedial education to institutions, the negative impact that remedial education may have on the quality of regular course offerings, and, in general, the role of remediation in the curricula of 2-year and 4-year institutions (Hoyt and Sorenson 2001; Ignash 1997; Kozeracki 2002; Levin 2001; McCabe 2000; Roueche and Roueche 1999; Shults 2000). This study, conducted by NCES in the fall of 2000, investigated the prevalence and characteristics of remedial education at degree-granting 2-year and 4-year institutions that enroll freshmen, and changes from 1995. Specifically, the data presented in this report address four broad questions: • How prevalent is postsecondary remedial
education?
• How is remedial education organized and delivered?
• How do institutional types (public 2-year, private 2-year, public 4-year, and private 4-year) differ in the provision, organization, and delivery of remedial education?
• What changes have occurred in remedial education from 1995?
How Prevalent is Postsecondary Remedial Education? The survey findings provide information on the prevalence of remedial education in reading, writing, and mathematics based on four indicators:
the proportion of institutions that offer remedial courses, the proportion of entering freshmen who enroll in remedial courses, the average number of remedial courses offered, and the average time that students spend in remediation. In fall 2000, about three-fourths (76 percent) of the institutions that enrolled freshmen offered at least one remedial reading, writing, or mathematics course, and 28 percent of entering freshmen enrolled in at least one of those courses. The data further show that, on average, institutions offered 2.0 to 2.5 different remedial reading, writing, or mathematics courses in fall 2000. In addition, the majority of institutions reported that students spent an average of 1 year or less in remediation; in fall 2000, 60 percent of the institutions indicated that the average time a student spent in remediation was less than 1 year, 35 percent indicated that the average time was 1 year, and 5 percent reported an average time of more than 1 year.28 How is Remedial Education Organized and Delivered? Institutional strategies for organizing and delivering remedial programs include the ways in which remedial needs are determined and served (Perin 2002). The survey data addressed remedial policies and practices regarding the assessment of remedial needs, student enrollment in remedial courses, and the organization of remedial courses. The 2000 survey findings indicate that while the most common strategy to assess students was to give all entering students placement tests (57 to 61 percent of the institutions used this approach), some institutions used more selective assessment 28As indicated earlier in the report, students may also choose to limit
the time they spend in remediation in order to qualify for federal student aid. Based on federal policy, students may not be considered eligible for federal financial aid if they are enrolled solely in remedial programs or if remedial coursework exceeds one academic year (Higher Education Act of 1965, as amended).

36
procedures. For example, 25 to 29 percent of the institutions gave placement tests to entering students who met various criteria (e.g., low SAT/ACT scores or low grade point averages). Strategies for serving students’ remedial needs reflect the extent to which remedial education is mainstreamed (i.e., embedded in traditional academic departments) and integrated into college-level curricula. The survey findings indicate that although remedial education is typically embedded in the institutions’ traditional academic departments, the general tendency is for institutions to organize and deliver remedial courses as separate from their regular college curricula. In fall 2000, a majority of institutions indicated that the traditional academic department was the most frequent provider of remedial writing (70 percent), mathematics (72 percent) and reading courses (57 percent). However, the data suggest that institutions typically do not integrate remedial education into their regular college curricula. For example, in fall 2000, most institutions (73 to 78 percent) cited institutional credit (as opposed to degree credit) as the most frequent type of award for remedial reading, writing, or mathematics courses, and most institutions (82 to 88 percent) placed some restrictions on the regular courses that students could take while they were enrolled in remedial courses. The surveys explored other enrollment policies that may restrict freshman participation in remedial education. The findings suggest that while institutions generally make it mandatory for students who need remedial education to enroll in such courses, most do not impose limits on the length of time that a student can spend in remediation.29 In fall 2000, 75 to 82 percent of the institutions reported mandatory policies for students who needed remedial reading, writing, or mathematics education to enroll in such courses.
29Students may also choose to limit the time they spend in
remediation in order to qualify for federal student aid. Based on federal policy, students may not be considered eligible for federal financial aid if they are enrolled solely in remedial programs or if remedial coursework exceeds one academic year (Higher Education Act of 1965, as amended).
However, about one-fourth (26 percent) reported that there was a limit on the length of time a student may take remedial courses at their institution. Institutional strategies for delivering remedial education courses examined in this report include the use of advanced technology in the delivery of remedial courses through distance education and on-campus instruction. In fall 2000, 13 percent of the institutions offered remedial courses through distance education, and about one-third (31 to 35 percent) of the institutions reported that computers were used frequently by students as a hands-on instructional tool for on-campus remedial reading, writing, or mathematics courses. How Do Institutions Differ in the Provision, Organization, and Delivery of Remedial Education? The survey findings indicate that public 2-year colleges were more likely than other types of institutions to provide remedial education. In fall 2000, almost all public 2-year colleges (98 percent) offered at least one remedial reading, writing, or mathematics course, compared to 59 to 80 percent of other types of institutions. Public 2-year colleges enrolled a higher proportion of entering freshmen in remedial courses (42 percent) than did other types of institutions (12 to 24 percent). In addition, public 2-year colleges offered more remedial courses, on average, and they reported longer time periods that students spend in remediation. The relatively short time that students spend in remediation at public and private 4-year institutions may be associated with the survey finding that these institutions were more likely than public 2-year institutions to impose limits on the time that students are permitted to spend in remediation. Public 4-year institutions are also significant providers of remedial education. In fall 2000, public 4-year institutions were more likely than private 4-year institutions to offer one or more remedial reading, writing, or mathematics courses (80 vs. 59 percent), and they enrolled a higher

37
proportion of entering freshmen in such courses (20 vs. 12 percent). Public 4-year institutions also offered more remedial reading, writing, and mathematics courses, on average, than did private 4-year institutions. Public 2-year colleges differed from other institutional types in the delivery of remedial education courses. In fall 2000, for example, public 2-year colleges were more likely than other types of institutions to deliver remedial education through a separate entity from the traditional academic department, although those differences did not show clear patterns across subject areas. Specifically, public 2-year colleges were more likely than private 2-year and 4-year institutions to cite a separate remedial division as the most frequent provider of remedial writing (29 percent vs. 7 and 10 percent, respectively), and they were more likely than public and private 4-year institutions to report a separate remedial division as the most frequent provider of remedial mathematics (28 percent vs. 18 and 10 percent, respectively). In addition, compared to public and private 4-year institutions, public 2-year colleges were more likely to offer remedial courses through distance education (25 percent vs. 8 and 4 percent, respectively), and they were more likely to report that computers were frequently used as a hands-on instructional tool for on-campus remedial reading, writing, and mathematics courses. Private 4-year institutions differed from some other types of institutions in the extent to which remedial education was integrated into the college-level curricula, although those findings tend to show mixed patterns. For example, private 4-year institutions were more likely than public 2-year institutions to require underprepared students to enroll in remedial writing and mathematics courses, and they were more likely than public 2-year and 4-year institutions to offer elective degree credit for remedial reading, writing, or mathematics courses. In addition, private institutions tend to have their remedial
programs embedded in the traditional academic department. Compared with public 2-year colleges in fall 2000, a higher proportion of private 4-year institutions cited the traditional academic department as the most frequent provider of remedial writing courses (76 vs. 64 percent), and a higher proportion of private 2-year and 4-year institutions cited their traditional academic department as the most frequent provider of remedial mathematics courses (87 and 81 percent vs. 64 percent, respectively). What Changes Have Occurred in Remedial Education From 1995? Data from the 1995 and 2000 surveys indicate that no differences were detected in the proportion of institutions overall that offered at least one remedial reading, writing, or mathematics course, or in the proportion of entering freshmen who enrolled in at least one of those courses during that time period. However, during this time period, there were declines in the proportion of institutions that offered remedial writing courses (from 71 to 68 percent), and in the proportion of entering freshmen who enrolled in those courses (from 16 to 14 percent). Institutions were more likely to report mandatory enrollment policies for students in need of remedial mathematics education in 2000 than in 1995 (81 vs. 75 percent). Between 1995 and 2000, institutions shifted also toward less integrative strategies for organizing remedial education by imposing more restrictive policies for remedial education. For example, for each subject area, there was an increase in the proportion of institutions that had some restrictions on the regular courses that students could take while they were enrolled in remedial courses.

38

39
REFERENCES
Berger, D. (1997). Mandatory Assessment and Placement: The View from an English Department. In J. Ignash (Ed.), New Directions for Community Colleges, No. 100, (pp. 33–41). San Francisco: Jossey Bass.
Boylan, H., Bliss, L., and Bonham, B. (1997). Program Components and their Relationship to Student Performance. Journal of Developmental Education, 20(3): 2–9.
Boylan, H. (2002). What Works: Research-Based Best Practices in Developmental Education. Boone, NC: Continuous Quality Improvement Network, National Center for Developmental Education.
Brenneman, D., and Haarlow, W. (1998). Remedial Education: Costs and Consequences. Washington, DC: Thomas B. Fordham Foundation.
Brick, M., Morganstein, D., and Wolters, C. (1987). Additional Uses for Keyfitz Selection. Proceedings on the Section on Survey Research Methods of the American Statistical Association, pp. 787–791.
Crowe, E. (1998). Statewide Remedial Education Policies. Denver, CO: State Higher Education Officers.
Hebel, S. (2003a, January 3). New York Regents Approve CUNY’s Remediation Plan After 3 Years of Monitoring. The Chronicle of Higher Education, 49(17): A30.
Hebel, S. (2003b, February 28). Remedial Rolls Fall at Cal State. The Chronicle of Higher Education, 49(25): A27.
Hoyt, J., and Sorenson, C. (2001). High School Preparation, Placement Testing, and College Remediation. Journal of Developmental Education, 25(2): 26–33.
Ignash, J. (1997). Who Should Provide Postsecondary Remedial/Developmental Education? In J. Ignash (Ed.), New Directions for Community College, No. 100, (pp. 5–20). San Francisco: Jossey Bass.
Kish, L. (1965). Survey Sampling. New York: J. Wiley & Sons. Kozeracki, C. (2002). Issues in Developmental Education. Community College Review, 29(4): 83–100.
Lewis, L., and Farris, E. (1996). Remedial Education in Higher Education Institutions in Fall 1995 (NCES 97-584). U.S. Department of Education. Washington, DC: National Center for Education Statistics.
Levin, J. (2001). Globalizing the Community College: Strategies for Change in the 21st Century. New York: Palgrave.
Mansfield, W., and Farris, E. (1991). College-Level Remedial Education in the Fall of 1989 (NCES 91-191). U.S. Department of Education. Washington, DC: National Center for Education Statistics.
McCabe, R. (2000). No One to Waste. Denver, CO: Community College Press.

40
Merisotis, J., and Phipps, R. (2000). Remedial Education in Colleges and Universities: What’s Really Going On? The Review of Higher Education, 24(1): 67–85.
Perin, D. (2002). The Location of Developmental Education in Community Colleges: A Discussion of the Merits of Mainstreaming vs. Centralization. Community College Review, 30(1): 27–44.
Phelan, D. (2000). Enrollment Policies and Student Access at Community Colleges. Policy Paper. Denver, CO: Education Commission of the States.
Roueche, J., and Roueche, S. (1999). High Stakes, High Performance: Making Remedial Education Work. Washington, DC: Community College Press.
Russell, A. (1997). Statewide College Admissions, Student Preparation and Remediation: Policies and Programs. Denver, CO: State Higher Education Executive Officers.
Saxon, D., and Boylan, H. (2001). The Cost of Remedial Education in Higher Education. Journal of Developmental Education, 25(2): 2–8.
Shults, C. (2000). Institutional Policies and Practices in Remedial Education: A National Study of Community Colleges (ED447884). Washington, DC: American Association of Community Colleges.
Snyder, T. (2001). Digest of Education Statistics, 2000 (NCES 2001–034). U.S. Department of Education, National Center for Education Statistics. Washington, DC: U.S. Government Printing Office.
Spann, M. (2000). Remediation: A Must for the 21st Century. Policy Paper. Denver, CO: Education Commission of the States.
Waits, T., and Lewis, L. (2003). Distance Education at Degree-Granting Postsecondary Institutions: 2000–2001 (NCES 2003-017). U.S. Department of Education. Washington, DC: National Center for Education Statistics.

A-1
APPENDIX A
METHODOLOGY

A-2

A-3
Table of Contents
Section Page
Postsecondary Education Quick Information System........................................................... A-5 Sample and Response Rates.................................................................................................. A-6 Comparing the 1995 and 2000 PEQIS Studies: Technical Notes ........................................ A-6 Definition of Institutional Type ............................................................................................ A-7 Sampling and Nonsampling Errors ....................................................................................... A-7 Variances............................................................................................................................... A-9 Background Information ....................................................................................................... A-9
List of Appendix Tables
Appendix Table
A-1 Number and percent of Title IV degree-granting institutions in the study that enrolled freshmen, and the estimated number and percent in the nation, by institutional type: Fall 2000 ................................................................................. A-8
A-2 Number and percent of degree-granting institutions in the study that enrolled
freshmen, and the estimated number and percent in the nation, by institutional type: Fall 1995 .......................................................................................................... A-8

A-4

A-5
METHODOLOGY
Postsecondary Education Quick Information System The Postsecondary Education Quick Information System (PEQIS) was established in 1991 by the National Center for Education Statistics (NCES), U.S. Department of Education. PEQIS is designed to conduct brief surveys of postsecondary institutions or state higher education agencies on postsecondary education topics of national importance. Surveys are generally limited to three pages of questions, with a response burden of about 30 minutes per respondent. Most PEQIS institutional surveys use a previously recruited, nationally representative panel of institutions. The PEQIS panel was originally selected and recruited in 1991–92. In 1996, the PEQIS panel was reselected to reflect changes in the postsecondary education universe that had occurred since the original panel was selected. A modified Keyfitz approach (Brick, Morganstein, and Wolters 1987) was used to maximize overlap between the 1996 panel and the 1991–92 panel. The sampling frame for the PEQIS panel recruited in 1996 was constructed from the 1995–96 Integrated Postsecondary Education Data System (IPEDS) Institutional Characteristics file. Institutions eligible for the 1996 PEQIS sampling frame included 2-year and 4-year (including graduate-level) institutions (both institutions of higher education30 and other postsecondary institutions), and less-than-2-year institutions of higher education located in the 50 states and the District of Columbia: a total of 5,353 institutions. The 1996 PEQIS sampling frame was stratified by instructional level (4-year, 2-year, less-than-2-year), control (public, private nonprofit, private for-profit), highest level of offering (doctor’s/first professional, master’s, bachelor’s, less than 30At the time the 1991–92 and 1996 PEQIS panels were selected,
NCES was defining higher education institutions as institutions accredited at the college level by an agency recognized by the Secretary, U.S. Department of Education.
bachelor’s), total enrollment, and status as either an institution of higher education or other postsecondary institution. Within each of the strata, institutions were sorted by region (Northeast, Southeast, Central, West), whether the institution had a relatively high minority enrollment, and whether the institution had research expenditures exceeding $1 million. The sample of 1,669 institutions for the 1996 PEQIS panel was allocated to the strata in proportion to the aggregate square root of total enrollment. Institutions within a stratum were sampled with equal probabilities of selection. The modified Keyfitz approach resulted in 80 percent of the institutions in the 1996 panel overlapping with the 1991–92 panel. Panel recruitment was conducted with the 338 institutions that were not part of the overlap sample. During panel recruitment, 20 institutions were found to be ineligible for PEQIS, primarily because they were either closed or offered only correspondence courses. The final unweighted response rate at the end of PEQIS panel recruitment with the institutions that were not part of the overlap sample was 98 percent (312 of the 318 eligible institutions). There were a total of 1,634 eligible institutions in the entire 1996 panel, because 15 institutions in the overlap sample were determined to be ineligible for various reasons. The final participation rate across the institutions that were selected for the 1996 panel was over 99 percent (1,628 participating institutions out of 1,634 eligible institutions). Each institution in the PEQIS panel was asked to identify a campus representative to serve as survey coordinator. The campus representative facilitates data collection by identifying the appropriate respondent for each survey and forwarding the questionnaire to that person.

A-6
Sample and Response Rates The sample for the PEQIS 2000 remedial education survey consisted of all of the 2-year and 4-year higher education institutions in the 1996 PEQIS panel that enrolled freshmen. At the time the PEQIS panels were selected, NCES was defining higher education institutions as institutions accredited at the college level by an agency recognized by the Secretary, U.S. Department of Education (ED). However, ED no longer makes a distinction between higher education institutions and other postsecondary institutions that are eligible to participate in federal Title IV financial aid programs. Thus, NCES no longer categorizes institutions as higher education institutions. Following data collection on the PEQIS 2000 remedial education survey, a poststratification weighting adjustment was conducted. As part of this adjustment, the definition of eligible institutions was changed because of the way NCES now categorizes postsecondary institutions. An institution is now eligible for PEQIS (and for this PEQIS remedial education survey) if it is eligible to award federal Title IV financial aid, and grants degrees at the associate’s level or higher. Institutions that are both Title IV-eligible and degree-granting are approximately equivalent to higher education institutions as previously defined. The 1,242 eligible institutions in the survey represent the universe of approximately 3,230 Title IV-eligible, degree-granting institutions that enrolled freshmen in the 50 states and the District of Columbia.31 In early June 2001, questionnaires (see appendix C) were mailed to the PEQIS coordinators at the institutions. Coordinators were told that the survey was designed to be completed by the person at the institution most knowledgeable about the institution’s remedial education courses. Telephone follow up of nonrespondents was initiated in late June 2001; data collection and clarification were completed in early September 2001. The unweighted survey response rate was 31Institutions were stratified by instructional level (4-year, 2-year),
control (public, private nonprofit, private for-profit), highest level of offering (doctor’s/first-professional, master’s, bachelor’s, less than bachelor’s), and total enrollment.
95 percent (1,186 responding institutions divided by the 1,242 eligible institutions in the sample); the weighted survey response rate was 96 percent. Taking into account both nonresponse in the PEQIS panel and survey nonresponse among eligible institutions, the unweighted overall response rate was 95 percent (99.6 percent panel recruitment participation rate multiplied by the 95.49 percent survey response rate). The weighted overall response rate was also 95 percent (99.7 percent weighted panel recruitment participation rate multiplied by the 95.52 percent weighted survey response rate). Weighted item nonresponse rates ranged from 0 to 1 percent, except for question 5i (percent of entering freshmen enrolled in remedial courses in reading, writing, and mathematics), which had a weighted item nonresponse of 3 percent for each of the subject areas. Imputation for item nonresponse was not implemented. Comparing the 1995 and 2000 PEQIS Studies: Technical Notes There are a number of factors that must be considered when comparing the 1995 and 2000 PEQIS studies. This section describes the sample for the 1995 PEQIS study and how it differs from the sample for the 2000 study, and describes the approach used for comparing findings from the two studies. The sample for the 1995 study consisted of two-thirds of the 2-year and 4-year higher education institutions in the PEQIS panel selected in 1991–92, which was based on the 1990–91 IPEDS Institutional Characteristics file. Of this sample of 847 institutions, 797 institutions responded, for an unweighted response rate of 94 percent, and a weighted response rate of 96 percent. Of the responding institutions, 750 enrolled freshmen. These institutions represented the universe of approximately 3,060 higher education institutions at the 2-year and 4-year level in the 50 states, the District of Columbia, and Puerto Rico that enrolled freshmen.

A-7
The sample for the 2000 study, described in the Sample and Response Rates section above, consisted of all of the 2-year and 4-year higher education institutions in the PEQIS panel selected in 1996, which was based on the 1995–96 IPEDS Institutional Characteristics file. The 1996 PEQIS panel was selected in a way that maximized the overlap between the 1991–92 and 1996 panels. However, institutions in Puerto Rico were not included in the 1996 PEQIS panel, as they had been in the 1991–92 PEQIS panel. At the time the 1996 PEQIS panel was selected, NCES was still defining higher education institutions in the same way as it was when the 1991–92 PEQIS panel was selected. However, as part of the poststratification weighting adjustment conducted after data collection on the 2000 study, the definition of eligible institutions was changed because of the way NCES now categorizes postsecondary institutions. An institution is now eligible for PEQIS (and for this PEQIS remedial education survey) if it is eligible to award federal Title IV financial aid, and grants degrees at the associate’s level or higher. In order to make comparisons between the two studies, the data from the 1995 study were re-analyzed with the definition of eligible institutions changed to match the definition for the 2000 study as closely as possible. Information about eligibility to award federal Title IV financial aid was not available for the institutions in the 1995 study. According to NCES, the designation as a higher education institution was the best approximation to Title IV eligibility available for these institutions. Institutions were identified as degree-granting based on level of offering as reported to IPEDS. As a result of the changes in the definition of eligible institutions, there were a total of 14 institutions excluded from the data file for the 1995 study—10 institutions in Puerto Rico, and 4 that were not degree-granting. The analyses for the 1995 study that are presented in this report are based on 736 institutions, representing approximately 2,990 degree-granting higher education institutions in the 50 states and the District of Columbia. In addition, the replicate
weights32 for the studies were redefined for variance calculations to reflect the overlap in the 1995 and 2000 samples. Definition of Institutional Type Institutional type (public 2-year, private 2-year, public 4-year, private 4-year) was used for analyzing the survey data. Type was created from a combination of level (2-year, 4-year) and control (public, private). Two-year institutions are defined as institutions at which the highest level of offering is at least 2 but less than 4 years (below the baccalaureate degree); 4-year institutions are those at which the highest level of offering is 4 or more years (baccalaureate or higher degree).33 Private comprises private nonprofit and private for-profit institutions; these private institutions are reported together because there are too few private for-profit institutions in the sample for this survey to report them as a separate category. Sampling and Nonsampling Errors The survey data were weighted to produce national estimates (see tables A-1 and A-2). The weights were designed to adjust for the variable probabilities of selection and differential nonresponse. The findings in this report are estimates based on the sample selected and, consequently, are subject to sampling variability. The survey estimates are also subject to nonsampling errors that can arise because of nonobservation (nonresponse or noncoverage) errors, errors of reporting, and errors made in data collection. These errors can sometimes bias the data. Nonsampling errors may include such problems as misrecording of responses; incorrect editing, coding, and data entry; differences related to the particular time the survey was conducted; or errors in data preparation. While general sampling theory can be used in part to determine 32Replicate weights are discussed in the section below on variances.
33Definitions for level are from the data file documentation for the IPEDS Institutional Characteristics file.

A-8
Table A-1. Number and percent of Title IV degree-granting institutions in the study that enrolled freshmen, and the estimated number and percent in the nation, by institutional type: Fall 2000
Respondents National estimate1
Institutional type Number Percent Number Percent
All institutions .............. 1,186 100 3,230 100 Public 2-year....................... 387 33 1,080 33 Private 2-year...................... 52 4 270 8 Public 4-year....................... 369 31 580 18 Private 4-year...................... 378 32 1,300 40
1Data presented in all tables are weighted to produce national estimates. The sample was selected with probabilities proportionate to the square root of total enrollment. Institutions with larger enrollments have higher probabilities of inclusion and lower weights. The weighted numbers of institutions have been rounded to the nearest 10.
NOTE: Data are for Title IV degree-granting institutions that enrolled freshmen in fall 2000. Detail may not sum to totals because of rounding.
SOURCE: U.S. Department of Education, National Center for Education Statistics, Postsecondary Education Quick Information System, “Survey on Remedial Education in Higher Education Institutions: Fall 2000,” 2001.
Table A-2. Number and percent of degree-granting institutions in the study that enrolled
freshmen, and the estimated number and percent in the nation, by institutional type: Fall 1995
Respondents National estimate1
Institutional type Number Percent Number Percent
All institutions .............. 736 100 2,990 100 Public 2-year....................... 246 33 940 32 Private 2-year...................... 46 6 330 11 Public 4-year....................... 220 30 540 18 Private 4-year...................... 224 30 1,180 39
1Data presented in all tables are weighted to produce national estimates. The sample was selected with probabilities proportionate to the square root of full-time-equivalent enrollment. Institutions with larger enrollments have higher probabilities of inclusion and lower weights. The weighted numbers of institutions have been rounded to the nearest 10.
NOTE: Data are for degree-granting institutions that enrolled freshmen in fall 1995. Detail may not sum to totals because of rounding.
SOURCE: U.S. Department of Education, National Center for Education Statistics, Postsecondary Education Quick Information System, “Survey on Remedial Education in Higher Education Institutions: Fall 1995,” 1995.
how to estimate the sampling variability of a statistic, nonsampling errors are not easy to measure and, for measurement purposes, usually require that an experiment be conducted as part of the data collection procedures or that data external to the study be used. To minimize the potential for nonsampling errors, the questionnaire was pretested with respondents at institutions like those that completed the survey. During the design of the survey and the survey
pretest, an effort was made to check for consistency of interpretation of questions and to eliminate ambiguous items. The questionnaire and instructions were extensively reviewed by NCES. Manual and machine editing of the questionnaire responses were conducted to check the data for accuracy and consistency. Cases with missing or inconsistent items were recontacted by telephone. Data were keyed with 100 percent verification.

A-9
Variances The standard error is a measure of the variability of an estimate due to sampling. It indicates the variability of a sample estimate that would be obtained from all possible samples of a given design and size. Standard errors are used as a measure of the precision expected from a particular sample. If all possible samples were surveyed under similar conditions, intervals of 1.96 standard errors below to 1.96 standard errors above a particular statistic would include the true population parameter being estimated in about 95 percent of the samples. This is a 95 percent confidence interval. For example, the estimated percentage of institutions reporting that they offered any remedial education courses in reading, writing, or mathematics in fall 2000 is 76.3 percent, and the estimated standard error is 1.5 percent. The 95 percent confidence interval for the statistic extends from [76.3 - (1.5 times 1.96)] to [76.3 + (1.5 times 1.96)], or from 73.4 to 79.2 percent. Tables of standard errors for each table and figure in the report are provided in appendix B. The coefficient of variation (cv) is defined as the ratio of the standard error of an estimate to the estimate itself (Kish 1965). When multiplied by 100, the cv expresses the standard error as a percentage of the quantity being estimated. Thus, the cv can be viewed as relative standard error. For example, if an estimate of 25,000 has standard error of 3,300, the corresponding cv is 13.2 percent. In this report, estimates with a cv of 50 percent or greater were flagged to be interpreted with caution. Estimates of standard errors were computed using a technique known as jackknife replication. As with any replication method, jackknife replication involves constructing a number of subsamples (replicates) from the full sample and computing the statistic of interest for each replicate. The mean square error of the replicate estimates around the full sample estimate provides an estimate of the variances of the statistics. To
construct the replications, 50 stratified subsamples of the full sample were created and then dropped one at a time to define 50 jackknife replicates. A computer program (WesVar) was used to calculate the estimates of standard errors. WesVar is a stand-alone Windows application that computes sampling errors for a wide variety of statistics (totals, percents, ratios, log-odds ratios, general functions of estimates in tables, linear regression parameters, and logistic regression parameters). The test statistics used in the analysis were calculated using the jackknife variances and thus appropriately reflect the complex nature of the sample design. In addition, Bonferroni adjustments were made to control for multiple comparisons where appropriate. Bonferroni adjustments correct for the fact that a number of comparisons (g) are being made simultaneously. The adjustment is made by dividing the 0.05 significance level by g comparisons, effectively increasing the critical value necessary for a difference to be statistically significant. This means that comparisons that would have been significant with an unadjusted critical t value of 1.96 may not be significant with the Bonferroni-adjusted critical t value. For example, the Bonferroni-adjusted critical t value for comparisons between any two of the four categories of institutional type is 2.64, rather than 1.96. This means that there must be a larger difference between the estimates being compared for there to be a statistically significant difference when the Bonferroni adjustment is applied than when it is not used. Background Information The survey was requested by the National Center for Education Statistics of the U.S. Department of Education and performed under contract with Westat. Bernie Greene was the NCES Project Officer. Westat’s Project Director was Elizabeth Farris, and the Survey Managers were Laurie Lewis and Basmat Parsad.
A-10
This report was reviewed by the following individuals:
Outside NCES
• Hunter Boylan, Professor and Director, National Center for Developmental Education, Appalachian State University
• Stephanie Cronen, American Institutes for Research, Education Statistics Services Institute
• Lawrence Lanahan, American Institutes for Research, Education Statistics Services Institute
• Robert McCabe, President Emeritus, Miami Dade Community College
• Jon Oberg, Policy and Program Studies Service
• Leslie Scott, American Institutes for Research, Education Statistics Services Institute
Inside NCES
• Nancy Borkow, Postsecondary Education Studies Division
• Lisa Hudson, Early Childhood, International, and Crosscutting Studies Division
• Tracy Hunt-White, Postsecondary Education Studies Division
• William Hussar, Early Childhood, International, and Crosscutting Studies Division
• Val Plisko, Early Childhood, International, and Crosscutting Studies Division
• John Ralph, Early Childhood, International, and Crosscutting Studies Division
• Marilyn Seastrom, Chief Statistician, Statistical Standards Program, Office of the Deputy Commissioner
• Bruce Taylor, Statistical Standards Program, Office of the Deputy Commissioner
• John Wirt, Early Childhood, International, and Crosscutting Studies Division
For more information about the Postsecondary Education Quick Information System or the Survey on Remedial Education at Higher Education Institutions, contact Bernie Greene, Early Childhood, International, and Crosscutting Studies Division, National Center for Education Statistics, U.S. Department of Education, 1990 K Street NW, Washington, DC 20006, e-mail: [email protected], telephone (202) 502-7348.
B-1
APPENDIX B
STANDARD ERROR TABLES

B-2

B-3
Table of Contents
Tables of Standard Errors Table Page
B-1 Standard errors for table 1: Number of degree-granting institutions that enrolled
freshmen, and the percent of those institutions that offered remedial reading, writing, or mathematics courses, by institutional type: Fall 1995 and 2000 ............ B-5
B-2 Standard errors for table 2: Mean number of different remedial courses offered
by degree-granting institutions that enrolled freshmen, by subject area and institutional type: Fall 1995 and 2000 ...................................................................... B-6
B-3 Standard errors for table 3: Percent of degree-granting institutions that provided
remedial education services/courses to local business and industry, and the subject area and location of those services/courses: Fall 1995 and 2000................. B-7
B-4 Standard errors for table 4: Number of entering freshmen at degree-granting
institutions, and the percent of entering freshmen that enrolled in remedial courses, by subject area and institutional type: Fall 1995 and 2000 ........................ B-8
B-5 Standard errors for table 5: Among degree-granting institutions that offered
remedial courses, percentage distribution indicating the approximate average length of time a student takes remedial courses at the institution, by institutional type: Fall 1995 and 2000........................................................................................... B-9
B-6 Standard errors for table 6: Among degree-granting institutions that offered
remedial courses in the given subjects, percentage distribution indicating the usual selection approach for remedial courses, by subject area and institutional type: Fall 1995 and 2000............................................................................................ B-10
B-7 Standard errors for table 7: Among degree-granting institutions that offered
remedial courses in the given subjects, percentage distribution indicating the most frequent requirement status for remedial courses, by subject area and institutional type: Fall 1995 and 2000 ...................................................................... B-11
B-8 Standard errors for table 8: Among degree-granting institutions that offered
remedial courses in the given subjects, percentage distribution indicating the most frequent type of credit earned for remedial courses, by subject area and institutional type: Fall 1995 and 2000 ....................................................................... B-12

B-4
Table of Contents—Continued
Tables of Standard Errors—Continued Table Page
B-9 Standard errors for table 9: Among degree-granting institutions that offered
remedial courses, percent indicating that there is a limitation on the length of time a student may take remedial courses at the institution, and the percentage distribution indicating how the time limit on remediation is set, by institutional type: Fall 1995 and 2000........................................................................................... B-13
B-10 Standard errors for table 10: Among degree-granting institutions that offered
remedial courses in the given subjects, percentage distribution indicating the extent of restrictions on regular academic courses that students can take while taking remedial courses, by subject area: Fall 1995 and 2000 ................................. B-14
B-11 Standard errors for table 11: Among degree-granting institutions that offered
remedial courses in the given subjects, percentage distribution indicating the location within the institution of the most frequent provider of remedial education, by subject area and institutional type: Fall 1995 and 2000..................... B-15
B-12 Standard errors for table 12: Among Title IV degree-granting institutions that
offered remedial courses in the given subjects, percentage distribution indicating how frequently computers are used by students as a hands-on instructional tool for on-campus remedial courses, by subject area and institutional type: Fall 2000............................................................................................................................ B-16
B-13 Standard errors for the figures and for data not shown in tables: Fall 1995 and
2000............................................................................................................................ B-17

B-5
Table B-1. Standard errors for table 1: Number of degree-granting institutions that enrolled freshmen, and the percent of those institutions that offered remedial reading, writing, or mathematics courses, by institutional type: Fall 1995 and 2000
Percent of institutions that offered remedial courses in:
Year and institutional type
Number of degree-granting institutions with
freshmen Reading, writing,
or mathematics Reading Writing Mathematics 2000 All institutions ............... 37.1 1.5 1.4 1.6 1.5 Public 2-year........................ # 1.0 1.3 1.2 1.4 Private 2-year....................... 6.4 8.5 7.1 8.6 8.4 Public 4-year........................ 5.8 1.3 2.0 1.5 1.9 Private 4-year....................... 35.4 3.1 2.3 3.3 2.8 1995 All institutions ............... 44.8 1.7 1.6 1.7 1.6 Public 2-year........................ 19.6 † 0.7 0.5 0.6 Private 2-year....................... 30.4 6.3 5.5 6.3 6.6 Public 4-year........................ 15.0 2.6 3.1 2.8 2.7 Private 4-year....................... 43.4 4.0 2.9 4.3 3.5
#Rounds to zero.
†Not applicable; estimate of standard error is not derived because it is based on a statistic estimated at 100 percent.
SOURCE: U.S. Department of Education, National Center for Education Statistics, Postsecondary Education Quick Information System, “Survey on Remedial Education in Higher Education Institutions: Fall 1995,” 1995; and “Survey on Remedial Education in Higher Education Institutions: Fall 2000,” 2001.

B-6
Table B-2. Standard errors for table 2: Mean number of different remedial courses offered by degree-granting institutions that enrolled freshmen, by subject area and institutional type: Fall 1995 and 2000
Year and institutional type Reading Writing Mathematics 2000 All institutions .................................................. 0.05 0.06 0.05 Public 2-year........................................................... 0.07 0.11 0.08 Private 2-year.......................................................... ‡ 0.23 0.16 Public 4-year........................................................... 0.05 0.04 0.05 Private 4-year.......................................................... 0.04 0.04 0.06 1995 All institutions .................................................. 0.07 0.06 0.07 Public 2-year........................................................... 0.09 0.09 0.13 Private 2-year.......................................................... ‡ ‡ 0.09 Public 4-year........................................................... 0.07 0.06 0.08 Private 4-year.......................................................... 0.08 0.09 0.08
‡Reporting standards not met; too few cases for a reliable estimate.
SOURCE: U.S. Department of Education, National Center for Education Statistics, Postsecondary Education Quick Information System, “Survey on Remedial Education in Higher Education Institutions: Fall 1995,” 1995; and “Survey on Remedial Education in Higher Education Institutions: Fall 2000,” 2001.

B-7
Table B-3. Standard errors for table 3: Percent of degree-granting institutions that provided remedial education services/courses to local business and industry, and the subject area and location of those services/courses: Fall 1995 and 2000
Remedial offerings to local business and industry 1995 2000 Provided remedial education services/courses to local business and industry................................ 1.4 1.0 Subject area of remedial services/courses Reading ................................................................................................................................................................3.0 2.7 Writing................................................................................................................................................................2.4 2.3 Mathematics................................................................................................................................ 1.7 1.5 Other subjects ................................................................................................................................ 3.2 2.6 Location of remedial services/courses On the campus of the institution ................................................................................................ 3.7 2.0 At business/industry sites................................................................................................................................2.5 2.8 Through distance learning................................................................................................................................1.4 2.3 Other locations................................................................................................................................ 1.0 1.7
SOURCE: U.S. Department of Education, National Center for Education Statistics, Postsecondary Education Quick Information System, “Survey on Remedial Education in Higher Education Institutions: Fall 1995,” 1995; and “Survey on Remedial Education in Higher Education Institutions: Fall 2000,” 2001.

B-8
Table B-4. Standard errors for table 4: Number of entering freshmen at degree-granting institutions, and the percent of entering freshmen enrolled in remedial courses, by subject area and institutional type: Fall 1995 and 2000
Percent of entering freshmen enrolled in remedial courses in:
Year and institution type
Number of first-time freshmen
(in thousands) Reading, writing,
or mathematics Reading Writing Mathematics 2000 All institutions ............... 27.9 0.4 0.3 0.3 0.4 Public 2-year........................ 19.2 0.9 0.7 0.6 0.8 Private 2-year....................... 8.9 5.4 2.2 4.0 3.5 Public 4-year........................ 7.9 0.5 0.3 0.3 0.5 Private 4-year....................... 12.5 0.9 0.5 0.7 0.7 1995 All institutions ............... 30.8 0.8 0.6 0.6 0.8 Public 2-year........................ 24.7 1.4 1.0 1.0 1.4 Private 2-year....................... 6.5 5.7 2.7 5.6 5.1 Public 4-year........................ 15.7 1.2 0.8 0.8 1.1 Private 4-year....................... 14.8 1.2 0.9 0.9 1.0
SOURCE: U.S. Department of Education, National Center for Education Statistics, Postsecondary Education Quick Information System, “Survey on Remedial Education in Higher Education Institutions: Fall 1995,” 1995; and “Survey on Remedial Education in Higher Education Institutions: Fall 2000,” 2001.

B-9
Table B-5. Standard errors for table 5: Among degree-granting institutions that offered remedial courses, percentage distribution indicating the approximate average length of time a student takes remedial courses at the institution, by institutional type: Fall 1995 and 2000
Year and institutional type Less than 1 year 1 year More than 1 year 2000 All institutions ........................................... 1.9 1.8 0.6 Public 2-year.................................................... 2.5 2.5 1.2 Private 2-year................................................... 7.3 5.6 ‡ Public 4-year.................................................... 1.9 1.7 0.8 Private 4-year................................................... 3.0 3.0 ‡ 1995 All institutions ........................................... 1.6 1.5 1.0 Public 2-year.................................................... 3.4 3.3 2.0 Private 2-year................................................... 2.5 2.5 † Public 4-year.................................................... 3.7 3.3 1.7 Private 4-year................................................... 3.6 3.2 ‡
†Not applicable; estimate of standard error is not derived because it is based on a statistic estimated at 0 percent.
‡Reporting standards not met; too few cases for a reliable estimate.
SOURCE: U.S. Department of Education, National Center for Education Statistics, Postsecondary Education Quick Information System, “Survey on Remedial Education in Higher Education Institutions: Fall 1995,” 1995; and “Survey on Remedial Education in Higher Education Institutions: Fall 2000,” 2001.

B-10
Table B-6. Standard errors for table 6: Among degree-granting institutions that offered remedial courses in the given subjects, percentage distribution indicating the usual selection approach for remedial courses, by subject area and institutional type: Fall 1995 and 2000
Reading Writing Mathematics
Year and institutional type
All entering students
given placement
tests to determine
need
Entering students who meet various criteria given
placement tests to
determine need
Entering students who meet various
criteria are required or encouraged
to enroll
Other selection approach
All entering students
given placement
tests to determine
need
Entering students who meet various criteria given
placement tests to
determine need
Entering students who meet various
criteria are required or encouraged
to enroll
Other selection approach
All entering students
given placement
tests to determine
need
Entering students who meet various criteria given
placement tests to
determine need
Entering students who meet various
criteria are required or encouraged
to enroll
Other selection approach
2000 All institutions 2.0 1.7 1.2 0.6 1.6 1.4 1.0 0.4 1.6 1.4 1.1 0.5 Public 2-year ........ 3.1 2.6 1.2 0.5 2.9 2.5 1.2 0.4 2.9 2.4 1.3 0.5 Private 2-year ....... ‡ ‡ ‡ ‡ 7.0 7.0 ‡ † 6.4 6.5 ‡ † Public 4-year ........ 2.9 2.3 1.9 1.7 2.2 1.6 1.6 0.2 1.7 1.3 1.5 0.7 Private 4-year ....... 4.4 4.3 3.5 2.3 4.0 3.0 2.9 1.1 3.6 2.6 3.1 1.4 1995 All institutions 2.6 2.4 1.7 1.4 2.6 2.3 1.3 1.4 2.6 2.3 1.1 1.1 Public 2-year ........ 3.4 3.2 1.3 1.8 3.8 3.2 0.8 1.8 3.8 3.1 0.8 1.8 Private 2-year ....... ‡ ‡ ‡ ‡ ‡ ‡ † ‡ 6.8 6.7 † ‡ Public 4-year ........ 4.7 5.0 3.2 2.5 4.2 3.4 2.4 2.0 3.8 3.5 1.5 1.3 Private 4-year ....... 6.9 5.2 5.2 4.0 5.3 5.1 4.1 2.5 5.0 4.1 3.7 2.3
†Not applicable; estimate of standard error is not derived because it is based on a statistic estimated at 0 percent.
‡Reporting standards not met; too few cases for a reliable estimate.
SOURCE: U.S. Department of Education, National Center for Education Statistics, Postsecondary Education Quick Information System, “Survey on Remedial Education in Higher Education Institutions: Fall 1995,” 1995; and “Survey on Remedial Education in Higher Education Institutions: Fall 2000,” 2001.

B-11
Table B-7. Standard errors for table 7: Among degree-granting institutions that offered remedial courses in the given subjects, percentage distribution indicating the most frequent requirement status for remedial courses, by subject area and institutional type: Fall 1995 and 2000
Reading Writing Mathematics
Year and institutional type
Required
Recommended but not
required Required
Recommended but not
required Required
Recommended but not
required 2000 All institutions ................... 1.4 1.4 1.4 1.4 1.4 1.4 Public 2-year............................ 2.3 2.3 2.4 2.4 2.4 2.4 Private 2-year........................... ‡ ‡ 7.5 7.5 7.2 7.2 Public 4-year............................ 2.6 2.6 2.3 2.3 1.9 1.9 Private 4-year........................... 3.2 3.2 2.2 2.2 2.3 2.3 1995 All institutions ................... 2.7 2.7 2.0 2.0 2.3 2.3 Public 2-year............................ 3.6 3.6 3.2 3.2 3.4 3.4 Private 2-year........................... ‡ ‡ ‡ ‡ 11.3 11.3 Public 4-year............................ 4.4 4.4 2.6 2.6 2.6 2.6 Private 4-year........................... 4.3 4.3 3.3 3.3 2.8 2.8
‡Reporting standards not met; too few cases for a reliable estimate.
SOURCE: U.S. Department of Education, National Center for Education Statistics, Postsecondary Education Quick Information System, “Survey on Remedial Education in Higher Education Institutions: Fall 1995,” 1995; and “Survey on Remedial Education in Higher Education Institutions: Fall 2000,” 2001.

B-12
Table B-8. Standard errors for table 8. Among degree-granting institutions that offered remedial courses in the given subjects, percentage distribution indicating the most frequent type of credit earned for remedial courses, by subject area and institutional type: Fall 1995 and 2000
Reading Writing Mathematics
Year and institutional type
Degree credit,
subject
Degree credit,
elective
Institu-tional credit
No credit
Degree credit,
subject
Degree credit,
elective
Institu-tional credit
No credit
Degree credit,
subject
Degree credit,
elective
Institu-tional credit
No credit
2000 All institutions 0.5 1.3 1.9 1.3 1.0 1.4 1.9 1.1 1.0 1.2 1.7 1.0 Public 2-year........ 0.9 1.0 2.2 1.6 0.9 1.3 2.3 1.6 0.9 1.1 2.3 1.6 Private 2-year....... ‡ ‡ ‡ ‡ ‡ ‡ 6.4 3.9 5.6 ‡ 5.9 3.5 Public 4-year........ 0.6 1.7 3.3 2.4 0.7 1.3 2.4 1.7 0.5 1.0 2.1 1.6 Private 4-year....... 1.2 4.5 4.7 3.7 3.0 4.0 4.3 2.5 2.9 3.6 3.7 1.7 1995 All institutions 1.1 1.6 2.7 1.7 1.0 1.4 2.4 1.8 1.1 1.5 2.4 2.0 Public 2-year........ 0.6 1.8 2.7 2.2 0.6 1.8 2.6 2.2 0.6 1.7 2.5 2.5 Private 2-year....... ‡ ‡ ‡ ‡ ‡ ‡ ‡ ‡ ‡ 2.3 11.0 9.0 Public 4-year........ ‡ 3.4 4.5 2.8 2.9 2.7 3.8 2.6 ‡ 2.5 3.6 2.3 Private 4-year....... ‡ 4.4 5.9 4.5 1.6 2.8 4.1 3.7 2.7 3.9 5.3 5.0
‡Reporting standards not met; too few cases for a reliable estimate.
SOURCE: U.S. Department of Education, National Center for Education Statistics, Postsecondary Education Quick Information System, “Survey on Remedial Education in Higher Education Institutions: Fall 1995,” 1995; and “Survey on Remedial Education in Higher Education Institutions: Fall 2000,” 2001.

B-13
Table B-9. Standard errors for table 9: Among degree-granting institutions that offered remedial courses, percent indicating that there is a limitation on the length of time a student may take remedial courses at the institution, and the percentage distribution indicating how the time limit on remediation is set, by institutional type: Fall 1995 and 2000
How time limit on remediation is set
Year and institutional type
Length of remediation is limited at
institutions offering remedial courses
State policy or law Institutional policy Other 2000 All institutions ..................... 1.5 2.8 3.7 1.5 Public 2-year.............................. 2.3 5.8 7.2 4.0 Private 2-year............................. 8.1 ‡ ‡ ‡ Public 4-year.............................. 2.2 3.2 3.1 ‡ Private 4-year............................. 2.9 ‡ 2.8 1.6 1995 All institutions ..................... 2.0 3.3 3.5 1.2 Public 2-year.............................. 3.3 7.7 7.3 2.6 Private 2-year............................. 10.8 ‡ ‡ ‡ Public 4-year.............................. 3.7 2.6 2.6 † Private 4-year............................. 3.9 † 0.7 ‡
†Not applicable; estimate of standard error is not derived because it is based on a statistic estimated at 0 percent.
‡Reporting standards not met; too few cases for a reliable estimate.
SOURCE: U.S. Department of Education, National Center for Education Statistics, Postsecondary Education Quick Information System, “Survey on Remedial Education in Higher Education Institutions: Fall 1995,” 1995; and “Survey on Remedial Education in Higher Education Institutions: Fall 2000,” 2001.

B-14
Table B-10. Standard errors for table 10: Among degree-granting institutions that offered remedial courses in the given subject, percentage distribution indicating the extent of restrictions on regular academic courses that students can take while taking remedial courses, by subject area: Fall 1995 and 2000
Year and subject area No restrictions Some restrictions Totally restricted 2000 Reading..................................................... 1.8 1.8 0.2 Writing...................................................... 1.2 1.2 0.2 Mathematics ............................................. 1.2 1.2 0.2 1995 Reading..................................................... 2.8 2.7 0.8 Writing...................................................... 1.9 1.9 0.6 Mathematics ............................................. 2.1 2.1 0.7
SOURCE: U.S. Department of Education, National Center for Education Statistics, Postsecondary Education Quick Information System, “Survey on Remedial Education in Higher Education Institutions: Fall 1995,” 1995; and “Survey on Remedial Education in Higher Education Institutions: Fall 2000,” 2001.

B-15
Table B-11. Standard errors for table 11: Among degree-granting institutions that offered remedial courses in the given subjects, percentage distribution indicating the location within the institution of the most frequent provider of remedial education, by subject area and institutional type: Fall 1995 and 2000
Reading Writing Mathematics
Year and institutional type
Separate remedial division/
department
Traditional academic
depart-ment(s)
Learning center Other
Separate remedial division/
department
Traditional academic
depart-ment(s)
Learning center Other
Separate remedial division/
department
Traditional academic
depart-ment(s)
Learning center Other
2000 All institutions ... 1.5 1.9 1.3 0.6 1.2 1.5 0.8 0.5 1.0 1.5 0.9 0.5 Public 2-year ........... 2.3 2.2 1.5 ‡ 2.4 2.5 1.5 0.3 2.3 2.3 1.5 0.3 Private 2-year .......... ‡ ‡ ‡ ‡ 5.5 8.9 5.5 5.5 ‡ 6.9 ‡ ‡ Public 4-year ........... 2.2 3.3 2.2 ‡ 2.1 3.1 1.4 1.1 1.7 2.2 1.2 1.0 Private 4-year .......... 3.8 5.3 4.8 ‡ 2.3 2.5 1.8 0.6 2.1 2.4 1.9 ‡ 1995 All institutions ... 2.8 2.8 1.9 0.7 2.0 2.2 1.3 0.7 2.2 2.6 1.5 0.7 Public 2-year ........... 3.3 3.5 2.1 1.0 3.1 3.3 2.1 1.0 3.1 3.4 2.1 1.0 Private 2-year .......... ‡ ‡ ‡ ‡ ‡ ‡ ‡ ‡ 3.5 5.1 ‡ ‡ Public 4-year ........... 4.3 4.3 1.7 1.1 3.1 3.6 1.8 0.9 3.0 3.4 1.7 0.8 Private 4-year .......... 6.8 5.2 6.4 ‡ 4.7 4.7 3.1 1.0 4.5 4.6 3.1 1.0
‡Reporting standards not met; too few cases for a reliable estimate.
SOURCE: U.S. Department of Education, National Center for Education Statistics, Postsecondary Education Quick Information System, “Survey on Remedial Education in Higher Education Institutions: Fall 1995,” 1995; and “Survey on Remedial Education in Higher Education Institutions: Fall 2000,” 2001.

B-16
Table B-12. Standard errors for table 12: Among Title IV degree-granting institutions that offered remedial courses in the given subjects, percentage distribution indicating how frequently computers are used by students as a hands-on instructional tool for on-campus remedial courses, by subject area and institutional type: Fall 2000
Reading Writing Mathematics
Institutional type Never or very
rarely
Occa-
sionally Fre-
quently
Never or very
rarely
Occa-
sionally Fre-
quently
Never or very
rarely
Occa-
sionally Fre-
quently
All institutions .... 1.6 1.6 1.8 2.0 1.8 2.0 1.4 1.7 1.5 Public 2-year............. 1.9 2.9 2.5 1.7 2.9 2.5 2.3 3.1 2.5 Private 2-year............ ‡ ‡ ‡ 8.7 8.7 8.7 11.1 10.2 8.6 Public 4-year............. 2.5 2.8 2.6 2.5 2.3 2.1 2.4 2.4 2.0 Private 4-year............ 4.8 4.0 4.0 6.5 5.1 3.3 4.4 4.4 3.5
‡Reporting standards not met; too few cases for a reliable estimate.
SOURCE: U.S. Department of Education, National Center for Education Statistics, Postsecondary Education Quick Information System, “Survey on Remedial Education in Higher Education Institutions: Fall 2000,” 2001.

B-17
Table B-13. Standard errors for the figures and for data not shown in tables: Fall 1995 and 2000 Item Estimate Standard error Figure 1. Among Title IV degree-granting institutions that offered remedial courses in the given subjects, percentage distribution indicating various numbers of different remedial courses offered, by subject area: Fall 2000 Reading: 1 course ......................................................................................................................... 44 2.0 Reading: 2 courses........................................................................................................................ 31 1.6 Reading: 3 or 4 courses ................................................................................................................ 20 1.5 Reading: 5 or more courses .......................................................................................................... 4 0.5 Writing: 1 course ......................................................................................................................... 49 1.6 Writing: 2 courses ........................................................................................................................ 29 1.5 Writing: 3 or 4 courses ................................................................................................................. 18 1.1 Writing: 5 or more courses ........................................................................................................... 5 0.8 Mathematics : 1 course................................................................................................................. 32 1.9 Mathematics : 2 courses ............................................................................................................... 28 1.6 Mathematics : 3 or 4 courses ........................................................................................................ 32 1.4 Mathematics : 5 or more courses .................................................................................................. 8 0.8 Figure 2. Among degree-granting institutions that offered remedial courses in the given subjects, percentage distribution indicating various numbers of different remedial courses offered, by subject area: Fall 1995 Reading: 1 course ......................................................................................................................... 41 2.3 Reading: 2 courses........................................................................................................................ 33 2.9 Reading: 3 or 4 courses ................................................................................................................ 19 2.2 Reading: 5 or more courses .......................................................................................................... 7 0.9 Writing: 1 course ......................................................................................................................... 54 1.9 Writing: 2 courses ........................................................................................................................ 25 1.6 Writing: 3 or 4 courses ................................................................................................................. 15 1.4 Writing: 5 or more courses ........................................................................................................... 6 0.8 Mathematics : 1 course................................................................................................................. 40 2.4 Mathematics : 2 courses ............................................................................................................... 23 2.1 Mathematics : 3 or 4 courses ........................................................................................................ 24 1.7 Mathematics : 5 or more courses .................................................................................................. 13 1.3 Figure 3. Among Title IV degree-granting institutions that offered remedial courses, percent indicating that they offered remedial courses in academic subjects other than reading, writing, or mathematics, by institutional type: Fall 20001
All institutions .............................................................................................................................. 23 1.4 Public 2-year ................................................................................................................................ 37 3.0 Public 4-year ................................................................................................................................ 15 1.7 Private 4-year ............................................................................................................................... 11 2.3
See notes at end of table.

B-18
Table B-13. Standard errors for the figures and for data not shown in tables: Fall 1995 and 2000—Continued
Item Estimate Standard error Figure 4. Among degree-granting institutions that offered remedial courses, percent indicating that they offered remedial courses in academic subjects other than reading, writing, or mathematics, by institutional type: Fall 1995 All institutions .............................................................................................................................. 25 2.0 Public 2-year ................................................................................................................................ 36 3.4 Private 2-year ............................................................................................................................... 10 4.7 Public 4-year ................................................................................................................................ 27 3.3 Private 4-year ............................................................................................................................... 14 3.2 Figure 5. Among Title IV degree-granting institutions that did not offer remedial courses, percent indicating the reasons they did not offer remedial courses: Fall 2000 Remedial courses were not needed ............................................................................................... 59 4.5 Students who need remediation take it elsewhere......................................................................... 29 3.3 Institutional policy does not allow remedial courses .................................................................... 26 3.5 State policy or law does not allow remedial courses .................................................................... 8 1.3 Other reasons................................................................................................................................ 15 2.9 Figure 6. Among degree-granting institutions that did not offer remedial courses, percent indicating the reasons they did not offer remedial courses: Fall 1995 Remedial courses were not needed ............................................................................................... 66 4.8 Institutional policy does not allow remedial courses .................................................................... 27 4.1 Students who need remediation take it elsewhere......................................................................... 22 5.5 State policy or law does not allow remedial courses .................................................................... 5 1.4 Other reasons................................................................................................................................ 9 2.6 Figure 7. Percent of Title IV degree-granting institutions that provided remedial education services/courses to local business and industry, by institutional type: Fall 20001
All institutions .............................................................................................................................. 21 1.0 Public 2-year ................................................................................................................................ 56 2.9 Public 4-year ................................................................................................................................ 8 1.0 Private 4-year ............................................................................................................................... 3 0.8 Figure 8. Percent of degree-granting institutions that provided remedial education services/courses to local business and industry, by institutional type: Fall 19951
All institutions .............................................................................................................................. 19 1.4 Public 2-year ................................................................................................................................ 50 2.9 Public 4-year ................................................................................................................................ 6 1.5 Private 4-year ............................................................................................................................... 4 1.6
See notes at end of table.

B-19
Table B-13. Standard errors for the figures and for data not shown in tables: Fall 1995 and 2000—Continued
Item Estimate Standard error Figure 9. Among Title IV degree-granting institutions that offered remedial courses, percent indicating that the institution offered remedial courses through distance education, by institutional type: Fall 2000 All institutions .............................................................................................................................. 13 1.0 Public 2-year ................................................................................................................................ 25 1.8 Private 2-year ............................................................................................................................... # † Public 4-year ................................................................................................................................ 8 1.0 Private 4-year ............................................................................................................................... 4 1.1 Figure 10. Among degree-granting institutions that offered remedial courses, percent indicating that the institution offered remedial courses through distance education, by institutional type: Fall 19952
All institutions .............................................................................................................................. 3 0.5 Public 2-year ................................................................................................................................ 6 1.1 Public 4-year ................................................................................................................................ 4 1.4 Figure 11. Among Title IV degree-granting institutions that offered remedial courses through distance education, percent indicating the types of technology used as a primary mode of instructional delivery for the remedial courses offered through distance education: Fall 2000 Two-way interactive video ........................................................................................................... 26 4.1 One-way prerecorded video.......................................................................................................... 27 4.4 Internet courses using synchronous computer-based instruction .................................................. 25 3.7 Internet courses using asynchronous computer-based instruction ................................................ 64 3.9 Other technologies........................................................................................................................ 8 2.1 Chapter 2, section on reasons institutions do not offer remedial courses Percent of institutions that did not offer remedial courses in fall 2000 that had offered remedial courses during the previous 5 years ...................................................... 8 2.0
†Not applicable; estimate of standard error is not derived because it is based on a statistic estimated at zero percent.
#Rounds to zero. 1Data for private 2-year institutions are not reported because there were too few cases for a reliable estimate. 2Data for private 2-year and private 4-year institutions are not reported because there were too few cases for a reliable estimate.
SOURCE: U.S. Department of Education, National Center for Education Statistics, Postsecondary Education Quick Information System, “Survey on Remedial Education in Higher Education Institutions: Fall 1995,” 1995; and “Survey on Remedial Education in Higher Education Institutions: Fall 2000,” 2001.

B-20

C-1
APPENDIX C
QUESTIONNAIRES
1995 and 2000

C-2

C-3
U.S. DEPARTMENT OF EDUCATION FORM APPROVED NATIONAL CENTER FOR EDUCATION STATISTICS O.M.B. No.: 1850-0733 WASHINGTON, D.C. 20006-5651 EXPIRATION DATE: 07/2002 REMEDIAL EDUCATION IN HIGHER EDUCATION INSTITUTIONS: FALL 2000 POSTSECONDARY EDUCATION QUICK INFORMATION SYSTEM This survey is authorized by law (P.L. 103-382). While participation in this survey is voluntary, your cooperation is critical to make the results of this survey comprehensive, accurate, and timely.
Definition of Remedial Education Courses for Purposes of This Study:
Courses in reading, writing, or math for college students lacking those skills necessary to perform college-level work at the level required by your institution. Throughout this questionnaire, these courses are referred to as "remedial"; however, your institution may use other names such as "compensatory," "developmental," or "basic skills," or some other term. Please answer the survey for any courses meeting the definition above, regardless of name; however, do not include English as a second language (ESL) when taught primarily to foreign students. Do not include remedial courses offered by another institution, even if students at your institution take these courses. Please answer for your regular undergraduate programs (except for question 13, which asks about services/courses to business and industry). Use data from your institutional records whenever possible. If exact data are not available, then give your best estimate.
IF ABOVE INSTITUTION INFORMATION IS INCORRECT, PLEASE UPDATE DIRECTLY ON LABEL. Name of Person Completing This Form: _________________________________________________________________ Title/Position: ______________________________________________________________________________________ Telephone Number: ___________________________________ E-mail: ______________________________________
THANK YOU. PLEASE KEEP A COPY OF THIS SURVEY FOR YOUR RECORDS. PLEASE RETURN COMPLETED FORM TO: IF YOU HAVE ANY QUESTIONS, CONTACT: Laurie Lewis (716622) Laurie Lewis at Westat Westat 800-937-8281, Ext. 8284 or 301-251-8284 1650 Research Boulevard Fax: 800-254-0984 Rockville, Maryland 20850-3195 Email: [email protected] According to the Paperwork Reduction Act of 1995, no persons are required to respond to a collection of information unless it displays a valid OMB control number. The valid OMB control number for this information collection is 1850-0733. The time required to complete this information collection is estimated to average 30 minutes per response, including the time to review instructions, search existing data resources, gather the data needed, and complete and review the information collection. If you have any comments concerning the accuracy of the time estimate or suggestions for improving this form, please write to: U.S. Department of Education, Washington, DC 20202-4651. If you have any comments or concerns regarding the status of your individual submission of this form, write directly to: National Center for Education Statistics, 1990 K Street, NW, Washington, DC 20006. PEQIS Form No. 12, 6/2001

C-4
1. Did your institution enroll any freshman students in fall 2000?
Yes ................... 1 (Continue with question 2.) No..................... 2 (Stop. Complete respondent section on front and return questionnaire.)
2. Did your institution offer any remedial reading, writing, or math courses (as defined on the front of this questionnaire) in
fall 2000?
Yes ................... 1 (Skip to question 5.) No..................... 2 (Continue with question 3.) 3. Which of the following are reasons that your institution did not offer any remedial courses in fall 2000? (Circle one on
each line.) Yes No
a. Remedial courses are not needed by students at this institution............................................................... 1 2 b. Students at this institution who need remediation take remedial courses offered by another institution... 1 2 c. State policy or law does not allow this institution to offer remedial courses .............................................. 1 2 d. Institutional policy does not allow this institution to offer remedial courses ............................................... 1 2 e. Other reason (specify) _______________________________________________________ ................ 1 2
4. Has your institution offered any remedial courses during the last 5 years? (Circle one and then skip to question 13a.)
Yes ................... 1 (Date last offered:________________________) No..................... 2 5. Enter information requested in Parts a-i for remedial courses in each subject area in fall 2000. For those subjects
(reading, writing, or math) in which you have no remedial courses, enter "no" in part a and skip parts b-i.
Remedial course information Reading Writing Math
a. Did your institution offer remedial courses in this subject in fall 2000? (Enter yes or no.)
b. What was the number of remedial courses with different catalog numbers in fall 2000? (Do not count multiple sections of the same course.)
c. What is the most frequent type of credit earned from remedial courses? (Enter one.)
1 = Degree credit, meets subject requirements 2 = Degree credit, elective only 3 = Institutional credit (e.g., counts toward financial aid, campus housing, or full-time student status) 4 = No credit
d. What is the most frequent type of course requirement status for students
needing remedial courses? (Enter one.)
1 = Required; 2 = Recommended but not required e. How are students usually selected for remedial courses? (Enter one.)
1 = All entering students are given placement tests to determine need for remediation 2 = Entering students who do not have SAT/ACT scores or who score below a certain level on the SAT/ACT or have a GPA below a certain level are given placement tests to determine need for remediation 3 = Entering students who score below a certain level on the SAT/ACT or have a GPA below a certain level are required or encouraged to enroll in remedial/developmental courses 4 = Faculty or staff refer students for enrollment in remedial/developmental courses 5 = Students refer themselves for enrollment in remedial/developmental courses 6 = Other (specify) ______________________________________________

C-5
5. (continued) For those subjects (reading, writing, or math) for which you have no remedial courses, skip parts f through i below.
Remedial course information Reading Writing Math
f. While students are taking remedial courses, are there any restrictions on the regular academic courses they can take? (Enter one.)
1 = No restrictions on regular academic courses 2 = Some restrictions on regular academic courses (e.g., cannot take courses for which the remedial courses are a prerequisite) 3 = Totally restricted from taking regular academic courses
g. Who most often provides remedial education? (Enter one.)
1 = Separate remedial division/department 2 = Traditional academic department(s) 3 = Learning center 4 = Other (specify)_______________________________________________
h. How frequently are computers used by students as a hands-on instructional
tool for on-campus remedial education courses (e.g., for self-paced courses or drill and practice)? Do not include remedial courses offered through distance education. (Enter one.)
1 = Never or very rarely 2 = Occasionally 3 = Frequently
i. In fall 2000, about what percent of entering freshmen enrolled in any remedial
courses in reading? writing? math? (Answer separately for each subject.)
6. Give your best estimate of the total, unduplicated percent of entering freshmen who enrolled in any remedial reading or remedial writing or remedial math courses in fall 2000. ___________%
7. Has the number of students enrolled in remedial courses at your institution increased, stayed about the same, or
decreased in the last 5 years? (Circle one number.) Increased................ 1 Stayed about the same.................. 2 Decreased ............... 3 8. Does your institution offer remedial courses in academic subjects other than reading, writing, or math?
Yes ................... 1 (Specify subject(s):___________________________) No..................... 2
9. Did your institution offer any remedial courses through distance education in fall 2000? For this survey, include any remedial courses delivered to remote (off-campus) locations via audio, video (live or prerecorded), or computer technologies.
Yes ................... 1 (Continue with question 10.) No..................... 2 (Skip to question 11.)
10. Which types of technology did your institution use as a primary mode of instructional delivery for remedial courses
offered through distance education in fall 2000? (Circle one on each line.) Yes No a. Two-way interactive video (i.e., two-way video with two-way audio).......................................................... 1 2 b. One-way prerecorded video (including prerecorded videotapes provided to students, and television broadcast or cable transmission using prerecorded video) ....................................................... 1 2 c. Internet courses using synchronous (i.e., simultaneous or "real time") computer-based instruction (e.g., interactive computer conferencing or Interactive Relay Chat).......................................................... 1 2 d. Internet courses using asynchronous (i.e., not simultaneous) computer-based instruction (e.g., e-mail and most World Wide Web-based courses) ......................................................................... 1 2 e. Other technologies (specify) _______________________________________________________ ....... 1 2

C-6
11. On average, about how long does a student take remedial courses? (Circle one number.) Less than 1 year (e.g., 1 semester or 2 quarters)......................................................................... 1 1 year ............................................................................................................................................ 2 More than 1 year ........................................................................................................................... 3 12a. Is there a limit on the length of time a student may take remedial courses at your institution?
Yes................... 1 (Length of time:_________________________) No..................... 2 (Skip to question 13a.) 12b. How is the time limit on remediation set? (Circle one number.) State policy or law ......................................................................................................................... 1 Institutional policy.......................................................................................................................... 2 Other (specify) _____________________________________________________________ . 3
13a. Does your institution provide remedial education services/courses to local business and industry?
Yes................... 1 No .................... 2 (Skip questions 13b and 13c.) 13b. What subject areas are covered in these services/courses? (Circle one on each line.) Yes No
a. Reading.................................................................................................................................... 1 2 b. Writing...................................................................................................................................... 1 2 c. Math ......................................................................................................................................... 1 2 d. Other (specify) __________________________________________________________ .... 1 2
13c. What is the location of these services/courses? (Circle one on each line.) Yes No
a. On the campus of this institution.............................................................................................. 1 2 b. At business/industry sites ........................................................................................................ 1 2 c. Offered through distance learning ........................................................................................... 1 2 d. Other (specify) __________________________________________________________ .... 1 2
THANK YOU FOR YOUR ASSISTANCE. PLEASE KEEP A COPY OF THIS SURVEY FOR YOUR RECORDS.

C-7
U.S. DEPARTMENT OF EDUCATION FORM APPROVED NATIONAL CENTER FOR EDUCATION STATISTICS O.M.B. No.: 1850-0721 WASHINGTON, D.C. 20208-5651 EXPIRATION DATE: 12/96 REMEDIAL EDUCATION IN HIGHER EDUCATION INSTITUTIONS POSTSECONDARY EDUCATION QUICK INFORMATION SYSTEM This survey is authorized by law (20 U.S.C. 1221e-l). While participation in this survey is voluntary, your cooperation is critical to make the results of this survey comprehensive, accurate, and timely.
Definition of Remedial Education Courses for Purposes of This Study:
Courses in reading, writing, or math for college students lacking those skills necessary to perform college-level work at the level required by your institution. Throughout this questionnaire, these courses are referred to as "remedial"; however, your institution may use other names such as "compensatory," "developmental," or "basic skills," or some other term. Please answer the survey for any courses meeting the definition above, regardless of name; however, do not include English as a second language (ESL) when taught primarily to foreign students. Do not include remedial courses offered by another institution, even if students at your institution take these courses. Please answer for your regular undergraduate programs (except for question 17, which asks about services/courses to business and industry). Use data from your institutional records whenever possible. If exact data are not available, then give your best estimate.
AFFIX LABEL HERE IF ABOVE INSTITUTION INFORMATION IS INCORRECT, PLEASE UPDATE DIRECTLY ON LABEL. Name of Person Completing This Form: __________________________ Telephone Number: ___________ Title/Position: _____________________________________________________________________________
THANK YOU. PLEASE KEEP A COPY OF THIS SURVEY FOR YOUR RECORDS. RETURN COMPLETED FORM TO: WESTAT, INC. 1650 Research Boulevard Rockville, Maryland 20850 ATTN: Lewis, 923812
IF YOU HAVE ANY QUESTIONS, CALL: Laurie Lewis at Westat 1-800-937-8281, Ext. 8284 or 1-301-251-8284 8:00 a.m. - 4:00 p.m., Eastern time zone Fax#: 1-301-294-3992
The time required to complete this information collection is estimated to average 30 minutes per response, including the time to review instructions, search existing data resources, gather and maintain the data needed, and complete and review the information collection. If you have any comments concerning the accuracy of the time estimate or suggestions for improving this form, please write to: U.S. Department of Education, Washington, DC 20202-4651. If you have any comments or concerns regarding the status of your individual submission of this form, write directly to: National Center for Education Statistics, U.S. Department of Education, 555 New Jersey Avenue, NW, Washington, DC 20202-5574. PEQIS Form No. 6, 10/95

C-8
1. Does your institution enroll any freshman students? Yes.............. 1 (Continue with question 2.) No ............... 2 (Stop. Complete respondent section on front and return questionnaire.) 2. Does your institution offer any remedial reading, writing, or math courses (as defined on the front of this questionnaire)? Yes.............. 1 (Skip to question 5.) No ............... 2 (Continue with question 3.) 3. Which of the following are reasons that your institution does not offer any remedial courses? (Circle one on each line.)
Yes No a. Remedial courses are not needed by students at this institution .................................................................... 1 2 b. Students at this institution who need remediation take remedial courses offered by another institution....... 1 2 c. State policy or law does not allow this institution to offer remedial courses................................................. 1 2 d. Institutional policy does not allow this institution to offer remedial courses................................................. 1 2 e. Other reason (specify) ______________________________________________________________ ....... 1 2
4. Has your institution offered any remedial courses during the last 5 years? (Circle one and then skip to question 16.) Yes.............. 1 (Date last offered:_________________________) No............... 2 5. Enter information requested in Parts a-h for remedial courses in each subject area in fall 1995. For those subjects
(reading, writing, or math) in which you have no remedial courses, enter "no" in Part a and skip Parts b-i.
Remedial course information Reading Writing Math a. Did your institution offer remedial courses in this subject in fall 1995?
(Enter yes or no.) b. What was the number of remedial courses with different catalog numbers in
fall 1995? (Do not count multiple sections of the same course.) c. What is the most frequent type of credit earned from remedial courses?
(Enter one.) 1 = Degree credit, meets subject requirements 2 = Degree credit, elective only 3 = Institutional credit (e.g., counts toward financial aid, campus housing, or full-time student status) 4 = No credit
d. What is the most frequent type of course requirement status for students needing remedial courses? (Enter one.) 1 = Required; 2 = Recommended but not required
e. How are students usually selected for remedial courses? (Enter one.) 1 = All entering students are given placement tests to determine need for remediation 2 = Entering students who do not have SAT/ACT scores or who score below a certain level on the SAT/ACT or have a GPA below a certain level are given placement tests to determine need for remediation 3 = Entering students who score below a certain level on the SAT/ACT or have a GPA below a certain level are required or encouraged to enroll in remedial/developmental courses 4 = Faculty or staff refer students for enrollment in remedial/ developmental courses 5 = Students refer themselves for enrollment in remedial/ developmental courses 6 = Other (specify) ________________________________________________

C-9
5. (continued) Remedial course information Reading Writing Math f. While students are taking remedial courses, are there any restrictions on the regular academic courses they can take? (Enter one.)
1 = No restrictions on regular academic courses 2 = Some restrictions on regular academic courses 3 = Totally restricted from taking regular academic courses
g. Who most often provides remedial education? (Enter one.) 1 = Separate remedial division/department 2 = Traditional academic department(s) 3 = Learning center 4 = Other (specify) ________________________________________________
h. In fall 1995, about what percent of entering freshmen enrolled in any remedial courses in reading? writing? math? (Answer separately for each subject.)
i. In general, about what percent of students enrolled in remedial courses pass or successfully complete the remedial courses? (Enter for each subject.)
6. Give your best estimate of the total, unduplicated percent of entering freshmen who enrolled in any remedial reading or
remedial writing or remedial math courses in fall 1995. ___________% 7. Has the number of students enrolled in remedial courses at your institution increased, stayed about the same, or
decreased in the last 5 years? (Circle one number.)
Increased................................... 1 Stayed about the same ................2 Decreased ...................................3 8a. About what percent of all 1994-95 full-time entering freshmen continued at your institution to the start of their second
year (1995-96)? ___________% 8b. About what percent of 1994-95 full-time entering freshmen who enrolled in any remedial courses continued at your
institution to the start of their second year (1995-96)? ___________% 9. Does your institution offer remedial courses in academic subjects other than reading, writing, or math? Yes.............. 1 (specify subject(s) ____________________________________ ) No ............... 2 10. When does your institution offer remedial courses? (Circle one on each line.)
Yes No
a. Day time ..................................................................................................................................... 1 2 b. Evenings ..................................................................................................................................... 1 2 c. Weekends ................................................................................................................................... 1 2 d. Summer session .......................................................................................................................... 1 2 e. Other (specify) __________________________________________________________ ..... 1 2
11. Does your institution offer any remedial courses through distance learning (e.g., TV broadcast or cable)?
Yes.............. 1 No ............... 2 12a. Are there any state policies or laws that affect your institution's remedial education offerings?
Yes.............. 1 No ............... 2 (Skip to question 13.) 12b. How do these state policies or laws affect offerings? (Circle the one answer that best applies.)
This institution is required to offer remedial education ...................................................................................... 1 This institution is encouraged (but not required) to offer remedial education .................................................... 2 This institution is discouraged from offering remedial education ...................................................................... 3 The remedial offerings of the institution are restricted ....................................................................................... 4 Other (specify) ______________________________________________________________________ ....... 5

C-10
13. On average, about how long does a student take remedial courses? (Circle one number.)
Less than 1 year (e.g., 1 semester or 2 quarters)......................................................................... 1 1 year .......................................................................................................................................... 2 More than 1 year......................................................................................................................... 3
14a. Is there a limit on the length of time a student may take remedial courses at your institution?
Yes.............. 1 (Length of time: ____________________) No............... 2 (Skip to question 15a.) 14b. How is the time limit on remediation set? (Circle one number.)
State policy or law ...................................................................................................................... 1 Institutional policy...................................................................................................................... 2 Other (specify) ____________________________________________________________ .. 3
15a. Does your institution have any formal arrangements to offer remedial courses to students from other postsecondary
institutions?
Yes.............. 1 No ............... 2 (Skip to question 16a.) 15b. With what types of institutions do you have such arrangements? (Circle one on each line.)
Yes No
a. Public 4-year college or university ............................................................................................. 1 2 b. Private 4-year college or university ............................................................................................ 1 2 c. Public 2-year college .................................................................................................................. 1 2 d. Private 2-year college ................................................................................................................. 1 2 e. Other (specify) __________________________________________________________ ..... 1 2
16a. Does your institution offer any English as a second language (ESL) courses for college students?
Yes.............. 1 No ............... 2 (Skip to question 17a.) 16b. Does your institution consider these ESL courses to be remedial courses? (Circle one number.)
All ESL courses are considered remedial................................................................................... 1 Some ESL courses are considered remedial ............................................................................... 2 No ESL courses are considered remedial ................................................................................... 3
17a. Does your institution provide remedial education services/courses to local business and industry?
Yes.............. 1 No ............... 2 (Skip questions 17b and 17c.) 17b. What subject areas are covered in these services/courses? (Circle one on each line.) Yes No
a. Reading....................................................................................................................................... 1 2 b. Writing........................................................................................................................................ 1 2 c. Math............................................................................................................................................ 1 2 d. Other (specify) __________________________________________________________ ..... 1 2
17c. What is the location of these services/courses? (Circle one on each line.)
Yes No
a. On the campus of this institution................................................................................................ 1 2 b. At business/industry sites ........................................................................................................... 1 2 c. Offered through distance learning .............................................................................................. 1 2 d. Other (specify) __________________________________________________________ ..... 1 2
THANK YOU FOR YOUR ASSISTANCE. PLEASE KEEP A COPY OF
THIS SURVEY FOR YOUR RECORDS.