Remedial Action Addendum Ground Water Remediation ...Remedial Action Work Plan Addendum Ground Water...
55
Remedial Action Work Plan Addendum Ground Water Remediation Activities Richmond Gas Plant 16 East Main Street Richmond, Indiana Brownfields Number 4980004 This Addendum to the Remedial Action Work Plan for the Richmond Gas Plant (RAWP) has been prepared to provide responses to comments from the Indiana Finance Authority (IFA) Brownfields representatives following review of the RAWP. Following IFA approval of these responses, they will be incorporated into the RAWP and the remedial program will be modified accordingly. In‐Situ Chemical Oxidation (ISCO) Injection: Comment: 1. There has not been a bench scale test/pilot test conducted at the Site to determine if the proposed In‐Site Chemical Oxidization (ISCO) is appropriate to remediate ground water contamination. In addition, it is unknown if the proposed ISCO amount is suitable for site conditions (too much or not enough?). Please incorporate a pilot test into the RAWP in order to verify the proposed remedial approach is suitable for the Site prior to full implementation. Response: An initial bench scale test of ISCO options including RegenOX©, Fenton’s Reagent and potassium permanganate will be completed. This bench scale test will be performed by injecting each of these reagents into comparably sized samples collected from the vicinity of monitoring well MW‐015 to evaluate remedial effectiveness in the center of the offsite plume; monitoring well MW‐004 to evaluate remedial effectiveness for onsite ground water; and, monitoring well MW‐ 001 to evaluate remedial effectiveness in the potential presence of light non‐aqueous phase liquid (LNAPL). Monitoring well MW‐4 is currently damaged and will require replacement in order to be utilized for ISCO testing and future onsite monitoring. The results of these bench tests will be used to develop a pilot test program for the site. The pilot test program will include injection of the most effective reagent under the three separate Site conditions (offsite plume, onsite ground water and LNAPL impacts). Up to three pilot tests may be performed; one in the vicinity of monitoring well MW‐015, one in the vicinity of monitoring well MW‐004; and, one in the vicinity of monitoring well MW‐001. Based upon the Site specific grain size and permeability conditions, injections will be spaced at 10 ft intervals in a 20 foot (ft) by 20 ft area around each of these monitoring well locations. The grid pattern may be adjusted for conditions around each well such as topography and Site property boundaries.
Transcript of Remedial Action Addendum Ground Water Remediation ...Remedial Action Work Plan Addendum Ground Water...
Remedial Action Work Plan Addendum
Ground Water Remediation Activities
Richmond Gas Plant
16 East Main Street
Richmond, Indiana
Brownfields Number 4980004
This Addendum to the Remedial Action Work Plan for the Richmond Gas Plant (RAWP) has been prepared to provide responses to comments from the Indiana Finance Authority (IFA) Brownfields representatives following review of the RAWP. Following IFA approval of these responses, they will be incorporated into the RAWP and the remedial program will be modified accordingly.
In‐Situ Chemical Oxidation (ISCO) Injection:
Comment:
1. There has not been a bench scale test/pilot test conducted at the Site to determine if the proposed In‐Site Chemical Oxidization (ISCO) is appropriate to remediate ground water contamination. In addition, it is unknown if the proposed ISCO amount is suitable for site conditions (too much or not enough?). Please incorporate a pilot test into the RAWP in order to verify the proposed remedial approach is suitable for the Site prior to full implementation.
Response:
An initial bench scale test of ISCO options including RegenOX©, Fenton’s Reagent and potassium permanganate will be completed. This bench scale test will be performed by injecting each of these reagents into comparably sized samples collected from the vicinity of monitoring well MW‐015 to evaluate remedial effectiveness in the center of the offsite plume; monitoring well MW‐004 to evaluate remedial effectiveness for onsite ground water; and, monitoring well MW‐001 to evaluate remedial effectiveness in the potential presence of light non‐aqueous phase liquid (LNAPL). Monitoring well MW‐4 is currently damaged and will require replacement in order to be utilized for ISCO testing and future onsite monitoring.
The results of these bench tests will be used to develop a pilot test program for the site. The pilot test program will include injection of the most effective reagent under the three separate Site conditions (offsite plume, onsite ground water and LNAPL impacts). Up to three pilot tests may be performed; one in the vicinity of monitoring well MW‐015, one in the vicinity of monitoring well MW‐004; and, one in the vicinity of monitoring well MW‐001.
Based upon the Site specific grain size and permeability conditions, injections will be spaced at 10 ft intervals in a 20 foot (ft) by 20 ft area around each of these monitoring well locations. The grid pattern may be adjusted for conditions around each well such as topography and Site property boundaries.
During the pilot test, indicator parameters including COC levels and ISCO agent specific parameters will be monitored in the ground water within the target well or the broader ground water monitoring well network. If necessary, additional ground water monitoring wells may be installed to provide adequate monitoring points for evaluating the performance of the pilot test. This may include installation of additional ground water monitoring wells to the west and south of monitoring wells MW‐015 and MW‐001 and a replacement MW‐004 monitoring well. In addition to evaluating pilot test performance, these additional monitoring wells would be utilized to monitor full scale remedial activities.
A comprehensive written report of the evaluation of all ISCO materials will be included in a subsequent RAWP Addendum for final remedial program design prior to implementation.
Comment:
2. There has been no reported consideration of other ISCO materials for ground water treatment. The mixture of PAHs present in coal tar is variable and technology at one Site may not work at another. Please discuss the rationale for proposing Regenox compared to other ISCO materials including: Fenton’s, hydrogen peroxide, permanganate, persulfate, magnesium peroxide, and any other ISCO considered, with or without special catalysts, pH adjustment compounds, and iron supplements.
Response:
The Regenesis product, RegenOx©, was selected over other ISCO materials for several reasons. As stated in the Remedial Action Work Plan, a minimal exothermic reaction as well as significantly reduced costs when compared to Fenton’s reagent were the main selection criteria.
With regard to Fenton’s reagent and other ISCO agents, RegenOx© does not require any additional additives such as special catalysts, pH adjustment compounds or iron supplements. This reduces cost requirements and simplifies the injection process which makes Regenox© an advantageous choice. Regenox© is compatible with the addition of ORC©, a Regenesis biodegrdation product, that would provide additional remedial biological activity for up to 12 months after injection.
Finally, RegenOx© was selected because Regenesis provides comprehensive technical support. A Regenesis representative is available to be onsite during the injection and monitoring program. Upon request, Regenesis will also provide turnkey injection services with a subcontractor of choice.
Comment:
a. The RWAP states on Page 6‐2: “Due to cost and reactivity considerations, chemical oxidation agents provided by Regenesis of San Clemente, California have been selected for this project in lieu of other conventional agents such as Fenton’s reagent and high‐concentration hydrogen peroxide”. Please discuss each ISCO material cost and reactivity considerations in addition to how each ISCO material relates to the Site specific chemicals of concern and geological conditions (porosity, grain size, permeability, TOC). Please include a discussion on the natural oxidant demand (NOD) at the Site.
Response:
A bench scale test will be conducted on samples collected after the source removal activities are considered complete so that the samples collected accurately reflect remaining residual and saturated impacts that might have an effect on ground water quality. Samples for NOD will also be collected from the site at that time using the same rationale. The results of the bench test, amount of ISCO materials needed, costs, and reactivity considerations will be included in the report that outlines the rationale for the oxidant selected. The following discusses the rationale for including Fenton’s Reagent (hydrogen peroxide with an iron catalyst) and potassium permanganate in the bench‐scale tests. Other oxidants such as persulfate or magnesium peroxide have either been used at other MGP sites and proven difficult to control or ineffective (persulfate) and other oxidants would likely not be aggressive enough to consider for the site due to the potential for residual impacts (NAPL or stringers/blebs) remaining in the subsurface.
Fenton’s Reagent: Fenton’s reagent, resulting from the reaction between hydrogen peroxide and an iron catalyst or iron source, works through direct oxidation of organic compounds as well as the creation of free radicals which further oxidize organic compounds. Any residual hydrogen peroxide decomposes into water and oxygen and any remaining iron is removed as a precipitate in the subsurface. Fenton’s reagent has the potential benefit of stimulating aerobic natural attenuation mechanisms by elevating the concentration of oxygen in the ground water.
The chemical oxidant selected for implementation of ISCO could either be modified Fenton’s Reagent or conventional Fenton’s Reagent. Both modified and conventional Fenton’s Reagent have been proven effective at treating MGP residuals at other sites. Use of conventional Fenton’s Reagent will require temporarily lowering the aquifer pH to enhance the reaction rates. Modified Fenton’s Reagent is effective at a wider range of pH values than conventional Fenton’s Reagent eliminating the need to adjust the pH of site ground water up or down.
The major drawback of Fenton’s reagent is the vigorous and exothermic reaction that must be carefully monitored to mitigate any hazards posed to site personnel and the public. The use of Fenton’s reagents also has the potential to increase off‐site migration of hydrocarbons due to a reduction of the natural organic material in the soil, which serves as sorption sites for the hydrocarbon contaminants.
Potassium Permanganate: Potassium permanganate has been used for many years to oxidize organic compounds in water and wastewater. In recent years permanganate has been applied to ISCO of organic compounds. Bench scale studies by In Situ Oxidative Technologies, Inc. (ISOTEC) and others have demonstrated potential effectiveness on MGP COIs for former MGP sites.
Permanganate has significant safety benefits over Fenton’s Reagent (Fenton’s). Reactions are typically less vigorous and exothermic than Fenton’s. Also, the potential for off‐site migration of mobilized contaminants is lower for permanganate than for the other oxidants discussed as it does not react as extensively with natural organic matter in soil. The major drawback of potassium permanganate is its limited effectiveness in oxidizing benzene.
Comment:
b. The Program will also evaluate a combination of ISCO materials. An example would be: for BTEX, permanganate is a cost effective oxidant. For constituents like PAHs persulfate is one oxidant of choice. Testing may be necessary (Soil Oxidant Demand) for the proposed ISCO or combination of approaches (sodium hydroxide and hydrogen peroxide as activators for sodium persulfate). Testing will help provide dosage guidance which will help minimize over‐dosage and limit additional applications.
Response:
Please see response to Item 2a. Our experience has actually shown that permanganate is not effective on BTEX, but rather more effective on PAHs, specifically naphthalene as well as chlorinated compounds. Fenton’s Reagent has been proven to be most effective on BTEX.
Persulfate has been proven to be effective on bench‐scale size test, but not effective in the field application since its injection path can be difficult to control and contact with affected media is not always achieved.
Comment:
3. A moderate sheen was documented in recent soil borings and monitoring well logs near depth to ground water. In addition, globules of product were observed in the following borings: SB‐12‐03 (13ft), SB‐12‐04 (13ft), SB‐12‐05 (12.5 ft), MW‐11 (8 ft & 19 ft). Also, some of the borings had product at the base of the fill material and on top of the native silty clay. Regenox has limitations and is not effective when product is present. Please evaluate all ISCO materials in relation to the limited product present in the subsurface at the Site.
Response:
As noted in the response to Item 1 above, a bench test will be performed with RegenOX©, Fenton’s Reagent and potassium permanganate for conditions in the vicinity of monitoring well MW‐001, where LNAPL has historically accumulated at the site. Based upon the results of the bench test, a pilot test with the most effective reagent will performed in the vicinity of monitoring well MW‐001 for potential free product considerations.
Comment:
4. Application of Regenox:
o The proposed Regenox consists of: (a) Sodium percarbonate/sodium carbonate/sodium silicate/silica gel (powder oxidizer) & (b) Sodium silicate/silica gel/ferrous sulphate (liquid activator).
Please provide a detailed discussion on application calculations and how AECOM concluded that the following three injection events proposed approximately 120 days apart (consecutive quarters) is suitable for Site conditions.
Injection 1) 11,300 lbs. of Regenox
670 lbs to 1,000 gal water (94 gal per point @ 10 points) proposed

2 mixing process per day so 20 points/day
Injection 2) 11,300 lbs of Regenox
Same Regenox mixture as above proposed
Injection 3) 11,300 lbs. of Regenox & 6,750 lbs. of ORC
Same Regenox as above. ORC: 350 lbs of ORC/670 lbs or Regenox/1,000 gal water proposed.
Response:
The RegenOx© application program was developed in consultation with Regenesis technical support. A summary of the Site specific evaluation is included in Attachment A.
The schedule was developed to account for adequate remedial progress monitoring between injection events.
Comment:
5. A new HASP & QAPP is needed for ground water remediation activities as the one provided is for soil excavation activities.
Response:
The provided Site specific HASP & QAPP will be updated prior to initiating the ground water remediation program. These updated documents will include ISCO bench test, pilot test and full scale remedial considerations.
Comment:
6. No case studies were provided for review regarding ISCO success at MGP Sites. Please provide case studies for review.
Response:
Case studies and supporting documentation in Attachment B.
Contingency Plans:
Comment:
The RWAP contained the following Remedial action objective on Page 1‐7: “Treat MGP‐impacted off‐site ground water that could facilitate the migration of MGP impacts into off‐site media, particularly the East Fork of the Whitewater River and to eliminate or control exposure pathways for Site workers and recreational patrons. This will include the implementation of an on‐Site cap”.
o There was no discussion concerning remediation of on‐Site ground water contamination, as currently documented in MW‐6. While remedial efforts will address the source near MW‐6 and; therefore likely decrease ground water contamination in the
vicinity of SB‐14, a contingency plan is requested if on‐Site ground water contamination is still present after soil excavation, especially if LNAPL is present.
Response:
Continued accumulation of LNAPL in wells within the existing monitoring well network suggests that there is either an unidentified continuing source within or upgradient of the site or that there is pooled NAPL material that has escaped containment of a subsurface structure and is free or mobile.
One of the objectives of the source removal activities scheduled for the fall of 2012 is to remove the MGP source material located on the Site that can, could or do result in migration of MGP impacts into offsite media. Test pitting activities completed in support of these activities suggest that additional, not previously identified, heavily affected media are prevalent to the north of the basement area. Heavily affected media in this area is targeted for removal. Further, based on the historically elevated concentrations of COC in ground water analytical results from monitoring well MW‐002, and negligible qualitative evidence to the contrary, test pits have been proposed (and tentatively accepted) within the large holder on the southern portion of the property. Resources permitting, AECOM recommends completing an additional test pit in the small holder area to eliminate this as a potential source as well.
Based on the current interpretation of ground water flow, monitoring well MW‐006 is in a generally upgradient portion of the site (northeast corner). Source removal in the area of SB‐14 (located upgradient of MW‐006) should provide a qualitative line of evidence regarding the presence or absence of mobile LNAPL material or heavily affected media in the subsurface and some indication as to whether heavily affected media in this area are isolated or originate further upgradient.
In general, the efficacy of on or offsite ISCO treatment of ground water will be compromised over time if a lingering source or heavily affected subsurface soils persists upgradient of the treatment area. The in‐situ options summarized herein most affectively address COC impacted ground water and residual LNAPL.
The proposed bench and pilot tests discussed above assume that persistent source areas have been eliminated. If it is determined that source areas have been adequately eliminated during the source removal, it is recommended that the bench and pilot tests ensue. If it is determined that source areas remain, it is recommended that additional efforts be implemented to identify the source. Based on knowledge of the MGP processes used during gas production, the locations of process structures as identified in Sanborn drawings and previous reports, and the distribution of MGP residuals currently known, additional test pits have been recommended in strategic locations as a contingency; to be completed in conjunction with source removal activities. If further source assessment is warranted, additional measures including additional borings using traditional methods, test pitting in target areas, and screening using Tar‐specific green optical screening tool (TarGOST) or laser induced fluorescence (LIF) may be recommended.
Comment:
The RWAP states on Page 4‐1: “it is anticipated that the 2012 MGP source removal activities will significantly reduce LNAPL accumulation in monitoring well MW‐001, therefore direct LNAPL remediation, other than periodic monitoring and removal (if necessary) is not included in this RAWP”.
o It is expected that LNAPL near MW‐001 will be addressed during soil excavation activities, however at the very minimum a contingency plan is necessary to address any residual LNAPL at the Site if remedial activities fail to address the entire plume.
Response:
Please see previous response. Further, if residual LNAPL is determined not to emanate from a source, yet still accumulate in sufficient quantities such that ISCO would be ineffective, installation of an automated passive or active free product recovery system may also be recommended. It should be noted that the results of the bail down test completed on monitoring well MW‐001 indicated that product did not accumulate rapidly enough to warrant the expense of an active recovery system.
Comment:
o Additional delineation of the LNAPL plume may be necessary if LNAPL remains after remedial activities. This may also include a laser induced fluorescence (LIF) investigation.
Response:
Please see previous response. Currently test pits are proposed. If further source assessment is warranted, additional measures including additional borings using traditional methods, test pitting in target areas, and screening using TarGOST or LIF may be recommended.
Comment:
The Site will need additional monitoring wells to evaluate the plume and progress of degradation on Site and off Site. Chemical oxidations can enhance mass transfer of contaminants and may allow contaminant mobilization outside the monitoring area. A contingency plan will also be required which details the response to adverse contaminant mobilization.
Response:
Additional ground water monitoring wells will be installed as needed to provide adequate monitoring points for ISCO pilot testing. These wells can be utilized to monitor changes in ground water elevation and flow characteristics and to evaluate contaminant mobilization outside of the treatment areas during pilot testing. As with other pilot test parameters, this information will be incorporated into the full scale remedial design to minimize contaminant mobilization.
In addition to pilot test support, additional monitoring wells will be required to monitor the
plume changes during full scale remedial activities. These wells should be installed in the center
of the plume, to the west of the apex of the plume and along the north and south flanks of the
plume as depicted in Figure 7 of the RAWP. Further, AECOM recommends re‐installation of
onsite monitoring wells MW‐002 and MW‐004 after the completion of source removal activities.

Attachment A ‐ RegenOx© Design Parameters
Budgetary Proposal for Site Remedy
To: Brooks Bertl: AECOM Date:From: Barry Poling-Central US Regional Manager
[email protected] 812-923-7999
Subject: Preliminary Design and Cost Estimate Proposal
Site: City of Richmond: Budgetary EstimateRichmond, IN
Treatment Unit: Dissolved Phase: Pilot Test and Full Scale Application
Applicable Products Links to View/Download Product Information Packaging Available
RegenOx® RegenOx Part A - 50 lb bags; Part B - 30 lb pails or 400-lb drums ORC Advanced® ORC Advanced 40 lb bags, 25-lb pails or 250-lb fiber drums
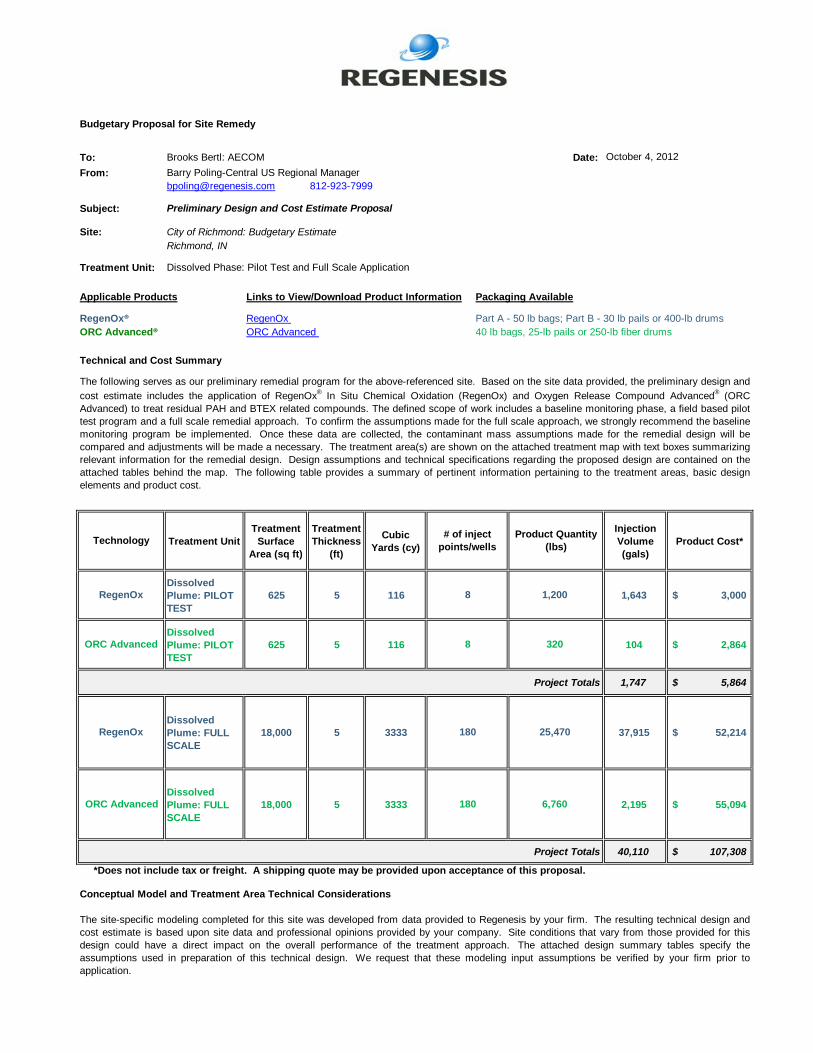
Technical and Cost Summary
Treatment Unit Treatment
Surface Area (sq ft)
Treatment Thickness
(ft)
Cubic Yards (cy)
Injection Volume (gals)
Product Cost*
Dissolved Plume: PILOT TEST
625 5 116 1,643 3,000$
Dissolved Plume: PILOT TEST
625 5 116 104 2,864$
Project Totals 1,747 5,864$
Dissolved Plume: FULL SCALE
18,000 5 3333 37,915 52,214$
Dissolved Plume: FULL SCALE
18,000 5 3333 2,195 55,094$
Project Totals 40,110 107,308$
Conceptual Model and Treatment Area Technical Considerations
The site-specific modeling completed for this site was developed from data provided to Regenesis by your firm. The resulting technical design andcost estimate is based upon site data and professional opinions provided by your company. Site conditions that vary from those provided for thisdesign could have a direct impact on the overall performance of the treatment approach. The attached design summary tables specify theassumptions used in preparation of this technical design. We request that these modeling input assumptions be verified by your firm prior toapplication.
6,760
October 4, 2012
The following serves as our preliminary remedial program for the above-referenced site. Based on the site data provided, the preliminary design and
cost estimate includes the application of RegenOx® In Situ Chemical Oxidation (RegenOx) and Oxygen Release Compound Advanced® (ORCAdvanced) to treat residual PAH and BTEX related compounds. The defined scope of work includes a baseline monitoring phase, a field based pilottest program and a full scale remedial approach. To confirm the assumptions made for the full scale approach, we strongly recommend the baselinemonitoring program be implemented. Once these data are collected, the contaminant mass assumptions made for the remedial design will becompared and adjustments will be made a necessary. The treatment area(s) are shown on the attached treatment map with text boxes summarizingrelevant information for the remedial design. Design assumptions and technical specifications regarding the proposed design are contained on theattached tables behind the map. The following table provides a summary of pertinent information pertaining to the treatment areas, basic designelements and product cost.
# of inject points/wells
180
180
Technology
RegenOx
ORC Advanced
ORC Advanced 8 320
RegenOx 8 1,200
Product Quantity (lbs)
25,470
*Does not include tax or freight. A shipping quote may be provided upon acceptance of this proposal.
10/4/2012 Page 2 of 2
Application Guidance
Our review of the site data indicates there is a significant amount of hydrocarbon contaminant mass present in the target treatment zone. RegenOxis an advanced chemical oxidation technology that destroys contaminants through powerful, yet controlled chemical reactions. This productmaximizes in situ performance while using a solid alkaline oxidant that employs a sodium percarbonate complex with a multi-part catalytic formula.RegenOx directly oxidizes contaminants while its unique catalytic component generates a range of highly oxidizing free radicals that rapidly andeffectively destroy a range of target contaminants including both petroleum hydrocarbons and chlorinated compounds. More technical information onRegenOx can be found by following the web link below the subject line of this document.
Field Based Pilot Test
To further qualify the full scale application of RegenOx and ORC-Advanced, a remedial design for a field based pilot has been included. The goal of the pilot will be to demonstrate the effectiveness of RegenOx within the pilot test area. The post application monitoring parameters included in this document should be included to measure post application performance. We recommend soil and groundwater samples be collected following the 3rd RegenOx event as it's not uncommon to see increasing in dissolved phase concentrations between the 1st and 2nd application. While we are proposing an application of ORC-Advanced as part of the pilot test, the slow release nature of this material makes it difficult to monitor on a short term basis. If the effectiveness of ORC-Advanced needs to be evaluated at this site, we will be happy to work with you to develop a reasonable monitoring plan to fit the project goals.
ORC-A App Inst
Direct push drilling rods are advanced to target depth. Reagent is injected through rods, under pressure, as they are withdrawn.
RegenOx is applied as a high-volume liquid consisting of the oxidant (Part A) and the catalyst (Part B) mixed with water to form a powerful and safesolution. Typical solution application rates are in the range of 5% oxidant-in-solution (as proposed here). Almost all ISCO projects regardless ofreagent require multiple injection events to deplete contaminant mass in high-concentration source areas. Multiple applications of chemical oxidantsare typically required for two reasons: 1) high-concentration source areas typically contain too much contaminant mass to overcome with a singleapplication of any oxidant, and 2) aquifers will “accept” a limited volume of fluid during a single injection event. This fluid volume limit (equivalent to 2-10% total porosity per event at most sites) is typically lower than the oxidant volume required to achieve adequate distribution and deliver a sufficientmass of oxidant to overcome contaminant demand. Testing of the fluid acceptance rates within the treatment zone, using clear water, may benecessary to confirm the per-point fluid injection rates proposed here.
Direct Push Injection
Application Method Instructions
We are recommending these products be applied in situ, either sequentially, RegenOx followed by ORC Advanced or, simultaneously during the finalRegenOx injection event. These materials are typically applied using a direct push technology (DPT) injection method as proposed here. It isimportant that the materials be applied per the design, including material loading rates and injection point spacing specified, to the extent siteconditions allow. A brief description of the application method is provided below along with link(s) to application instructions for these product(s).
Description
RegenOx App Inst
Product Description and Use Rationale
One of the key benefits of RegenOx is that it quickly creates aerobic conditions and makes more contaminants bioavailable. This effect can oftenresult in an increase in microbial populations following injection, including aerobes. The oxygen from RegenOx will typically dissipate in a few weeksas it is utilized in oxidation reactions. Generally speaking, it is desirable to sustain these aerobic conditions when treating aerobically degradablecontaminants (e.g., fuel hydrocarbons) when it is suspected that dissolved-phase contamination may persist following a chemical oxidationapplication. For this reason we are also proposing application of ORC Advanced to sustain a source of oxygen and facilitate long-term aerobicbioremediation of residual contaminants. ORC Advanced contains 17% oxygen by weight and will provide a controlled release of oxygen to thesubsurface for approximately 9 to 12 months.
Baseline Monitoring Program
As indicated above, the recommended dosage was based upon data provided to us for review. Prior to implementation of this scope of work werecommend a baseline round of soil and groundwater samples be collected to confirm the assumptions of this plan. Our recommended list of preand post application monitoring parameters has been included for reference. Once these parameters have been collected, please submit to us forour review. Revisions to our approach will be made if necessary.
10/4/2012 Page 3 of 3
• Specific experience injecting the reagent proposed
• of the appropriate injection pump (type, pressure rating, flow rate, etc)
• Use of in-line flow meters and pressure gauges
• In-line safety values for bleeding high pressure from injection lines
• Injection tooling for bottom up or top down application
• Other project specific tooling (i.e. air compressor)
• Distribution monitoring during injection
REGENESIS REMEDIATION SERVICES
ORC Advanced Full Scale Design CalculationsRecommended Feasibility and Performance Monitoring Procedures for RegenOx ProductsREGENESIS Remediation Services (RRS) Information
Enclosures
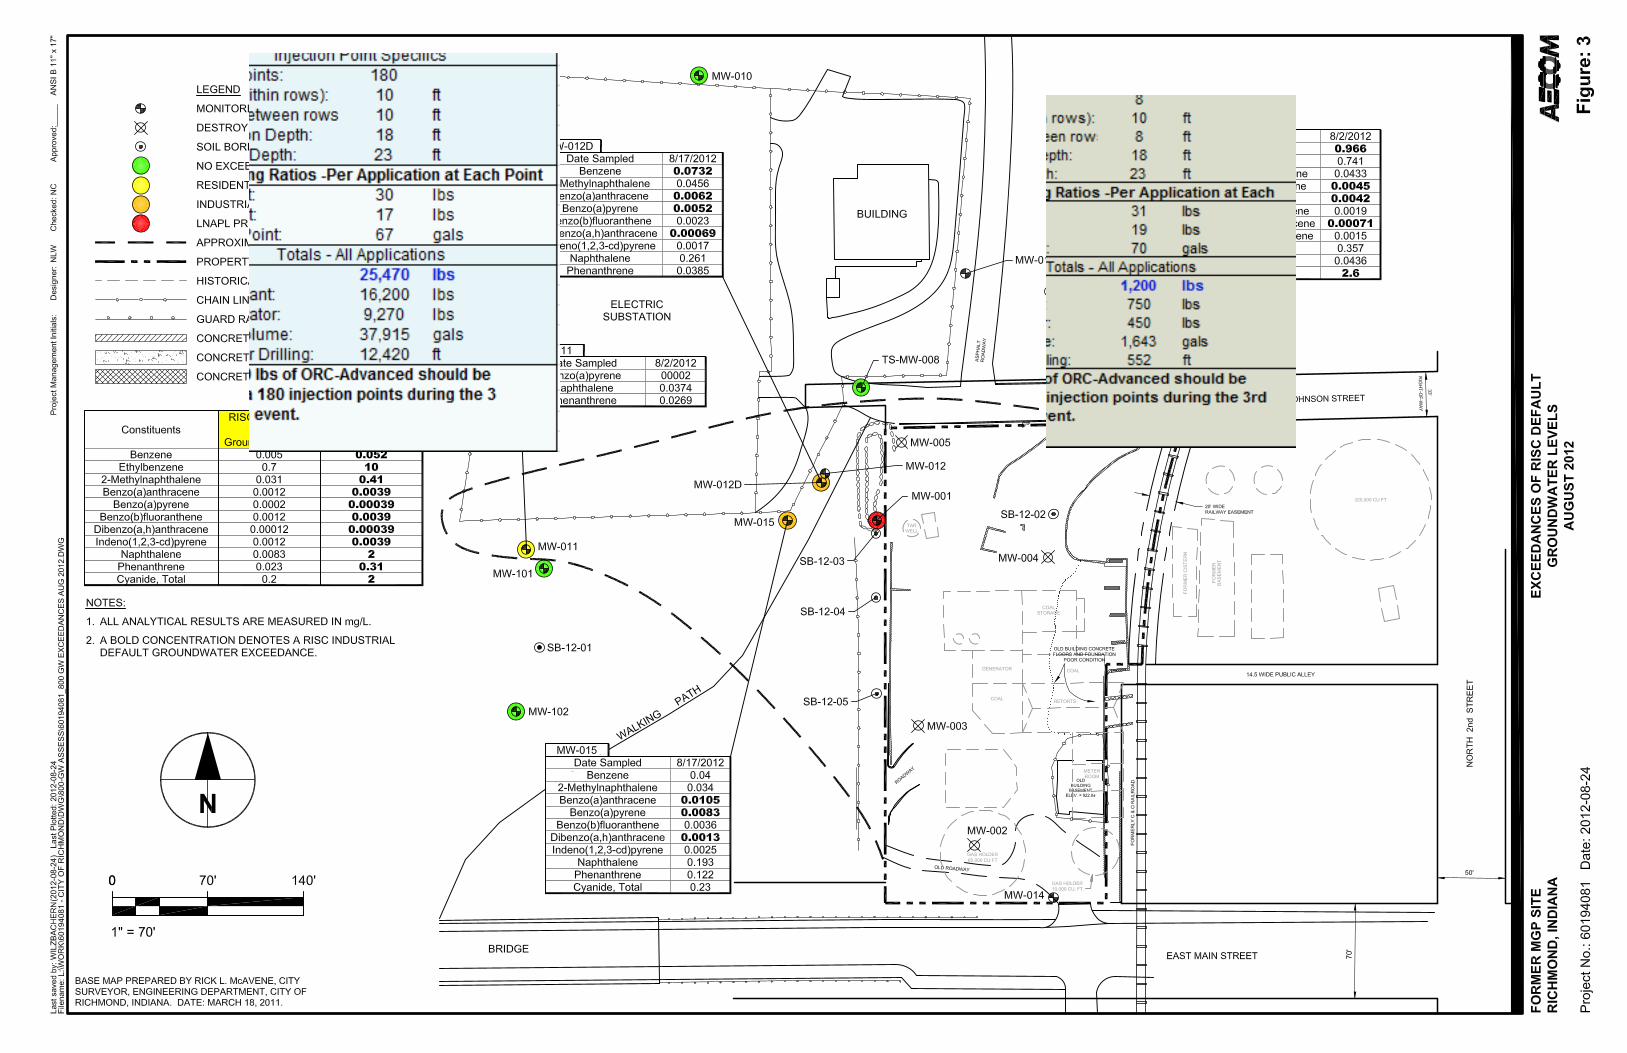
Site Map with Defined Treatment Area
RegenOx Pilot Test Design Calculations
ORC Advanced Pilot Test Design Calculations
RegenOx Full Scale Design Calculations
Closing
Please feel free to contact me if you need additional information or have any questions regarding our evaluation and/or this correspondence (contactinfo provided above). I will be following up with you in the near future regarding this proposal. We appreciate the opportunity and thank you forconsidering Regenesis as your remedial solution provider for this project.
REGENESIS now offers turn key injection services for our products Remediation Services Division (RRS). As part of this proposal we have included information on our services division which provides turn-key injections services to complement our technologies. If you would like us to provide you with costs to perform this service please contact me and we'll be happy to provide this information.
Given the complexities associated with applications, we suggest a commended that a contractor with proven experience mixing and injecting theremediation products proposed for this project. As part of the selection process, it is suggested to question the application contractor on the following:
The contractor should provide a detailed log of field activities for the application process. This information is critical to the post-injection assessmentof remediation performance across the site.
BattenhouseC
Rectangle
BPoling
Stamp
BPoling
Stamp
BPoling
Rectangle
BPoling
Line
BPoling
Line
Date:
Site Name:
Treatment Area Location:
Consultant/Contact:
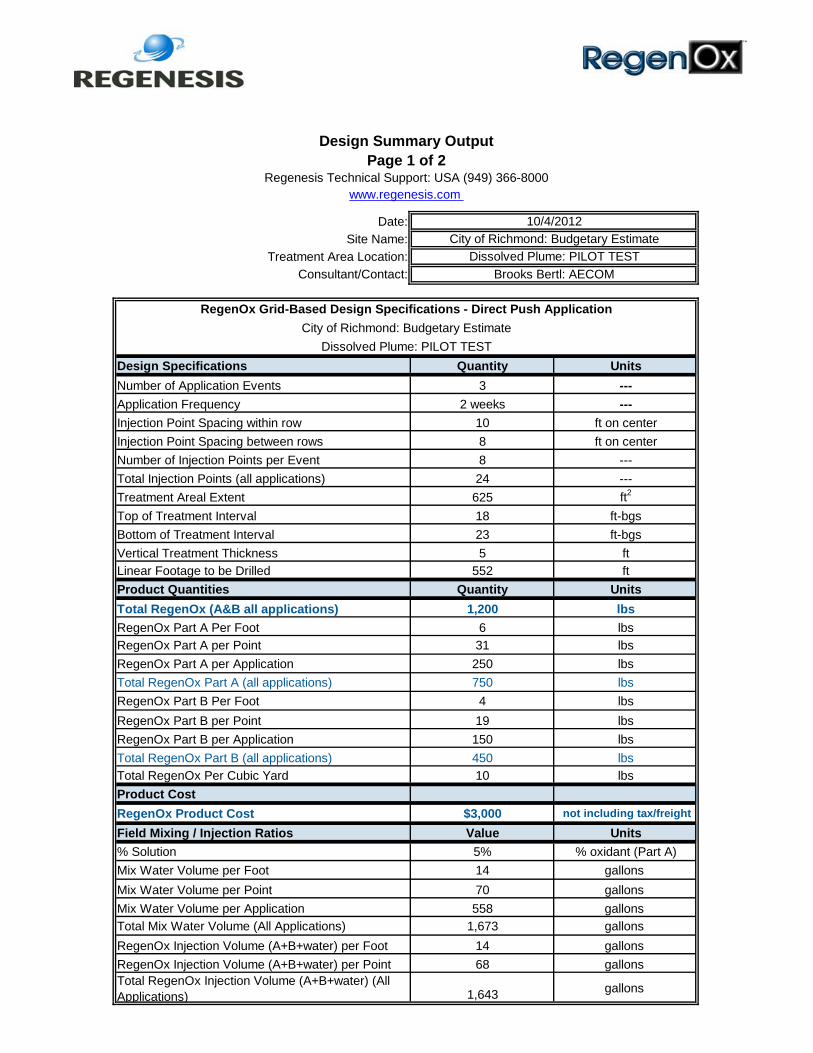
Design Specifications Quantity UnitsNumber of Application Events 3 ---Application Frequency 2 weeks ---Injection Point Spacing within row 10 ft on center
Injection Point Spacing between rows 8 ft on center
Number of Injection Points per Event 8 ---
Total Injection Points (all applications) 24 ---
Treatment Areal Extent 625 ft2
Top of Treatment Interval 18 ft-bgs
Bottom of Treatment Interval 23 ft-bgs
Vertical Treatment Thickness 5 ft
Linear Footage to be Drilled 552 ft
Product Quantities Quantity UnitsTotal RegenOx (A&B all applications) 1,200 lbsRegenOx Part A Per Foot 6 lbs
RegenOx Part A per Point 31 lbs
RegenOx Part A per Application 250 lbs
Total RegenOx Part A (all applications) 750 lbs
RegenOx Part B Per Foot 4 lbs
RegenOx Part B per Point 19 lbs
RegenOx Part B per Application 150 lbs
Total RegenOx Part B (all applications) 450 lbs
Total RegenOx Per Cubic Yard 10 lbs
Product CostRegenOx Product Cost $3,000 not including tax/freight
Field Mixing / Injection Ratios Value Units% Solution 5% % oxidant (Part A)
Mix Water Volume per Foot 14 gallons
Mix Water Volume per Point 70 gallons
Mix Water Volume per Application 558 gallons
Total Mix Water Volume (All Applications) 1,673 gallons
RegenOx Injection Volume (A+B+water) per Foot 14 gallons
RegenOx Injection Volume (A+B+water) per Point 68 gallons Total RegenOx Injection Volume (A+B+water) (All Applications) 1,643 gallons
Design Summary OutputPage 1 of 2
Regenesis Technical Support: USA (949) 366-8000www.regenesis.com
10/4/2012
City of Richmond: Budgetary Estimate
Dissolved Plume: PILOT TEST
Brooks Bertl: AECOM
RegenOx Grid-Based Design Specifications - Direct Push ApplicationCity of Richmond: Budgetary Estimate
Dissolved Plume: PILOT TEST
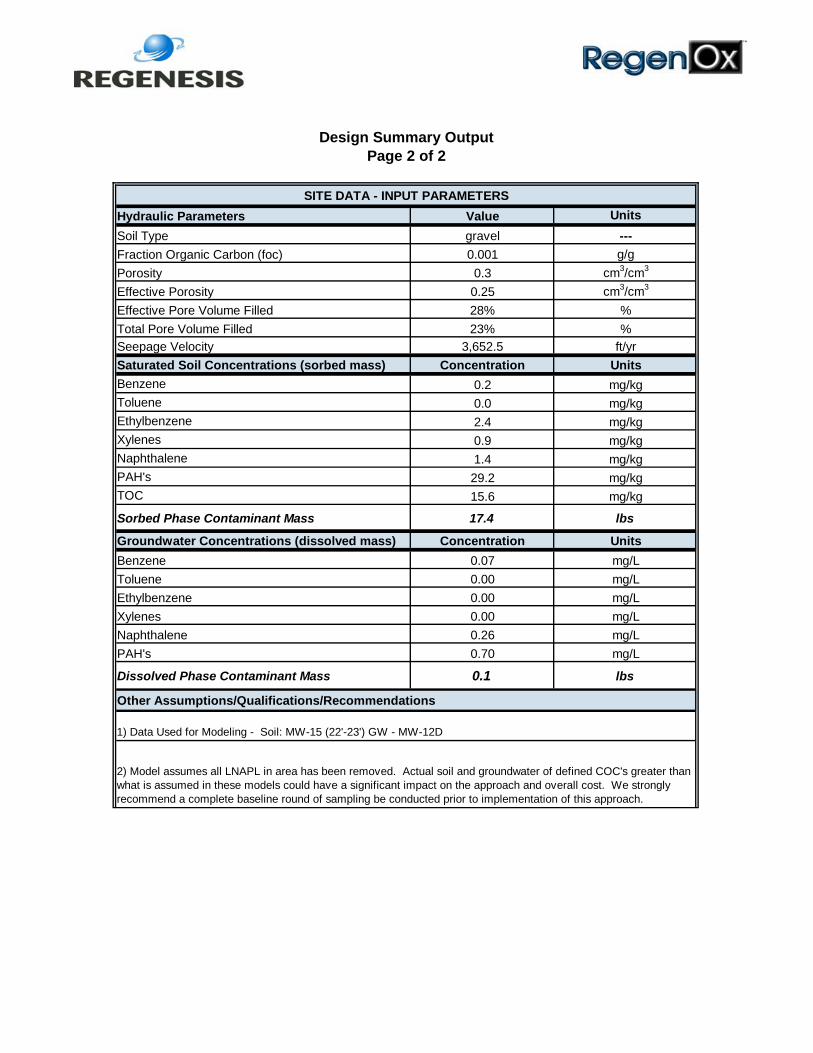
SITE DATA - INPUT PARAMETERSHydraulic Parameters Value UnitsSoil Type gravel ---Fraction Organic Carbon (foc) 0.001 g/g
Porosity 0.3 cm3/cm3
Effective Porosity 0.25 cm3/cm3
Effective Pore Volume Filled 28% %
Total Pore Volume Filled 23% %
Seepage Velocity 3,652.5 ft/yr
Saturated Soil Concentrations (sorbed mass) Concentration UnitsBenzene 0.2 mg/kg
Toluene 0.0 mg/kg
Ethylbenzene 2.4 mg/kg
Xylenes 0.9 mg/kg
Naphthalene 1.4 mg/kg
PAH's 29.2 mg/kg
TOC 15.6 mg/kg
Sorbed Phase Contaminant Mass 17.4 lbs
Groundwater Concentrations (dissolved mass) Concentration UnitsBenzene 0.07 mg/L
Toluene 0.00 mg/L
Ethylbenzene 0.00 mg/L
Xylenes 0.00 mg/L
Naphthalene 0.26 mg/L
PAH's 0.70 mg/L
Dissolved Phase Contaminant Mass 0.1 lbs
Other Assumptions/Qualifications/Recommendations
Design Summary OutputPage 2 of 2
1) Data Used for Modeling - Soil: MW-15 (22'-23') GW - MW-12D
2) Model assumes all LNAPL in area has been removed. Actual soil and groundwater of defined COC's greater than what is assumed in these models could have a significant impact on the approach and overall cost. We strongly recommend a complete baseline round of sampling be conducted prior to implementation of this approach.

Date:
Site Name:
Location:
Consultant (Firm/Name):
Design Specifications Quantity Units
Treatment Area Size 625 ft2
Depth to Top Treatment Interval 18 ft
Depth to Bottom Treatment Interval 23 ft
Vertical Treatment Thickness 5 ft
Number of Injection Points 8 ---
Injection Point Spacing (within rows) 8 ft on center
Injection Point Spacing (between rows) 10 ft on center
Total Linear Drilling 184 ft
Product Quantities Quantity UnitsORC Advanced per Foot 7.5 lbs
ORC Advanced per Point 40 lbsTotal ORC Advanced 320 lbs
ORC Advanced Cost $2,864 not including tax/freight
Field Mixing/Injection Ratios UnitsORC Advanced Slurry % 30% %
Mixing Water per Foot 2.2 gallons
Mixing Water per Point 11 gallons
Total Water for Mixing 90 gallons
Injection Slurry (Water + ORC-A) per Foot 2.6 gallons
Injection Slurry (Water + ORC-A) per Point 13 gallons
Total Injection Slurry (all Points) 104 gallons
City of Richmond: Budgetary Estimate
Design Summary OutputPage 1 of 2
Regenesis Technical Support: USA (949) 366-8000
www.regenesis.com
10/4/2012
Dissolved Plume: PILOT TEST
Brooks Bertl: AECOM
ORC Advanced Grid Design SpecificationsCity of Richmond: Budgetary Estimate
Dissolved Plume: PILOT TEST
Product Cost
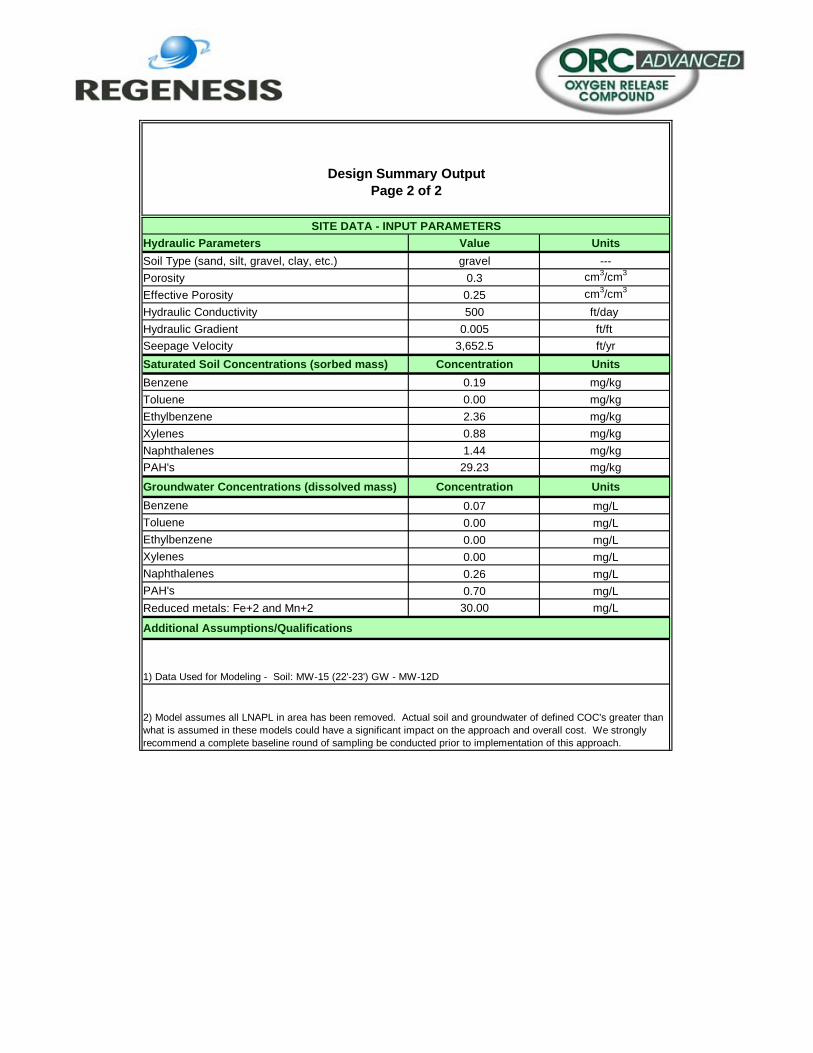
SITE DATA - INPUT PARAMETERSHydraulic Parameters Value UnitsSoil Type (sand, silt, gravel, clay, etc.) gravel ---
Porosity 0.3 cm3/cm3
Effective Porosity 0.25 cm3/cm3
Hydraulic Conductivity 500 ft/day
Hydraulic Gradient 0.005 ft/ft
Seepage Velocity 3,652.5 ft/yr
Saturated Soil Concentrations (sorbed mass) Concentration UnitsBenzene 0.19 mg/kg
Toluene 0.00 mg/kg
Ethylbenzene 2.36 mg/kg
Xylenes 0.88 mg/kg
Naphthalenes 1.44 mg/kg
PAH's 29.23 mg/kg
Groundwater Concentrations (dissolved mass) Concentration UnitsBenzene 0.07 mg/L
Toluene 0.00 mg/L
Ethylbenzene 0.00 mg/L
Xylenes 0.00 mg/L
Naphthalenes 0.26 mg/L
PAH's 0.70 mg/L
Reduced metals: Fe+2 and Mn+2 30.00 mg/L
Additional Assumptions/Qualifications
Design Summary OutputPage 2 of 2
1) Data Used for Modeling - Soil: MW-15 (22'-23') GW - MW-12D
2) Model assumes all LNAPL in area has been removed. Actual soil and groundwater of defined COC's greater than what is assumed in these models could have a significant impact on the approach and overall cost. We strongly recommend a complete baseline round of sampling be conducted prior to implementation of this approach.
Date:
Site Name:
Treatment Area Location:
Consultant/Contact:
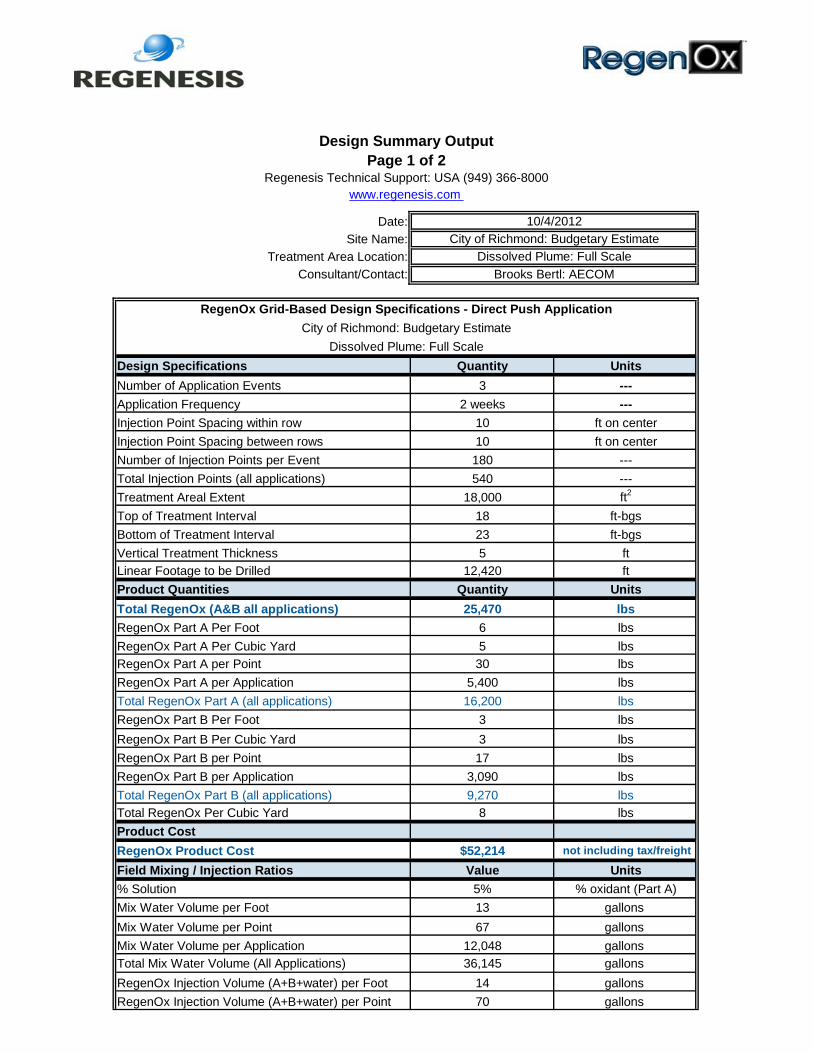
Design Specifications Quantity UnitsNumber of Application Events 3 ---Application Frequency 2 weeks ---Injection Point Spacing within row 10 ft on center
Injection Point Spacing between rows 10 ft on center
Number of Injection Points per Event 180 ---
Total Injection Points (all applications) 540 ---
Treatment Areal Extent 18,000 ft2
Top of Treatment Interval 18 ft-bgs
Bottom of Treatment Interval 23 ft-bgs
Vertical Treatment Thickness 5 ft
Linear Footage to be Drilled 12,420 ft
Product Quantities Quantity UnitsTotal RegenOx (A&B all applications) 25,470 lbsRegenOx Part A Per Foot 6 lbs
RegenOx Part A Per Cubic Yard 5 lbs
RegenOx Part A per Point 30 lbs
RegenOx Part A per Application 5,400 lbs
Total RegenOx Part A (all applications) 16,200 lbs
RegenOx Part B Per Foot 3 lbs
RegenOx Part B Per Cubic Yard 3 lbs
RegenOx Part B per Point 17 lbs
RegenOx Part B per Application 3,090 lbs
Total RegenOx Part B (all applications) 9,270 lbs
Total RegenOx Per Cubic Yard 8 lbs
Product CostRegenOx Product Cost $52,214 not including tax/freight
Field Mixing / Injection Ratios Value Units% Solution 5% % oxidant (Part A)
Mix Water Volume per Foot 13 gallons
Mix Water Volume per Point 67 gallons
Mix Water Volume per Application 12,048 gallons
Total Mix Water Volume (All Applications) 36,145 gallons
RegenOx Injection Volume (A+B+water) per Foot 14 gallons
RegenOx Injection Volume (A+B+water) per Point 70 gallons
10/4/2012
City of Richmond: Budgetary Estimate
Dissolved Plume: Full Scale
Brooks Bertl: AECOM
RegenOx Grid-Based Design Specifications - Direct Push ApplicationCity of Richmond: Budgetary Estimate
Dissolved Plume: Full Scale
Design Summary OutputPage 1 of 2
Regenesis Technical Support: USA (949) 366-8000www.regenesis.com
Total RegenOx Injection Volume (A+B+water) (All Applications) 37,915 gallons
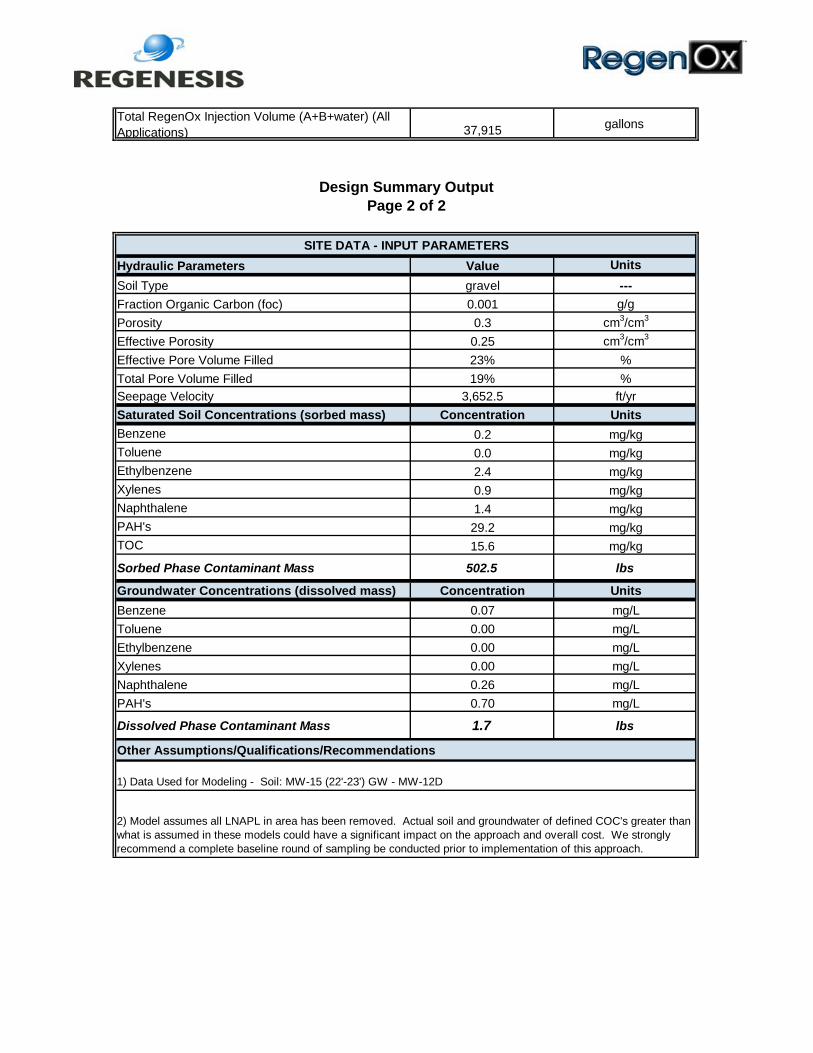
SITE DATA - INPUT PARAMETERSHydraulic Parameters Value UnitsSoil Type gravel ---Fraction Organic Carbon (foc) 0.001 g/g
Porosity 0.3 cm3/cm3
Effective Porosity 0.25 cm3/cm3
Effective Pore Volume Filled 23% %
Total Pore Volume Filled 19% %
Seepage Velocity 3,652.5 ft/yr
Saturated Soil Concentrations (sorbed mass) Concentration UnitsBenzene 0.2 mg/kg
Toluene 0.0 mg/kg
Ethylbenzene 2.4 mg/kg
Xylenes 0.9 mg/kg
Naphthalene 1.4 mg/kg
PAH's 29.2 mg/kg
TOC 15.6 mg/kg
Sorbed Phase Contaminant Mass 502.5 lbs
Groundwater Concentrations (dissolved mass) Concentration UnitsBenzene 0.07 mg/L
Toluene 0.00 mg/L
Ethylbenzene 0.00 mg/L
Xylenes 0.00 mg/L
Naphthalene 0.26 mg/L
PAH's 0.70 mg/L
Dissolved Phase Contaminant Mass 1.7 lbs
Other Assumptions/Qualifications/Recommendations
1) Data Used for Modeling - Soil: MW-15 (22'-23') GW - MW-12D
2) Model assumes all LNAPL in area has been removed. Actual soil and groundwater of defined COC's greater than what is assumed in these models could have a significant impact on the approach and overall cost. We strongly recommend a complete baseline round of sampling be conducted prior to implementation of this approach.
Page 2 of 2Design Summary Output
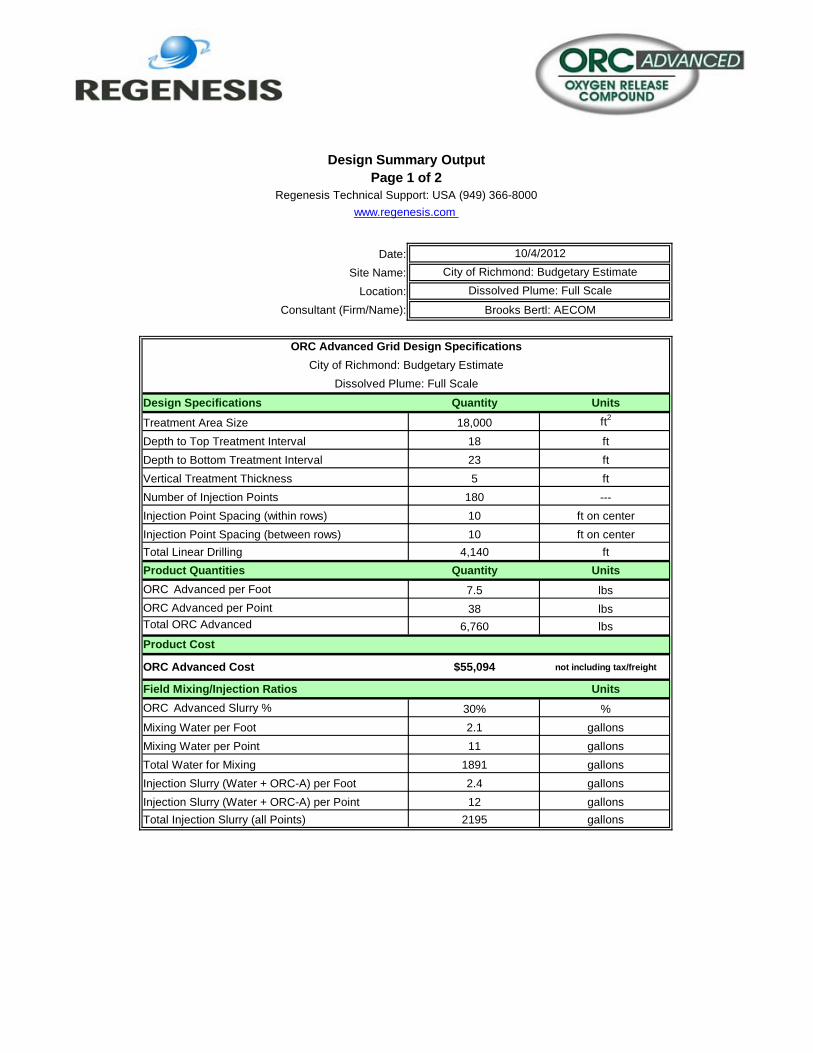
Date:
Site Name:
Location:
Consultant (Firm/Name):
Design Specifications Quantity Units
Treatment Area Size 18,000 ft2
Depth to Top Treatment Interval 18 ft
Depth to Bottom Treatment Interval 23 ft
Vertical Treatment Thickness 5 ft
Number of Injection Points 180 ---
Injection Point Spacing (within rows) 10 ft on center
Injection Point Spacing (between rows) 10 ft on center
Total Linear Drilling 4,140 ft
Product Quantities Quantity UnitsORC Advanced per Foot 7.5 lbs
ORC Advanced per Point 38 lbsTotal ORC Advanced 6,760 lbs
ORC Advanced Cost $55,094 not including tax/freight
Field Mixing/Injection Ratios UnitsORC Advanced Slurry % 30% %
Mixing Water per Foot 2.1 gallons
Mixing Water per Point 11 gallons
Total Water for Mixing 1891 gallons
Injection Slurry (Water + ORC-A) per Foot 2.4 gallons
Injection Slurry (Water + ORC-A) per Point 12 gallons
Total Injection Slurry (all Points) 2195 gallons
Design Summary OutputPage 1 of 2
Regenesis Technical Support: USA (949) 366-8000
www.regenesis.com
10/4/2012
City of Richmond: Budgetary Estimate
Dissolved Plume: Full Scale
Brooks Bertl: AECOM
ORC Advanced Grid Design SpecificationsCity of Richmond: Budgetary Estimate
Dissolved Plume: Full Scale
Product Cost

SITE DATA - INPUT PARAMETERSHydraulic Parameters Value UnitsSoil Type (sand, silt, gravel, clay, etc.) gravel ---
Porosity 0.3 cm3/cm3
Effective Porosity 0.25 cm3/cm3
Hydraulic Conductivity 500 ft/day
Hydraulic Gradient 0.005 ft/ft
Seepage Velocity 3,652.5 ft/yr
Saturated Soil Concentrations (sorbed mass) Concentration UnitsBenzene 0.19 mg/kg
Toluene 0.00 mg/kg
Ethylbenzene 2.36 mg/kg
Xylenes 0.88 mg/kg
Naphthalenes 1.44 mg/kg
PAH's 29.23 mg/kg
Groundwater Concentrations (dissolved mass) Concentration UnitsBenzene 0.07 mg/L
Toluene 0.00 mg/L
Ethylbenzene 0.00 mg/L
Xylenes 0.00 mg/L
Naphthalenes 0.26 mg/L
PAH's 0.70 mg/L
Reduced metals: Fe+2 and Mn+2 30.00 mg/L
Additional Assumptions/Qualifications
Design Summary Output
1) Data Used for Modeling - Soil: MW-15 (22'-23') GW - MW-12D
2) Model assumes all LNAPL in area has been removed. Actual soil and groundwater of defined COC's greater than what is assumed in these models could have a significant impact on the approach and overall cost. We strongly recommend a complete baseline round of sampling be conducted prior to implementation of this approach.
Page 2 of 2
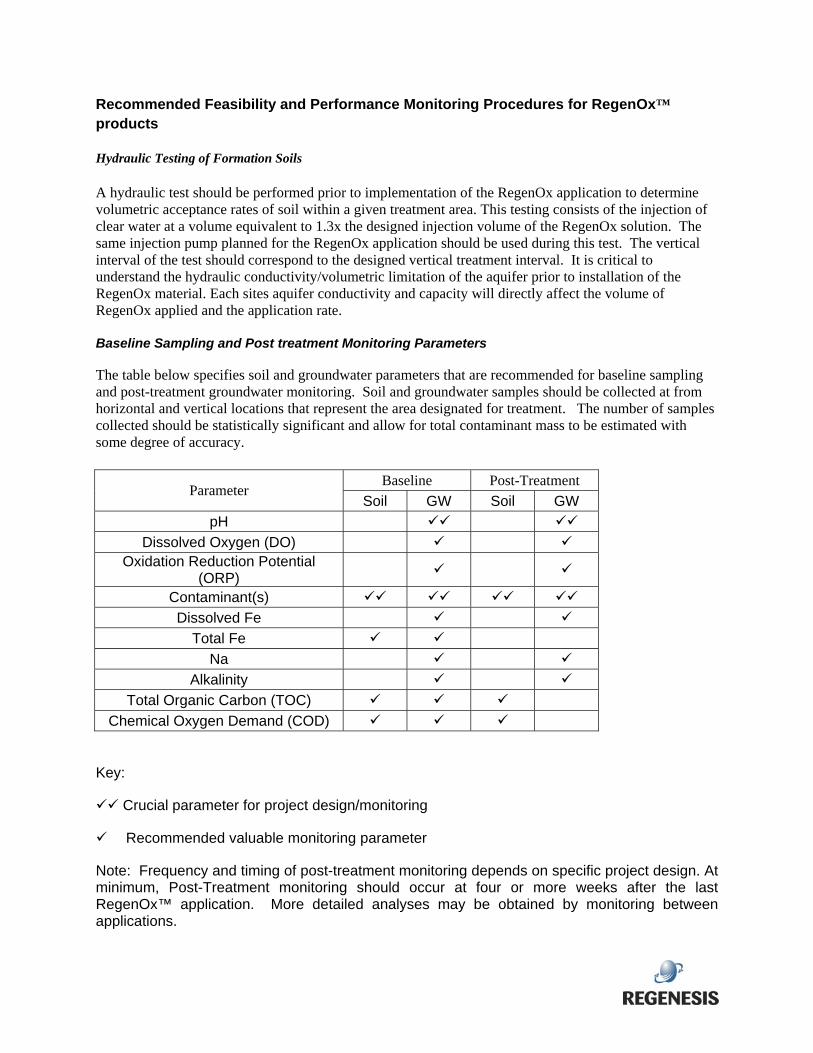
Recommended Feasibility and Performance Monitoring Procedures for RegenOx™ products
Hydraulic Testing of Formation Soils A hydraulic test should be performed prior to implementation of the RegenOx application to determine volumetric acceptance rates of soil within a given treatment area. This testing consists of the injection of clear water at a volume equivalent to 1.3x the designed injection volume of the RegenOx solution. The same injection pump planned for the RegenOx application should be used during this test. The vertical interval of the test should correspond to the designed vertical treatment interval. It is critical to understand the hydraulic conductivity/volumetric limitation of the aquifer prior to installation of the RegenOx material. Each sites aquifer conductivity and capacity will directly affect the volume of RegenOx applied and the application rate. Baseline Sampling and Post treatment Monitoring Parameters
The table below specifies soil and groundwater parameters that are recommended for baseline sampling and post-treatment groundwater monitoring. Soil and groundwater samples should be collected at from horizontal and vertical locations that represent the area designated for treatment. The number of samples collected should be statistically significant and allow for total contaminant mass to be estimated with some degree of accuracy.
Baseline Post-Treatment Parameter
Soil GW Soil GW
pH
Dissolved Oxygen (DO) Oxidation Reduction Potential
(ORP)
Contaminant(s)
Dissolved Fe
Total Fe
Na
Alkalinity
Total Organic Carbon (TOC)
Chemical Oxygen Demand (COD)
Key:
Crucial parameter for project design/monitoring
Recommended valuable monitoring parameter
Note: Frequency and timing of post-treatment monitoring depends on specific project design. At minimum, Post-Treatment monitoring should occur at four or more weeks after the last RegenOx™ application. More detailed analyses may be obtained by monitoring between applications.
2830 Garden Drive • Lisle, IL 60532 • Tel: 630.319.0836 [email protected] • www.regenesis.com
REGENESIS Remediation Services (RRS) Offers best-of-class environmental contracting services for the treatment of contaminated
soil and groundwater. Division of REGENESIS Regenesis, a global leader in the development of advanced in situ remediation technologies, has been actively involved in the successful treatment of over 16,000 subsurface remediation projects. In response to client demand REGNEESIS formed its RRS Division to directly manage the implementation of remediation technologies serving environmental consulting firms involved in groundwater and soil cleanup. Services Provided RRS actively manages applications of in situ remediation technologies. A significant component of this service includes performing real-time field diagnostic tests to assess the subsurface distribution and influence of the remediation chemistry. This information allows RRS to closely monitor the application process and modify the injection plan, as needed, to ensure optimal influence and distribution. These factors directly relate to performance of all in situ remediation technologies. RRS will staff your project with experienced professionals that are completely familiar with your remedial design and performance objectives. Knowledgeable, Experienced Staff No one has a greater vested interest in the success of our remediation designs than RRS. An accurate remediation design using the proper chemistry and appropriate dosage can fail to show good performance if the intended dose of reagents is not adequately distributed throughout the target treatment zone. A few factors that cause poor distribution or influence are:
- variable stratigraphy
- differences in mobile porosity versus effective porosity
- remediation chemistry’s affect on subsurface geochemistry
- injection tooling
- pump flow rate and pressure
Dedicated, Proprietary Equipment RRS injection trailers are enclosed units that contain the equipment needed to safely handle, prepare, and deliver remediation chemistries at the specified dosage rate. Typical application methods are soil mixing or subsurface injection through fixed wells or direct push points. A proprietary injection manifold system allows us to control the dosage of the remediation chemistry to multiple injection wells or direct push locations simultaneously.
[email protected] • www.regenesis.com • 1512 Northfield Drive Georgetown, IN 47122 • Tel: 812.923.7999
2
The injection trailer is staffed by experienced project scientists that perform the field diagnostic testing, evaluate the data, and implement modifications to the injection plan as required. RRS Reporting Upon completion of the project, RRS will submit an Application Summary Report. This report will contain information on: injection depths, quantities of reagent(s) applied, elapsed time, injection pressures/flow rates at depth, surfacing of material, and other noteworthy field observations for each injection point. This information is essential to evaluate and manage distribution of the remediation chemistry during the injection event and will also improve understanding of subsurface permeability across the vertical and aerial extend of the treatment zone. The recorded information will provide further insight when evaluating long term remediation performance and correlating that with distribution of the remediation chemistry during application.
Contact RRS We urge you to take advantage of our experience of over 17,000 applications. Let RRS ensure you achieve optimal performance on your next remediation project. Contact: Barry Poling Central Region Manager Tel: (812) 923-7999 [email protected] Scott Mullin Division Manager REGENESIS Remediation Services Tel: (630) 319-0836 [email protected]

Attachment B – Regenesis MGP Experience
October 3, 2012 Brooks R. Bertl, P.E., L.P.G. AECOM 8902 Vincennes Circle, Suite D Indianapolis, IN 46268 [email protected] Subject: Successful Use of RegenOx and ORC-Advanced on Manufactured Gas Plant (MGP) sites Dear Mr. Bertl: The purpose of this correspondence is to provide you with documentation demonstrating the successful use of our advanced chemical oxidation system, RegenOx® and our controlled release oxygen compound ORC Advanced® for the treatment of MGP related contaminants in saturated soil and groundwater at your site in Richmond, Indiana. Included in this document you will find a series of case histories similar to the Richmond site in which RegenOx® and ORC® were successful in reducing MGP related contaminants in soils and groundwater. Below, a summary of these case histories has been provided for your reference.
• RegenOx Case History R-7 o Presents bench test data in which RegenOx successful treats a wide range of MGP
related compounds in soil and groundwater resulting in a 70%-92% reduction on the contaminants of concern.
• RegenOx Case History R-5
o Demonstrates a 90% reduction of C19-C36 Aliphatic Hydrocarbons following the injection of RegenOx.
• Passive Remediation of Groundwater Contaminated by Manufactured Gas Plant Residues
o A peer reviewed white paper presented at the Institute of Gas Technology Conference focusing on the use of ORC to address MGP related groundwater contaminants at the Niagara Mohawk MGP site in New York. This technical paper demonstrates successful treatment of naphthalene and related PAH’s following an application of ORC filter socks. The ORC filter socks were applied via treatment wells as a plume management strategy.
• Niagara Mohawk MGP Site
o This document provides a summary to the above referenced technical paper showing actual field data following the ORC filter sock application.
• Pacific Gas & Electric Condensate Cleanup in California
o Provides remedial design information and results of ORC application addressing BTEX, TPH-D and TPH-G impacts in groundwater.
October 3, 2012 2
2
Thanks again for the opportunity to provide you with this information. If there is anything else that can be done to assist you or IDEM regarding this technology approval, don’t hesitate to let me know. If you have any questions, please contact me at 812-923-7999 or at [email protected]. Sincerely,
Barry Poling, CHMM Central US Regional Manager
Case History R-7
All Rights Reserved 2004 Regenesis -1011 Calle Sombra, San Clemente, CA 92673 www.regenesis.com
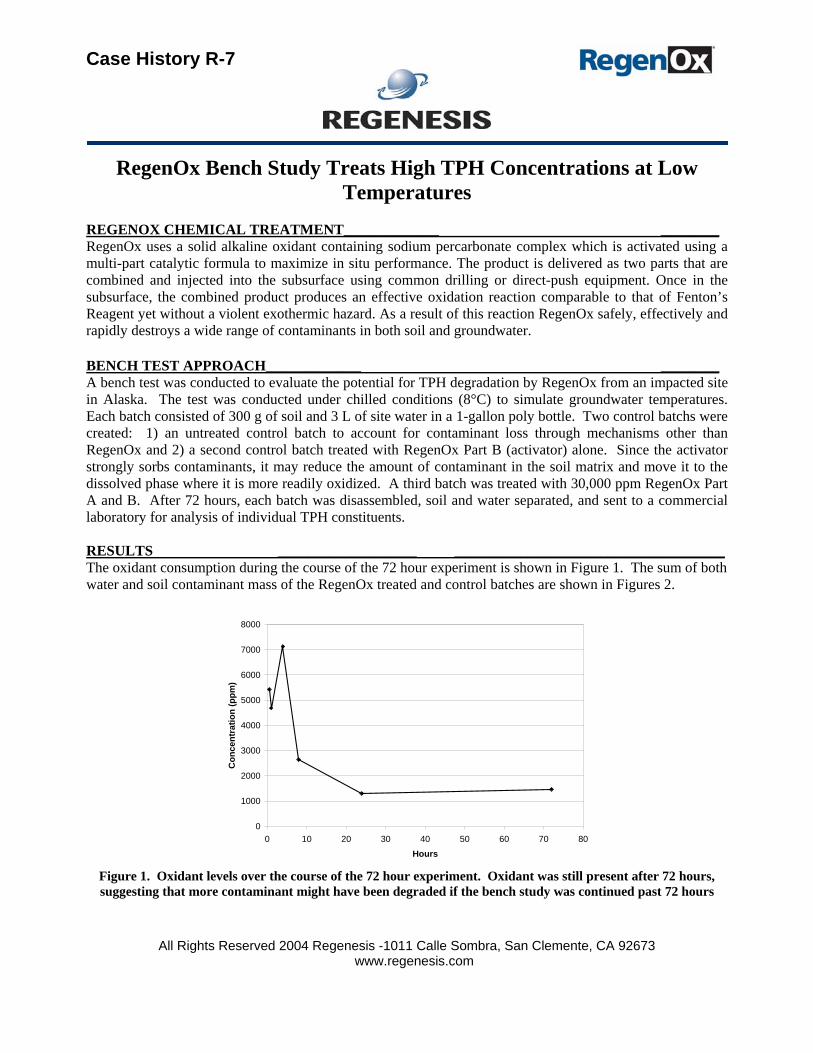
RegenOx Bench Study Treats High TPH Concentrations at Low Temperatures
REGENOX CHEMICAL TREATMENT_____________ ________ RegenOx uses a solid alkaline oxidant containing sodium percarbonate complex which is activated using a multi-part catalytic formula to maximize in situ performance. The product is delivered as two parts that are combined and injected into the subsurface using common drilling or direct-push equipment. Once in the subsurface, the combined product produces an effective oxidation reaction comparable to that of Fenton’s Reagent yet without a violent exothermic hazard. As a result of this reaction RegenOx safely, effectively and rapidly destroys a wide range of contaminants in both soil and groundwater. BENCH TEST APPROACH_____________ ________ A bench test was conducted to evaluate the potential for TPH degradation by RegenOx from an impacted site in Alaska. The test was conducted under chilled conditions (8°C) to simulate groundwater temperatures. Each batch consisted of 300 g of soil and 3 L of site water in a 1-gallon poly bottle. Two control batchs were created: 1) an untreated control batch to account for contaminant loss through mechanisms other than RegenOx and 2) a second control batch treated with RegenOx Part B (activator) alone. Since the activator strongly sorbs contaminants, it may reduce the amount of contaminant in the soil matrix and move it to the dissolved phase where it is more readily oxidized. A third batch was treated with 30,000 ppm RegenOx Part A and B. After 72 hours, each batch was disassembled, soil and water separated, and sent to a commercial laboratory for analysis of individual TPH constituents. RESULTS ___________________ _____________________________________ The oxidant consumption during the course of the 72 hour experiment is shown in Figure 1. The sum of both water and soil contaminant mass of the RegenOx treated and control batches are shown in Figures 2.
0
1000
2000
3000
4000
5000
6000
7000
8000
0 10 20 30 40 50 60 70 80
Hours
Con
cent
ratio
n (p
pm)
Figure 1. Oxidant levels over the course of the 72 hour experiment. Oxidant was still present after 72 hours, suggesting that more contaminant might have been degraded if the bench study was continued past 72 hours
All Rights Reserved 2004 Regenesis -1011 Calle Sombra, San Clemente, CA 92673 www.regenesis.com
Napth
ale
ne
2-M
eth
ylnapth
ale
ne
1-M
eth
ylnapth
ale
ne
Ace
naphth
ylene
Ace
napth
ene
Flu
ore
ne
Phenanth
rene
Anth
race
ne
Flu
ora
nth
ene
Pyr
ene
Benzo
[a]a
nth
race
ne
Chry
sene
Benzo
[a]p
yrene
Indeno[1
,2,3
-cd]p
yrene
Dib
enz(
a,h
)anth
race
ne
Benzo
[g,h
,i]pyr
ene
Benzo
[b]fl
uora
nth
ene
Benzo
[k]fl
uora
nth
ene
DR
O (nC
10-<
nC
25)
RR
O (nC
25-n
C36)
0
1000
2000
3000
4000
5000
6000M
ass
(mg) RegenOx
Activator ControlUntreated
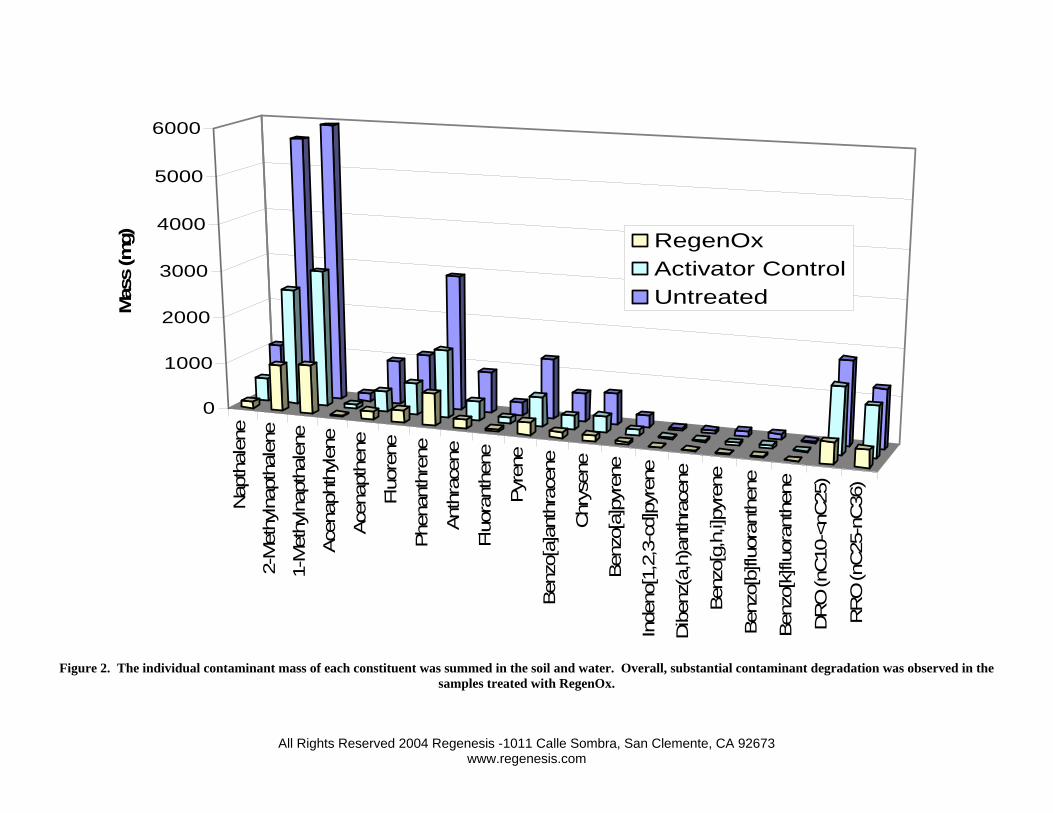
Figure 2. The individual contaminant mass of each constituent was summed in the soil and water. Overall, substantial contaminant degradation was observed in the
samples treated with RegenOx.
All Rights Reserved 2004 Regenesis -1011 Calle Sombra, San Clemente, CA 92673 www.regenesis.com
Constituent % Reduction achieved by
Activator Alone % Reduction Achieved by
RegenOX Napthalene 55.2 85.9
2-Methylnapthalene 55.5 82.1 1-Methylnapthalene 50.4 82.0
Acenaphthylene 45.3 81.8 Acenapthene 52.4 80.3
Fluorene 40.8 76.2 Phenanthrene 49.9 75.9
Anthracene 52.6 78.1 Fluoranthene 50.9 79.1
Pyrene 50.4 78.7 Benzo[a]anthracene 49.8 78.4
Chrysene 47.3 81.6 Benzo[a]pyrene 45.3 79.6
Indeno[1,2,3-cd]pyrene 41.8 81.8 Dibenz(a,h)anthracene 42.0 82.0
Benzo[g,h,i]pyrene 49.6 86.3 Benzo[b]fluoranthene 42.8 76.1 Benzo[k]fluoranthene 42.0 92.7 DRO (nC10-<nC25) 20.6 74.2 RRO (nC25-nC36) 13.8 70.5
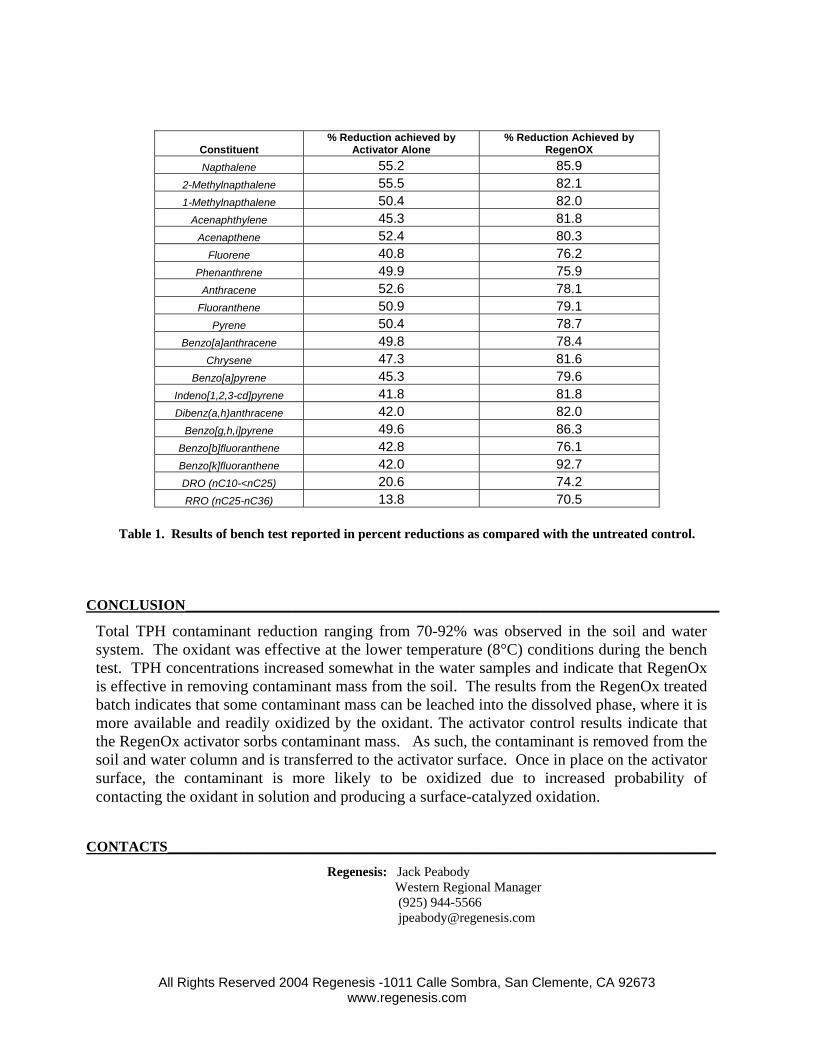
Table 1. Results of bench test reported in percent reductions as compared with the untreated control.
CONCLUSION_________________________________________________________________________ CONTACTS___________________________________________________________________________
Total TPH contaminant reduction ranging from 70-92% was observed in the soil and water system. The oxidant was effective at the lower temperature (8°C) conditions during the bench test. TPH concentrations increased somewhat in the water samples and indicate that RegenOx is effective in removing contaminant mass from the soil. The results from the RegenOx treated batch indicates that some contaminant mass can be leached into the dissolved phase, where it is more available and readily oxidized by the oxidant. The activator control results indicate that the RegenOx activator sorbs contaminant mass. As such, the contaminant is removed from the soil and water column and is transferred to the activator surface. Once in place on the activator surface, the contaminant is more likely to be oxidized due to increased probability of contacting the oxidant in solution and producing a surface-catalyzed oxidation.
Regenesis: Jack Peabody Western Regional Manager (925) 944-5566
Case History R-5
All Rights Reserved 2006 Regenesis -1011 Calle Sombra, San Clemente, CA 92673 www.regenesis.com
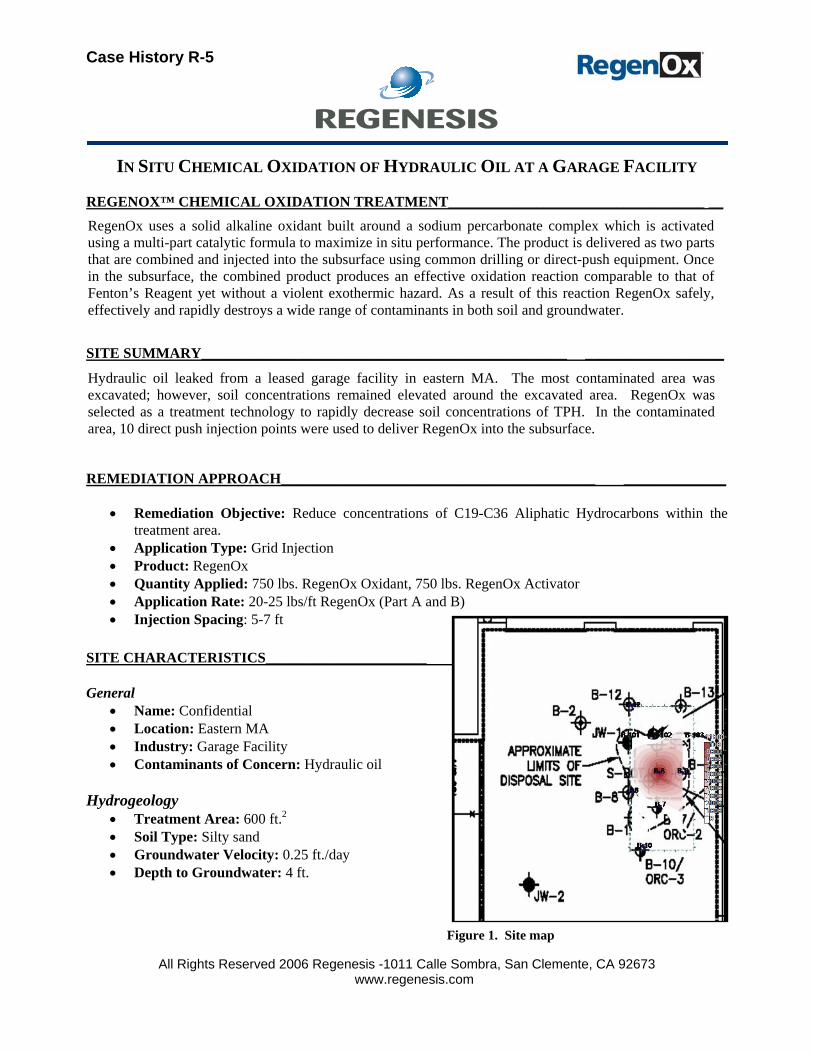
IN SITU CHEMICAL OXIDATION OF HYDRAULIC OIL AT A GARAGE FACILITY REGENOX™ CHEMICAL OXIDATION TREATMENT___________________________________ __ SITE SUMMARY__________________________________________________ ___________________ REMEDIATION APPROACH___________________________________________ ______________
• Remediation Objective: Reduce concentrations of C19-C36 Aliphatic Hydrocarbons within the
treatment area. • Application Type: Grid Injection • Product: RegenOx • Quantity Applied: 750 lbs. RegenOx Oxidant, 750 lbs. RegenOx Activator • Application Rate: 20-25 lbs/ft RegenOx (Part A and B) • Injection Spacing: 5-7 ft
SITE CHARACTERISTICS______________________ ___________________________________ General
• Name: Confidential • Location: Eastern MA • Industry: Garage Facility • Contaminants of Concern: Hydraulic oil
Hydrogeology
• Treatment Area: 600 ft.2 • Soil Type: Silty sand • Groundwater Velocity: 0.25 ft./day • Depth to Groundwater: 4 ft.
Hydraulic oil leaked from a leased garage facility in eastern MA. The most contaminated area was excavated; however, soil concentrations remained elevated around the excavated area. RegenOx was selected as a treatment technology to rapidly decrease soil concentrations of TPH. In the contaminated area, 10 direct push injection points were used to deliver RegenOx into the subsurface.
RegenOx uses a solid alkaline oxidant built around a sodium percarbonate complex which is activated using a multi-part catalytic formula to maximize in situ performance. The product is delivered as two parts that are combined and injected into the subsurface using common drilling or direct-push equipment. Once in the subsurface, the combined product produces an effective oxidation reaction comparable to that of Fenton’s Reagent yet without a violent exothermic hazard. As a result of this reaction RegenOx safely, effectively and rapidly destroys a wide range of contaminants in both soil and groundwater.
Figure 1. Site map
All Rights Reserved 2006 Regenesis -1011 Calle Sombra, San Clemente, CA 92673 www.regenesis.com
RESULTS ______________________ ___________________________________
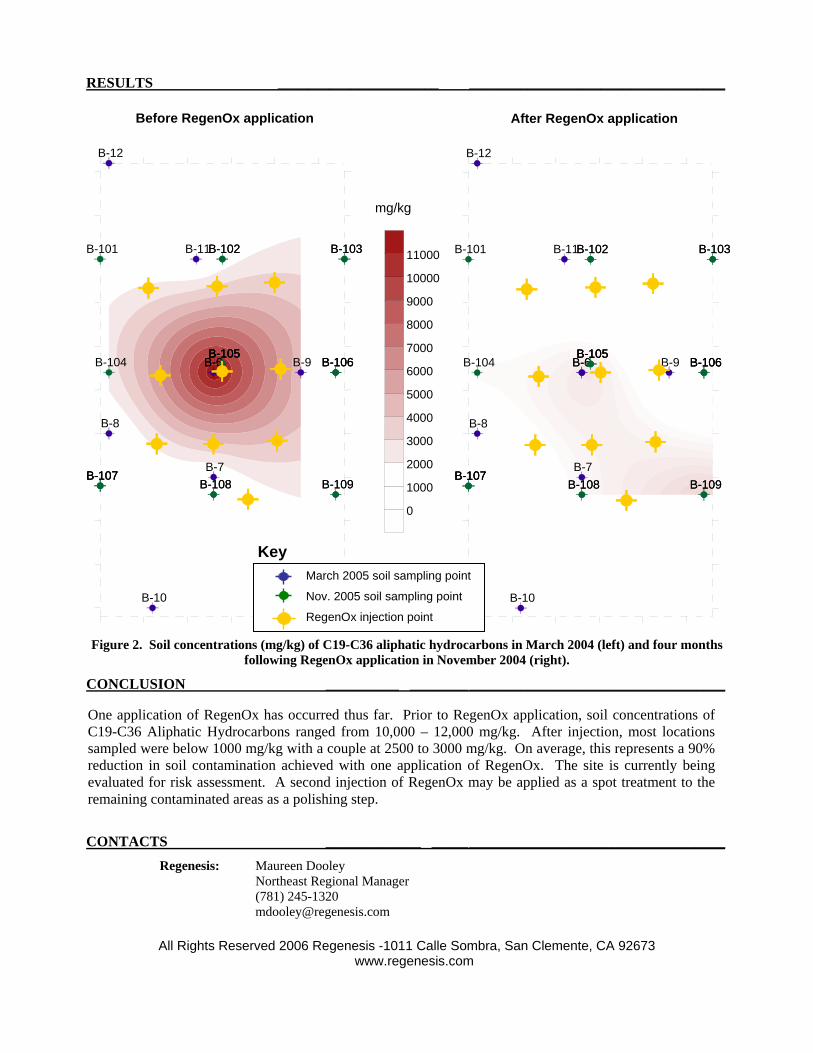
Figure 2. Soil concentrations (mg/kg) of C19-C36 aliphatic hydrocarbons in March 2004 (left) and four months
following RegenOx application in November 2004 (right).
CONCLUSION __________ ________ ___________________________________ CONTACTS _____________ _____ ___________________________________
B-6 B-6
B-7
B-8
B-9
B-10
B-11
B-12
B-101 B-102 B-102 B-103B-103
B-104B-105 B-105 B-105
B-106B-106B-106
B-107B-107B-107B-108 B-108 B-109B-109
0
1000
2000
3000
4000
5000
6000
7000
8000
9000
10000
11000
B-6 B-6
B-7
B-8
B-9
B-10
B-11
B-12
B-101 B-102 B-102 B-103B-103
B-104 B-105 B-105 B-105 B-106B-106B-106
B-107 B-107 B-107 B-108B-108 B-109B-109
One application of RegenOx has occurred thus far. Prior to RegenOx application, soil concentrations of C19-C36 Aliphatic Hydrocarbons ranged from 10,000 – 12,000 mg/kg. After injection, most locations sampled were below 1000 mg/kg with a couple at 2500 to 3000 mg/kg. On average, this represents a 90% reduction in soil contamination achieved with one application of RegenOx. The site is currently being evaluated for risk assessment. A second injection of RegenOx may be applied as a spot treatment to the remaining contaminated areas as a polishing step.
Regenesis: Maureen Dooley Northeast Regional Manager (781) 245-1320 [email protected]
Before RegenOx application After RegenOx application
March 2005 soil sampling point
Nov. 2005 soil sampling point
RegenOx injection point
Key
mg/kg
BY Jean-Pieme Moreau, Project Manager
Environmental Affairs Department Niagara Mohawk Power Corporation
& David W. Stoner, CPG, Executive Vice President
Director, Environmental Services Steams & Wheler, LLC Environmental Engineers & Scientists
ABSTRACT
Cost-effective treatment of groundwater contamination fiom Manufactured Gas Plant (MGP) residuals is a concern for many electric utilities across the country. Many MGPs produce contamination that is ,diffuse and doesn't lend itself well to pump and treat technologies. Niagara Mohawk Power Corporation (NMPC) was interested in an alternative method to treat MGP-contaminated groundwater consistent with the following objectives:
1) Design a permeable barrier to enhance the biodegradation of Benzene, Toluene, Ethyl Benzene and Xylene (BTEX) plus soluble polycyclic aromatic hydrocarbons (PAHs), such as naphthalene, originating fiom coal tar.
-' 2) Reduce or eliminate most of the mechanical elements of the remediation system requiring routine operation and maintenance.
3) Demonstrate whether meeting groundwater standards is attainable with such a system. 4) Try an alternative to the continuous trench method, often used for permeable barriers.
To meet these objectives, a demonstration project was established at the Harbor Point site, Utica, New York, the site of two former MGP plants; a tar refining operation; multiple fuel storage facilities; and two power plants. The piIot system, named The Biowall, consisted of seven 6-inch diameter gravel pack wells aligned perpendicular to the direction of groundwater flow within which sleeves of solid phase oxygen release compound (ORC) were suspended. Three upgradient and ten downgradient wells were installed at various distances to monitor the effect of the oxygen on BTEX and PAH concentrations. It was hypothesized that increased oxygen concentrations in groundwater would create an "aura" of oxygen-rich groundwater in which aerobic bacteria would degrade organics at an accelerated rate. Groundwater monitoring commenced one month prior to introduction of the ORC and continued for a year. Samples were analyzed for BTEX, PAHs, total phenolics, a number of inorganics, and microbiologic indicators, as well as field parameters.
Results of testing showed that dissolved oxygen was dispersed throughout the Biowall resulting in enhanced biodegradation rates. Groundwater standards were achieved for Toluene, Ethyl Benzene and naphthalene in many of the observation wells during the pilot test. The results indicate that the Biowall approach is a very promising alternative for managing MGP-related organic contamination in groundwater at lower costs than more traditional approaches.
1
PASSIVE REMEDIATION OF GROUNDWATER CONTAMINATED BY MANUFACTURED GAS PLANT RESIDUES
INTRODUCTION
The Harbor Point site located in Utica, New York and owned by Niagara Mohawk Power Corporation, is one of the largest manufactured gas plant (MGP) sites in the United States. It was the former site of two separate manufactured gas plants, a tar refining operation, fuel storage facilities, and two power plants. Due to the size of the facility and complexity of use, there are areas of widespread contamination not well suited to simple remediation approaches such as containment or removal. Also due to the size of the site and the site's characteristics, it is likely that some form of groundwater treatment may be included in the remedial option chosen. There are significant portions of the site where coal tar derivatives have caused groundwater contamination exceeding State clean up standards. Niagara Mohawk Power Corporation (NMPC), having tried various approaches to groundwater treatment, wanted to develop an approach to groundwater treatment that could be used, not only at this site, but at other similar MGP sites as necessary.
The characteristics that NMPC was looking for in a system (and wanted to include in a field scale research project) included the following:
1. Few, if any, mechanical and moving parts so that very little operation and maintenance is required.
2. A system that uses a permeable barrier approach, whereby contaminated groundwater flows through a reactive zone and is remediated in the process.
3. The process chosen should enhance the biodegradation of soluble polycyclic aromatic hydrocarbons (PAHs) such as napthalene, as well as the Benzene, Toluene, Ethyl Benzene, and Xylene (BTEX) compounds which also tend to persist at this site and exceed groundwater standards.
4. Demonstrate whether such a system is capable of reducing contaminant concentrations to the - degree that groundwater standards would be met downgradient of the treatment zone.
NMPC retained Stearns & Wheler to assist them with this project because of Stearns & Wheler's experience with successfully designing and installing permeable barriers elsewhere. As the two f m s worked together to refine the concept of design, it was also decided that the two following project objectives would also be included:
1. Select and test an alternative to a continuous barrier (trench) in order to evaluate a lower cost method of creating a zone of enhanced biodegradation in the subsurface.
PASSIVE REMEDIATION OF GROUNDWATER CONTAMINATED BY MANUFACTURED GAS PLANT RESIDUES
2. Design the system so that the elevated iron concentrations found in groundwater at the site would not blind or foul the reactive zone.
SYSTEM DESIGN
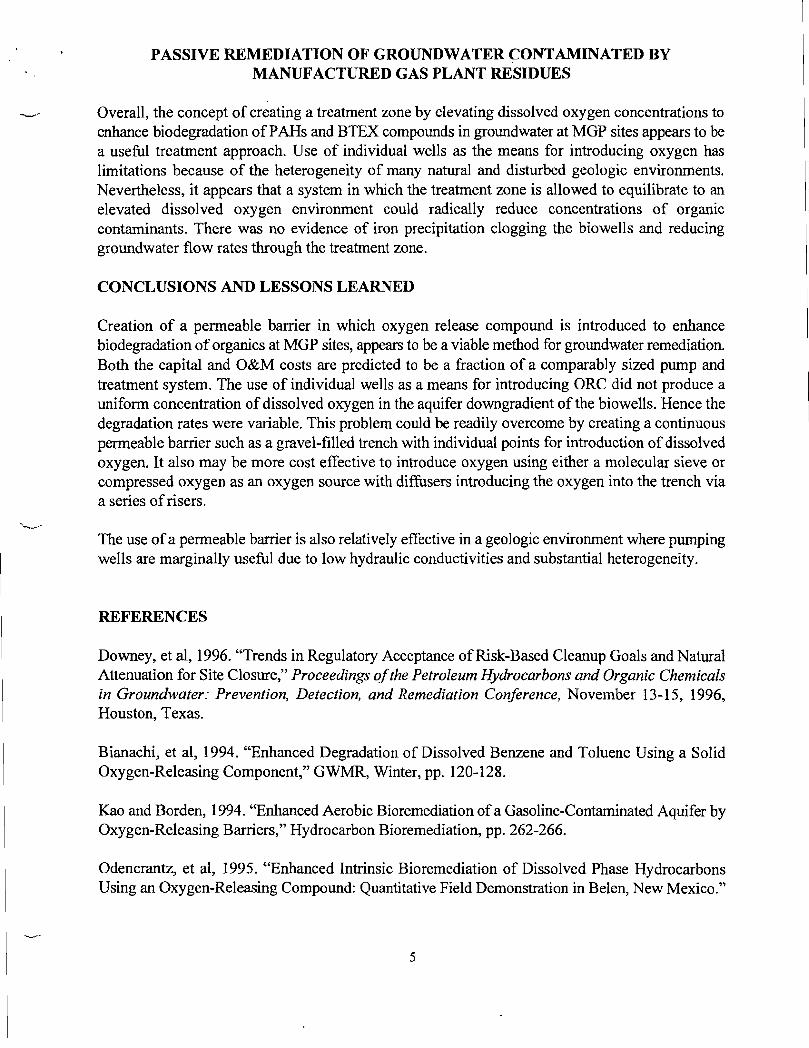
Based on the design requirements as discussed in the introduction, the design team chose to use a series of closely spaced large diameter wells as the means by which oxygen would be delivered to the groundwater system. The layout of these wells is shown in Figure 1, along with the system of upgradient and downgradient monitoring wells used to both establish baseline conditions and to monitor the performance of the system after it became operational. As shown, the system consisted of seven 6-inch "biowells" (into which oxygen release compound was placed). Each large diameter well was referred to as a "biowell" with the entire treatment system referred to as the ccbiowall". Each biowell was installed in a boring with a 14-inch outside diameter. The inside casing (6-inches) was fully screened through the saturated zone and the annulus, between the screen and surrounding soil, was backfilled with gravel pack. In order to monitor the performance of the gravel pack, four l-inch screened observation tubes were installed through the gravel pack and daylighted at the ground surface. These tubes were also designed to allow clean-out of iron precipitate if this became necessary.
The biowells were constructed five feet apart on-center in a line perpendicular to groundwater flow to a depth of 30 feet each. Three upgradient observation wells were installed to establish background groundwater quality and flow data. Ten downgradient observation wells were installed to observe downgradient and lateral dispersion of oxygen and changes in dissolved organic contaminants over time. Based on an evaluation of alternatives for methods to introduce oxygen to the system, a solid oxygen release compound was selected [ORC]. ORC is a fine, relatively insoluble peroxide compound that releases dissolved oxygen P O ] at a slow controlled rate when hydrated. DO release may continue as long as twelve months, depending on contaminant concentrations, microbial action, pH and temperature. The primary byproduct of the hydration reaction, is magnesium hydroxide, commonly known as milk of magnesia. Since both reactants and byproducts are commonly used in antacids, the addition of this product to the groundwater was readily acceptable to regulators. Based on a substantial body of literature on biodegradation, it was believed that an increase in DO would provide conditions amenable to degradation of the organic contaminants by aerobic bacteria.
Groundwater sampling and analysis commenced one month prior to the installation of the ORC and continued monthly for a period of one year. The groundwater samples were analyzed for BTEX, PAI-Is, totaI phenolics, inorganics, nitrogen, phosphorous and potassium, alkalinity hardness, and DO. Samples were also analyzed for microbiologic parameters including phospholipid fatty acids (PLFA)and dimethylacetal (DMA) which provided qualitative information about the number of microbes, the general health of the microbial community, and general information regarding the types of microbes that exist within the community. Field parameters included pH, eH, specific conductance, turbidity, temperature and water levels. The ORC was introduced to the wells via a
PASSIVE REMEDIATION OF GROUNDWATER CONTAMINATED BY MANUFACTURED GAS PLANT RESIDUES
string of tubular fabric containers, each containing a pre-determined quantity of ORC, based on the concentrations of organics in groundwater and the anticipated treatment life of approximately nine to twelve months between ORC changeover.
RESULTS AND DISCUSSION
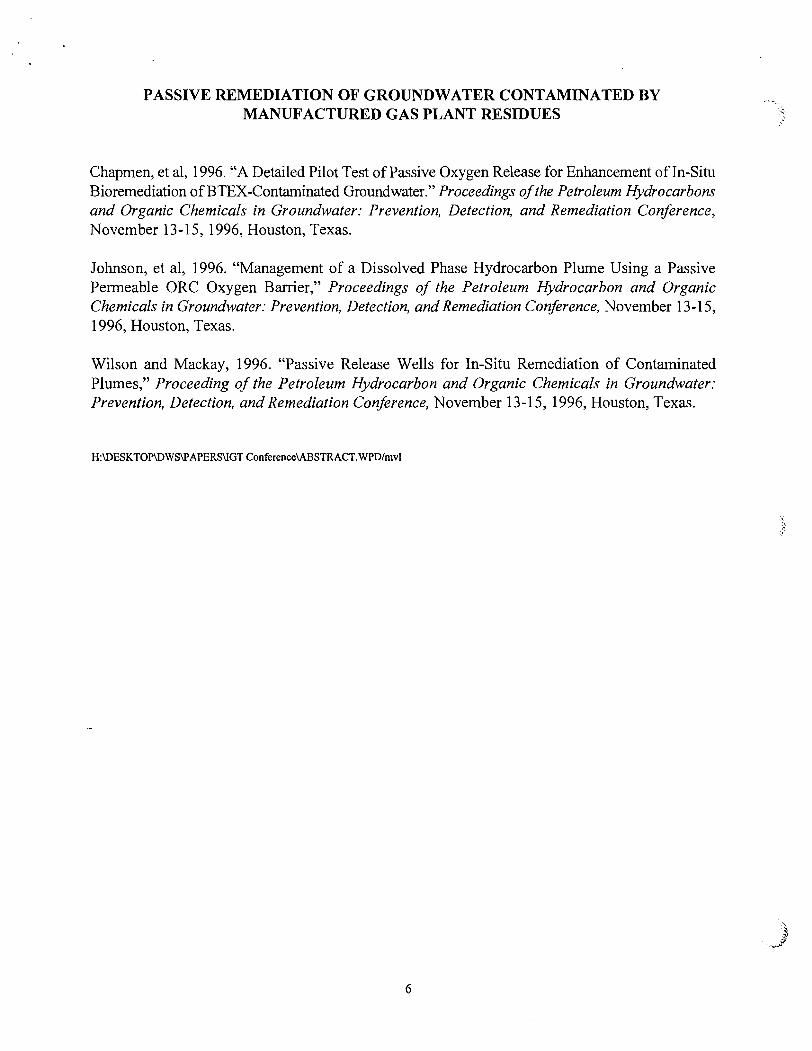
The sampling results indicated that DO was dispersed throughout the Biowall system. Prior to the ORC installation, DO levels were generally less than 1 milligram per liter, indicating that the aquifer was conducive to the propagation of anaerobic bacteria. Figure 2 shows pre-ORC dissolved oxygen concentrations in and around the biowall. After the ORC installation, DO levels increased to as much as 21 milligrams per liter in the biowells, and 8 milligrams per liter in the downgradient observation wells. Figure 3 shows the dissolved oxygen concentrations during February, or approximately two months after introduction of the ORC. Lateral oxygen dispersion required an additional two months' time after the introduction of ORC to reach downgradient wells located between biowells. However, DO did not reach the most downgradient observation wells. Non-homogenous soil conditions appeared to create preferential flow paths such that oxygen was not uniformly distributed. Oxygen demand due to the degradation of residual organics in the aquifer matrix may have limited the dispersion of dissolved oxygen and the life of the ORC. The results of testing indicated that the ORC actively released DO for a period of only six months, after which time the DO concentrations declined.
Dissolved MGP-related groundwater contaminants including BTEX, napthalene, and other soluble PAHs were degraded by the Biowall system. Degradation was not uniform nor did it occur at all downgradient wells. Degradation was most effective during the six months during which there was active ORC-related dissolved oxygen release. Groundwater standards were achieved for toluene, ethyl benzene and napthalene in many of the observation wells during the pilot test as indicated in Figures 4,5 and 6. Degradation efficiencies for dissolved organics in downgradient wells range fiom zero to 91% with an average of 56%. It is believed that the heterogeneity of the subsurface, and the fact that there was continuous dissolution of organics from residual free phase organics to the dissolved phase, may have decreased the degradation efficiencies.
-
The addition of DO to the aquifer enhanced the growth of aerobic microbial populations and provided electronic receptors for anaerobic microbes. Although the total biomass of the system appeared to decrease in response to the addition of oxygen, a small yet effective aerobic population remained. The decrease in population may have been in response to a loss in carbon sources (BTEX and napthalene) just after the installation of the ORC, and to the reduction of anaerobic microbes. The addition of DO may also have resulted in the oxidation of sulfides and iron which provided electronic receptors for the degradation of dissolved organics by sulfate and iron-reducing bacteria. Finally, the numbers of protozoa and fungi increased with the addition of oxygen. It is possible that the fungi may have contributed to the degradation of dissolved organics and the protozoa may have consumed bacteria in significant numbers, possibly a reason for the decrease in biomass.
PASSIVE REMEDIATION OF GROUNDWATER CONTAMINATED BY MANUFACTURED GAS PLANT RESIDUES
Overall, the concept of creating a treatment zone by elevating dissolved oxygen concentrations to enhance biodegradation of PAHs and BTEX compounds in groundwater at MGP sites appears to be a useful treatment approach. Use of individual wells as the means for introducing oxygen has limitations because of the heterogeneity of many natural and disturbed geologic environments. Nevertheless, it appears that a system in which the treatment zone is allowed to equilibrate to an elevated dissolved oxygen environment could radically reduce concentrations of organic contaminants. There was no evidence of iron precipitation clogging the biowells and reducing groundwater flow rates through the treatment zone.
CONCLUSIONS AND LESSONS LEARNED
Creation of a permeable barrier in which oxygen release compound is introduced to enhance biodegradation of organics at MGP sites, appears to be a viable method for groundwater remediation. Both the capital and O&M costs are predicted to be a fraction of a comparably sized pump and treatment system. The use of individual wells as a means for introducing ORC did not produce a uniform concentration of dissolved oxygen in the aquifer downgradient of the biowells. Hence the degradation rates were variable. This problem could be readily overcome by creating a continuous permeable barrier such as a gravel-filled trench with individual points for introduction of dissolved oxygen. It also may be more cost effective to introduce oxygen using either a molecular sieve or compressed oxygen as an oxygen source with diffusers introducing the oxygen into the trench via a series of risers.
--.
The use of a permeable barrier is also relatively effective in a geologic environment where pumping wells are marginally useful due to low hydraulic conductivities and substantial heterogeneity.
REFERENCES
Downey, et al, 1996. "Trends in Regulatory Acceptance of Risk-Based Cleanup Goals and Natural Attenuation for Site Closure," Proceedings of the Petroleum Hydrocarbons and Organic Chemicals in Groundwater: Prevention, Detection, and Remediation Conference, November 13-15, 1996, Houston, Texas.
Bianachi, et al, 1994. "Enhanced Degradation of Dissolved Benzene and Toluene Using a Solid Oxygen-Releasing Component," GWMR, Winter, pp. 120-128.
Kao and Borden, 1994. "Enhanced Aerobic Bioremediation of a Gasoline-Contaminated Aquifer by Oxygen-Releasing Barriers," Hydrocarbon Bioremediation, pp. 262-266.
Odencrantz, et al, 1995. "Enhanced Intrinsic Bioremediation of Dissolved Phase Hydrocarbons Using an Oxygen-Releasing Compound: Quantitative Field Demonstration in Belen, New Mexico."
PASSIVE REMEDIATION OF GROUNDWATER CONTAMINATED BY MANUFACTURED GAS PLANT RESIDUES
Chapmen, et al, 1996. "A Detailed Pilot Test of Passive Oxygen Release for Enhancement of In-Situ Bioremediation of BTEX-Contaminated Groundwater." Proceedings of the Petroleum Hydrocarbons and Organic Chemicals in Groundwater: Prevention, Detection, and Remediation Conference, November 13- 15, 1996, Houston, Texas.
Johnson, et al, 1996. "Management of a Dissolved Phase Hydrocarbon Plume Using a Passive Permeable ORC Oxygen Barrier," Proceedings of the Petroleum Hydrocarbon and Organic Chemicals in Groundwater: Prevention, Detection, and Remediation Conference, November 13- 15, 1996, Houston, Texas.
Wilson and Mackay, 1996. "Passive Release Wells for In-Situ Remediation of Contaminated Plumes," Proceeding of the Petroleum Hydrocarbon and Organic Chemicals in Groundwater: Prevention, Detection, and Remediation Conference, November 13-1 5, 1996, Houston, Texas.
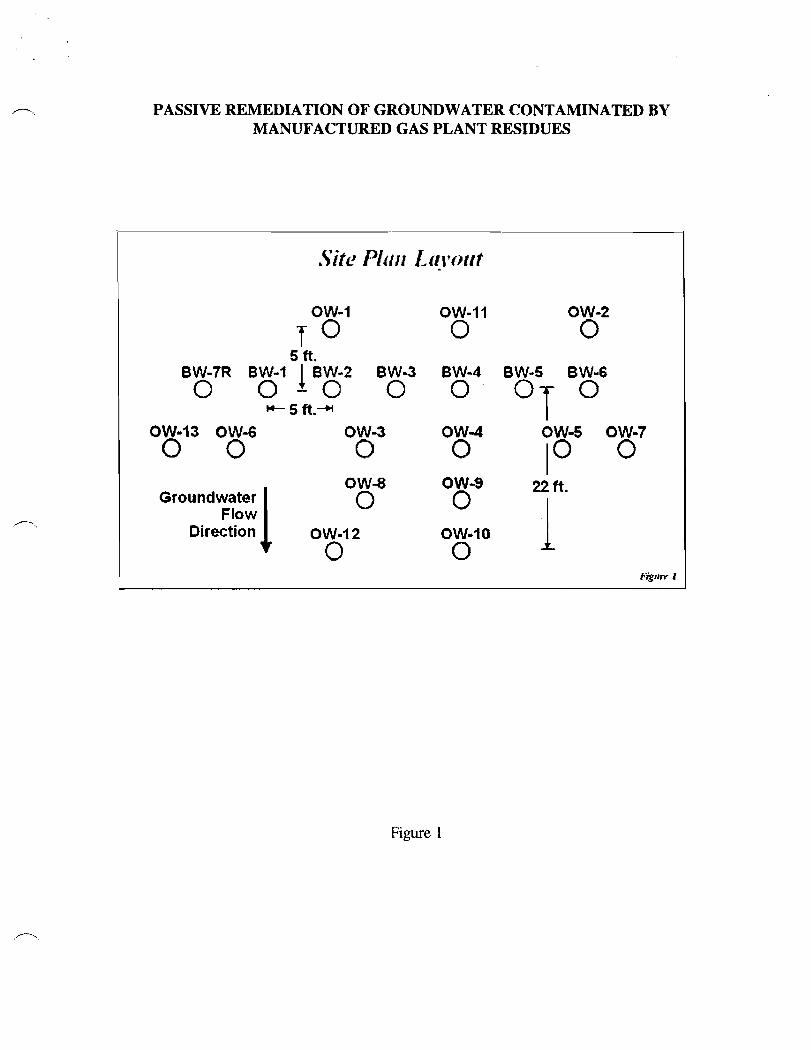
PASSIVE REMEDIATION OF GROUNDWATER CONTAMINATED BY MANUFACTURED GAS PLANT RESIDUES
.Site P lrm L qltorr t
OW-1 OW-? 1 OW-2
7 0 0 0 5 ft.
8 W 3 BW-4 BW-5 BW-6 0
n- 5 ft.* 0 0 .
OW-I3 OW-6 0 W-3 O W 4 OW-5 OW17 0 0 0 0 l o 0
0 W-8 OW-9 Groundwater 0 22 ft.
Flow 1 Direction OW-I2 OW-I0
0 0 " 1 C-ir1w I
Figure 1
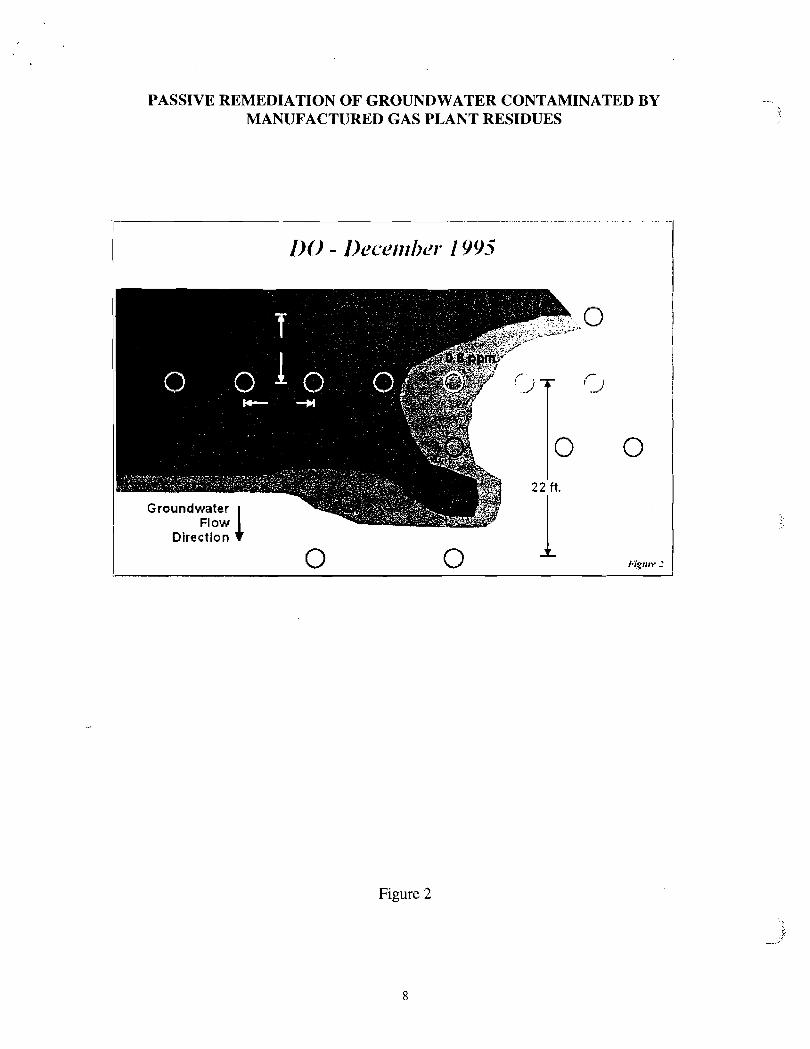
PASSIVE REMEDIATION OF GROUNDWATER CONTAMINATED BY - MANUFACTURED GAS PLANT RESIDUES
1 Direction * I
Figure 2
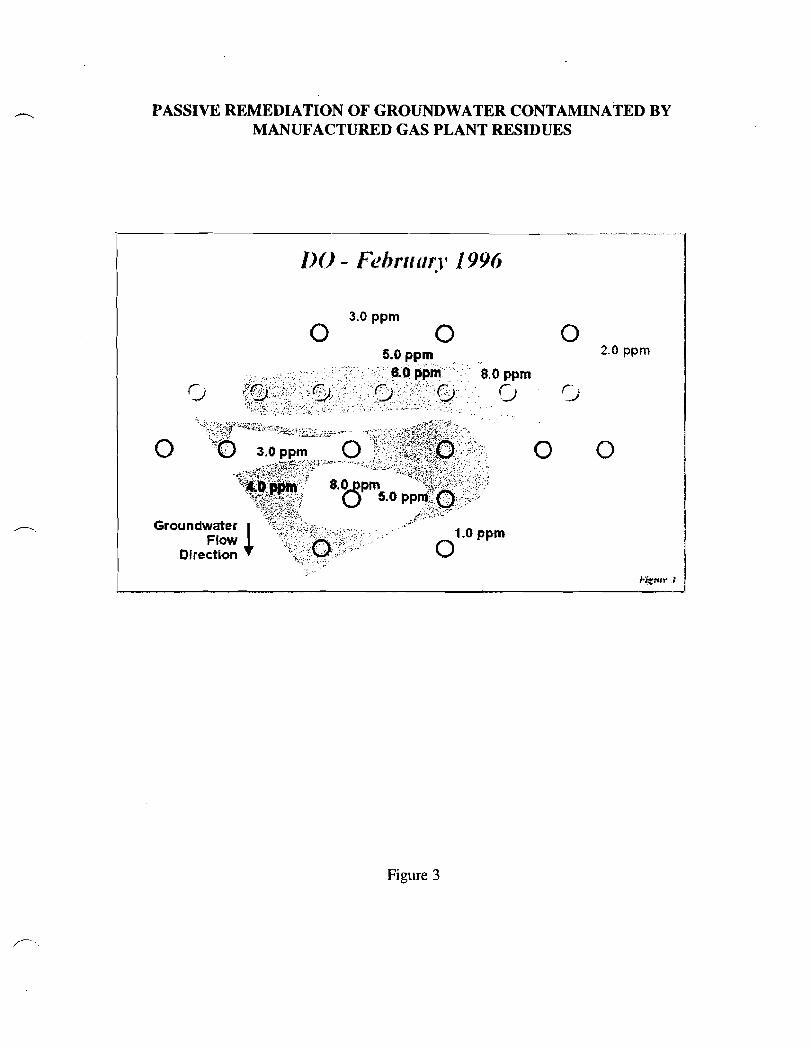
PASSIVE REMEDIATION OF GROUNDWATER CONTAMINATED BY MANUFACTURED GAS PLANT RESIDUES
3.0 ppm 0
5.0 ppm 0 0
2.0 ppm _ _ . . _..... . . . . . . . . . . . .: : .:: .......... 6.0 ppq. : ::'; 8.0 ppm
.:..I.... . . . . . . . . . . . . . . . . . . ..... C _ . . : .. . . . . . . . . . . .. .. .+.p ::;, ;:: ..:., ;: :, - . :s r- . " . . - ; ; . ; . (-, r 1
; . : ; ; . : : : : : . . . ' ; :.,: .,: -;-,.:. ...: ,. ............-. J . ., . . . , .,:.,,. .;.. ;::.: : .:+.. . .:?'~.. . . . . . . .... :.,::.. . A ' ' ;, :.. ..:; . . .
', :.. . . . . . . . . . .
0 0
Groundwater
Figure 3
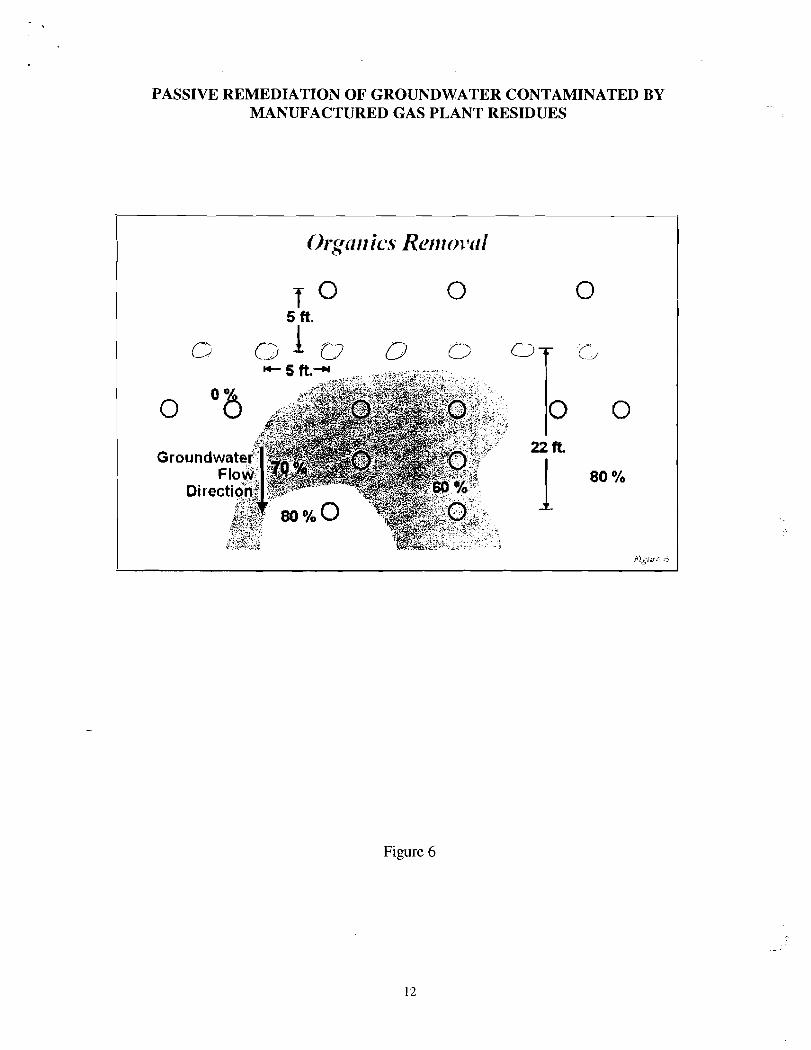
PASSIVE REMEDIATION OF GROUNDWATER CONTAMINATED BY MANUFACTURED GAS PLANT RESIDUES
7 O 5 ft.
Figure 6
Niagara Mohawk Manufactured Gas Plant,
New York, NY
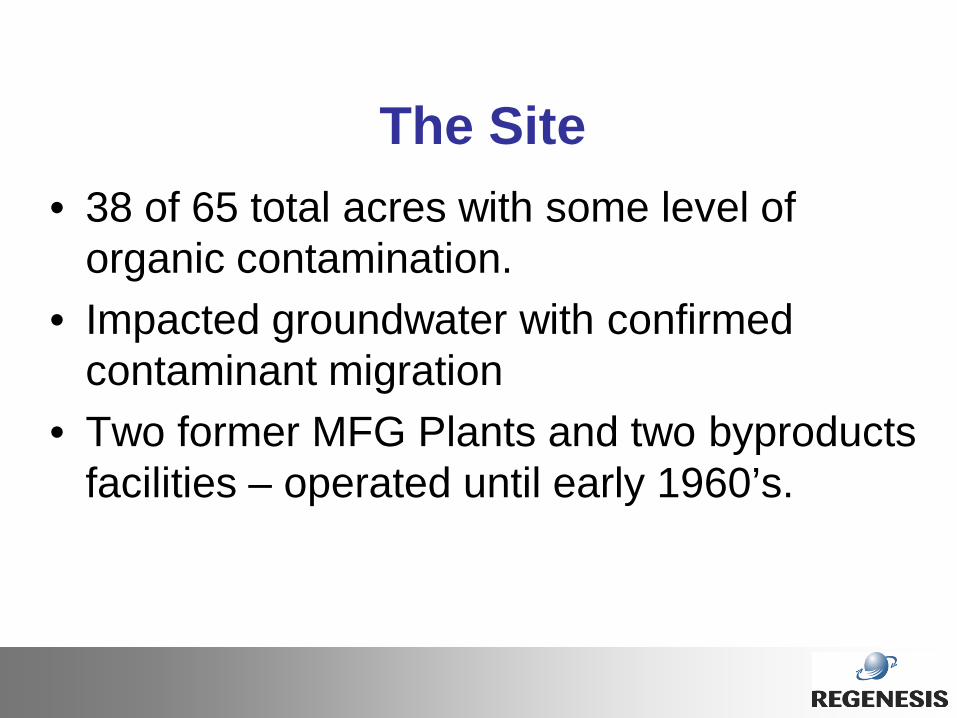
• 38 of 65 total acres with some level of organic contamination.
• Impacted groundwater with confirmed contaminant migration
• Two former MFG Plants and two byproducts facilities – operated until early 1960’s.
The Site
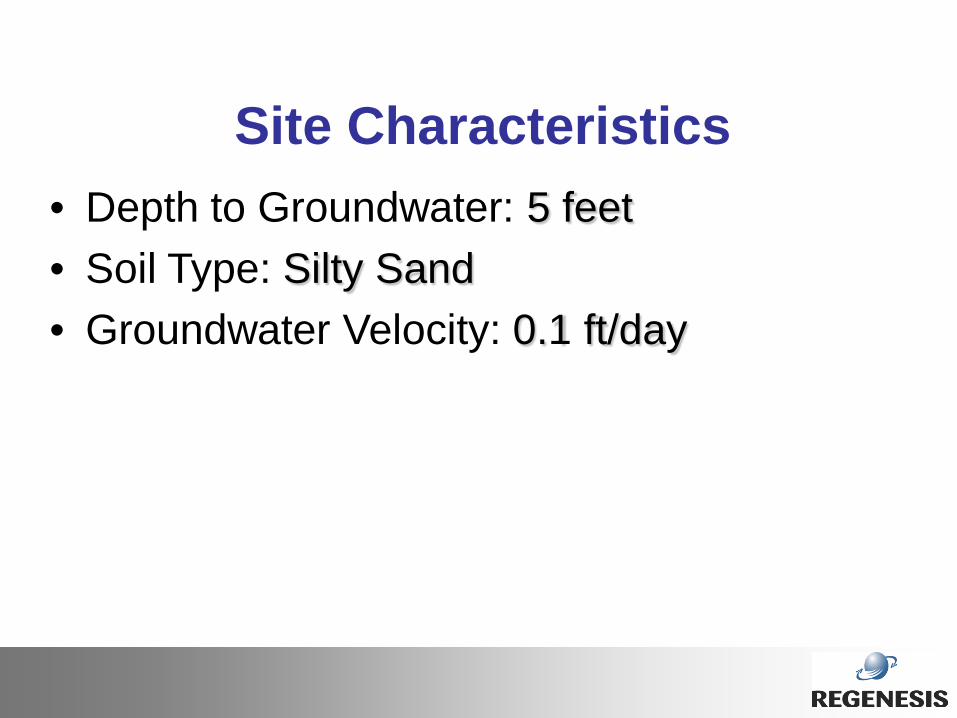
Site Characteristics • Depth to Groundwater: 5 feet
• Soil Type: Silty Sand
• Groundwater Velocity: 0.1 ft/day
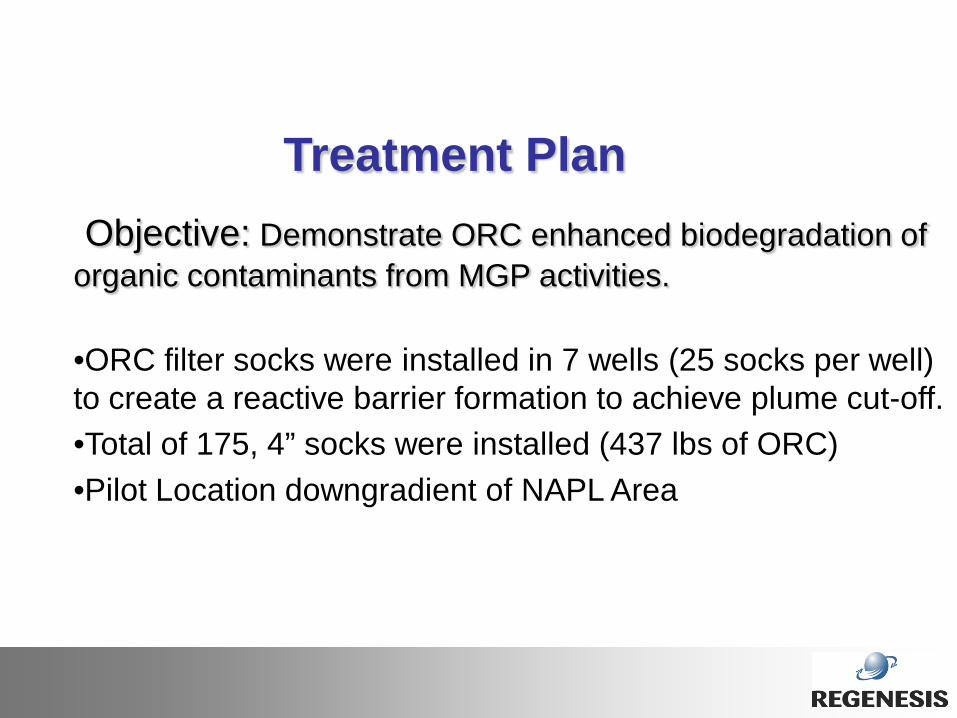
Treatment Plan Objective: Demonstrate ORC enhanced biodegradation of organic contaminants from MGP activities.
•ORC filter socks were installed in 7 wells (25 socks per well) to create a reactive barrier formation to achieve plume cut-off.
•Total of 175, 4” socks were installed (437 lbs of ORC)
•Pilot Location downgradient of NAPL Area
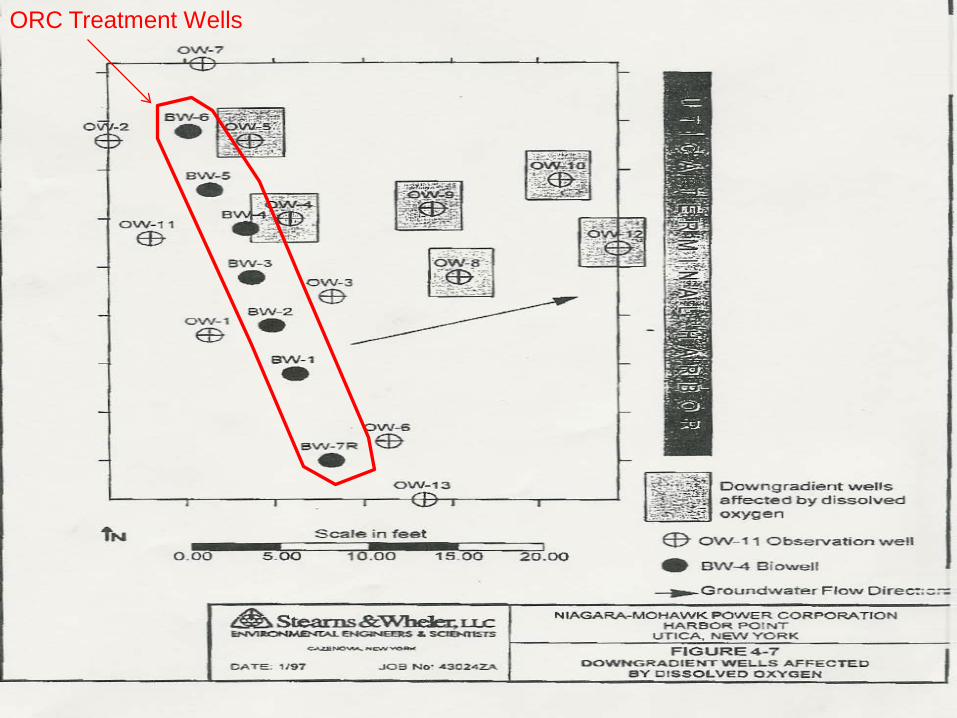
ORC Treatment Wells
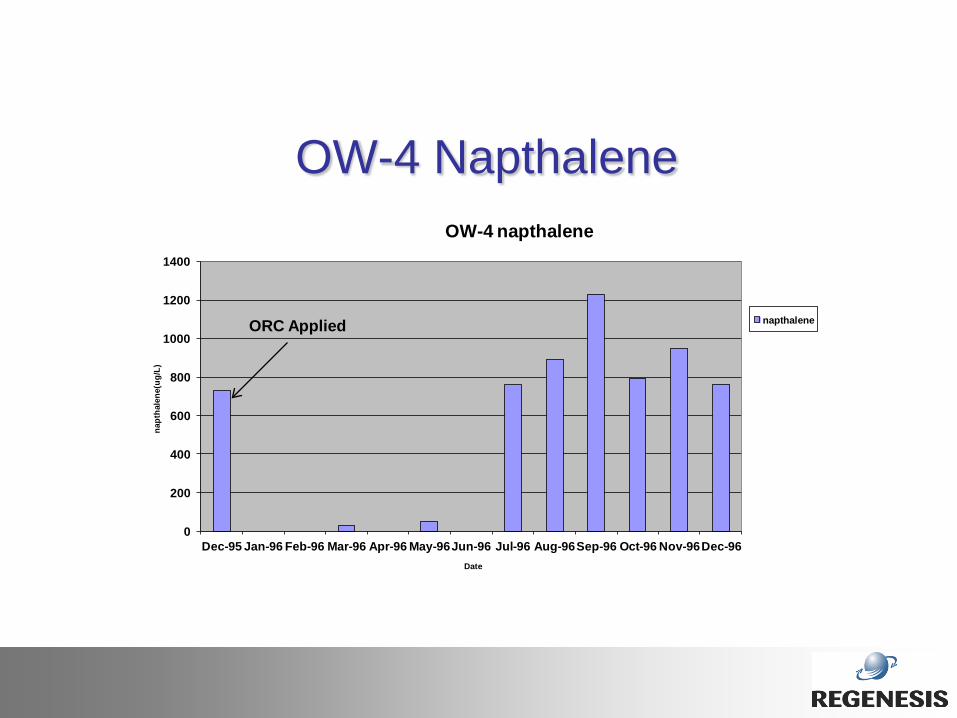
OW-4 Napthalene
0
200
400
600
800
1000
1200
1400
Dec-95 Jan-96 Feb-96 Mar-96 Apr-96 May-96Jun-96 Jul-96 Aug-96Sep-96 Oct-96 Nov-96Dec-96
napt
hale
ne(u
g/L)
Date
OW-4 napthalene
napthaleneORC Applied
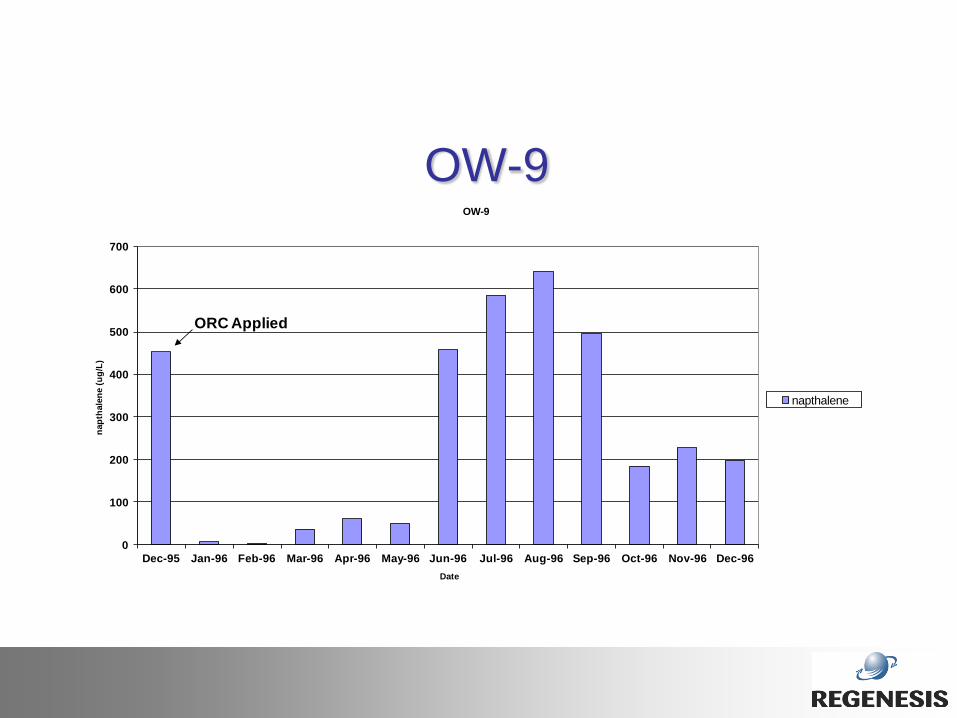
OW-9
0
100
200
300
400
500
600
700
Dec-95 Jan-96 Feb-96 Mar-96 Apr-96 May-96 Jun-96 Jul-96 Aug-96 Sep-96 Oct-96 Nov-96 Dec-96
napt
hale
ne (u
g/L)
Date
OW-9
napthalene
ORC Applied
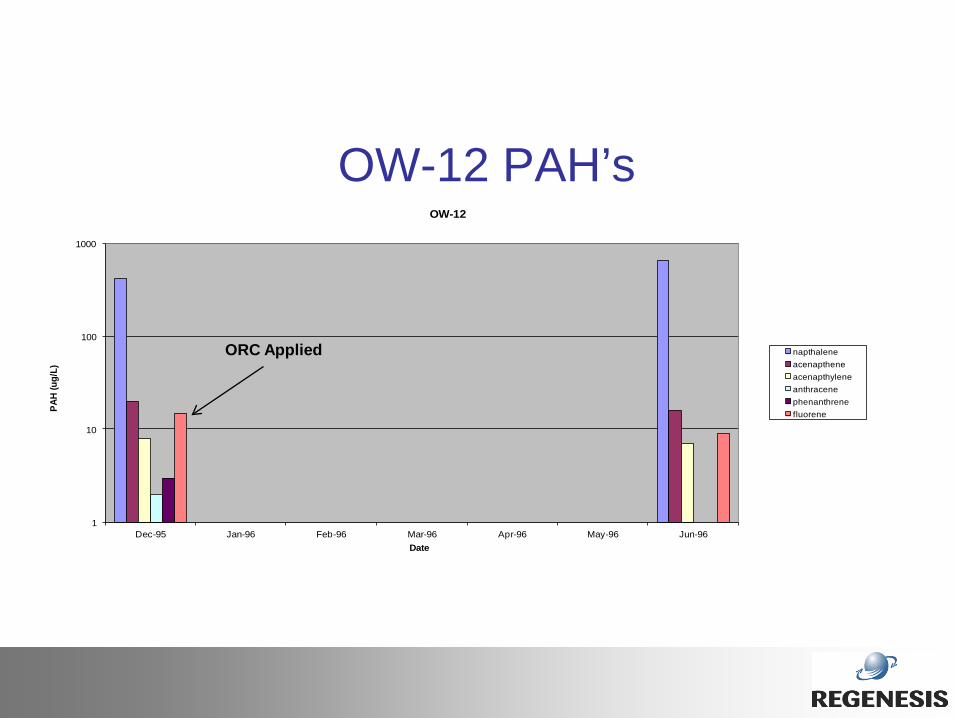
OW-12 PAH’s
1
10
100
1000
Dec-95 Jan-96 Feb-96 Mar-96 Apr-96 May-96 Jun-96
PAH
(ug/
L)
Date
OW-12
napthalene
acenapthene
acenapthylene
anthracene
phenanthrene
fluorene
ORC Applied
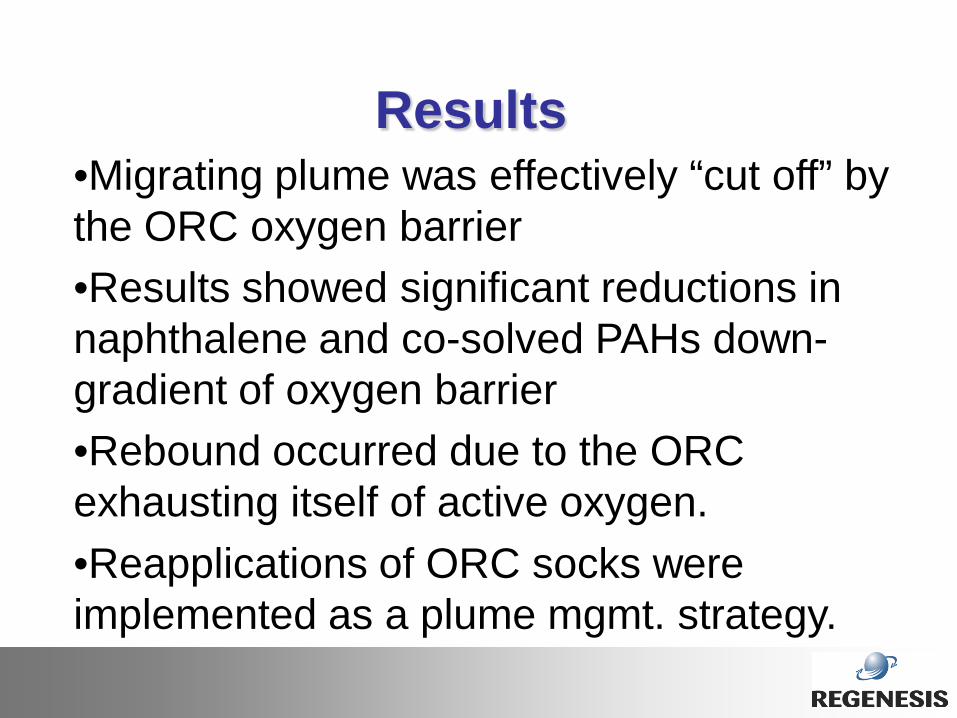
Results •Migrating plume was effectively “cut off” by the ORC oxygen barrier
•Results showed significant reductions in naphthalene and co-solved PAHs down-gradient of oxygen barrier
•Rebound occurred due to the ORC exhausting itself of active oxygen.
•Reapplications of ORC socks were implemented as a plume mgmt. strategy.
Pacific Gas & Electric Gas Condensate Cleanup- California
with
ORC
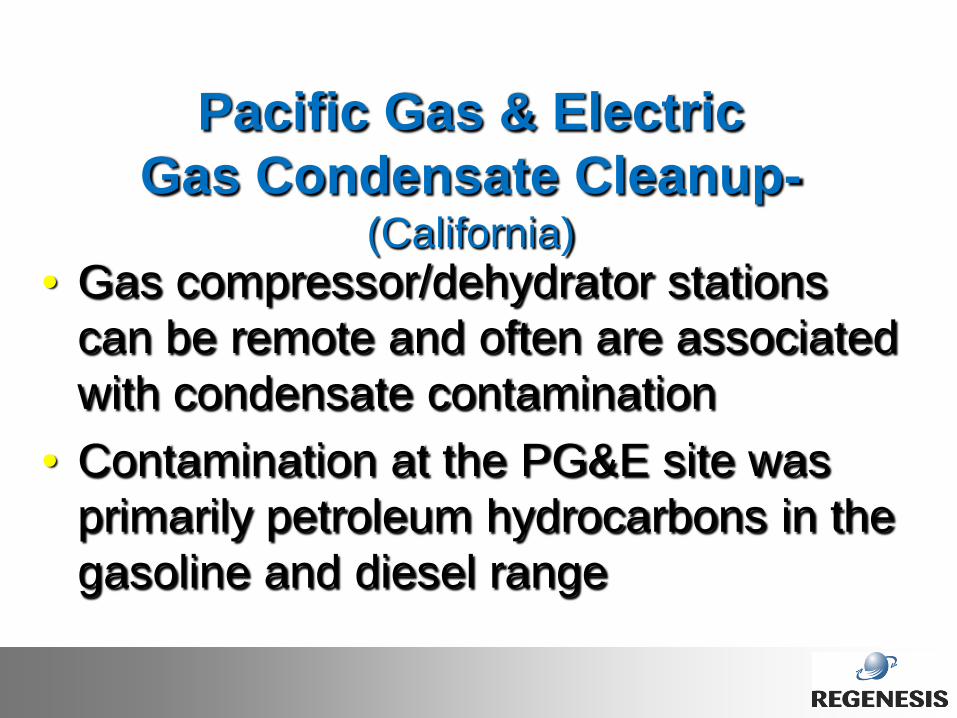
Pacific Gas & Electric Gas Condensate Cleanup-
(California) • Gas compressor/dehydrator stations
can be remote and often are associated with condensate contamination
• Contamination at the PG&E site was primarily petroleum hydrocarbons in the gasoline and diesel range
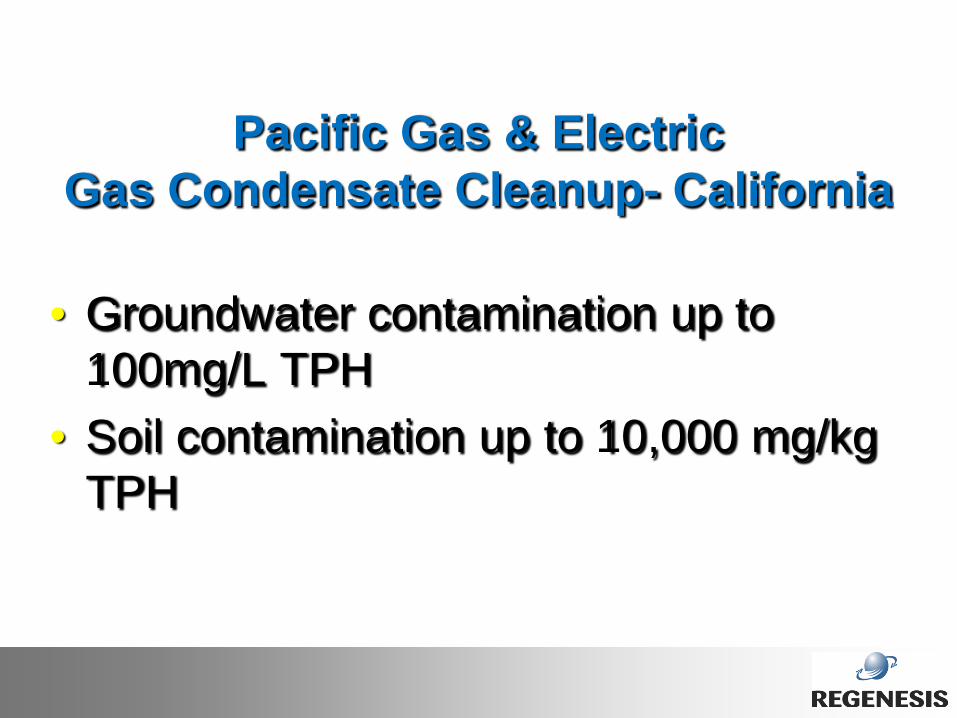
Pacific Gas & Electric Gas Condensate Cleanup- California
• Groundwater contamination up to 100mg/L TPH
• Soil contamination up to 10,000 mg/kg TPH
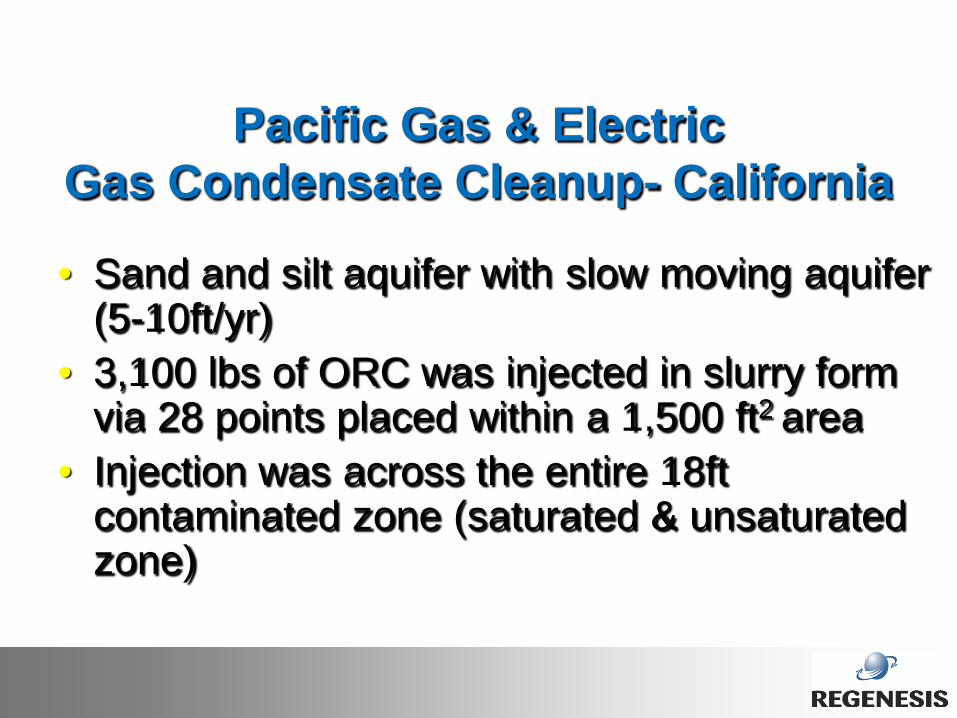
Pacific Gas & Electric Gas Condensate Cleanup- California
• Sand and silt aquifer with slow moving aquifer (5-10ft/yr)
• 3,100 lbs of ORC was injected in slurry form via 28 points placed within a 1,500 ft2 area
• Injection was across the entire 18ft contaminated zone (saturated & unsaturated zone)
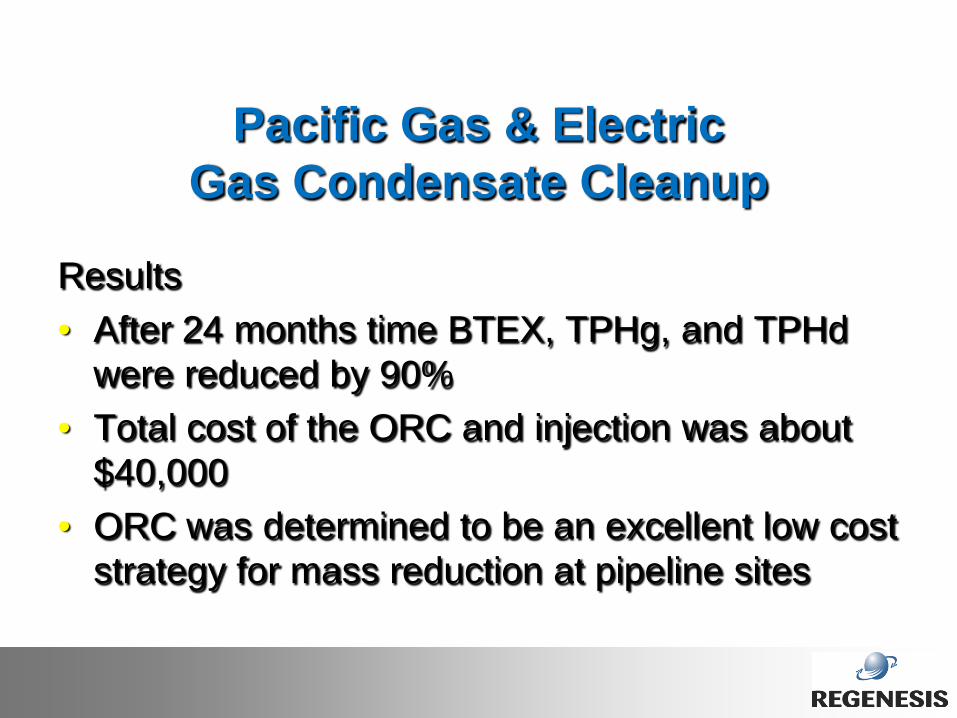
Pacific Gas & Electric Gas Condensate Cleanup
Results
• After 24 months time BTEX, TPHg, and TPHd were reduced by 90%
• Total cost of the ORC and injection was about $40,000
• ORC was determined to be an excellent low cost strategy for mass reduction at pipeline sites