Remarkable enhancement in ligand-exchange … · Remarkable enhancement in ligand-exchange...
13
S1 SUPPORTING INFORMATION Remarkable enhancement in ligand-exchange reactivity of thiolate-protected Au 25 nanocluster by single Pd atom doping Yoshiki Niihori, † Wataru Kurashige, † Miku Matsuzaki, † and Yuichi Negishi* †,‡ † Department of Applied Chemistry, Faculty of Science, and ‡ Research Institute for Science and Technology, Energy and Environment Photocatalyst Research Division, Tokyo University of Science, 1-3 Kagurazaka, Shinjuku-ku, Tokyo 162-8601, Japan. I. Experiments A. Synthesis of [Au 25 (SC 12 H 25 ) 18 ] – and [PdAu 24 (SC 12 H 25 ) 18 ] 0 [Au 25 (SC 12 H 25 ) 18 ] – and [PdAu 24 (SC 12 H 25 ) 18 ] 0 were synthesized by the methods reported in our previous studies. 1,2 B. Ligand exchange reactions between cluster and incoming thiol 0.14 μmol of [Au 25 (SC 12 H 25 ) 18 ] – or [PdAu 24 (SC 12 H 25 ) 18 ] 0 was dissolved in 500 μL of dichloromethane. To this solution, 140 μmol of C n H 2n+1 SH (n = 6, 8, 10, or 16) or PhC 2 H 4 SH was added and the solution was stirred at room temperature. At each reaction time, 5 μL of the solution was separated, washed with a mixture of methanol and water to remove excess thiols, and then characterized by matrix-assisted laser desorption ionization (MALDI) mass spectrometry. C. Ligand exchange reaction between two kinds of clusters 0.07 μmol of [Au 25 (SC 12 H 25 ) 18 ] – or [PdAu 24 (SC 12 H 25 ) 18 ] 0 was dissolved in 250 μL of dichloromethane. To this solution, 0.07 μmol of [Au 25 (SC 10 H 21 ) 18 ] – or [PdAu 24 (SC 10 H 21 ) 18 ] 0 was added and the solution was stirred at room temperature. At each reaction time, 5 μL of the solution was separated and then characterized by MALDI mass spectrometry. D. Characterization MALDI mass spectra were collected using a linear time-of-flight mass spectrometer (Applied Biosystem, Voyager Linear RD VDA 500) using a nitrogen laser (wavelength: 337 nm). High-resolution MALDI mass spectra (Figures S3) were collected using a spiral time-of-flight mass spectrometer (JEOL Ltd., JMS−S3000) using a semiconductor laser (wavelength: 349 nm). In the MALDI experiments, trans-2-[3-(4-tert-butylphenyl)-2-methyl-2-propenylidene]malononitrile (DCTB) was used as the matrix. The cluster-to-matrix ratio was set to 1:1000. Electrospray ionization (ESI) mass spectrometry was performed using a Fourier-transform mass spectrometer (Bruker, Solarix). 1 mg/mL of toluene/acetonitrile (1:1, v:v) solution of [Au 25 (SC 12 H 25 ) 18 ] – or [PdAu 24 (SC 12 H 25 ) 18 ] 0 was electrosprayed at a flow rate of 800 μL/h. In the mass analysis of [PdAu 24 (SC 12 H 25 ) 18 ] 0 , a small amount of (C 4 H 9 ) 4 N + was added to the solution to observe the neutral [PdAu 24 (SC 12 H 25 ) 18 ] 0 as a cation. UV–Vis absorption spectra of the clusters were recorded in toluene at ambient temperature with a spectrometer (JASCO, V-630). II. Analysis The average numbers of exchanged ligands, x ave, were estimated as x ave = x x=0 18 ∑ I ( x ) I ( y) y=0 18 ∑ " # $ $ % & ' ' (1) where x and y are the number of exchanged ligands and I(x) and I(y) are the ion intensities observed in the mass spectra for each x and y, respectively. Electronic Supplementary Material (ESI) for Nanoscale This journal is © The Royal Society of Chemistry 2012
Transcript of Remarkable enhancement in ligand-exchange … · Remarkable enhancement in ligand-exchange...

S1
SUPPORTING INFORMATION
Remarkable enhancement in ligand-exchange reactivity of thiolate-protected Au25 nanocluster by single Pd atom doping Yoshiki Niihori,† Wataru Kurashige,† Miku Matsuzaki,† and Yuichi Negishi*†,‡
†Department of Applied Chemistry, Faculty of Science, and ‡Research Institute for Science and Technology, Energy and Environment Photocatalyst Research Division, Tokyo University of Science, 1-3 Kagurazaka, Shinjuku-ku, Tokyo
162-8601, Japan.
I. Experiments A. Synthesis of [Au25(SC12H25)18]– and [PdAu24(SC12H25)18]0
[Au25(SC12H25)18]– and [PdAu24(SC12H25)18]0 were synthesized by the methods reported in our previous studies.1,2 B. Ligand exchange reactions between cluster and incoming thiol
0.14 µmol of [Au25(SC12H25)18]– or [PdAu24(SC12H25)18]0 was dissolved in 500 µL of dichloromethane. To this solution, 140 µmol of CnH2n+1SH (n = 6, 8, 10, or 16) or PhC2H4SH was added and the solution was stirred at room temperature. At each reaction time, 5 µL of the solution was separated, washed with a mixture of methanol and water to remove excess thiols, and then characterized by matrix-assisted laser desorption ionization (MALDI) mass spectrometry. C. Ligand exchange reaction between two kinds of clusters
0.07 µmol of [Au25(SC12H25)18]– or [PdAu24(SC12H25)18]0 was dissolved in 250 µL of dichloromethane. To this solution, 0.07 µmol of [Au25(SC10H21)18]– or [PdAu24(SC10H21)18]0 was added and the solution was stirred at room temperature. At each reaction time, 5 µL of the solution was separated and then characterized by MALDI mass spectrometry. D. Characterization
MALDI mass spectra were collected using a linear time-of-flight mass spectrometer (Applied Biosystem, Voyager Linear RD VDA 500) using a nitrogen laser (wavelength: 337 nm). High-resolution MALDI mass spectra (Figures S3) were collected using a spiral time-of-flight mass spectrometer (JEOL Ltd., JMS−S3000) using a semiconductor laser (wavelength: 349 nm). In the MALDI experiments, trans-2-[3-(4-tert-butylphenyl)-2-methyl-2-propenylidene]malononitrile (DCTB) was used as the matrix. The cluster-to-matrix ratio was set to 1:1000.
Electrospray ionization (ESI) mass spectrometry was performed using a Fourier-transform mass spectrometer (Bruker, Solarix). 1 mg/mL of toluene/acetonitrile (1:1, v:v) solution of [Au25(SC12H25)18]– or [PdAu24(SC12H25)18]0 was electrosprayed at a flow rate of 800 µL/h. In the mass analysis of [PdAu24(SC12H25)18]0, a small amount of (C4H9)4N+ was added to the solution to observe the neutral [PdAu24(SC12H25)18]0 as a cation.
UV–Vis absorption spectra of the clusters were recorded in toluene at ambient temperature with a spectrometer (JASCO, V-630).
II. Analysis The average numbers of exchanged ligands, xave, were estimated as
xave = xx=0
18
∑ I(x)
I(y)y=0
18
∑"
#$$
%
&''
(1)
where x and y are the number of exchanged ligands and I(x) and I(y) are the ion intensities observed in the mass spectra for each x and y, respectively.
Electronic Supplementary Material (ESI) for NanoscaleThis journal is © The Royal Society of Chemistry 2012
S2
III. Characterization
Figure S1. Structural representation of (a) Au25(SR)18 (Refs. 3 and 4) and (b) PdAu24(SR)18 (Ref. 2). (The R moieties are omitted for clarity in both figures.)
Figure S2. Negative-ion MALDI mass spectra of (a) [Au25(SC12H25)18]− and (b) [PdAu24(SC12H25)18]0, which were used in this study. In (a), the asterisk indicates laser fragments. In (a) and (b), only peaks attributed to [Au25(SC12H25)18]− and [PdAu24(SC12H25)18]0 were observed, indicating that [Au25(SC12H25)18]− and [PdAu24(SC12H25)18]0 with a high purity were used in this study.
Electronic Supplementary Material (ESI) for NanoscaleThis journal is © The Royal Society of Chemistry 2012

S3
Figure S3. Comparison of experimental data obtained by high-resolution MALDI mass spectrometry with the calculated isotope pattern for (a) [Au25(SC12H25)18]− and (b) [PdAu24(SC12H25)18]0. In (a) and (b), the experimental data is well consistent with the calculated isotope pattern, supporting the identification of the products.
Figure S4. Optical absorption spectra of [Au25(SC12H25)18]− and [PdAu24(SC12H25)18]0. The optical absorption spectrum of [Au25(SC12H25)18]− is well consistent with that reported for anionic [Au25(SR)18]− (Refs. 1 and 4).
Electronic Supplementary Material (ESI) for NanoscaleThis journal is © The Royal Society of Chemistry 2012
S4
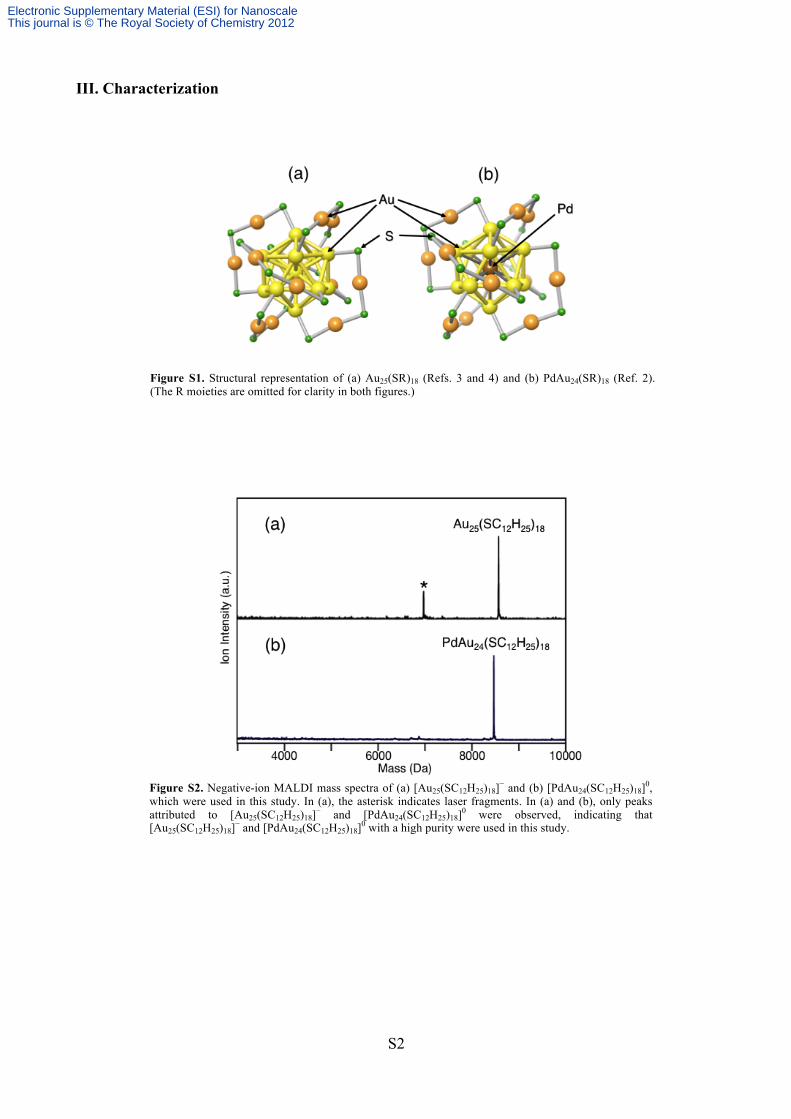
Figure S5. Time dependence of absorption spectra of a CH2Cl2 solution of a mixture of [PdAu24(SC12H25)18]0 and C6H13SH (entry 7 in Table 1). Absorption spectrum exhibited only a slight change, even after 240 min. A similar phenomenon was observed for the reactions of entries 1–6 and 8–16 in Table 1.
Figure S6. Negative-ion MALDI mass spectra of the product formed by the reaction between [Au25(SC12H25)18]− and C6H13SH in dichloromethane (entry 1 in Table 1).
Electronic Supplementary Material (ESI) for NanoscaleThis journal is © The Royal Society of Chemistry 2012
S5
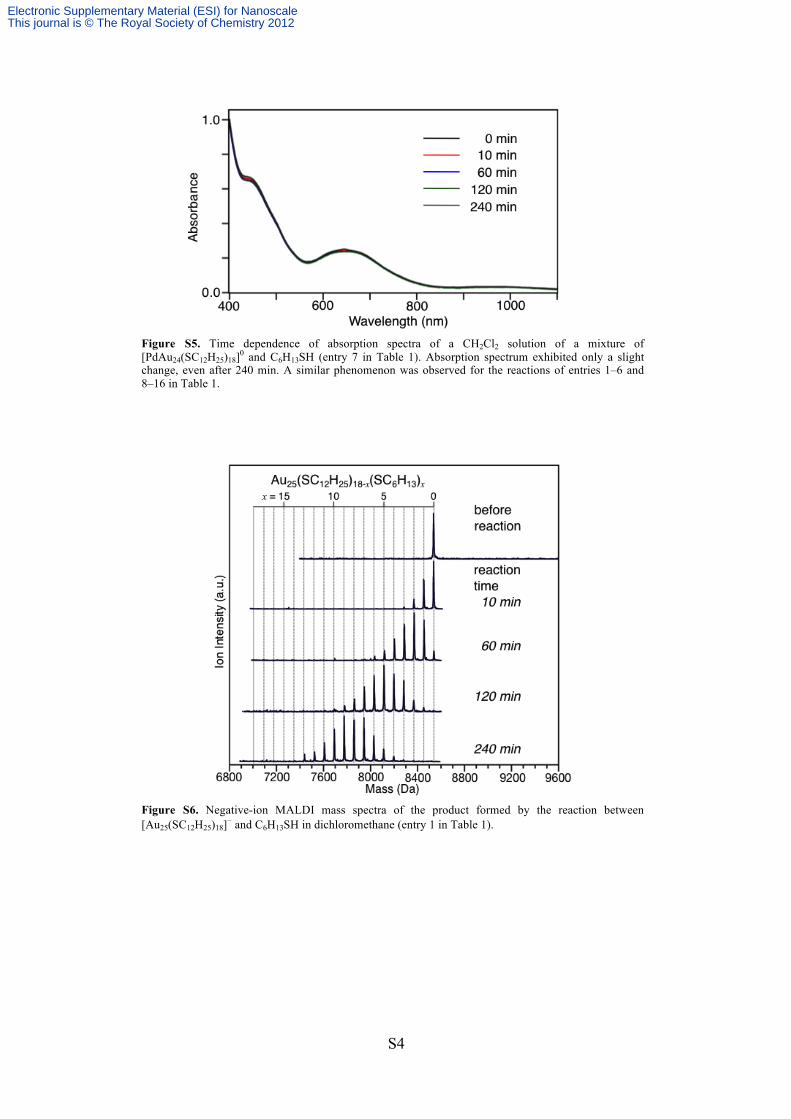
Figure S7. Negative-ion MALDI mass spectra of the product formed by the reaction between [Au25(SC12H25)18]− and C8H17SH in dichloromethane (entry 2 in Table 1).
Figure S8. Negative-ion MALDI mass spectra of the product formed by the reaction between [Au25(SC12H25)18]− and C10H21SH in dichloromethane (entry 3 in Table 1).
Electronic Supplementary Material (ESI) for NanoscaleThis journal is © The Royal Society of Chemistry 2012

S6
Figure S9. Negative-ion MALDI mass spectra of the product formed by the reaction between [Au25(SC12H25)18]− and C16H33SH in dichloromethane (entry 4 in Table 1).
Figure S10. Negative-ion MALDI mass spectra of the product formed by the reaction between [Au25(SC12H25)18]− and PhC2H4SH in dichloromethane (entry 5 in Table 1).
Electronic Supplementary Material (ESI) for NanoscaleThis journal is © The Royal Society of Chemistry 2012
S7
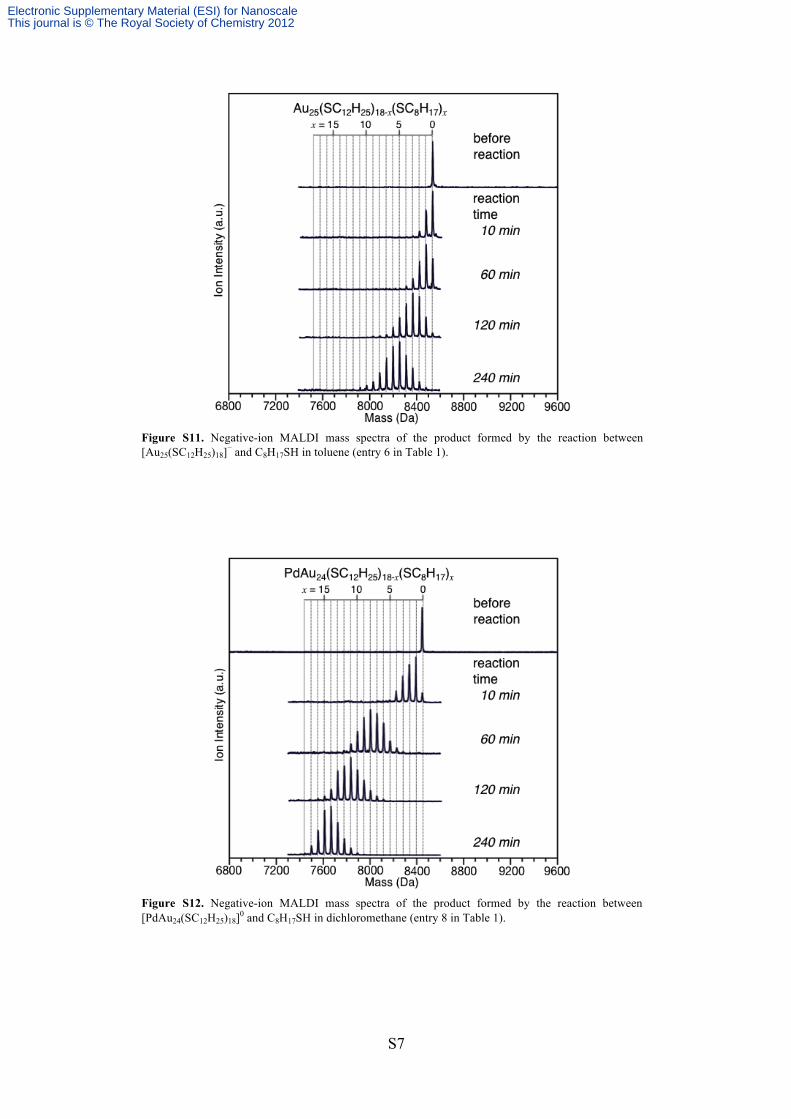
Figure S11. Negative-ion MALDI mass spectra of the product formed by the reaction between [Au25(SC12H25)18]− and C8H17SH in toluene (entry 6 in Table 1).
Figure S12. Negative-ion MALDI mass spectra of the product formed by the reaction between [PdAu24(SC12H25)18]0 and C8H17SH in dichloromethane (entry 8 in Table 1).
Electronic Supplementary Material (ESI) for NanoscaleThis journal is © The Royal Society of Chemistry 2012
S8
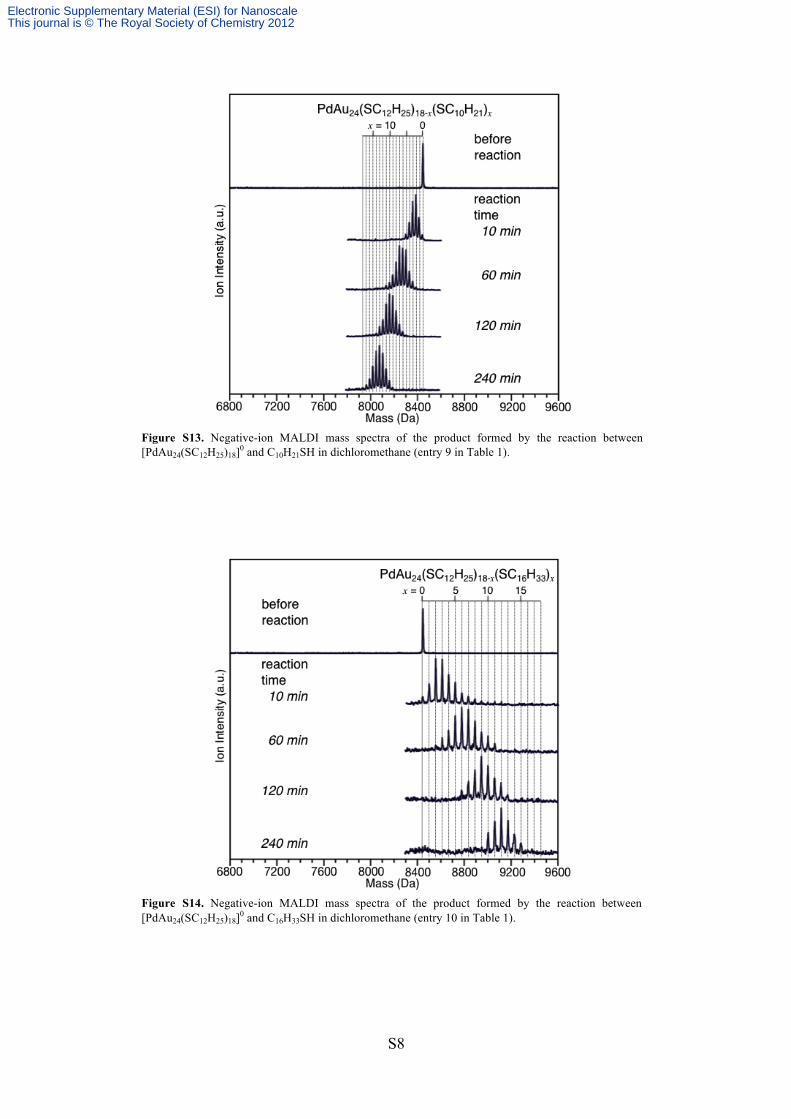
Figure S13. Negative-ion MALDI mass spectra of the product formed by the reaction between [PdAu24(SC12H25)18]0 and C10H21SH in dichloromethane (entry 9 in Table 1).
Figure S14. Negative-ion MALDI mass spectra of the product formed by the reaction between [PdAu24(SC12H25)18]0 and C16H33SH in dichloromethane (entry 10 in Table 1).
Electronic Supplementary Material (ESI) for NanoscaleThis journal is © The Royal Society of Chemistry 2012
S9
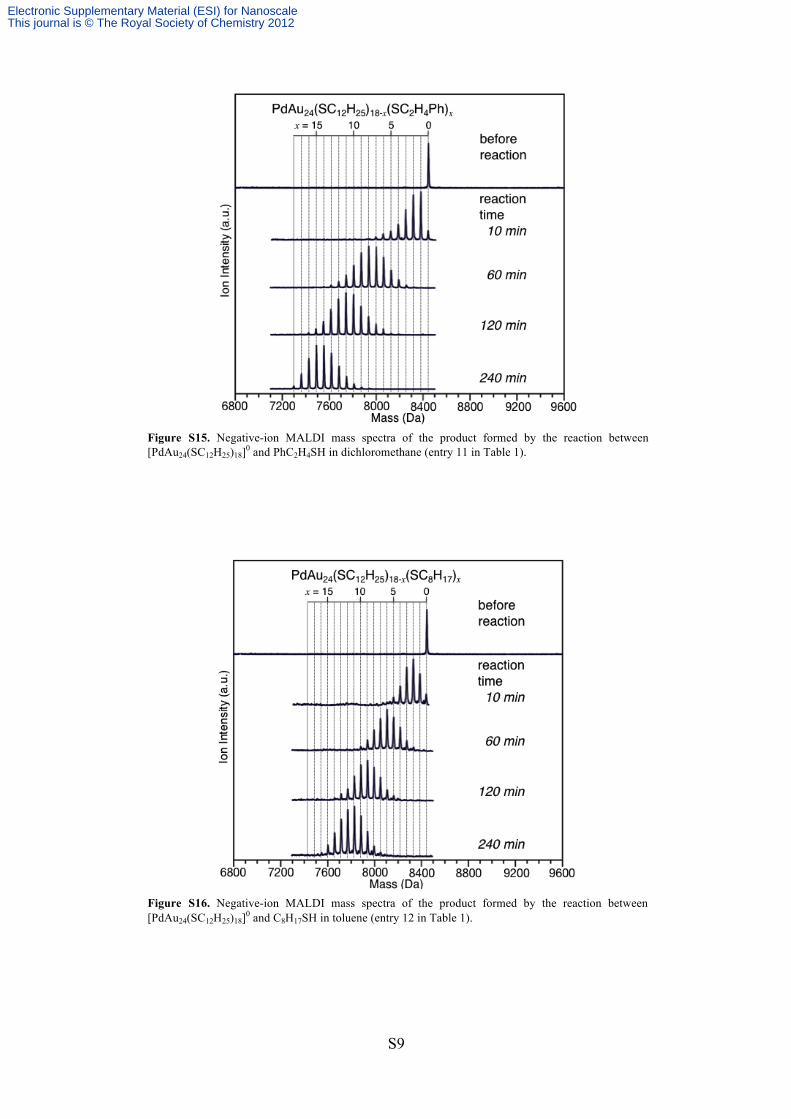
Figure S15. Negative-ion MALDI mass spectra of the product formed by the reaction between [PdAu24(SC12H25)18]0 and PhC2H4SH in dichloromethane (entry 11 in Table 1).
Figure S16. Negative-ion MALDI mass spectra of the product formed by the reaction between [PdAu24(SC12H25)18]0 and C8H17SH in toluene (entry 12 in Table 1).
Electronic Supplementary Material (ESI) for NanoscaleThis journal is © The Royal Society of Chemistry 2012

S10
Figure S17. Negative-ion MALDI mass spectra of the product formed by the reaction between [Au25(SC12H25)18]0 and C6H13SH in dichloromethane (entry 13 in Table 1).
Figure S18. Negative-ion MALDI mass spectra of the product formed by the reaction between [Au25(SC12H25)18]0 and C8H17SH in dichloromethane (entry 14 in Table 1).
Electronic Supplementary Material (ESI) for NanoscaleThis journal is © The Royal Society of Chemistry 2012

S11
Figure S19. Negative-ion MALDI mass spectra of the product formed by the reaction between [Au25(SC12H25)18]0 and C10H21SH in dichloromethane (entry 15 in Table 1).
Figure S20. Negative-ion MALDI mass spectra of the product formed by the reaction between [Au25(SC12H25)18]0 and C8H17SH in toluene (entry 16 in Table 1).
Electronic Supplementary Material (ESI) for NanoscaleThis journal is © The Royal Society of Chemistry 2012

S12
Figure S21. Optical absorption spectrum of [Au25(SC12H25)18]0, which was formed by leaving [Au25(SC12H25)18]− in acetone for 3 days. This optical absorption spectrum is well consistent with that reported for [Au25(SC2H4Ph)18]0 by Jin’s group (Ref. 5).
Figure S22. Plot of average number of exchanged ligands, xave, against reaction time for (red) the reaction between [Au25(SC12H25)18]0 and C6H13SH in CH2Cl2 (entry 13) and (black) that between [Au25(SC12H25)18]− and C6H13SH in CH2Cl2 (entry 1). This result indicates that the reaction rate depends on the charge state of Au25(SC12H25)18; [Au25(SC12H25)18]0 reacts with C6H13SH faster than [Au25(SC12H25)18]0. A similar phenomenon was observed under the other experimental conditions (Table 1).
Electronic Supplementary Material (ESI) for NanoscaleThis journal is © The Royal Society of Chemistry 2012
S13
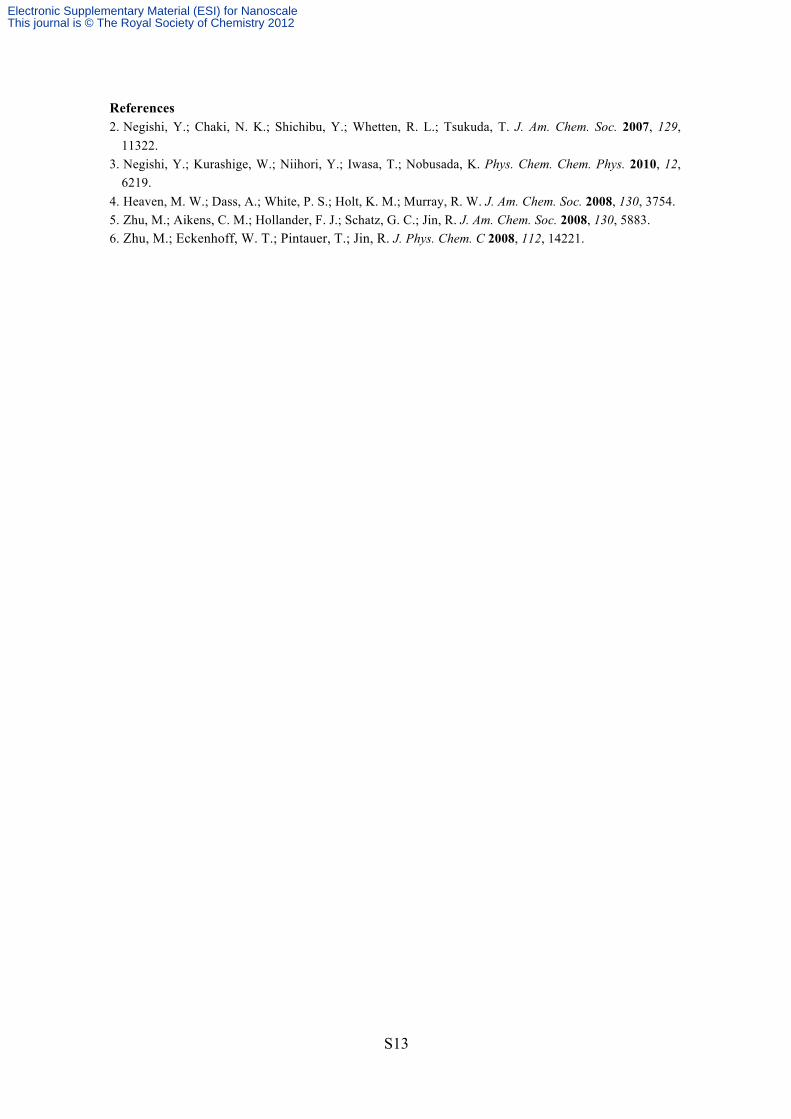
References 2. Negishi, Y.; Chaki, N. K.; Shichibu, Y.; Whetten, R. L.; Tsukuda, T. J. Am. Chem. Soc. 2007, 129,
11322. 3. Negishi, Y.; Kurashige, W.; Niihori, Y.; Iwasa, T.; Nobusada, K. Phys. Chem. Chem. Phys. 2010, 12,
6219. 4. Heaven, M. W.; Dass, A.; White, P. S.; Holt, K. M.; Murray, R. W. J. Am. Chem. Soc. 2008, 130, 3754. 5. Zhu, M.; Aikens, C. M.; Hollander, F. J.; Schatz, G. C.; Jin, R. J. Am. Chem. Soc. 2008, 130, 5883. 6. Zhu, M.; Eckenhoff, W. T.; Pintauer, T.; Jin, R. J. Phys. Chem. C 2008, 112, 14221.
Electronic Supplementary Material (ESI) for NanoscaleThis journal is © The Royal Society of Chemistry 2012