
RELIABILITY TESTING AND HEAT TRANSFER … · selection of the appropriate phase change material...
184
RELIABILITY TESTING AND HEAT TRANSFER ENHANCEMENT OF ORGANIC PHASE CHANGE MATERIALS RAVI KUMAR SHARMA A THESIS SUBMITTED IN FULFILLMENT OF THE REQUIREMENTS FOR THE AWARD OF THE DEGREE OF DOCTOR OF PHILOSOPHY FACULTY OF ENGINEERING UNIVERSITY OF MALAYA KUALA LUMPUR 2016
Transcript of RELIABILITY TESTING AND HEAT TRANSFER … · selection of the appropriate phase change material...

RELIABILITY TESTING AND HEAT TRANSFER
ENHANCEMENT OF ORGANIC PHASE CHANGE MATERIALS
RAVI KUMAR SHARMA
A THESIS SUBMITTED IN FULFILLMENT OF THE
REQUIREMENTS FOR THE AWARD OF THE DEGREE OF
DOCTOR OF PHILOSOPHY
FACULTY OF ENGINEERING
UNIVERSITY OF MALAYA
KUALA LUMPUR
2016

ii
UNIVERSITI MALAYA
ORIGINAL LITERARY WORK DECLARATION
Name of Candidate: Ravi Kumar Sharma (I.C/Passport No: L3898069, F1242071
(Old))
Registration/Matric No: KHA110122
Name of Degree: Doctor of Philosophy (PhD)
Title of Project Paper/Research Report/ Dissertation/Thesis (―this work‖):
Reliability Testing and Heat Transfer Enhancement of Organic Phase Change Materials
Field of study: Mechanical Engineering
I do solemnly and sincerely declare that:
(1) I am the sole author/writer of this work;
(2) This work is original;
(3) Any use of any work in which copyright exists was done by way of fair dealing and
for permitted purposes and any excerpt and extract from, or reference to or
reproduction of any copyright work has been disclosed expressly and sufficiently
and the title of the work and its authorship have been acknowledged in this work;
(4) I do not have any actual knowledge nor do I ought reasonably to know that
making of this work constitutes an infringement of any copyright work;
(5) I hereby assign all and every right in the copyright to this work to the University
of Malaya (―UM‖), who henceforth shall be the owner of the copyright in
this work and that any reproduction or use in any form or by any means whatsoever
is prohibited without the consent of UM having been first had and obtained;
(6) I am fully aware that if in course of making this work I have infringed any
copyright whether intentionally or otherwise, I may be subject to legal action or any
other action as may be determined by UM.
Candidate’s Signature Date
Subscribed and solemnly declares before,
Witness’s Signature Date
Name:
Designation:

iii
ABSTRACT
The design and development of a thermal energy storage device require discrete
selection of the appropriate phase change material (PCM) and a suitable container to
contain them. This study focuses on the selection of PCMs for solar thermal energy
storage devices and the improvement in their thermophysical properties. In addition, a
new shape of the PCM container is also investigated using computational fluid
dynamics.
The accelerated thermal cycle test is an essential requirement to ensure the
thermal and chemical stability of selected PCMs to be used in practical applications.
Solar energy being an unlimited natural energy source is used in a large number of
applications such as solar water/air heating, cooking, drying and other domestic and
commercial applications. On the other hand, this energy also has limitations as this is
available only in the daytime. Storage of this abundantly available solar energy can be
effectively used in the night hours or when there are no sunny days. Four organic
PCMs-paraffin wax, palmitic acid, myristic acid, and polyethylene glycol (PEG) 6000,
all in the melting temperature range of 50-70 ˚C, have been considered in this study and
the changes in their thermal and chemical properties have been measured using the
differential scanning calorimetry and the Fourier transform infrared techniques. The
results of this research work revealed that the changes in the melting temperature of
paraffin wax, palmitic acid, myristic acid, and PEG 6000 were in the range of +0.72 ˚C
to +3.27 ˚C, -0.29 ˚C to +1.76 ˚C, -2 ˚C to +1.2 ˚C, and 3.77 to 3.94 ˚C respectively.
The variation in the latent heat of fusion was found in the range of -9.8 to 14%, 3.28 to
18%, 0.9 to 10%, and 13 to 25 % for paraffin wax, palmitic acid, myristic acid, and
PEG 6000 respectively.

iv
The low thermal conductivity of organic PCMs is a well-known drawback which
limits their use in many domestic and industrial applications. A composite of palmitic
acid and nano titanium dioxide (TiO2) was prepared and its phase change behavior was
investigated. TiO2 nanoparticles of 0.5%, 1.0%, 3.0%, and 5.0% were dispersed into
palmitic acid and the thermophysical properties of these nano composites were
measured. The composite PCMs were characterized by FESEM, XRD, and FT-IR. The
thermal properties, thermal stability and thermal reliability were ensured by DSC, TGA,
and thermal cycle testing. FESEM images show the uniform dispersion of nanoparticles
in the palmitic acid and FT-IR spectrum indicate that the composite PCM possesses
good chemical stability and interaction between PCM and nanoparticles. The results of
a thermal conductivity test show that the dispersion of the 5% nanoparticles enhances
the thermal conductivity of palmitic acid by 80%.
Finally, a novel trapezoidal cavity is proposed for containing the PCM and a
detailed parametric study was carried out using two nano enhanced PCMs, paraffin-Cu
and water-Cu based on the computational study. The effect of side wall inclination
angle, cold wall temperature, nanofluid’s initial temperature, cavity inclination, Grashof
number on the total solidification time of nanofluid was simulated. The total
solidification time for different wt% of Cu nanoparticles was also investigated in the
trapezoidal cavity. The enthalpy–porosity technique is used to trace the solid–liquid
interface. The inclination angle can be used efficiently to control the solidification time.
In addition, the average Nusselt number along the hot wall for different angles,
nanoparticles volume fractions, and Grashof number are presented graphically. The
proposed predictions are very helpful in developing an improved latent heat thermal
energy storage for the solar heat collector and for casting and mold design.

v
ABSTRAK
Reka bentuk dan pembangunan peranti penyimpanan tenaga haba memerlukan
pemilihan diskret bahan perubahan fasa yang sesuai (PCM), dan bekas yang sesuai
untuk membendungnya. Kajian ini memberi tumpuan kepada pemilihan PCMS untuk
peranti penyimpanan tenaga haba solar, peningkatan dalam hartanah termofizikal
mereka dan reka bentuk bekas PCM novel.
Ujian kitaran haba adalah satu keperluan yang penting untuk memastikan kestabilan
haba dan kimia bagi PCMS yang dipilih untuk digunakan dalam aplikasi praktikal.
Tenaga solar sebagai sumber tenaga semula jadi boleh digunakan dalam sebilangan
besar aplikasi seperti solar air / pemanasan udara, memasak, pengeringan dan aplikasi
domestik dan komersial lain. Tetapi, tenaga ini juga mempunyai had kerana janya hanya
boleh diterima pada siang hari. Penstoran tenaga solar ini boleh digunakan dengan
berkesan pada waktu malam atau pada hari hujan. Empat organik PCMS iaitu lilin
parafin, asid palmitik, asid Myritic, dan polietilena glikol (PEG) 6000, dalam
lingkungan suhu lebur 50-70 C, telah dipertimbangkan dalam kajian ini dan perubahan
dalam sifat haba dan kimia mereka telah diukur menggunakan kalorimeter dan jelmaan
Fourier teknik inframerah. Hasil kajian menunjukkan bahawa perubahan dalam suhu
lebur lilin parafin, asid palmitik, asid Myritic dan PEG 6000 adalah dalam lingkungan
+0.72 ˚C hingga +3.27 ˚C, -0.29 ˚C kepada +1.76 ˚C, -2 ˚C kepada +1.2 ˚C, dan
masing-masing 3.77-3.94 ˚C. Perubahan dalam haba pendam pelakuran ditemui dalam
julat -9.8 kepada 14%, 3.28-18%, 0.9-10%, dan 13 hingga 25% untuk lilin parafin, asid
palmitik, asid Myritic dan PEG 6000 masing-masing.
Kekonduksian haba yang rendah adalah kelemahan yang ketara untuk PCM
organik yang menghadkan penggunaannya dalam aplikasi domestik dan industri.

vi
Komposit palmitik asid dan nano titanium dioksida (TiO2) serta perubahan fasa
komposit tersebut akan dikaji. Nanopartikel TiO2 sebanyak 0.5%, 1.0%, 3.0% dan 5.0%
disertakan ke dalam asid palmitik dan termofizikal komposit tersebut juga diukur. PCM
komposit akan dianalisis mengunakanFESEM dan FT-IR. Sifat haba, kestabilan terma
dan kebolehpercayaan haba telah dikaji mengunakan DSC, TGA, dan ujian kitaran
haba. Imej FESEM menunjukkan penyebaran seragam nanopartikel dalam asid Palmitic
dan spektrum FT-IR menunjukkan bahawa PCM komposit mempunyai kestabilan kimia
yang baik dan interaksi antara PCM dan nanopartikel. Keputusan ujian kekonduksian
haba menunjukkan bahawa penyebaran 5% nanopartikel mempertingkatkan
kekonduksian sebanyak 80%.
Akhir sekali, rongga trapezoid dicadangkan sebagai bekas PCMdan kajian parametrik
terperinci telah dijalankan menggunakan dua nano-PCMS, iaitu parafin-Cu dan air-Cu.
Kesan sudut dinding sebelah kecenderungan, suhu dinding sejuk, suhu awal NEPCM
tersebut, kecondongan, nombor Grashof pada jumlah masa pemejalan daripada NEPCM
telah disiasat mengunakan perisian komputer. Jumlah masa pemejalan untuk berat%
yang berbeza daripada nanopartikel Cu turut disiasat dalam rongga trapezoid. Teknik
entalpi-keliangan digunakan untuk mengesan antara muka pepejal-cecair. Sudut
kecondongan boleh digunakan dengan cekap untuk mengawal masa pemejalan. Di
samping itu, bilangan Nusselt purata di sepanjang dinding panas untuk sudut yang
berbeza, nanopartikel pecahan isi padu, dan nombor Grashof di beri secara grafik.
Ramalan yang dicadangkan adalah sangat berguna dalam aplikas haba pendam
penyimpanan tenaga haba untuk pengumpul haba suria dan untuk tuangan dan reka
bentuk acuan.

vii
ACKNOWLEDGEMENTS
I would like to express my sincere thanks and deepest gratitude to my supervisor Dr.
Poo Balan Ganesan for his constant encouragement, motivation, advice, support, and
supervision throughout these few years of my study here in Malaysia. My special thanks
goes to Dr. V.V. Tyagi, of Shri Mata Vaishno Devi University, Katra, India for his
guidance in the area of phase change materials.
I would like to sincerely put on record the research assistantship I had received
from Dr. Henk Metselaar, Department of Mechanical Engineering for completing this
project, without this help I could not have sustained for the period I had spent in
carrying out this research. This study would not have been possible without the funding
from University of Malaya Research Grant and High Impact Research Grant. I am
thankful to the directors of UMRG and HIR for the financial and moral support. I would
also like to thank all of the faculty members, especially in the Department of
Mechanical Engineering, University of Malaya for their support and advice during the
various stages of this study.
A special thanks to my wife Babita and daughter Avani. I hope I can repay them
the time they have lost not being together all these years. Words cannot express how
grateful I am to my mother-in law, father-in-law, my mother, and father for all of the
sacrifices that they have made on my behalf. I am also indebted to my fellow
research friends, Sujit Singh, Amin Kazemzadeh, Mohammad Pourtousi, Manoj
Tripathi, and Adarsh Pandey for their direct and indirect help during my study. I had
truly enjoyed and benefited from all the discussions and time we have had.

viii
TABLE OF CONTENTS
ORIGINAL LITERARY WORK DECLARATION ................................................................ ii
ABSTRACT ............................................................................................................................. iii
ABSTRAK ................................................................................................................................. v
ACKNOWLEDGEMENTS .................................................................................................... vii
TABLE OF CONTENTS ....................................................................................................... viii
LIST OF FIGURES ............................................................................................................... xiii
LIST OF TABLES ................................................................................................................ xvii
CHAPTER 1: INTRODUCTION ............................................................................................. 1
1.1 Research background ........................................................................................................... 1
1.2 Problem statement ................................................................................................................ 4
1.3 Research objectives .............................................................................................................. 5
1.3.1 Scope .................................................................................................................... 5
1.4 Thesis structure .................................................................................................................... 6
CHAPTER 2: LITERATURE REVIEW .................................................................................. 9
2.1 Thermal energy storage ........................................................................................................ 9
2.1.1 Phase change materials ...................................................................................... 11
2.1.2 Classification of PCMs ...................................................................................... 11
2.1.3 Thermo-physical properties ............................................................................... 13
2.1.4 Geometry of PCM container .............................................................................. 15
2.2 Organic PCMs .................................................................................................................... 15
2.2.1 Paraffins ......................................................................................................... 16
2.2.2 Fatty acids ...................................................................................................... 20
2.2.3 Sugar alcohol ...................................................................................................... 26
2.2.4 Poly(ethylene glycol)s ........................................................................................ 28

ix
2.3 Enhancement of thermal conductivity of organic PCMs ................................................... 31
2.4 Characterization techniques for organic PCMs.................................................................. 32
2.5 Applications of organic PCMs ........................................................................................... 34
2.5.1 Cooling/heating of buildings .............................................................................. 34
2.5.1.1 PCM walls and wallboard ........................................................................... 34
2.5.1.2 PCM Floors and ceilings for passive solar heating .................................... 37
2.5.2 Solar energy storage ........................................................................................... 40
2.5.2.1 Solar water/air heating ................................................................................ 41
2.5.2.2 Solar dryer ................................................................................................... 52
2.6 Accelerated thermal cycle test ........................................................................................... 56
2.7 Summary and research gap ................................................................................................ 57
CHAPTER 3: THERMAL CYCLE TESTING OF ORGANIC PCMs .................................. 59
3.1 Introduction ........................................................................................................................ 59
3.2 Methodology ...................................................................................................................... 60
3.2.1 Materials ............................................................................................................. 60
3.2.2 Equipment .......................................................................................................... 60
3.2.3 Experimental test rig for accelerated thermal cycle testing ............................... 61
3.2.4 Experimental method ......................................................................................... 62
3.3 Results and discussion ....................................................................................................... 63
3.3.1 Thermophysical properties of O-PCMs before cycle test .................................. 63
3.3.2 Thermophysical properties of O-PCMs after cycle test ..................................... 66
3.3.2.1 Paraffin wax ................................................................................................ 67
3.3.2.2 Palmitic acid ................................................................................................ 70
3.3.2.3 Myristic acid................................................................................................ 73
3.3.2.4 Polyethylene glycol 6000 ............................................................................ 76

x
3.3.3 Chemical functional group analysis of O-PCMs ............................................................ 81
3.4 Techno-economic analysis of O-PCMs ............................................................................. 85
3.5 Summary ............................................................................................................................ 89
CHAPTER 4: ENHANCEMENT IN HEAT TRANSFER OF ORGANIC PCM .................. 91
4.1 Introduction ........................................................................................................................ 91
4.2 Methodology ...................................................................................................................... 92
4.2.1 Materials ............................................................................................................. 92
4.2.2 Preparation of composite materials .................................................................... 92
4.2.3 Instruments ......................................................................................................... 93
4.2.3.1 For preparation of composite PCMs ........................................................... 93
4.2.3.2 Chemical analysis of NEOPCMs ................................................................ 94
4.2.3.3 Thermal reliability test ................................................................................ 94
4.2.3.4 DSC analysis ............................................................................................... 95
4.2.3.5 Thermal conductivity measurement ........................................................... 95
4.3 Results and discussion ....................................................................................................... 95
4.3.1 Morphology of palmitic acid and NEOPCM ..................................................... 95
4.3.2 FT-IR analysis of palmitic acid and NEOPCMs ................................................ 96
4.3.3 XRD analysis of NEOPCMs .............................................................................. 98
4.3.4 Thermal energy storage properties ..................................................................... 99
4.3.5 Thermal stability .............................................................................................. 102
4.3.6 Thermal reliability ............................................................................................ 104
4.3.7 Thermal conductivity ....................................................................................... 107
4.3.8 Summary and comparison of thermal conductivity with previous studies ...... 109
4.4 Summary .......................................................................................................................... 111
CHAPTER 5: MATHEMATICAL MODELING FOR ENHANCED
SOLIDIFICATION IN AN ENCLOSURE ........................................................................... 113

xi
5.1 Introduction ...................................................................................................................... 113
5.2 Methodology .................................................................................................................... 113
5.2.1 Geometry .......................................................................................................... 113
5.2.2 Boundary conditions .................................................................................... 114
5.2.3 Governing equations .................................................................................... 116
5.2.4 Simulation cases ........................................................................................... 119
5.2.5 Mesh independency test ............................................................................... 121
5.2.6 Numerical methods ...................................................................................... 122
5.2.7 Selection of nano enhanced phase change materials.................................... 123
5.3 Results and discussion ..................................................................................................... 124
5.3.1 Validation of the numerical model ................................................................... 124
5.3.2 Solidification of paraffin-Cu nanoparticles nanofluid filled in trapezoidal cavity
................................................................................................................................... 129
5.3.2.1 Effect of trapezoidal cavity of the total solidification time....................... 130
5.3.2.2 Effect of nanoparticle volume fraction on the total solidification time of
paraffin based nanofluid ........................................................................................ 131
5.3.3 Solidification of water-Cu nanoparticles nanofluid filled in trapezoidal cavity
................................................................................................................................... 131
5.3.3.1 Effect of nanoparticle volume fraction on solidification time .................. 132
5.3.3.2 Effect of inclination angles ....................................................................... 133
5.3.3.3 Effects of temperature difference and Grashof number ............................ 137
5.3.3.4 Effect of Grashof number on Nusselt number .......................................... 139
5.4 Summary .......................................................................................................................... 141
CHAPTER 6: CONCLUSIONS AND FUTURE WORKS .................................................. 142
6.1 Conclusions ...................................................................................................................... 142
6.2 Future works .................................................................................................................... 144
REFERENCES ....................................................................................................................... 145

xii
Appendices ............................................................................................................................. 167

xiii
LIST OF FIGURES
Figure 1.1 Storage capacity and discharge feature of various forms of energy storage
units ................................................................................................................................... 2
Figure 2.1: Classifications of phase change materials .................................................... 12
Figure 2.2 (a) Vacuum impregnation method, (b) schematic of thermal performance test
......................................................................................................................................... 28
Figure 2.3 Diurnal energy storage versus melt temperature for an interior wall ............ 35
Figure 2.4 (a) Numerical model of nano-enhanced wallboard (b) Wallboard embedded
with nanoPCM for experimental study ........................................................................... 37
Figure 2.5 Outline of heat pipe/PCM insulation system ................................................. 38
Figure 2.6 Principal function of PCM ―free-cooling system‖: (left) cooling of PCM at
night, (right) cooling of building during the day............................................................. 38
Figure 2.7 Under-floor electric heating system............................................................... 40
Figure 2.8 Design of solar water heater .......................................................................... 41
Figure 2.9. (a) cross sectional view of the storage tank (b) Temperature variations with
time .................................................................................................................................. 43
Figure 2.10 (a) Schematic diagram of storage tank, (b) variation of the pipe surface
temperature with distance from entrance ........................................................................ 44
Figure 2.11 Solar water heating system with PCM....................................................... 46
Figure 2.12 (a) Air heating system, A, collector assembly with PCM and air-heating
subsystem; B, heated space, (b) arrangement of PCM modules in the collector ............ 48
Figure 2.13 Four test boxes at the site ............................................................................ 48
Figure 2.14 Arrangement of the packed bed model ........................................................ 50
Figure 2.15 (a) heat storage unit with front and top walls, (b) numerical model ............ 51
Figure 2.16 (a) Cross-sectional view of ETC tube with TES, (b) schematic of the
experimental set-up ......................................................................................................... 52
Figure 2.17 Hybrid-solar dryer for mushroom ................................................................ 54
Figure 2.18 (a) drying compartment, (b) variation in the temperature of the drying air 55
Figure 3.1 Schematic of thermal cycle tester .................................................................. 62

xiv
Figure 3.2 DSC curve of paraffin wax at 0th
thermal cycle ............................................ 64
Figure 3.3 DSC curve of palmitic acid at 0th
thermal cycle ............................................ 64
Figure 3.4 DSC curve of myristic acid at 0th
thermal cycle ............................................ 65
Figure 3.5 DSC curve of PEG 6000 at 0th
thermal cycle ................................................ 65
Figure 3.6 DSC curve of paraffin wax after 100th
thermal cycle .................................... 68
Figure 3.7 DSC curve of paraffin wax after 500th
thermal cycle .................................... 68
Figure 3.8 DSC curve of paraffin wax after 1000th
thermal cycle .................................. 69
Figure 3.9 DSC curve of paraffin wax after 1500th
thermal cycle .................................. 69
Figure 3.10 DSC curves of paraffin wax at different number of cycles during the
thermal cycle test............................................................................................................. 70
Figure 3.11 DSC curve of palmitic acid after 100th
thermal cycle ................................. 71
Figure 3.12 DSC curve of palmitic acid after 500th
thermal cycle ................................. 71
Figure 3.13 DSC curve of palmitic acid after 1000th
thermal cycle ............................... 72
Figure 3.14 DSC curve of palmitic acid after 1500th
thermal cycle ............................... 72
Figure 3.15 DSC curves of palmitic acid during thermal cycle test ............................... 73
Figure 3.16 DSC curve of myristic acid after 100th
thermal cycle ................................. 74
Figure 3.17 DSC curve of myristic acid after 500th
thermal cycle ................................. 74
Figure 3.18 DSC curve of myristic acid after 1000th
thermal cycle ............................... 75
Figure 3.19 DSC curve of myristic acid after 1500th
thermal cycle ............................... 75
Figure 3.20 DSC curves of myristic acid during thermal cycle test ............................... 76
Figure 3.21 DSC curve of PEG 6000 after 100th
thermal cycle ...................................... 78
Figure 3.22 DSC curve of PEG 6000 after 500th
thermal cycle ...................................... 78
Figure 3.23 DSC curve of PEG 6000 after 1000th
thermal cycle .................................... 79
Figure 3.24 DSC curve of PEG 6000 after 1500th
thermal cycle .................................... 79
Figure 3.25 DSC curves of PEG 6000 during thermal cycle test .................................. 80
Figure 3.26 FT-IR spectra of uncycled (fresh) and cycled (1500 cycles) paraffin ......... 83

xv
Figure 3.27 FTIR spectra of uncycled (fresh) and cycled (1500 cycles) palmitic acid .. 84
Figure 3.28 FTIT spectra of uncycled (fresh)and cycled (1500 cycles) myristic acid ... 84
Figure 3.29 FT-IR spectra of PEG 6000 before and after thermal cycle test .................. 85
Figure 4.1 Preparation steps of PA/TiO2 composites...................................................... 93
Figure 4.2 FESEM images of (a) TiO2, (b) NEPCM4 (5wt% TiO2) at 5000
magnification, and (c) NEPCM4 at 20000 magnifications ............................................. 96
Figure 4.3 FT-IR Spectrum of pure PA, TiO2, and NEOPCMs ...................................... 97
Figure 4.4 XRD patterns of pure PA, TiO2, and NEOPCMs .......................................... 98
Figure 4.5 DSC measurement of PA and NEOPCMs ..................................................... 99
Figure 4.6 Effect of mass fraction of TiO2 nanoparticles on the latent heat ................. 102
Figure 4.7 TGA curves of PA and NEOPCM4 ............................................................. 103
Figure 4.8 DTG curves of PA and NEOPCM4 ............................................................. 104
Figure 4.9 (a) Melting DSC curves (b) FT-IR spectrum of pure PA before and after the
thermal cycle test........................................................................................................... 105
Figure 4.10 (a) Melting DSC curves (b) FT-IR spectrum of NEOPCM3 before and after
thermal cycle test........................................................................................................... 106
Figure 4.11 (a) Thermal conductivity and (b) conductivity ratio of PA and NEOPCM1-
NEOPCM4 .................................................................................................................... 109
Figure 5.1 Sketch of the two dimensional trapezoidal cavity ....................................... 114
Figure 5.2 Meshed trapezoidal cavity ........................................................................... 121
Figure 5.3 Progress of the melting phase front with time ............................................. 125
Figure 5.4 Comparison of the temperature profile at y = 37 mm in the pure water ..... 126
Figure 5.5 Comparison of the U-velocity along the vertical mid plane of the cavity ... 127
Figure 5.5 Comparison of the U-velocity along the vertical mid plane of the cavity ... 128
Figure 5.6 Liquid fraction in trapezoidal cavity filled with nanofluid of 10% Cu
nanoparticled ................................................................................................................. 130
Figure 5.7 Liquid fraction in trapezoidal cavity of θ = 7.69° filled with paraffin and
different concentration of Cu nanoparticles .................................................................. 131
xvi
Figure 5.8 Effect of nanoparticle volume fraction on solidification time of nanofluid
within the square and trapezoidal cavity of θ = 2.72° ................................................... 133
Figure 5.9 Effects of inclination angles on solidification time of nanofluid within a
trapezoidal cavity at ΔT = 10° C and ϕ = 0.2 ................................................................ 134
Figure 5.10 Solid – liquid interface position at different time during solidification
process for temperature difference ................................................................................ 135
Figure 5.10 Solid – liquid interface position at different time during solidification
process for temperature difference of 10°C and ϕ = 0.2. (a) θ = 2.72°, (b) θ = 5.42° and
(c) θ = 7.69°. ................................................................................................................. 136
Figure 5.11 Velocity field for pure water (ϕ = 0).......................................................... 137
Figure 5.12 Effect of temperature difference on the solidification of nanofluid of
nanoparticle volume fraction 0.2 inside cavity of θ = 2.72° ......................................... 138
Figure 5.13 Effect of temperature difference on the solid-liquid interface at 100s during
solidification of nanofluid of nanoparticle volume fraction 0.2 inside cavity of θ = 2.72°
....................................................................................................................................... 138
Figure 5.14 Solid – liquid interface position for ϕ = 0.2 and θ = 2.72° at (a) 100s, and
(b) 300s ......................................................................................................................... 139
Figure 5.15 Effect of Grashof number, nanoparticle volume fraction and inclination
angle on average Nusselt number for Pr = 6.2 ............................................................. 140

xvii
LIST OF TABLES
Table 2.1 Thermo-physical properties of some paraffins, paraffin waxes, and its blends
used as latent heat storage ............................................................................................... 17
Table 2.2: Thermo-physical properties of some fatty acids used as latent heat storage . 22
Table 2.3: Thermo-physical properties of compound of fatty acids used as latent heat
storage. ............................................................................................................................ 24
Table 2.5 Organic PCM used for floor heating ............................................................... 39
Table 2.6 Minimum and maximum temperatures (±0.5 °C) in the boxes per day .......... 49
Table 2.7. Parameters considered and their range of values ........................................... 50
Table 3.1 Thermophysical properties of PCMs selected for accelerated thermal cycle
test ................................................................................................................................... 66
Table 3.2 Melting temperatures, Tm (°C) of the PCMs after repeated thermal cycles ... 81
Table 3.3 Latent heat of fusion, ∆Hf (J/g) of the PCMs after repeated thermal cycles .. 81
Table 3.4: Comparative life cycle and techno-economic analysis of O-PCMs .............. 88
Table 4.1: DSC data of melting of PA and NEOPCMs ................................................ 100
Table 4.2.Thermal properties of NEOPCM3 before and after the thermal cycle test ... 106
Table 4.3 Comparison of thermal conductivity and the latent heat of fusion of
NEOPCMswith previous similar composites ............................................................... 110
Table 5.1 Configuration of tested trapezoidal geometries ............................................ 114
Table 5.2 Thermo-physical properties of the base fluid (water) and the Cu nanoparticles
....................................................................................................................................... 115
Table 5.3 Simulation cases ............................................................................................ 120
Table 5.4 Mesh independency test ................................................................................ 122
Table 5.5 Parameters used in the validation of melting of gallium .............................. 124
Table 5.6 Comparison of the average Nusselt number for square cavity where Pr = 6.2
(water) for ϕ = 0.0 ......................................................................................................... 128
Table 5.7 Thermophysical properties of paraffin and Cu nanoparticles ....................... 129

1
CHAPTER 1: INTRODUCTION
This chapter presents the background and problem statement that are pertinent to the
topic of this research study. This study is based on the development of a thermal energy
storage using phase change materials, both experimentally and numerically. The first
chapter of this thesis presents the background of the study, gives an overview of the
research aim and objectives and describes the scope of study. This chapter also presents
a summary of the thesis structure.
1.1 Research background
A continuous increase in the gap between the energy demand and supply and the
depletion of fossil fuels has received the significant attention of researchers in the last
few decades. This increasing demand forces researchers to develop renewable energy
sources. But the storage of energy in a suitable form is as important as developing the
new sources. The demand and supply gap can be efficiently bridged by employing an
energy storage system. The capacity of energy storage in various forms and their depth
of discharge are given in Figure 1.1. Among all of the different kinds of available
energy, thermal energy is the only one which is available in abundance in the nature in
the form of solar radiation, geothermal energy and thermally stratified layers in the
ocean. This available energy, if stored in suitable storage units, can be used when solar
energy is not available. As an example, the solar energy is not available in the night
hours and cloudy days, so the heat stored in the day time can be utilized in the night
hours. The thermal energy storage system can store the energy in the form of sensible
heat in which the amount of energy stored changes with the temperature e.g. rock or
water (Farid et al., 2004). Alternatively, they can store the energy in the form of latent
heat which is absorbed or released when a substance changes its phase upon melting or

2
freezing. The temperature remains constant during this phase change process. Latent
heat thermal energy storage (LHTES) are the devices which use phase change materials
(PCMs) for energy storage and are more attractive due to their high energy storage
density and constant charge and discharge temperature. Excess energy available in the
lean hours can be used at the peak time, if it is stored properly. Every latent heat thermal
energy storage device requires an appropriate type of PCM for a particular application.
Solid-liquid phase change problems, sometime also known as moving boundary or
Stefan problems are encountered in many industrial applications such as casting and
laser drilling, latent heat thermal energy storage, food and pharmaceutical processing,
microelectronics, and protective clothing. Depending upon the initial temperature of the
material, they are categorized as one-region, two-region or multiple region problems
(Faghri & Zhang, 2006). This phase change conversion (solid - liquid) absorbs latent
heat during charging (melting) and release it during solidification (discharging).
Figure 1.1 Storage capacity and discharge feature of various forms of energy storage
units (Hammerschlag and Schaber, 2008)

3
LHTES have found their application in many industrial sectors such as, cooling of
electronic devices, domestic refrigerators, building passive cooling, solar energy
storage, food processing and transportation, medical, and textiles. Early work on the
LHTES was mainly concerned with the thermal control in aeronautics and electronic
devices in the middle of the twentieth century. A PCM for a specific application is
selected on the basis of their melting/freezing temperature, chemical/thermal stability,
latent heat of fusion, and cost, etc. A large number of review articles (Abhat, 1983;
Hasnain, 1998; Zalba et al., 2003; Farid et al., 2004; Demirbas, 2006; Kenisarin &
Mahkamov, 2007; Regin et al., 2008; Verma et al., 2008; Sharma et al., 2009; Agyenim
et al., 2010; Cabeza et al., 2011; Dutil et al., 2011; Delgado et al., 2012; Tatsidjodoung
et al., 2013; Nkwetta & Haghighat, 2014; Sharma et al., 2015) have been published in
the past where thermophysical properties of PCMs, their encapsulation methods,
applications, heat transfer enhancement and other related issues have been discussed in
detail.
Low thermal conductivity of PCMs is the primary limitation in many engineering
devices because it strongly suppresses the charging (melting) and discharging (freezing)
rate of materials, however dispersion of solid metal particles enhances this property of
the liquid substantially. The dispersion of solid particles can be done at micro or nano
level. Dispersion of micrometer or millimeter sized particles may cause the clogging in
the fluid flow and increase the pressure drop because of the rapid settling
characteristics. Nano sized particles up to a 100 nm size behave like liquid particles,
show little or no pressure drop and flow with or without little chance of clogging in the
pipes. The mixture of these nanoparticles and fluid is termed as nanofluid (Choi &
Eastman, 1995) and show considerably high thermal conductivity compared to the base
fluids (Yu et al., 2008). Thermal conductivity of PCMs is also enhanced using various

4
fixed structures such as metallic fins and foams and carbon/graphite fibers (Fan &
Khodadadi, 2011). However the proper configuration of these structures and their
interaction with heat conduction and convection and the phase change process has
always been a challenging issue. This study is concerned with the thermal conductivity
enhancement only by the dispersion of solid nanoparticles. This study identifies a novel
organic phase change material and proposes a novel composite material of organic PCM
and metal oxide of nano size for efficient storage of thermal energy for applications
such as water/air heating and drying. This study also introduces a new geometry for
thermal energy storage devices.
1.2 Problem statement
The phase change materials used for the storing of the solar thermal energy undergo a
large number of repetitive melting and freezing processes, which leads to the
deterioration of their thermal and chemical properties. The sustainability of PCMs after
a large number of melt/freeze cycles is a major concern for researchers and industries
adopting them as energy storage materials. So, to be economically feasible the usage of
thermal energy storage materials, they must be able to sustain their thermal properties
after large numbers of thermal cycles. To date, several organic and inorganic phase
change materials have been investigated for thermal energy storage, however, the
variations in their chemical properties due to thermal cycle test is less explored. Another
major concern of organic phase change materials is their low thermal conductivity
which limits their use in many industrial and domestic applications. Insertion of metal
matrix, fins, and metal particles of nano size has been found to be the proven way for
enhancing the thermal conductivity of organic PCMs. In addition, the containment of
PCMs for energy storage is also an area of great interest due to the fact that the shape of

5
the container affects the heat transfer process within the PCMs. Although many
attempts have been made to overcome these issues globally, a more focused study on
these mentioned aspects is still needed to understand the subject matter deeply.
1.3 Research objectives
This study aims to demonstrate the potential of adopting the organic phase change
materials (O-PCMs) in a working temperature range of 50 and 70 °C for applications
related to solar thermal energy storage such as solar water/air heating, crop drying, and
space heating/cooling etc. The specific objectives of this study are:
1. To evaluate thermal and chemical properties of four types of organic PCMs, i.e.
Polyethylene glycol of molecular weight 6000, palmitic acid, myristic acid, and
paraffin wax for thermal energy storage in a melting temperature range of 50 °C
to 70 °C through thermal cycle test.
2. To prepare, to characterize, and to investigate the thermal energy storage
capacity of composite organic phase change material of palmitic acid and TiO2
nanoparticles.
3. To investigate the details of the solidification phenomenon of organic and
inorganic nano enhanced phase change materials filled in a trapezoidal cavity
using computational fluid dynamics (CFD).
1.3.1 Scope
The scope of this study is on investigating the sustainability of organic PCMs when they
undergo a large number of melt/freeze cycles and the suitability for domestic and
commercial solar energy storage applications. This research also focuses on the thermal

6
properties enhancement of the organic PCM by dispersing the solid nano particles in
various concentrations and to investigate the effect on the thermal and chemical
properties of the base PCM. This will show the degree of thermal properties
enhancement of the bas PCM. All of these experiments are to be performed in the
University of Malaya premises and the facilities laid out by the university are to be used
for all measurements and testing purposes. The shape of the PCM container plays an
essential role in the thermal performance of the PCMs. In this regard, a novel
trapezoidal geometry is proposed in this study that can be very useful for latent heat
thermal energy storage for solar heat collector and for casting and mold design. A
parametric investigation using CFD technique is carried out to see the effect of various
pertinent parameters, such that geometry aspect ratio, hot and cold side temperature,
Grashof, and Prandtl number. This numerical investigation will help the researchers in
the design of a more effective thermal energy storage device.
The experimental part of this study is limited to the organic PCMs only due to
their larger energy density. The thermal conductivity of organic PCM is low which is to
be improved by the dispersion of metal oxide. In this study, it is limited to titanium
dioxide (TiO2) of a specific size and shape. The numerical study is limited to the
investigation of solidification phenomenon of inorganic PCMs and Cu solid
nanoparticles due to the availability of data in the literature.
1.4 Thesis structure
The structure of the thesis is based on the article style format. This thesis presents five
articles which address various objectives of this research study in Chapter 2, Chapter 3,
Chapter 4, and Chapter 5. This thesis is presented in total six chapters. The summary of
each chapter is provided as follows.

7
Chapter 1: Introduction
This chapter presents an overview of the background to this research, research aim,
research objectives and the scope of research study.
Chapter 2: Literature review
This chapter reviews the experimental and numerical approaches to investigate the
suitability of various phase change materials (PCMs), in particular, organic PCMs (O-
PCMs) for thermal energy storage. This review focuses on three aspects: the materials,
encapsulation and applications of organic PCMs, and provides an insight on the recent
developments in applications of these materials. The final section of this chapter
presents the research gaps.
Chapter 3: Thermal cycle test of organic PCMs
This chapter presents the findings of the thermal cycle test of four PCMs from different
subcategories of organic PCMs, for example, paraffin wax from paraffin family,
palmitic acid and myristic acid from fatty acids, and polyethylene glycol of molecular
weight 6000 from alcohol family. This study shows the variation in the thermal and
chemical properties during the cycle tests of all mentioned PCMs.
Chapter 4: Enhancement in heat transfer of organic PCMs
This chapter reports the effects of titania nanoparticles on the thermal and chemical
properties of the palmitic acid. A composite PCM of various nanoparticle wt% reveals
the increasing thermal conductivity and improvement in other thermal properties with
weight fraction which enhances the heat transfer rate.

8
Chapter 5: Mathematical modeling for enhanced solidification in an enclosure
This chapter reports on the findings of a parametric study carried out for organic and
inorganic PCMs filled in a trapezoidal cavity. The effect of the nanoparticle
concentration and cavity geometrical parameter on the total solidification time is
measured and reported. The effect of various other pertinent parameters such as cold
wall temperature, initial fluid temperature, and Grashof number is also discussed.
Chapter 6: Conclusions and future works
This chapter revisits the aims and objectives, provide a summary of the research process
and research findings. This chapter also presents the contribution to theoretical
knowledge, research limitations and research opportunities for future research and
implications for practitioners.

9
CHAPTER 2: LITERATURE REVIEW
This chapter aims to review the experimental and numerical approaches to investigate
the suitability of various phase change materials (PCMs), in particular, organic PCMs
(O-PCMs) for thermal energy storage. This review focuses on three aspects: the
materials, encapsulation and applications of organic PCMs, and provides an insight on
the recent developments in applications of these materials. Organic PCMs have inherent
characteristics of low thermal conductivity (0.15-0.35 W/mK), hence, a larger surface
area is required to enhance the heat transfer rate. Therefore, attention is also given to the
investigations related to the thermal conductivity enhancement of the materials, which
helps to keep the area of the system to a minimum and helps to increase the heat transfer
rate. Besides, various available techniques for material characterization adopted by
researchers have also been discussed. This chapter also discusses the various shapes of
the container adopted by the researchers for the holding of the PCMs for thermal energy
storage.
2.1 Thermal energy storage
Thermal energy storage (TES) using phase change material (PCM) has been a key area
of research in the last three decades and more, and has since been recognized as an
important aspect after the 1973-74 energy crisis. Depletion of the fossil fuels and
increase in the energy demand has increased the gap between energy demand and its
supply. Excess energy stored in a suitable form has been able to bridge this energy
demand/supply gap significantly. TES can be used for either short term or long-term
storage. If the energy is stored for a few hours, it is termed as short term storage and is
essential in many industrial and domestic applications; while if energy is stored for a
month or more, it is generally considered as a long term storage device which may also

10
be required in some applications. Thermal energy storage plays a very important role
when energy demand and supply are not equal. Excess energy available in the off peak
time can be stored in TES devices for later use e.g. solar energy is available only in
sunshine hours, thus, the excess heat may be stored in the day time and used later in the
night hours. Energy storage helps in the saving of expensive fuels and reduces the
wastage of energy and capital cost which leads to a cost effective system (Sharma et al.,
2009). TES devices are majorly categorized as sensible heat storage and latent heat
storage (LHS) devices. Although the most commonly used devices in industrial
applications for thermal energy storage, is the sensible heat storage, but the latent heat
thermal energy storage (LHTES) devices have attracted a wide range of industrial and
domestic applications and will be discussed in the later sections of this chapter. LHTES
provides large energy storage density with a smaller temperature change when
compared to sensible heat storage devices (Paris et al., 1993; Ip & Gates, 2000).
Previous studies have shown that PCMs have the capability to store about 3-4 times
more heat per volume than what is stored as sensible heat in the temperature increment
of 20 °C (Mehling & Cabeza, 2008). However, LHTES devices confront the difficulties
that arise when the latent heat method is applied. This is due to the low thermal
conductivity, changes in density, stability of thermal properties and subcooling of
PCMs. Organic PCMs are a very important class of materials because of their unique
thermal properties such as congruent melting and narrow melting/freezing temperature
range. These properties make them suitable for many applications in solar energy
storage, textiles, and cooling of electronic devices. Organic PCMs are the most suitable
materials for cooling/heating of building.

11
2.1.1 Phase change materials
PCMs are latent heat storage materials that have high heat of fusion, high thermal
energy storage densities when compared to sensible heat storage materials. They absorb
and release heat at a constant temperature when undergoing a phase change process
(e.g. solid -liquid). The storage capacity of LHTES devices is given by (Lane, 1983):
m f
i m
T T
p m m pT T
Q mC dT ma h mC dT (2.1)
sp m i m m lp f mQ m C T T a h C T T
(2.2)
where Q is the storage capacity, Cp specific heat, Ti, Tm, and Tf are initial, melting and
freezing temperature, and h is the enthalpy.
2.1.2 Classification of PCMs
Phase change materials are majorly classified as organic, inorganic, and eutectic and a
comprehensive classification was given by Abhat (Abhat, 1983) and shown in Figure
2.1. Based on the melting/freezing temperature and latent heat of fusion, a large number
of organic and inorganic materials can be treated as PCM. Even though, their
melting/freezing temperature is within the operating range, many of the PCMs do not
satisfy the criteria required for an adequate thermal energy storage device because no
single material can have all of the properties required for the TES. Therefore, the
available materials are to be used and their thermo physical properties are to be
improvised by making suitable changes in systems design or by using external agents.
For example, the thermal conductivity of PCMs can be increased by the dispersion of

12
metallic nanoparticle in the PCM or by inserting metallic fins in the systems design and
supercooling can be suppressed by using a nucleating agent in the PCM.
Figure 2.1: Classifications of phase change materials (Abhat, 1983; Zalba et al., 2003;
Sharma et al., 2009; Kuznik, David, et al., 2011)
Organic PCMs such as paraffin wax consist of straight n-alkanes chain (CH3-
(CH2)-CH3) and fatty acids that are made up of straight chain hydrocarbons and are
relatively expensive and possess combustible nature. Organic materials possess the
capability of congruent melting without phase separation. These compounds are
available in a wide range of melting points (Khudhair & Farid, 2004). Paraffin is safe,
reliable, predictable, inexpensive, non-corrosive and chemically inert and stable below
500 °C but possesses extremely low thermal conductivity (0.1-0.3 W/mK) and is not
suitable for encapsulation in plastic containers. Organic PCMs will be discussed in
detail in the later sections of this chapter.

13
Inorganic materials are generally hydrated salts and metals and have a large
number of applications in solar energy (Lane, 1986; Dincer & Rosen, 2002). As PCM,
these materials are capable of maintaining the high heat of fusion (~ 350 MJ/m3) even
after a large number of cycles and relatively higher thermal conductivity (~ 0.5 W/m
°C), but they melt incongruently. One of the cheapest inorganic materials which was
studied by Telkas (1952) is Glauber salt (Na2SO4.H2O), which contains 44% Na2SO4
and 56% H2O in weight and is suitable to be used as thermal energy storage material.
This salt has high latent heat (254 kJ/kg) and melting point of about 32.4 °C but it is
highly prone to phase segregation and subcooling. The corrosion of the salt on metal
container is also a concern (Farrell et al., 2006). The use of thickening agents e.g.
Bentonite clay and nucleating agent e.g. Borax help to overcome the subcooling but
they reduce the heat transfer rate by lowering the thermal conductivity. Generally, most
of the salt hydrates encounter the same problem. An extensive review of hydrated salts
was presented in the Chapter 1 of Lane (1983), Sharma et al. (2004), and Kenisarin and
Mahkamov (2016).
The eutectic is a composition of two or more components such as organic-
organic, organic-inorganic, inorganic-inorganic and each of them change their phase
congruently and form a mixture of component crystal during crystallization (George,
1989). Eutectics generally melt and freeze congruently and leave no chances of
separation of components (Sharma et al., 2009; Sharma et al., 2015).
2.1.3 Thermo-physical properties
Since thermo-physical properties of PCMs vary from one manufacturer to another, any
of the available PCM cannot be simply used for designing an effective thermal energy
storage device (Hasnain, 1998). The PCM to be used as thermal storage system should

14
possess the following thermal, physical, chemical, and economic properties (Abhat,
1983; Regin et al., 2008; Sharma et al., 2009; Soares et al., 2013; Waqas & Ud Din,
2013):
Thermal properties such as suitable phase change temperature, high specific
heat, high latent heat, and high thermal conductivity in both, liquid and solid phases are
expected from a suitable PCM. The operating temperature of heating or cooling should
be matched with the phase change temperature of the PCM, which is to be selected for
energy storage. High specific heat provides the additional sensible heat storage. High
latent heat is desirable to store the large amount of energy in a small volume of PCM
i.e. to minimize the physical size of thermal energy storage. Thermal conductivity
should be high in order to minimize the temperature gradient required for the melting
and freezing of the PCM.
High density materials require relatively small storage containers and little
subcooling avoid the temperature range required for freezing or melting of the PCM and
give a single value of phase change temperature i.e. high nucleation rate. Low vapor
pressure and small volume change in the PCM help to reduce the complexity of the
geometry of the container. Chemical properties such as prolonged chemical stability,
compatible with capsule material, and nontoxic, nonflammable, and nonexplosive are
advisable for a PCM. Continuous freezing and melting cycles may hamper the chemical
composition of the PCM so it is highly desirable that the material maintains its chemical
stability over a long period of time. The PCM is to be encapsulated in order to avoid the
undesirable reaction with container materials.

15
2.1.4 Geometry of PCM container
The effects of capsule geometry have also been reported in the previous studies and
found that the geometry can be a significant parameter to improve the thermal
performance of PCMs. Regular geometries such as square (Khodadadi &
Hosseinizadeh, 2007; Arasu & Mujumdar, 2012; Abdollahzadeh & Park, 2014),
cylindrical (Ismail et al., 2001; Kim et al., 2011; Solomon & Velraj, 2013; Mahdaoui et
al., 2014), and spherical (Assis et al., 2007; Tan, 2008; Hosseinizadeh et al., 2012;
Amin et al., 2014; Chandrasekaran et al., 2014) have been extensively tested but the
studies using irregular geometries such as triangular and trapezoidal are in scarce.
Duggirala et al. (2006) investigated the solidification of binary mixture of ammonia and
water in various concentrations filled in trapezoidal cavity. However, this study does
not explicitly investigate the effect of the trapezoidal cavity on the solidification rate
and is not based on solidification/melting of NEPCM. Recently, Sharma et al. (2014)
numerically investigated the effect of trapezoidal cavity on the solidification of copper-
water nanofluid. They performed the CFD simulation for various aspect ratios and
calculated the solidification time for various initial fluid temperatures, cold wall
temperatures, and Grashof number. This shape of the cavity was found to be a
controlling parameter for the total solidification time of NEPCM.
2.2 Organic PCMs
Organic PCMs provide congruent melting and are further classified as paraffins and
non-paraffins. These materials provide the congruent melting without phase segregation
over the large number of melting/freezing cycles at the cost of degrading latent heat of
fusion and do not suffer from supercooling. Hale (1971) provided the data related to the
material properties of more than 500 PCMs required by thermal design engineers to

16
build efficient thermal energy storage devices. This was followed by numerous studies
that focused on organic PCMs. Paraffin waxes, poly(ethylene glycol)s, fatty acids and
their derivatives are the major classification of organic PCMs, which undergo a solid-
liquid phase transition during heating and subsequent cooling. Polyalcohols and
polyethylene are the other groups of organic PCMs, which undergo a solid-solid phase
transition. Such a kind of phase transition occurs at a fixed temperature by absorbing /
releasing large amounts of the latent heat. A detailed list of organic PCM candidates can
be found in the literature (Lorsch et al., 1976; Abhat, 1983; Zalba et al., 2003; Farid et
al., 2004; Demirbas, 2006; Cabeza et al., 2011; Sharma et al., 2015). Apart from the
many listed advantages of organic PCMS, their major drawbacks are low thermal
conductivity which curb the charging/discharging rate, super cooling effect in cooling
cycles, and leakage of PCMs in the containers (Choi et al., 2001; Alkan, 2006; Agyenim
et al., 2010).
2.2.1 Paraffins
Paraffin or paraffin wax is a mixture of straight chain n-alkanes which is represented by
the chemical formula CnH2n+2, where . Depending on the chain length of
the alkane, paraffins may be even-chained (n-paraffin) or odd-chained (iso-paraffin)
(Abhat, 1983). Studies conducted in the recent years on paraffins are summarized in
Table 2.1. The molecular chain of paraffin wax involves large amount of latent heat
during the crystallization/fusion. The melting temperature of these compounds increases
with increase in the number of alkane chains in the molecules (Himran et al., 1994) as
seen in Table 2.1. This increment in the melting temperature is because of the elevated
induced dipole attraction between n-alkane chains (Sarier & Onder, 2012) e.g. the
melting point of C14 is 4.5 °C and that of C18 is 28 °C. Many previous studies (Parks et

17
al., 1946; Parks et al., 1949; Finke et al., 1954; Messerly et al., 1967; Atkinson et al.,
1969; M. Zábranský et al., 1996; van Miltenburg, 2000; Zábranský et al., 2001) have
shown that paraffin waxes are capable of absorbing, storing, and releasing a great
amount of heat over a large number of phase change cycles. They are excellent
materials for energy storage, particularly in the buildings with a heat capacity of 2.14-
2.4 kJ/kg K, and latent heat of 200-220 kJ/kg. Paraffins show no phase segregation even
after many phase transition cycles and exhibit many favorable characteristics as PCMs
such as they are chemically inert, non-corrosive, colorless, durable, inexpensive,
available abundantly, ecologically harmless and nontoxic (Abhat, 1983; Lane, 1983;
Hasnain, 1990; Hasnain, 1998). On the contrary, Lane (1983) reported that paraffin
shows slow oxidation when exposed to oxygen, therefore, it requires leak-proof
containers. They are generally compatible with all metallic containers but on the other
hand they make some plastic containers soften (Lane, 1983).
Table 2.1 Thermo-physical properties of some paraffins, paraffin waxes, and its blends
used as latent heat storage
Compound Tm
(°C)
Hf
(kJ/kg)
Cp
(kJ/ kg K)
k
(W/ m K)
ρ
(kg/m3)
Ref.
Decane -29.65 202 - - 726 (l) (Himran et al.,
1994)
Undecane -25.6 177 - - 737 (l) (Himran et al.,
1994)
Dodecane -9.6 216 - - 745 (l) (Himran et al.,
1994)
Tridecane -5.4 196 2.21 (l) - 753 (l) (Himran et al.,
1994)
Paraffin C14 4.5 165 - - - (Abhat, 1983)
Tetradecane. 5.5 227 2.07 (s) 0.15 825 (s) (Himran et al.,
1994)

18
Table 2.1 continued…
Compound Tm
(°C)
Hf
(kJ/kg)
Cp
(kJ/ kg K)
k
(W/ m K)
ρ
(kg/m3)
Ref.
Paraffin
C15-C16
8 153 2.2 (s) - - (Abhat, 1983)
Paraffin
C16-C18
20-22 152 - - - (Tyagi &
Buddhi, 2007)
Paraffin
C13-C14
22-24 189 2.1 0.21 790 (l)
900 (s)
(Tyagi &
Buddhi, 2007)
(Mehling &
Cabeza, 2008)
Paraffin C18 28 244 2.16 0.15 814 (Abhat, 1983)
Nonadecane 32 222 - - 785 (Paris et al.,
1993)
Eicosane 36.6 247 788 (Paris et al.,
1993)
Heneicozane 40.2 213 - - 791 (Paris et al.,
1993)
Paraffin
C20-C33
48-50 189 2.1 0.21 769 (l)
912 (s)
(Abhat, 1983)
Paraffin
C22-45
58-60 189 2.1 0.21 795 (lC)
920 (s)
(Abhat, 1983)
1-Tetradecanol 38 205 - - 825 (Hawes et al.,
1993)
Paraffin
C23-C45
62-64 189 2.1 0.21 0.915 (Abhat, 1983)
Paraffin wax 64
173.6
266.0
- 0.167 (l)
0.346 (s)
790 (l)
916 (s)
(Lane, 1980)
(Dincer &
Rosen, 2002)

19
Table 2.1 continued…
Compound Tm
(°C)
Hf
(kJ/kg)
Cp
(kJ/ kg K)
k
(W/ m K)
ρ
(kg/m3)
Ref.
Paraffin
C21-C50
66-68 189 - 0.21 830 (l)
930 (s)
(Abhat, 1983)
Biphenyl 71 119.2 - - 994 (l)
1166 (s)
(Lane, 1980)
(Dincer &
Rosen, 2002)
Propionamide 79 168.2 - - - (Lane, 1980)
Napthelene 80 147.7 2.8 0.132 (l)
0.341 (s)
976 (l)
1145 (s)
(Lane, 1980)
(Durupt et al.,
1995)
Tetradecane +
octadecane
-4.02 -
2.1
227.52 - - - (Kenisarin &
Mahkamov,
2007)
91.67%
Tetradecane +
8.33%
hexadecane
1.70 156.20 - - - (Cabeza et al.,
2011)
Tetradecane +
docosane
1.5-5.6 234.33 - - - (Cabeza et al.,
2011)
Paraffin blend
(n = 14–16)
5-6 152 - - 783 (s) (Lorsch et al.,
1975)
Paraffin blend
(n = 15–16)
8 147-
153
- - 751.6 (Lorsch et al.,
1975)
Paraffin blend
(n = 16–18)
20-22 152 - - - (Lorsch et al.,
1975)
Octadecane +
heneicosane
25.8-26 193.93 - - - (Cabeza et al.,
2011)
Octadecane +
docosane
25.5-27 203.80 - - - (Cabeza et al.,
2011)

20
2.2.2 Fatty acids
Non-paraffins are generally found in the form of acid and represented by the
formula CH3(CH2)2nCOOH (Demirbas, 2006). The fatty acids are basically derived
from vegetable and animal sources which ensure nonpolluting source of supply
(Feldman et al., 1995a) and are divided into six groups: caprilic, capric, lauric, myristic,
palmitic and stearic (Abhat, 1983). Unlike paraffins, the individual material in this
category has its own properties (Sharma et al., 2009). When compared with paraffins,
these materials show excellent phase change (solid - liquid) properties but are about
three times more expensive than paraffins (Hasnain, 1998). An extensive survey of
organic materials was done by Abhat et al. (1981) and Buddhi and Sawhney (1994) and
the number of esters, fatty acids, alcohol’s and glycol’s were identified to be suitable as
latent heat storage. These materials are highly flammable and should avoid exposure to
high temperature, flames and oxidizing agents. Fatty acids and palmitoleic acids, which
have a low melting point, are the most common among others in the category. The
melting temperatures of fatty acids vary between -5 and 70 °C and the latent heat
between 45 and 210 kJ/kg (Kenisarin & Mahkamov, 2007). These materials have the
capability to be retained in the shape of host material due to their high surface tension of
N/cm. A great insight of fatty acids was recently presented by Yuan et al.
(2014). Some of the fatty acids investigated in the past are presented in Table 2.2.
PCMs based on fatty acids can be categorized as follows (Rozanna et al., 2005):
1. Hydrates of acids of triglycerides and their mixtures.
2. Esters of fatty acids of naturally occurring triglycerides.
3. Refined/synthesized triglyceride products produced by a combination of
fractionation and transesterification processes.

21
4. Synthesized fatty acid derivatives that have the desired freezing point
temperatures.
5. Refined fatty acid hydrates that have the desired freezing point temperatures.
6. Prepared mixtures produced by essentially any of the previous processing
approaches with other chemicals (preferable cheap and nontoxic) to produce
eutectic compositions with the desired freezing point temperature range.
Fatty acids possess superior properties such as congruent melting, good chemical
and thermal stabilities, nontoxicity, biodegradability, and melting temperature range
suitable for many latent heat storage applications. They are also capable of thousands of
thermal (melting/freezing) cycles without any notable degradation in thermal properties
(Feldman et al., 1989; Feldman et al., 1991; Feldman et al., 1995a). The fatty acids and
their eutectic mixtures have been recently investigated extensively as possible phase
change materials for low/medium energy storage applications such as solar energy
storage and residential applications. Thermal properties of fatty acids such as capric,
lauric, palmitic and stearic acids were evaluated by Feldman et al. (1989) and they
found that these materials are very promising to be used as PCMs in space heating
applications. The melting point of these acids was measured between 30 °C and 65 °C
and latent heat between 153 kJ/kg and 182 kJ/kg. Feldman et al. (1995b) further
investigated the behavior of fatty acids and their thermal stability as PCMs. The thermal
performance of myristic acid was investigated by Sari and Kaygusuz (2001) and they
found that this acid shows better stability at low temperature. They also observed that
this PCM is more effective when the heat exchanger is in horizontal position. Sari and
Kaygusuz (2002a) studied the thermal performance of palmitic, stearic and oleic acids
as well as their binary and ternary mixtures and they found that the presence of oleic
acid in binary and ternary mixtures produce melting points at different levels of

22
temperatures. Subsequently Sari et al. studied the thermal performance of stearic acid
(Sari Ahmet & Kaygusuz Kamİl, 2001) and palmitic acid (Sari & Kaygusuz, 2002b) as
thermal energy storage. The thermal properties and the crystal structure of odd
numbered fatty acids (CnH2n+1COOH) from tridecanoic acid (C12H25COOH) to
tricosanoic acid (C22H45COOH) have been studied by Karaipekli et al. (2009). A
detailed review of organic PCMs can be found in Rozanna et al. (2005), and Sarier and
Onder (2012).
Table 2.2: Thermo-physical properties of some fatty acids used as latent heat storage
Compound (wt. %) Tm
(°C)
Hf
(kJ/kg)
Ref.
CA-LA (90-10) 13.3 142.2 Regin et al. (2008)
CA-LA (64-36) 19.62 149.95 Karaipekli and Sarı (2010)
CA-LA (65.1-34.9) 19.67 126.56 Shilei et al. (2006)
CA-LA (45-55) 17-21 143 Kenisarin (2010)
CA-LA (70-30) 21.09 123.98 Sharma et al. (2013)
CA-MA (70-30) 21.79 123.62 Sharma et al. (2013)
CA-LA (66.75-33.25) 22.76 127.2 Ke et al. (2013)
CA-PA (76.5-23.5) 23.12 156.44 Karaipekli and Sarı (2010)
CA-SA (70-30) 23.40 104.90 Sharma et al. (2013)
C14H28O2-C10H20O2
(34-66) 24 147.7 Sharma et al. (2009)
CA-SA (83-17) 24.68 178.69 Karaipekli and Sarı (2010)
CA-SA (83-17) 25.39 188.15 Karaipekli and Sarı (2010)
CA-MA (78.39-21.61) 26.02 155.2 Ke et al. (2013)
CA-PA (70-30) 27.07 142.61 Sharma et al. (2013)
CA-PA (89-11) 28.71 141.4 Ke et al. (2013)
LA-MA (60-40) 28.8-40.8 172
Kenisarin (2010)

23
Table 2.2 continued…
LA-MA-SA
(55.8-32.8-11.4)
29.29 140.9 Liu et al. (2014)
LA-MA-PA
(55.24-29.75-15.02)
31.14 142.6 Zhang N. et al. (2013)
CA-SA (94.47-5.53) 31.17 156.8 Ke et al. (2013)
LA-PA (65-35) 32.8-37.1 170.2 Kenisarin (2010)
LA-SA (60.3-39.7) 33.8-47.6 189.8 Sari and Kaygusuz (2002a)
MA-SA (50-50) 35.2-51.8 189.2 Kenisarin (2010)
LA-SA (75.1-24.9) 36.9-37.6 183.4 Kenisarin and Mahkamov
(2007)
MA-PA (50-50) 39.1-45.4 173.7 Kenisarin and Mahkamov
(2007)
MA-PA (50-50) 47.91 153.12 Fauzi et al. (2013)
PA-SA (60-40) 51.2-54.2 183.7 Kenisarin and Mahkamov
(2007)
CA-LA (65-35) 18 148 (Dimaano & Watanabe,
2002)
CA-LA (45–55) 21 143 (Hawes et al., 1993)
In order to improve the thermal performance and widen the application scope of
organic PCMs, many researches have been preparing the eutectics of fatty acids and
other PCMs. For a low temperature thermal energy storage, a mixture of capric and
lauric acids was evaluated as possible phase change material by Shilei et al. (2006).
Later Dimaano and Watanabe (2002) in their research, mixed pentadecane in the capric-
lauric mixture and found that 50% of pentadecane in the mixture provides the highest
heat charged. The solid-liquid phase transition in lauric, palmitic, stearic acid and their
binary systems was investigated by Fauzi et al. (2013), whereby they found that

24
thermal properties of 23% lauric-palmitic acid eutectic system remained stable after 100
heating-cooling cycles at 32.8 °C. Sari et al. (2004) evaluated the thermal properties of
lauric-stearic, myristic-palmitic, and palmitic-stearic acid and tested the thermal
stability for 360 melting-freezing cycle and concluded that these materials can be
effectively used for a one year period. Later, Sari (2005) studied the thermal
performance of eutectic mixtures of lauric-myristic acid, lauric-palmitic acid, and
myristic-stearic acid as PCM and found that these PCMs have a good thermal stability
at least for four years. Subsequently, Sari and Kaygusuz (2006) investigated the thermal
behavior of the eutectic mixture of myristic acid and stearic acid that can be effectively
used as PCMs in low temperature thermal energy storages. Some of the studies carried
out on eutectic mixtures are shown in Table 2.3.
Table 2.3: Thermo-physical properties of compound of fatty acids used as latent heat
storage.
Compound
(wt. %)
Tm
(°C)
Hf
(kJ/kg)
Ref.
CA-LA (90-10) 13.3 142.2 Regin et al. (2008)
CA-LA (64-36) 19.62 149.95 Karaipekli and Sarı
(2010)
CA-LA (65.1-34.9) 19.67 126.56 Shilei et al. (2006)
CA-LA (45-55) 17-21 143 Kenisarin (2010)
CA-LA (70-30) 21.09 123.98 Sharma et al. (2013)
CA-MA (70-30) 21.79 123.62 Sharma et al. (2013)
CA-LA (66.75-33.25) 22.76 127.2 Ke et al. (2013)
CA-PA (76.5-23.5) 23.12 156.44 Karaipekli and Sarı
(2010)
CA-SA (70-30) 23.40 104.90 Sharma et al. (2013)
C14H28O2-C10H20O2 (34-66) 24 147.7 Sharma et al. (2009)

25
Table 2.3 continued…
CA-SA (83-17) 24.68 178.69 Karaipekli and Sarı
(2010)
CA-SA (83-17) 25.39 188.15 Karaipekli and Sarı
(2010)
CA-MA (78.39-21.61) 26.02 155.2 Ke et al. (2013)
CA-PA (70-30) 27.07 142.61 Sharma et al. (2013)
CA-PA (89-11) 28.71 141.4 Ke et al. (2013)
LA-MA (60-40) 28.8-40.8 172 Kenisarin (2010)
LA-MA-SA
(55.8-32.8-11.4) 29.29 140.9 Liu et al. (2014)
LA-MA-PA
(55.24-29.75-15.02) 31.14 142.6 Zhang N. et al. (2013)
CA-SA (94.47-5.53) 31.17 156.8 Ke et al. (2013)
LA-PA (65-35) 32.8-37.1 170.2 Kenisarin (2010)
LA-SA (60.3-39.7) 33.8-47.6 189.8 Sari and Kaygusuz
(2002a)
MA-SA (50-50) 35.2-51.8 189.2 Kenisarin (2010)
LA-SA (75.1-24.9) 36.9-37.6 183.4 Kenisarin and
Mahkamov (2007)
MA-PA (50-50) 39.1-45.4 173.7 Kenisarin and
Mahkamov (2007)
MA-PA (50-50) 47.91 153.12 Fauzi et al. (2013)
PA-SA (60-40) 51.2-54.2 183.7 (Kenisarin &
Mahkamov, 2007)
CA-LA (65-35) 18 148 (Dimaano & Watanabe,
2002)
CA-LA (45–55) 21 143 (Hawes et al., 1993)

26
2.2.3 Sugar alcohol
Sugar alcohol, also known as polyalcohols are considered as medium
temperature (90-200 ° C) PCMs and have received less attention by researchers.
Previous studies revealed that alcohols such as xylitol, erythritol, and mannitol possess
a much higher value of latent heat than other materials in this family. Alcohols have
been tested as potential phase change materials in the last four decades. Hormansdorfer
(1989) first proposed the use of polyalcohols as a PCM and their phase change behavior
was discussed by Talja and Roos (2001) and Kaizawa et al. (Kaizawa et al., 2008). They
observed that some polyalcohols possess latent heat of almost double than that of the
other organic PCMs. Among sugar alcohols, erythritol has shown excellent suitability as
a thermal energy storage material (Kakiuchi et al., 1998). Its melting point is 20 °C and
latent heat of fusion is 339.8 kJ/kg. Shukla et al. (2003) performed a thermal cycling
test of erythritol and observed no degradation for the 75 thermal cycles and experienced
a supercooling of 15 °C. At a certain temperature, they observed the phase separation in
the liquid state. When compared to lower temperature organic PCMs, sugar alcohol
exhibited a much larger degree of super cooling which can hamper the efficiency of the
thermal energy storage. This has been addressed in a number of research articles
(Chihara et al., 1998; Ona et al., 2001; Elefsiniotis et al., 2014; Jiang et al., 2014). These
materials also undergo a 10-15% volume expansion when melting (Kaizawa et al.,
2008).
Sole et al. (2014) tested sugar alcohols D-mannitol, myo-inositol, and glactitol
as potential PCMs by thermal cycle test. It was found that for the chosen set of
parameters, myo-inositol sustained well during the cycling test, however, FT-IR images
show changes in chemical structure, which does not affect the thermal properties. Some

27
polymorphic changes were noticed when myo-inositol was analyzed between 50 and
260 °C but these almost disappeared in the temperature range of 150 to 260 °C.
Glactitol showed poor cycling stability and at the 18th
cycle, its freezing temperature
was measured as 60°C, which was 102 °C before starting the cycle test. D-mannitol
showed the reaction with oxygen in the atmosphere which leads to non-stable materials
with a lower thermal energy storage capacity.
Memon et al. (2013) developed a novel form stable alcohol based PCM by
preparing a composite of lauryl alcohol and kaolin using the vacuum impregnation
method, shown in Figure 2.2 (a). Simultaneous heating checked the exudation of this
composite during impregnation process. A leakage testing was performed to check the
maximum absorption ratio. The composite was placed in the oven for 30 min at a
certain temperature above the melting point. This composite was checked for thermal
reliability by performing cycling test. An experimental set up, Figure 2.2(b), which
consists of a test room, a 150 W infrared lamp (as heating source), a hollow PVC
envelope, and the thermocouple, was designed and developed. The leakage test showed
that the maximum 24% lauryl acid can be retained by this composite. DSC measured
the melting point of this composite as 19.14 °C, which is less than that of the pure lauryl
acid and latent heat of fusion 48.08 kJ/kg, which is higher when compared to that of the
lauryl acid 205.4 kJ/kg. The thermal cycling test revealed that after one month of
complete cycling test, the melting point of the composite dropped by 0.39 °C and latent
heat of fusion was dropped by 0.7 kJ/kg.

28
Figure 2.2 (a) Vacuum impregnation method, (b) schematic of thermal performance test
(Ali Memon et al., 2013).
2.2.4 Poly(ethylene glycol)s
Polyethylene glycol (PEG) also known as polyoxyethylene (POE) or polyethylene oxide
(PEO) is composed of dimethyl ether chains, HO-CH2-(CH2-O-CH2-)n-CH2-OH.
Having the hydroxyl group at the end, makes them soluble in water as well as in organic
compounds. PEGs in various grades (400, 600, 1000, 3400, 10000, 20000, 35000,
100000, and 1000000) (Pielichowska & Pielichowski, 2014) have been extensively
investigated numerically and experimentally in the past and they are found to be
chemically and thermally stable, nonflammable, non-toxic, non-corrosive and
inexpensive (Burchill, 1983; Mathur & Moudgil, 1997; Meng & Hu, 2008;
Constantinescu et al., 2010; Chen et al., 2011). As reported by Sarier and Onder (2012),
the melting point and latent heat of fusion increase with an increase in molecular weight
(MW), e.g. melting point of PEG (MW 400) is 3.2 °C and latent heat 91.4 kJ/kg, PEG
(MW 2000) is 51 °C and latent heat 181.4 kJ/kg, and PEG (MW 20000) is 68.7 °C and
(a) (b)
PCM
Vacuum chamber
Vacuum
pump
Heater
Flask
Infrared lamp
150W
PVC envelope
Wooden
plate
Small test
room Data logger
Thermocouple 150 mm 150 mm 150 mm
Vacuum meter

29
latent heat 187.8 kJ/kg. Ahmad et al. (2006) experimentally and numerically
investigated the thermal performance of a wallboard filled with PEG 600. The apparent
heat capacity method was adopted to numerically simulate the phase change process in
a vertical panel. A sinusoidal variation of the outdoor temperature (Equation 2.3) was
considered in the numerical simulation, which represents the daily variation in the
outside temperature. Simulations started with the investigation of using paraffin in a
gypsum wallboard, later in order to overcome the conductivity issue due to the presence
of air, the polycarbonate and PVC panels were filled with PEG 600 and investigated
experimentally. Results showed that the use of polycarbonate panel filled with PEG is
not suitable for a light envelope for buildings but PVC panels filled with PEG 600
serves this purpose. During the thermal cycle test, no degradation in the thermal
properties of the PVC panel with PEG 600 was noticed in the 400 cycles. A numerical
simulation model also validated these experimental results.
Te (°C) = 24 + 8 sin (ωt) (2.3)
Like other organic PCMs, PEG is also subjected to low thermal conductivity and
a large number of experimental and numerical studies have been carried out to enhance
this property. Wang et al. (2009) prepared a form stable composite of SiO2 and PEG and
this composite was characterized by the SEM, FTIR and DSC. The PEG of molecular
weight 10,000 and SiO2 composite were prepared by dissolving the PEG and SiO2 in
water and stirring for 12 h. Then the mixture was heated in the oven at 100 °C for 24 h,
followed by heating it under a reduced pressure of 70 °C for 24 h. SEM images showed
that the PEG is dispersed into the network of solid SiO2, which shows the mechanical
strength of the composite. Polarizing optical microscope (POM) micrographs show that
SiO2 serves as a supporting material and help to prevent leakage of liquid PEG. DSC

30
graphs showed that the latent heat of PEG/SiO2 composite is less and thermal
conductivity is more than that of the plane PEG. The thermal conductivity of the solid
PEG is 0.2985 W/m K, while it is 0.3615 W/m K for PEG/20% SiO2 (w/w) which is
21% higher and 0.5124 for PEG/50% SiO2, which is 71.7% higher than a normal PEG.
More studies based on PEG/SiO2 composite can be found in the references (Hawes et
al., 1992; Hwang et al., 2006; Wang et al., 2007; Tang et al., 2012; Feng et al., 2013).
The blends of PEG and fatty acids have also been studied in the past to obtain
the desired range of melting temperature and latent heat. It has been possible to obtain
a homogeneous PEG/fatty acid blend by mixing both materials in a liquid state
followed by subsequent freezing. An experimental study carried out by
Pielichowski and Flejtuch (2003b) indicated that the melting range of such a blend lies
between 30 and 72 °C. They investigated a series of blends of PEG with capric, lauric,
myristic, palmitic, and stearic acid of different molecular weights as a thermal energy
storage material. Their latent heat of fusion was observed between 168 and 208 kJ/kg,
which is higher than that of the pure fatty acid, and PEG. In their further research
Pielichowski et al. (2008) investigated the thermal properties of a blend of PEG 10000
with lauric acid and stearic acid. The results revealed that the crystallinity of
PEG/lauric acid was 52% and PEG/stearic acid 43%. FT-IR images confirm the
presence of hydrogen bonds in the blend, both in liquid and solid state that defines their
synergies. During the phase change process, a synergistic effect was observed due to
the formation and decay of hydrogen bonding. In similar studies by Pielichowski and
Flejtuch (2003a), Flejtuch (2004), and Pielichowski (2005), the blend of PEG of
different grades and fatty acids were prepared and tested for their thermal reliability as
energy storage materials and was found that these materials are potential materials to
be used as TES.

31
2.3 Enhancement of thermal conductivity of organic PCMs
An organic phase change materials has a well-known drawback of having low thermal
conductivity, which substantially limits the heat transfer rate during the phase transition.
A large number of research articles have been published in the last two decades,
reporting the enhanced thermal conductivity of these materials by various means, such
as, dispersion of high conductivity solid particles (micro/nano size) in the PCM (Zalba
et al., 2003), insertion of metal matrices (Zalba et al., 2003; Khateeb et al., 2004),
chunks of metal (stainless steel and copper) pieces (Cabeza et al., 2002), carbon fibers
(Fukai et al., 2000; Fukai et al., 2002), and the impregnation of porous graphite matrix
in the PCM (Py et al., 2001; Cabeza et al., 2002; Mills et al., 2006; Moeini Sedeh &
Khodadadi, 2013). Jegadheeswaran and Pohekar (2009) presented a detailed review on
the performance enhancement in latent heat thermal storage system. They discussed the
various techniques such as impregnation of porous materials, dispersion of high
conductivity particles, placement of metal structures, and use of high conductivity and
low-density materials to enhance the thermal conductivity of PCMs. A nano composite
of graphene and 1-octadecanol (stearyl alcohol) was prepared by Yavari et al. (2011)
and thermal conductivity was investigated as a function of graphene content. They
observed a 2.5 times higher thermal conductivity of the composite by the addition of 4%
(by weight) graphene at a loss of 15.4% heat of fusion. Cui et al. (2011) added carbon
nanofiber (CNF) and carbon nanotube (CNT) in the PCM (soya wax and paraffin wax)
and observed that the addition of both CNF and CNT increases the thermal conductivity
of the base PCM. A detailed review of studies regarding the thermal conductivity
enhancement can be found in (Fan & Khodadadi, 2011; Liu et al., 2012). In the past,
graphite has been extensively used as heat transfer enhancer due to its high thermal
conductivity (Sarı & Karaipekli, 2007; Mehling & Cabeza, 2008; Lopez et al., 2010;

32
Zhang et al., 2010; Zhang et al., 2012; Zhang N. et al., 2013; Zhang Z. et al., 2013). Fan
et al. (2013) investigated the effect of carbon nanofillers (CNT, CNF, and GNP) on the
thermal conductivity of paraffin based PCM using hot wire method. The concentrations
were varied from 1 to 5% at an increment of 1%. They found that the GNP enhanced the
thermal conductivity most, at approx. 164% at the loading of 5% w/w. Li (2013)
prepared a composite of paraffin and nano graphite (NG) and reported a high thermal
conductivity of this composite. Nano graphite of particle diameter 35 nm was added to
paraffin in 1%, 4%, 7%, and 10% w/w at 60 °C. The thermal conductivity of the
paraffin was measured 0.1264 W/m K and the conductivity of the composite PCM were
measured to be 2.89 times and 7.41 times higher for the 1% and 10% NG respectively.
Nano graphite in different forms has been added to the numerous organic PCMs to
enhance their thermal conductivity (Chen et al., 2013; Fang et al., 2013; Li H. et al.,
2013; Choi et al., 2014; Goli et al., 2014; Li et al., 2014; Zeng et al., 2014).
2.4 Characterization techniques for organic PCMs
There are numerous techniques available to characterize the thermal and chemical
properties of organic PCMs. The morphology of the reference material is investigated
using a spectrum electron microscope (SEM) (Alkan et al., 2009; Li W. et al., 2013;
Mehrali et al., 2013; Meng et al., 2013; Motahar et al., 2014b) and particle size
distribution (PSD) (Alkan et al., 2009; Xu & Li, 2013; Song et al., 2014). The SEM
produces images of a sample by focusing an electron beam on it and the PSD lists the
values that define the relative amount of a substance into a mixture. The PSD
sometimes is also known as grain size distribution. Chemical compatibility of the
mixture is tested using the Fourier transform infrared spectroscopy (FT-IR) technique in
which infrared (IR) radiation is passed through the sample. Some of the IR radiation is

33
transmitted through the sample and some absorbed into it. There have been numerous
studies which have identified the properties of the materials using FT-IR technique
(Feldman et al., 1989; Cho et al., 2002; Zhang et al., 2004; Sarı, Alkan, et al., 2009; Jiao
et al., 2012; Pan et al., 2012; Memon et al., 2013; Konuklu et al., 2014). A Differential
scanning calorimetry (DSC) (Sari & Kaygusuz, 2002b; Sarı & Karaipekli, 2007; Alkan
et al., 2009; Ma et al., 2013; Mehrali et al., 2013; Konuklu et al., 2014; Sarı, 2014) and
differential thermal analysis (DTA) (Buddhi et al., 1987) are the measurement
techniques used to determine the latent heat of fusion, heat capacity and melting
temperature of a material. In DSC, the sample and the reference material (with known
thermal properties) are maintained at the same temperature and the thermal properties of
the sample materials are calculated by measuring the difference of the heat absorbed
between the sample and the reference. While in the DTA, the heat is applied to the
sample only and the properties are evaluated by measuring the temperature difference
between the sample and reference material. Yinping and Yi (1999) proposed a method,
called the T-history method for the measurement of the melting temperature, degree of
supercooling, thermal conductivity, specific heat, and heat of fusion of PCMs. Later,
this method was modified by Hong et al (2004) and Peck et al. (2006) to make it more
suitable for appropriate measurements.
The SEM, FT-IR, TEM, DSC, TGA and hot wire methods have been widely used
to measure the thermal properties of pure and composite PCMs. Therefore, to ensure
the accurate measurement and minimize the uncertainties in the measured values it is
necessary that these equipment be calibrated before they are used. This will also help to
avoid repetitive measurements, which are taken to ensure that the correct data is
obtained. Most of the previous studies have concentrated on the measurement of the
melting temperature and latent heat of prospective materials and very few studies have

34
considered the variations in the thermo-physical properties such as conductivity,
density and viscosity with temperature. Almost all of the previous studies reported the
use of DSC for thermal property evaluation. This technique uses a very small amount
and requires almost uniform sample of PCM, which is unrealistic in the case of PCM
based composite materials because they are not homogeneous.
2.5 Applications of organic PCMs
2.5.1 Cooling/heating of buildings
Consumption of electricity is significantly varied during the day and night, summer and
winter seasons, depending upon the demand of industrial, commercial, and residential
activities. Because of these variations, the pricing of energy use is also varied during
peak and off peak season. A suitable thermal energy management system can help to
keep the energy stored during off peak seasons, which can be used during peak seasons
when the demand is more. For this purpose, the phase change materials can be used to
enhance the thermal energy storage in building walls, floors and ceilings.
2.5.1.1 PCM walls and wallboard
Wallboards are easily available, effective and comparatively less expensive to use in the
buildings and these characteristics make them highly suitable for PCM encapsulation. In
wallboards, the PCM is imbedded into a gypsum board, plaster or other building
structures. Stovall (1995) reported that a normal wallboard can contain up to 30% of
PCMs. In their study, they found that it is a good energy saver for a passive solar system
with a payback period of five years. In an early work (Athienitis et al., 1997), an
experimental and numerical study was carried out over a gypsum board impregnated
with a PCM (Butyl stearate) in a direct gain outdoor test room and it was observed that

35
the room temperature can be reduced by a maximum of 4 °C during the day time.
Thermal dynamics of the PCM (fatty acid and paraffin wax) impregnated wallboards
which is subjected to diurnal variation of room temperature was carried out by Neeper
(2000). The results of this study showed that when the PCM melting temperature is
close to the room temperature, the wallboard stores maximum diurnal energy and this
energy decreases if the phase change occurs over a range of temperatures, Figure 2.3.
Kuznik and Virgone (2009) experimentally investigated the thermal performance of
PCM copolymer composite wallboard in a full scale test room for the summer, mid-
season and winter and found that the PCM wallboards can reduce the overheating effect
for all cases. Later Kuznik et al. (2011) monitored a building for almost a year for heat
variation in two identical rooms. One room was equipped with the DuPont de
Nemours® PCM wallboard and another was without any wallboard and found that the
one with wallboard performed better.
Figure 2.3 Diurnal energy storage versus melt temperature for an interior wall (Neeper,
2000).

36
Oliver (2012) prepared a new construction material: gypsum board containing of
PCM 45 wt% and carried out its thermal characterization. They found that a 1.5 cm-
thick board of gypsum with PCMs, stores 5 times more thermal energy than a laminated
gypsum board, and the same energy as a 12 cm-thick brick wall within the comfort
temperature range (20–30 °C). A nano-PCM (n-heptadecane+graphite nanosheets)
enhanced wallboard was prepared by Biswas et al. (2014) and they simulated the
thermal performance of this system, Figure 2.4, numerically and validated
experimentally. Three temperature range were selected for this study: 23.3 °C that was
well-above the phase change temperature range, 22 °C that was near the higher end of
the melting temperature range and 21 °C that was at about the center of the melting
range. No change in heat gain was observed at 22 and 23.3 °C but at 21 °C cooling set
point, during peak summer, the nano-PCM wallboard reduced the peak heat gains and
also delayed the heat flowing into the interior space. Recently, a new kind of composite
PCM was developed by A. Sari (2014) which consists of polyethylene glycol (PEG
600) as the base PCM with gypsum and natural clay and a thermal analysis was carried
out. The maximum absorption ratio of PEG 600 in gypsum-based and natural clay-
based composites was found to be 18 weight% and 22 weight%, respectively. The
thermal cycling test shows that this material has good thermal and chemical stability
along with good thermal reliability. This material also showed an excellent cooling and
heating performance.

37
Figure 2.4 (a) Numerical model of nano-enhanced wallboard (b) Wallboard embedded
with nanoPCM for experimental study (Biswas et al., 2014).
2.5.1.2 PCM Floors and ceilings for passive solar heating
The ceiling and floor are two important sides of a building block and can be effectively
utilized for heating/cooling of a building space. Organic PCMs have been effectively
incorporated either directly or in the encapsulated form in these parts in the past to store
the solar radiation. Figure 2.5 shows an insulation system proposed by Turnpenny et al.
(2000). They developed a latent heat storage unit by incorporating the embedded heat
pipes in phase change material. This system stored coolness during the night and
released it in the daytime. Stritih and Butala (2010) experimentally analyzed the cooling
building using paraffin (melting point 22 °C) impregnated ceiling board as shown in
Figure 2.6. They monitored the cooling of the PCM at night for seven consecutive days
and it was observed that during this period the outside temperature remained stable. The
amount of cold released from the PCM was calculated from zero to 300 min. They
found that this system was very helpful for the cooling of buildings.
(a) (b)

38
Figure 2.5 Outline of heat pipe/PCM insulation system (Turnpenny et al., 2000)
Figure 2.6 Principal function of PCM ―free-cooling system‖: (left) cooling of PCM at
night, (right) cooling of building during the day (Stritih & Butala, 2010).
(a)
(b)

39
Floor heating is also very important as they may provide a comfortable indoor
environment than convective heating systems (Athienitis & Chen, 2000). Organic
PCMs have a great potential to be used as thermal energy storage media in floors. Some
of the organic PCMs used in floor heating are given in Table 2.5. Lin et al. (2005)
experimentally investigated the thermal performance of under-floor electric heating
systems (Figure 2.7) with a shape-stabilized phase change material (75% paraffin wax +
25% polyethylene). This system can charge heat by using cheap nighttime electricity
and discharge the heat stored at daytime. During the duration of the experiment the
average indoor temperature was 31 °C and the temperature difference between day and
night was 12 °C. This resulted in a higher indoor temperature with no change in the
temperature swing.
Table 2.5 Organic PCM used for floor heating (Jeon et al., 2013)
Compound Melting point
(°C)
Heat of fusion
(kJ/kg)
Paraffin C16-C18 20-22 152
Polyglycol E600 22 127.2
Paraffin C13 – C24 22-24 189
1-Dodecanol 26 200
Paraffin C18 27.5 243.5
Vinyl Stearate 27-29 122
1-Tetradecanol 38 205
Paraffin C16 – C28 42-44 189
Paraffin C20 – C33 48-50 189
Paraffin wax 63 173.6

40
Figure 2.7 Under-floor electric heating system (a) Schematic of electric floor heating
system with shape-stabilized PCM plates, (b) electric heaters, (c) shape-stabilized PCM
plates, (d) wood floor (Lin et al., 2005).
2.5.2 Solar energy storage
Solar radiation is considered as one of the prospective sources of energy and this can be
effectively utilized in large-scale by proper storage of it. PCMs are one of the most
effective techniques to store the solar energy during daytime, which can be utilized at
night or on cloudy days. The general principle of the solar energy storage and
technologies to store it was summarized in ref. (HP Garg et al., 1985) and latent heat
storage for solar energy was discussed in detail by Lane (1983, 1986) and Dincer and
Rosen (2002). Organic PCMs are found in a large number of applications related to
solar energy storage such as water and air heating, drying, solar cooking systems and
solar thermal power plants which can be divided in two major groups, low temperature
and high temperature solar energy storage. Kenisarin and Mahkamov (2007) and
Sharma et al. (2009) presented a detailed review on tested PCMs for solar energy
(a) (b)
(d) (c)

41
storage to date. In this current review paper, we have divided this section into two major
sub-sections, viz.: (i) low temperature energy storage, which includes water, air, and
dryer heating using solar energy, and (ii) high temperature energy storage e.g. solar
cooker.
2.5.2.1 Solar water/air heating
Solar water heating is relatively inexpensive and simple to fabricate and maintain. Barry
(1940) designed one of the first kinds of solar water heating systems as shown in Figure
2.8. A copper made upwardly tapered coil is fitted inside the dome shaped shell. The
lower end of this coil is connected to the inflow, which is connected to the bottom of the
water container. The upper end of the coil is connected to the outlet of hot water, which
is eventually connected to the top of the storage tank. The solar water heater integrated
with the PCM is the upgraded version of the conventional solar water heaters which
takes advantage of the ability of the PCM to store excess energy and which can be
utilized in off-peak hours.
Figure 2.8 Design of solar water heater (Barry, 1940).
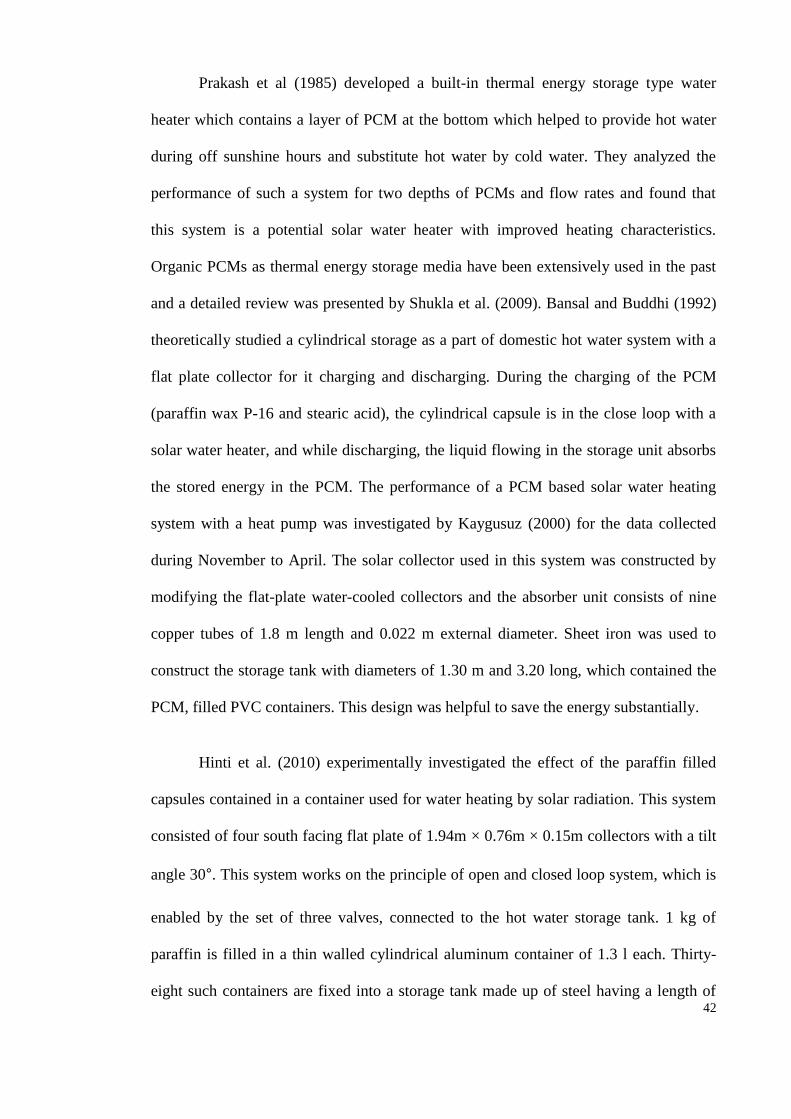
42
Prakash et al (1985) developed a built-in thermal energy storage type water
heater which contains a layer of PCM at the bottom which helped to provide hot water
during off sunshine hours and substitute hot water by cold water. They analyzed the
performance of such a system for two depths of PCMs and flow rates and found that
this system is a potential solar water heater with improved heating characteristics.
Organic PCMs as thermal energy storage media have been extensively used in the past
and a detailed review was presented by Shukla et al. (2009). Bansal and Buddhi (1992)
theoretically studied a cylindrical storage as a part of domestic hot water system with a
flat plate collector for it charging and discharging. During the charging of the PCM
(paraffin wax P-16 and stearic acid), the cylindrical capsule is in the close loop with a
solar water heater, and while discharging, the liquid flowing in the storage unit absorbs
the stored energy in the PCM. The performance of a PCM based solar water heating
system with a heat pump was investigated by Kaygusuz (2000) for the data collected
during November to April. The solar collector used in this system was constructed by
modifying the flat-plate water-cooled collectors and the absorber unit consists of nine
copper tubes of 1.8 m length and 0.022 m external diameter. Sheet iron was used to
construct the storage tank with diameters of 1.30 m and 3.20 long, which contained the
PCM, filled PVC containers. This design was helpful to save the energy substantially.
Hinti et al. (2010) experimentally investigated the effect of the paraffin filled
capsules contained in a container used for water heating by solar radiation. This system
consisted of four south facing flat plate of 1.94m × 0.76m × 0.15m collectors with a tilt
angle 30°. This system works on the principle of open and closed loop system, which is
enabled by the set of three valves, connected to the hot water storage tank. 1 kg of
paraffin is filled in a thin walled cylindrical aluminum container of 1.3 l each. Thirty-
eight such containers are fixed into a storage tank made up of steel having a length of

43
675 mm, inner diameter 450 mm and a volume of 107.4 l; see Figure 2.9 (a). The total
volume of PCM containers are 49.4 l and remaining 58 l volume is occupied with water.
Results revealed that over the test period of 24 hours, the water temperature was
measured to be 30 °C higher than the ambient temperature as shown in Figure 2.9 (b).
(a) (b)
Figure 2.9. (a) cross sectional view of the storage tank (b) Temperature variations with
time (Al-Hinti et al., 2010).
Paraffin was encapsulated in spherical capsules as the PCM in a jacket shell type
solar tank and the effect of the PCM encapsulation on water heater was investigated by
Fazilati and Alemrajabi (2013). One hundred and eighty spherical capsules made up of
HDPE having 38 mm diameter each, which occupy the 55% of the total volume of the
tank was embedded inside the tank. Copper wire 380 mm long and 0.3 mm in diameter
was inserted into the paraffin to enhance its thermal conductivity. It was observed that
the use of the PCM in the tank increased the storage density by 39% and the exergy
efficiency by 16%. It was also observed that such a PCM inbuilt solar water heater can
supply hot water for up to 25% longer time. Khalifa et al. (2013) designed a storage
tank consisting of six copper pipes of 80 mm diameter each, connected in series and
paraffin wax filled in between the pipes as shown in Figure 2.10. Various performance
factors such as top loss coefficient, water useful heat gain and heat transferred between

44
water and the PCM were considered to evaluate the thermal performance of such a
system. Experiments were conducted on clear and semi-cloudy days of January,
February and March. Results indicate that the plate temperature increases up to a
distance of 2.5 m from entrance, after which a nearly steady temperature is noticed for
the remaining 7.6 m of the total length (see Figure 2.10 b) which is in contrast to
previously published results by many researchers.
(a) (b)
Figure 2.10 (a) Schematic diagram of storage tank, (b) variation of the pipe surface
temperature with distance from entrance (Khalifa et al., 2013)
Recently, Mahfuz et al. (2014) experimentally investigated the thermal behavior
of paraffin integrated solar water heating system. Their proposed system, shown in
Figure 2.11 is made of three major components, a solar collector unit, a shell ad tube
thermal energy storage, and an insulated water storage tank. During sunny hours, the
valve 1 was open and valve 2 remained closed. The cold water from the water storage
tanks passes through the solar collector and gains the heat and flows back to the storage
tank. A part of this hot water goes through the thermal energy storage tank for the
charging of the PCM. The excess water will automatically flow out of this tank and
move towards the main water storage tank. In the night when there is no sun light, valve
2 is opened to allow the water to pass through the PCM tank so that it will extract the
heat from the PCM, becomes heated up, and flow back to the main storage tank. The
results show that when the water flow rate is 0.033 kg/min the energy efficiency of such
Glass cover Tubes/absorber
Wax Case Insulation

45
a system is 63.88% while it is 77.41% when the flow rate is 0.167 kg/min. For the first
flow rate the total life cycle cost was calculated as $ 654.61 while for the later one, the
total cost was predicted to be USD 609.22. This shows that when the flow rate
increases, the life cycle cost decreases. Chaabane et al. (2014) carried out a numerical
study on a PCM integrated solar water heater system. They used one organic PCM,
myristic acid, and one organic-inorganic mixture of Rubitherm 42-graphite for this
investigation. The results show that the myristic acid integrated water heating system
performs better than other systems under the same environmental conditions.
Many previous research shows that organic PCMs are immensely used as
thermal storage media in the solar water heating systems. The use of organic PCMs in
solar water heating can also be found in the work of Elsyaed et al. (1994), Fath (1995),
Salyer (2000), Ettouney et al. (2005), Sharma et al. (2009), Mazman et al. (2009),
Talmatsky and Kribus (2008), Sadhishkumar and Balusamy (2014), Mettawee and
Assassa (2006), Shabtay and Black (2014), Nkwetta et al. (2014), Bouadila et al.
(2014).

46
Figure 2.11 Solar water heating system with PCM (Mahfuz et al., 2014).
Solar air heating is the technique to heat or condition the air for use in building
spaces or other applications. The use of PCMs is an effective way to make the
sustainable solar air heating system (Lane, 1980). Morrison, Khalik and Jurinak in their
different studies (Jurinak & Abdel-Khalik, 1978; Morrison & Abdel-Khalik, 1978;
Jurinak & Abdel-Khalik, 1979a, 1979b) numerically investigated the performance of
solar energy based air heating systems integrated with organic and inorganic phase
change materials. They determined the effect of latent heat and melting temperature of
PCM on the performance of an air heating system. The effect of semi-congruent melting
of the phase-change material (PCM) on system performance was also examined. Results
show that the PCM should be selected based on melting point rather than latent heat.
Enibe (2002) evaluated the performance of PCM based solar air heating system
works on the principle of natural convection as shown in Figure 2.12. Paraffin as PCM
is prepared in thin rectangular blocks, which is equispaced in the collector as shown in

47
Figure 2.12 (b) and behaves like thin fins. The space between two modules is utilized as
air heater. The cold ambient air flows into the collector and passes through the spaces
between PCM modules, which serve as air heater. Ambient air gets heat up and flows to
the space chamber. Author suggested that such system is suitable for use as a solar
cabinet crop dryer for aromatic herbs, medicinal plants and other crops, which do not
require direct exposure to sunlight. Later in his work (Enibe, 2003), a transient
numerical investigation was carried out for the same setup. Energy balance equations
are developed for each major component of the heater and linked with heat and mass
balance equations for the heated air flowing through the system. The numerically
predicted results of the system were compared with previously published experimental
data under daytime no-load conditions over the ambient temperature range of 19–41 °C
and daily global irradiation of 4.9–19.9 MJ/m2. Predicted temperatures at specific
locations on the absorber plate, heat exchanger plate, glazing, and heated air were in
good agreement with experimental data to within 10, 6, 8, and 10 °C, respectively.
Maximum predicted cumulative useful and overall efficiencies of the system were
within the ranges 2.5–13 % and 7.5–18%, respectively.
Alkilani et al. (2011) presented an up to date review on solar air collector based
on thermal energy storage materials. They reviewed the published articles based on
space heating, heat transfer in packed beds, green house systems and solar air heaters
integrated with phase change materials. Entrop et al. (2011) experimentally evaluated
the effect of microencapsulated paraffin of melting point 23 °C on the total heat load
requirement for a building space when it is mixed with concrete. This experimental
setup consists of four insulated boxes (1130 mm × 725 mm × 690 mm each) having
window in south direction to allow the solar radiation to go inside the space, see Figure
2.13, and the data acquisition unit. The floor of two out of the four boxes contains micro

48
encapsulated PCM. Results of the data collected in 2010 revealed that the boxes having
PCM floor are able to maintain their temperature well compared to the boxes without
PCM as shown in Table 2.6.
(a) (b)
Figure 2.12 (a) Air heating system, A, collector assembly with PCM and air-heating
subsystem; B, heated space, (b) arrangement of PCM modules in the collector (Enibe,
2002).
Figure 2.13 Four test boxes at the site (Entrop et al., 2011).

49
Table 2.6 Minimum and maximum temperatures (±0.5 °C) in the boxes per day
(Entrop et al., 2011).
Date Test box 1
Min–Max (°C)
Test box 2
Min–Max (°C)
Test box 3
Min–Max (°C)
Test box 4
Min–Max (°C)
24-6 20.9–24.4 23.0–29.2 19.9–25.2 20.2–28.9
25-6 23.2–25.2 25.1–29.8 22.4–25.7 22.1–28.8
26-6 23.1–25.6 23.8–30.3 21.1–26.2 20.1–29.4
27-6 23.7–27.7 24.8–32.2 22.1–28.6 21.3–31.7
28-6 24.7–30.0 27.0–33.9 23.9–31.0 23.7–33.5
29-6 26.3–30.3 28.3–33.9 24.4–30.6 24.4–32.5
30-6 25.7–30.2 27.3–33.4 24.0–29.2 23.1–30.7
1-7 24.4–28.5 25.4–31.4 23.2–28.5 22.0–30.7
Recently Karthikeyan et al. (2014) performed a numerical study on the
performance of a packed bed storage unit as shown in Figure 2.14, integrated with
encapsulated paraffin wax. The effect of parameters such as flow rate of heat transfer
fluid (i.e. air), its temperature at inlet, ball size of the PCM capsule and effective
thermal conductivity were investigated. Selected parameters for this study are given in
Table 2.7. Results revealed that for a constant flow rate of air 0.035kg/s, inlet air
temperature of 70 °C, and effective thermal conductivity of 0.7 W/m K, the
charging/discharging time continuously increases with increasing ball diameter,
increasing mass flow rate of air increases the charging time for all selected bed height. It
was also observed that the effect of increasing thermal conductivity beyond 1 W/m K
does not produce significant heat transfer enhancement.
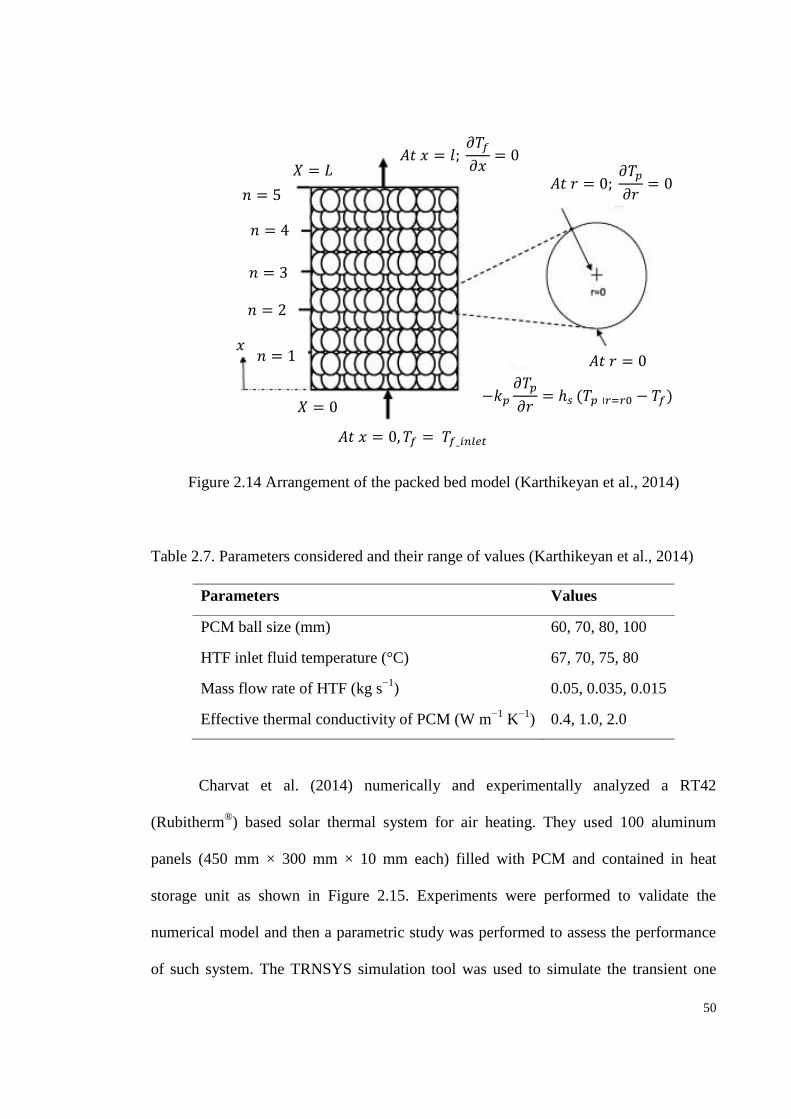
50
Figure 2.14 Arrangement of the packed bed model (Karthikeyan et al., 2014)
Table 2.7. Parameters considered and their range of values (Karthikeyan et al., 2014)
Parameters Values
PCM ball size (mm) 60, 70, 80, 100
HTF inlet fluid temperature (°C) 67, 70, 75, 80
Mass flow rate of HTF (kg s−1
) 0.05, 0.035, 0.015
Effective thermal conductivity of PCM (W m−1
K−1
) 0.4, 1.0, 2.0
Charvat et al. (2014) numerically and experimentally analyzed a RT42
(Rubitherm®) based solar thermal system for air heating. They used 100 aluminum
panels (450 mm × 300 mm × 10 mm each) filled with PCM and contained in heat
storage unit as shown in Figure 2.15. Experiments were performed to validate the
numerical model and then a parametric study was performed to assess the performance
of such system. The TRNSYS simulation tool was used to simulate the transient one
𝑋 = 𝐿
𝑛 = 5
𝑛 =
𝑛 =
𝑛 =
𝑛 = 𝑥
𝑋 =
𝐴𝑡 𝑟 = ; 𝜕𝑇𝑝
𝜕𝑟=
𝐴𝑡 𝑥 = 𝑙; 𝜕𝑇𝑓
𝜕𝑥=
𝐴𝑡 𝑟 =
𝐴𝑡 𝑥 = ,𝑇𝑓 = 𝑇𝑓_𝑖𝑛𝑙𝑒𝑡
−𝑘𝑝𝜕𝑇𝑝
𝜕𝑟= ℎ𝑠 (𝑇𝑝⃓𝑟=𝑟0 − 𝑇𝑓)

51
dimensional heat transfer problem. The schematic of numerical model of heat storage
unit is shown in Figure 2.15 (b). The effect of inlet air temperature and airflow rate in
the performance of system was analyzed. The results revealed that this can be a
potential system to be used as latent heat thermal storage system for air heating purpose.
(a) (b)
Figure 2.15 (a) heat storage unit with front and top walls, (b) numerical model
(Charvát et al., 2014)
Tyagi et al. (2012) performed the experimental investigation of a solar heater
embedded with paraffin wax and hytherm oil. A total of 12 evacuated tube collector
(ETC), four filled with paraffin, four filled with oil, and remaining 4 without any
storage material were used in the solar heat collector as shown in Figure 2.16. The glass
length exposed to sunlight is 172 cm and inclined at 45°. The results revealed that the
outlet temperature of the heater with PCM was more than that of one without PCM. As
the mass flow rate increases, the outlet temperature in all three considered cases
increases. Later, Tyagi et al. (2012), presented a comparative energy and exergy
analysis of a solar air heat collector integrated with paraffin wax and hytherm oil as
PCMs. They observed that both energy and exergy efficiencies of the air heating system
was higher with PCM based system than that of one without PCM.

52
(a) (b)
Figure 2.16 (a) Cross-sectional view of ETC tube with TES, (b) schematic of the
experimental set-up (Tyagi, Pandey, Kaushik, et al., 2012).
2.5.2.2 Solar dryer
Solar dryers are the devices used to dehydrate the substances using solar radiation.
Depending upon the interaction of substances, they can be majorly divided into direct
and indirect solar dryers. For preservation of agricultural products, especially, fruits and
vegetables, the use of a moderate temperature range (40-75 °C) dryer is an essential
device and the use of thermal energy storage in this temperature range has gained
immense popularity in the last few decades due to their high energy storage capacity.
Phase change materials, especially paraffin are one of the mostly used organic PCMs in
solar dryers as energy storage media. Butler and Troeger (1981) constructed a solar
collector-cum-rock bed storage for peanut drying and experimentally evaluated its
performance. They found that in the drying time range of 22-24 hours, the moisture
level was reduced from 20% to a safe storage moisture level.

53
Bal et al. (2010) presented a state of the art solar dryer with thermal energy
storage for agricultural food products. They divided this review into five major sections
viz. thermal energy storage, comparison of sensible and latent heat storage system,
phase change materials, classification of PCMs, and solar dryer with thermal energy
storage device. They emphasized on the advantage and drawbacks of various dryer
designs using the thermal storage unit. The authors also mentioned that there is a need
to focus on hybrid solar dryers and pointed out that heat loss is a major problem as a
future research gap of the back panel of the solar dryer, which can be corrected by
adding a coating of polyurethane. In their subsequent study (Bal et al., 2011), they
presented an up to date review of solar dryer embedded with latent heat storage system.
They mentioned that intermittent nature of the solar energy is the major drawback for
solar dryer, which can be corrected if the dryer is embedded with phase change
materials. Later, Vijaya Venkata Raman et al. (2012) presented a detailed review on
solar drying technologies with and without PCMs. This review has listed the
technological developments in the developing countries over a period of time and the
various designs of solar dryers, classification and performance analysis are reviewed.
Recently, Shalaby et al. (2014) presented a review on the solar dryer system integrated
with phase change materials as thermal energy storage media. They also presented the
various techniques used for thermal conductivity enhancement of PCMs such as, carbon
fibers, expanded graphite, graphite foam etc.
In a recent investigation, Reyes et al. (2014) designed and developed a hybrid
solar dryer for dehydration of mushrooms, cut in 8 mm and 12 mm slices, and
consisting of an exposed surface of 10 m2 and paraffin wax as energy storage media.
The hybrid solar dryer, as shown in Figure 2.17, consists of a solar panel (3 m × 1 m)
which contains a glass sheet of 5 mm thick and a black zinc plate. 14 kg of paraffin wax

54
are distributed in 100 copper pipes of 144 mm inner diameter and these pipes are placed
in the solar energy accumulator. The mushrooms were soaked in a diluted 10%
benzalkonium chloride solution for 5 min and then rinsed. The drying run started at
10:00 am and for the first 8 hours, no energy was taken from the accumulator. To
maintain the temperature of the drying air at 60 °C, the energy was taken from the solar
panel or the electrical resistances. After 6 pm, when the solar radiation started getting
weak, the energy was taken from an energy storage device, i.e. paraffin. The authors
recommended the use of low air recycle and level and thin slices of mushrooms in such
a drying system. The results revealed that the color parameters significantly affected the
drying process. The maximum moisture content after rehydration was 1.91 ± 0.24. The
thermal efficiency of this system varied from 0.22 to 0.67 and the maximum energy
fraction supplied by the accumulator was found to be 0.20.
Figure 2.17 Hybrid-solar dryer for mushroom, A, Solar panel, B, Solar energy
accumulator, C, Electrical heater, D, Chamber drying, E Centrifugal fan (Reyes et al.,
2014).

55
Shalaby and Bek (2014) designed a novel indirect solar dryer (Figure 2.18)
integrated with paraffin wax as a PCM with a melting temperature of 49 °C. This
system consists of two identical solar heaters, one drying compartment, and a blower.
The solar radiation on a tilted plate was measured in the month of September 2013
using Pyranometer and the temperature of drying air was monitored. A three-phase
induction motor of 1.75 HP and 2610 rpm served the purpose of blower for dryer
compartment. The experiments were conducted with and without paraffin and it was
observed that after using the PCM, the temperature of the drying air was 2.5-7.5 °C
higher than the ambient air for 5 hours minimum after sunset. Figure 2.18 (b) shows the
hourly variation of the dry air temperature and it was observed that the average drying
air temperature when using the PCM was less than that of the ones without the PCM
between 8:00 am to 2:00 pm which indicates the large amount of energy storage in
PCM. It was also observed that this design provides the dryer temperature with 3.5-6.5
°C higher when used with the PCM.
(a) (b)
Figure 2.18 (a) drying compartment, (b) variation in the temperature of the drying air
(Shalaby & Bek, 2014).

56
2.6 Accelerated thermal cycle test
The latent heat storage materials undergo a large number of melt/freeze cycles during its
entire period of application. Generally, a thermal energy storage material undergoes one
melt/freeze cycle per day, however, when it undergoes a higher number of melt/freeze
cycles in a laboratory under controlled conditions, it is termed as accelerated thermal
cycle test (Sharma et al., 1999). An accelerated thermal cycle test of Na2SO4.nH2O for
1000 cycles was conducted by Ting et al. (1987), but, they did not report the variation in
the thermal properties during the cycle test. a variation in the melting temperature and
the latent heat of fusion was first measured by Porisini (1988) during a cycle testing of
salt hydrates as the PCM. Hasan and Sayigh (1994) investigated the thermal energy
storage characteristics in myristic acid, palmitic acid, and stearic acid for solar water
heating system considering the moderate life of the 450 melt-freeze cycles. The results
of this study revealed that the degradation of the thermophysical properties was
negligible when the freezing and melting temperatures were kept between 20 and 80 ˚C.
However, this reduction was up to one-third in the latent heat when the maximum
temperature range was between 20 and 150 ˚C. (Shukla et al., 2008) performed an
accelerated thermal cycle test for organic materials paraffin wax and erythritol,
inorganic materials, sodium hydroxide, di-sodium borate, ferric nitrate, and barium
hydroxide. They found that none of the inorganic material is suitable to use as thermal
energy storage after a few number of cycles. However, paraffin wax and erythritol were
found to be promising PCMs even after a large number of cycles. Rathod and Banerjee
(2013) in their review discussed the thermal cycle test carried out for various low
temperature melting points (30-60 °C) of organic and inorganic PCMs and concluded
that organic PCMs exhibit better stability than inorganic materials during thermal cycle

57
testing. Recently, Desgrosseilliers et al. (2013) performed thermal cycle testing of lauric
acid for 500 cycles.
2.7 Summary and research gap
This chapter has discussed the various commercial and lab grade organic PCMs
investigated in the past studies for low and medium temperature solar energy storage
applications such as building, solar water/air heater, and food industries. Numerous
research work using organic PCMs and their eutectic mixture have been reported in the
past in these domestic and commercial applications. Since the complete
melting/solidification of the PCM in every cycle is difficult to achieve therefore, an
appropriate design of a heat exchanger is essential to ensure the complete phase change
process. It was also found that most of the studies have focused on the investigation of
the melting/freezing phenomenon in regular geometry, however, irregular shapes have
not been thoroughly studied.
On the basis of the literature reviewed, the following research gaps have been identified:
1. There is a lack of focus on studies relating to variations in the chemical structure
and the compositional/functional group when PCMs undergo a large number of
melt/freeze cycles.
2. The studies related to the accelerated thermal cycle testing of the polyethylene
glycol based materials are lacking in the literature, thus a detailed investigation
to use them as solar thermal energy storage materials is needed.
3. There is a lack of a thorough investigation of the chemical and thermophysical
variation of a titania based nano enhanced phase change material when it
undergoes a large number of melt/freeze cycles.

58
4. There is no solidification analysis of the NEPCM filled in a differentially heated
trapezoidal cavity and a thorough parametric investigation is needed to ascertain
the suitability of such shapes.

59
CHAPTER 3: THERMAL CYCLE TESTING OF ORGANIC PCMs
3.1 Introduction
As discussed in the literature review (Chapter 2), the organic phase change materials
whose melting temperature are falling in the range of 50 and 70 °C are very much
useful in many solar energy storage applications such as solar water/air heater and solar
dryer etc. The literature review (Section 2.6) shows that there are a large number of
investigations carried out on the accelerated thermal test but very few have considered a
large 1500 thermal test cycles and more importantly there is extreme lack of findings on
degradations of thermal properties due to changes in chemical structure during thermal
cycle tests. Therefore, the present chapter investigates the thermal reliability and
chemical stability of four selected commercial grade organic PCMs viz. palmitic acid,
myristic acid, polyethylene glycol of molecular weight 6000, and paraffin wax. Except
paraffin, all PCMs possess a purity of ≥ 98%. The variations in the melting temperature
and latent heat of fusion during the cycle tests have been measured using differential
scanning calorimeter (DSC) after every certain number of cycles and results are
presented and discussed. Variations in the compositional/functional group during the
cycle is also measured using the Fourier transformed infrared (FT-IR) spectroscopy and
the effect of thermal cycle on chemical properties have been discussed. The selection of
1500 thermal cycles has been done on the basis of their use in the thermal energy
storage for five years, considering that a latent heat storage material undergoes one
melt-freeze cycle per day in a solar system and 300 in a year. Rest of the days may be
considered as cloudy/rainy days.

60
3.2 Methodology
3.2.1 Materials
Commercial grade organic PCMs viz. palmitic acid (PA), myristic acid (MA),
polyethylene glycol (PEG) of molecular weight 6000 with purity more than 98%, and
paraffin wax were selected for thermal cycle testing in this study. The PA, MA, and
paraffin were purchased from the R&M Chemicals, UK and PEG 6000 from Merck
Company. The value of their melting temperature and the latent heat of fusion quoted
by the company and obtained from the DSC are given in the Table 3.1. All of the
materials were tested as they were received without any further purification.
3.2.2 Equipment
The melting temperature and the latent heat of fusion were obtained by a differential
scanning calorimeter (Mettler Toledo-DSC 820-Error ± 0.25 °C) at a constant heating
rate of 10 °C/min. The samples and the reference materials in the DSC tests were heated
at a constant rate and the temperature difference between them was caused by the
differences in the heat flow between both materials. The latent heat of fusion was
obtained by calculating the area under the DSC curve and the melting temperature was
approximated by drawing a tangent on the highest slope on the face portion of the peak.
In order to determine the changes in the compositional/functional group during the
cycle test, the Fourier Transform Infrared (FT-IR) spectroscope (Brand: Bruker, Model:
IFS66v/S) was used between wavenumbers 400 to 4000 cm-1
with the spectral
resolution of 2 cm-1
. The DSC facility was used at the Advanced Materials Research
laboratory, Department of Mechanical Engineering and FT-IR was used at NANOCAT
Laboratory of University of Malaya.

61
3.2.3 Experimental test rig for accelerated thermal cycle testing
The thermal stability of all selected PCMs was determined by using an in-house design
(University of Malaya). The schematic of the thermal cycle tester is shown in Figure
3.1. A fan (12VDC) which is located in front of the PCM in the system was used as
cooling medium and heater (24VDC) for heating purpose. A digital indicating controller
(Shinko-ACS-13A) is attached to control the freezing and melting process and a
communication converter (Shinko-IF-400) to transfer data to the PC and controller
program. Relays (Idec-SM25) were used to monitor the power supplies to the heater and
fans. A cartridge heater was glued outside to the PCM container and its heat flux was
set at 80 W and 24 V respectively. A cooler type of heat sink was attached on the other
side of the PCM container for the cooling of the materials. The material was heated up
to 100 ˚C at heat rate of 10 ˚C/min and then naturally allowed to cool down to 30 ˚C
using ethanol as the cold fluid. As soon as the heater goes up to a preset temperature of
100 °C, it gets turned off automatically due to the received signal from the feedback
system. This is immediately followed by a freezing cycle of up to 30 °C by starting the
fan. K-type thermocouples in the temperature range of 0-1260 °C with an error of ±
0.7% were used to sense the temperature of the PCMs. When the temperature sensor
measures the set minimum temperature, the fan automatically turns off and turns on the
heater for the heating of the next cycle. This accelerated thermal cycle test is a very well
calibrated and established tester and has been installed at the Advanced Materials
Research Laboratory of Department of Mechanical Engineering. The tester has been
used in many previous work of the University (Mehrali et al., 2013; Tahan Latibari et
al., 2013) and the work has already been published in the international journals of
repute, thus confirming the reliability and accuracy of the tester.

62
Figure 3.1 Schematic of thermal cycle tester
3.2.4 Experimental method
As mentioned in Section 3.2.1, the four organic PCMs with melting temperatures of
between 50 and 70 °C were selected for the accelerated thermal cycle testing for 1500
melt/freeze cycles in this chapter. The minimum and maximum temperature of 30 °C
and 100 °C were set in the thermal cycle tester. Since every selected PCM has a melting
temperature somewhere between 50 and 70°C, this range of temperature is selected in
order to ensure the complete melting and solidification of the PCMs. An amount of 6~9
mg of PCM is kept inside the DSC pan and it was hermetically sealed to avoid the
contact of the PCM with the environment and to protect leakage. These DSC pans were
placed in the tray of the DSC machine and it was run between the temperatures of 30
and 100 °C. At both extreme temperatures, the DSC was kept idle for 2 mins to remove
the thermal history, if any. The thermophysical properties such as the melting
PCM

63
temperature and latent heat of fusion of paraffin, palmitic acid, myristic acid, and PEG
6000 were measured between the 0-1500 thermal test cycles (0th
, 100th
, 500th
, 1000th
,
and 1500th
) and values of these thermophysical properties at zeroth cycle (fresh
material) were considered as the reference values. The selection of the 1500 cycles have
been made on the basis of their use as thermal energy storage materials for five
consecutive years which is a significantly valid period for pay back.
3.3 Results and discussion
3.3.1 Thermophysical properties of O-PCMs before cycle test
The thermophysical properties such as melting temperature and the latent heat of fusion
of fresh (uncycled) paraffin wax, palmitic acid, myristic acid, and PEG 6000 were
measured using the DSC and obtained curves are shown in Figures 3.2 to Figure 3.5. As
can be seen in the Figures, the paraffin wax possesses the minimum latent heat and that
of palmitic acid is 59.7%, myristic acid is 66%, and PEG 6000 are 72.9% higher than
that of paraffin wax.

64
Figure 3.2 DSC curve of paraffin wax at 0th
thermal cycle
Figure 3.3 DSC curve of palmitic acid at 0th
thermal cycle
Exo 0
th cycle
Exo 0th
cycle

65
Figure 3.4 DSC curve of myristic acid at 0th
thermal cycle
Figure 3.5 DSC curve of PEG 6000 at 0th
thermal cycle
0th
cycle Exo

66
The measured and obtained values of the melting temperatures of O-PCMs are
compared and presented in Table 3.1. As seen in the Table the measured value of the
melting temperature of paraffin wax, palmitic acid, and myristic acid do not fall in the
range quoted by the companies, while, the melting temperature of the PEG 6000 falls
within the quoted range. This Table signifies that the thermophysical properties of any
PCM must be measured before implementing them into real usage due to the fact that
their actual values may differ from the quoted ones. This measurement can provide a
clear picture to practicing engineers for their usage in particular applications.
Table 3.1 Thermophysical properties of PCMs selected for accelerated thermal cycle
test
PCM Chemical formula Purity
(%)
Melting temperature (°C) Latent heat of
fusion, ∆H(J/g)* Quoted Measured*
Paraffin wax - - 56-58 52.90 133.66
Palmitic acid CH3(CH2)14COOH ≥ 98 60-62 62.21 213.46
Myristic acid CH3(CH2)12COOH ≥ 98 51-54 54.03 222.20
PEG 6000 HO(C2H4O)nH ≥ 98 55-60 59.90 231.03
*Obtained from differential scanning calorimeter (DSC)
3.3.2 Thermophysical properties of O-PCMs after cycle test
The thermophysical properties (melting temperature and latent heat of fusion) of the O-
PCMs were measured after the 100th
, 500th
, 1000th
, and 1500th
melt freeze cycles and
the DSC curves were obtained. A detailed analysis of the individual PCMs are
presented in the sections below.

67
3.3.2.1 Paraffin wax
A commercial grade paraffin wax of thermo physical properties as mentioned in Table
3.1 was selected for thermal cycle testing. A certain amount of paraffin was placed in a
container and sealed with a lid to avoid leakage when the PCM is in a molten state. The
experimental procedure is kept same as mentioned in Section 3.2.4. The DSC curves
showing the heat flow variation with temperature are presented in Figures 3.6 to Figure
3.9 and the corresponding data are presented in Tables 3.2 and 3.3. As can be seen in
these tables and Figures, no regular variations in the thermophysical properties of
paraffin wax was observed during the accelerated thermal cycle test. From Figure 3.2
and 3.6-3.9, it can also be seen that the variations in the melting temperatures and latent
heat of fusion with an increasing number of thermal cycles is notable.
The maximum observed variations in the melting temperature and the latent heat
of fusion of paraffin wax were around 6% after 500 melt/freeze cycle and 14% after
1500 cycles respectively. Figure 3.10 shows the comparison of all the DSC curves taken
after different tested thermal cycles by plotting all of them within the same graph. As
can be seen, all of the curves show similar patterns during the melting process, but the
onset and peak points can be clearly pointed. Also, it can be noted that after the 1500th
cycle, the melting temperature decreased by 2.57 °C and the latent heat of fusion
decreased by 18.5 J/g. Also, it can be noted that if 300 melt/freeze cycles are considered
in a year, then, this material can be used for 5 consecutive years which is a significant
period for a PCM to be used as a latent heat thermal energy storage.

68
Figure 3.6 DSC curve of paraffin wax after 100th
thermal cycle
Figure 3.7 DSC curve of paraffin wax after 500th
thermal cycle
100th
cycle Exo
Exo 500
th cycle

69
Figure 3.8 DSC curve of paraffin wax after 1000th
thermal cycle
Figure 3.9 DSC curve of paraffin wax after 1500th
thermal cycle
1000th
cycle Exo
1500th
cycle Exo
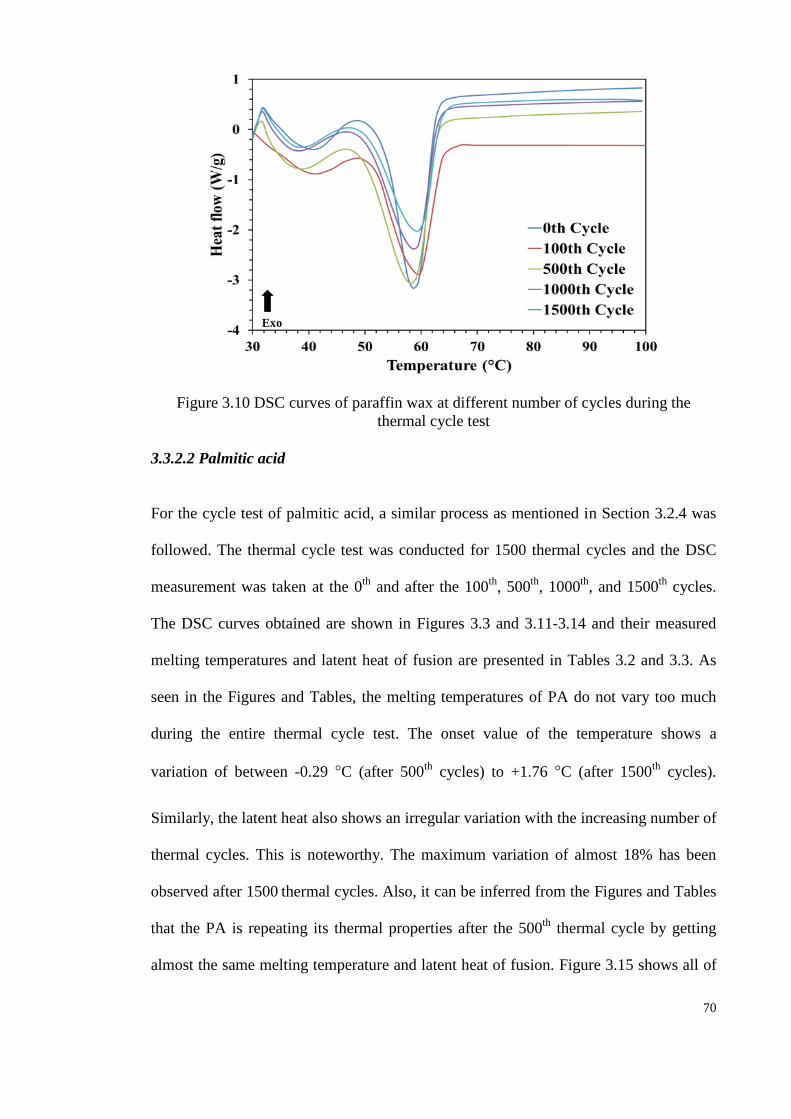
70
Figure 3.10 DSC curves of paraffin wax at different number of cycles during the
thermal cycle test
3.3.2.2 Palmitic acid
For the cycle test of palmitic acid, a similar process as mentioned in Section 3.2.4 was
followed. The thermal cycle test was conducted for 1500 thermal cycles and the DSC
measurement was taken at the 0th
and after the 100th
, 500th
, 1000th
, and 1500th
cycles.
The DSC curves obtained are shown in Figures 3.3 and 3.11-3.14 and their measured
melting temperatures and latent heat of fusion are presented in Tables 3.2 and 3.3. As
seen in the Figures and Tables, the melting temperatures of PA do not vary too much
during the entire thermal cycle test. The onset value of the temperature shows a
variation of between -0.29 °C (after 500th
cycles) to +1.76 °C (after 1500th
cycles).
Similarly, the latent heat also shows an irregular variation with the increasing number of
thermal cycles. This is noteworthy. The maximum variation of almost 18% has been
observed after 1500 thermal cycles. Also, it can be inferred from the Figures and Tables
that the PA is repeating its thermal properties after the 500th
thermal cycle by getting
almost the same melting temperature and latent heat of fusion. Figure 3.15 shows all of
Exo

71
the DSC curves obtained in one graph and it can be seen that the DSC curves at the 0th
cycle and after 500th
cycles are almost similar, this signifies the thermal stability of the
PCM.
Figure 3.11 DSC curve of palmitic acid after 100th
thermal cycle
Figure 3.12 DSC curve of palmitic acid after 500th
thermal cycle
100th
cycle Exo

72
Figure 3.13 DSC curve of palmitic acid after 1000th
thermal cycle
Figure 3.14 DSC curve of palmitic acid after 1500th
thermal cycle
Exo
1000th
cycle
Exo 1500
th cycle

73
Figure 3.15 DSC curves of palmitic acid during thermal cycle test
3.3.2.3 Myristic acid
The thermal cycle test for myristic acid was also conducted in a fixed temperature range
(30 to 100 °C) of the thermal tester as described in Section 3.2.4. The DSC
measurements were taken at the 0th
cycle and after the 100th
, 500th
, 1000th
, and 1500th
thermal cycles and presented in Figure 3.4 and Figure 3.16-3.19 and presented in Table
3.2 and 3.3. After a short number of 100 thermal cycles, the change in the latent heat of
fusion was decreased by 1.13 %, which became higher up to almost 10% after 500
thermal cycles. After 1000th
and 1500th
thermal cycle the changes in the latent heat of
fusion were 0.9% and 0.6%, respectively. Similar irregular variations have been
observed in the melting temperatures. A variation of -2.09 °C in the melting temperature
was observed after 500 thermal cycles, while the variation of 1.25 °C and 1.07 °C was
observed after 1000 and 1500 thermal cycles, respectively. A small peak at 62 °C also
appears which can be attributes as the two phase transition. Based on the above
Exo

74
discussion, it can be stated that, overall not much variations have been noticed in the
melting temperatures and latent heat of fusion of myristic acid for 1500 thermal cycles.
A detailed comparison of all of the obtained DSC curves can be seen in Figure 3.20.
Figure 3.16 DSC curve of myristic acid after 100th
thermal cycle
Figure 3.17 DSC curve of myristic acid after 500th
thermal cycle
100th
cycle Exo
500th
cycle Exo
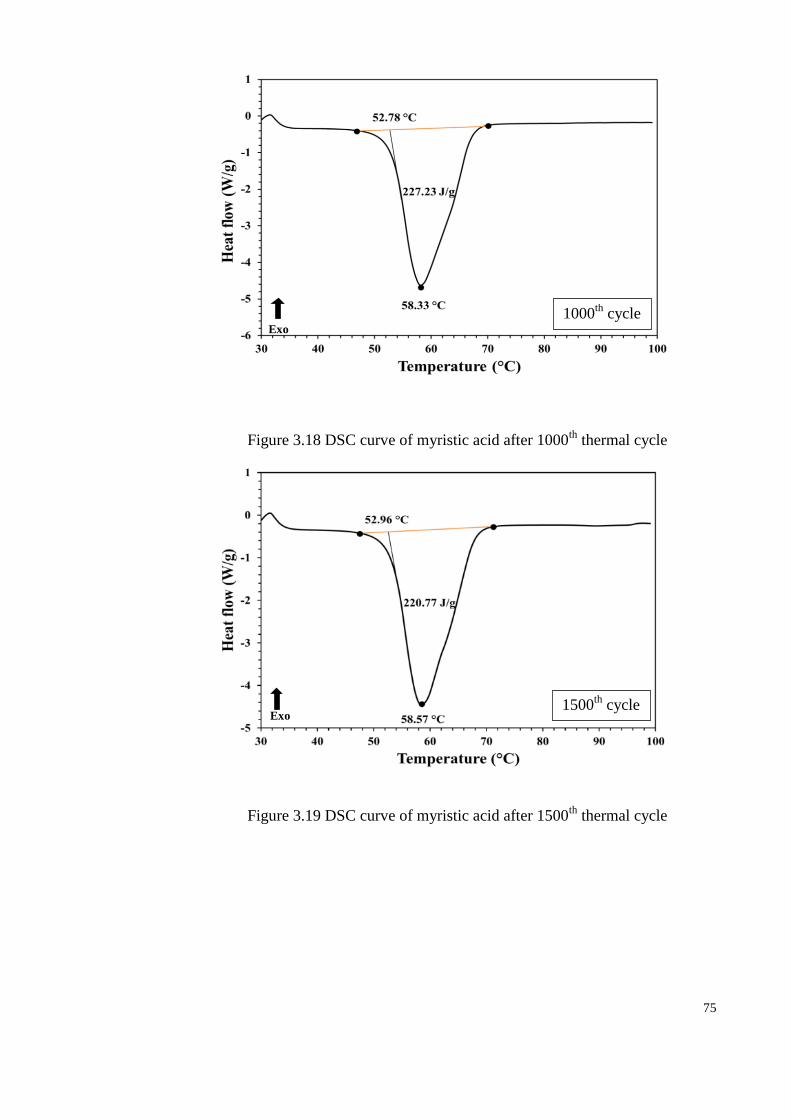
75
Figure 3.18 DSC curve of myristic acid after 1000th
thermal cycle
Figure 3.19 DSC curve of myristic acid after 1500th
thermal cycle
1000th
cycle Exo
1500th
cycle Exo

76
Figure 3.20 DSC curves of myristic acid during thermal cycle test
Paraffin and fatty acids, palmitic and myristic acids have shown reasonably
good thermal stability. Some decrease in the melting temperatures and latent heat of
fusion were observed after 500 thermal cycles but overall no major changes in these
properties has been noticed. Similar irregular decrease in melting temperature and latent
heat of fusion after 500 thermal cycles were observed for paraffin by Shukla et al.
(2008) and for palmitic and myristic acid by Hasan and Sayigh (1994) and Sari (2003)
with 95% purity. All of these three materials can be utilized as PCMs for latent heat
thermal energy storage for approximately five years without experiencing much change
in their thermophysical properties.
3.3.2.4 Polyethylene glycol 6000
For the accelerated thermal cycle tests, the lower and higher range of the temperatures
in the thermal cycle tester of melting and freezing of the PEG 6000 was kept as 30 °C
and 100 °C, respectively. The value of the latent heat of fusion and melting
Exo

77
temperatures of PEG were measured by the DSC at the heat flow rate of 10 °C/min at
0th
, and after the 100th
, 500th
, 1000th
, and 1500th
cycles. The values at the 0th
cycle were
considered as reference values. The obtained value of the melting temperature of the
fresh (uncycled) PEG 6000 from the DSC was 59.9 °C, which remained in the range of
55-60 °C, as quoted by Merck Company and the measured latent heat of fusion 231.03
J/g as shown in Figure 3.5. The variation in the heat flow against the temperatures as
obtained from the DSC between the 0th
and 1500th
cycles and the curves are shown in
Figure 3.21 to Figure 3.24.
A variation of +3.77 °C in the melting temperature of PEG 6000 was observed
after the 100th
melt/freeze cycles, see Figure 3.21. Beyond the 100th
thermal cycles, not
much variation in the melting temperature has been observed in the rest of the thermal
cycle testing process. A maximum variation of +3.86 °C in the melting temperature
after the 1000th
cycles (Figure 3.23) was observed when compared with that of the fresh
material (zeroth cycle). It can be noted that for the first 500 melt-freeze cycles, the
melting temperature decreases, but after 1000 cycles, an increase in this value was
observed. A further enhancement in the value of the melting temperature was recorded
after 1500 cycles, see Figure 3.24. This variation after the 100th
, 500th
, 1000th
, and
1500th
cycle is +3.77 °C, +3.94 °C, +3.86 °C, and +3.79 °C, respectively, compared
with the 0th
cycle. Also, it can be noticed that all the variations in the melting
temperature are within the standard temperature range quoted by Merck Company.

78
Figure 3.21 DSC curve of PEG 6000 after 100th
thermal cycle
Figure 3.22 DSC curve of PEG 6000 after 500th
thermal cycle
100th
cycle Exo
500th
cycle Exo

79
Figure 3.23 DSC curve of PEG 6000 after 1000th
thermal cycle
Figure 3.24 DSC curve of PEG 6000 after 1500th
thermal cycle
On the contrary, a regular variation in the latent heat of fusion was observed
between the 0th
and 1500th
cycle. A major reduction in the latent heat of fusion was
observed after the first 100 melt-freeze cycles, which was approximately 13% in
comparison to that of fresh PEG at 0th
cycle. A further reduction of almost 19%, 22%,
1000th
cycle
1500th
cycle
Exo
Exo

80
and 25% in the latent heat of fusion with respect to the fresh PEG was observed after
the 500th
, 1000th
, and 1500th
cycles, respectively. It can be stated that in comparison to
the first 100 thermal cycles, the measured drop in the latent heat of fusion in the next
400 cycles (between 100 and 500) was approximately 7% and, a drop of 4% was
observed between the 500th
and 1000th
cycle. This reduction slightly dropped after the
1000th
cycles and between the 1000th
and 1500th
cycles, a reduction of 3% in the latent
heat of fusion was seen. For a clear comparison of all of the DSC curves during the
entire thermal cycle test, Figure 3.25 can be referred where the overlapping of all
obtained curves are presented.
Figure 3.25 DSC curves of PEG 6000 during thermal cycle test
Exo

81
Table 3.2 Melting temperatures, Tm (°C) of the PCMs after repeated thermal cycles
No. of
test cycles
PCM
Paraffin Palmitic acid Myristic acid PEG 6000
0 52.90 62.21 54.03 59.90
100 52.18 61.86 53.12 56.13
500 49.63 62.50 56.12 55.96
1000 49.95 60.68 52.78 56.04
1500 50.33 60.45 52.96 56.11
Table 3.3 Latent heat of fusion, ∆Hf (J/g) of the PCMs after repeated thermal cycles
No. of
test cycles
PCM
Paraffin Palmitic acid Myristic acid PEG 6000
0 133.66 213.46 222.20 231.03
100 122.49 200.26 219.68 200.07
500 146.80 206.46 200.54 186.21
1000 125.06 178.04 220.23 179.13
1500 114.66 175.29 220.77 173.16
3.3.3 Chemical functional group analysis of O-PCMs
Tables 3.2 and 3.3 of Section 3.3.2 show the variations in the thermophysical properties
of selected O-PCMs and the variations in the thermal properties can be clearly seen.
There are two probable reasons for this variation; one is the impurities present in the
PCM and another is due to the changes in the chemical structure of the material during

82
the cycle tests. To observe the changes in the compositional/functional group of the
PCMs, the FT-IR spectroscopy was employed and the spectrum was taken of a fresh
(uncycled) PCM and after 1500 thermal cycles for the wavenumbers between 4000 cm-1
and 400 cm-1
. This is presented in Figures 3.26 to Figure 3.29.
Figure 3.26 shows the FT-IR spectra of paraffin before and after the cycle tests.
The peaks correspond to wavenumber 2918.18 and 2848.98 cm-1
are corresponding to
the symmetrical stretching vibration of –CH3 and –CH2 groups in paraffin, which
remains at the same position even after 1500 melt/freeze cycles. The C=O stretching
vibration corresponds to wavenumber 1646 cm -1
of paraffin before and after the thermal
cycle test show the same peak. The peak corresponds to wavenumber 1466 cm-1
signifies the deformation vibration of –CH3 and –CH2 group in paraffin. At
wavenumber 1300 cm-1
, the in-plane bending vibration of the –OH group and at 943
cm-1
, to the out-plane bending vibration of the –OH group of paraffin has appeared. The
symmetric peaks at 724 and 671 cm-1
correspond to the swinging vibration of the –OH
functional group of paraffin before and after the thermal cycle test. A new peak at
wavenumber 1103 cm-1
which appears in FT-IR spectra of paraffin after the thermal
cycle test can be clearly seen. This new peak might be because of the impurities present
in the PCM. The rest of the peaks fit into each other. This infers that the paraffin does
not undergo any significant compositional/functional group changes during the cycle
test and possesses a good thermal and chemical reliability for 1500 thermal cycles.

83
Figure 3.26 FT-IR spectra of uncycled (fresh) and cycled (1500 cycles) paraffin
The FT-IR spectra of palmitic acid before and after the cycle test are shown in
Figure 3.27. The peaks at 2918.24 and 2850.20 represent the symmetrical stretching
vibration of the –CH3 and –CH2 groups in PA, which take new positions after 1500
melt/freeze cycles at 2918.07 and at 2850.25, respectively. C=O stretching vibration is
assigned by a peak seen at 1700 cm-1
which is the same, before and after the thermal
cycle test. The peak at 1465 cm-1
signifies the deformation vibration of the –CH3 and –
CH2 groups in the PA. The peak at 1300 cm-1
is corresponding to the in-plane bending
vibration of the –OH group and the peak at 943 cm-1
is corresponding to the out-plane
bending vibration of the –OH group of PA. The symmetric peaks at 722 and 678 cm-1
correspond to the swinging vibration of the –OH functional group of the PA before the
thermal cycles and at 722 and 680 cm-1
after the thermal cycle test. A new peak at
wavenumber 3500 cm-1
can be spotted after the thermal cycle test which might be due
to the humidity absorption of PA from environment. Overall, palmitic acid has shown a
good thermal and chemical reliability during the cycle test.

84
Figure 3.27 FTIR spectra of uncycled (fresh) and cycled (1500 cycles) palmitic acid
FT-IR spectrum of the fresh MA and after 1500 cycles wavenumbers between
4000 cm-1
and 400 cm-1
are shown in Figure 3.28. It can be seen in this Figure, that no
new peak appears and no existing peak disappears in the PCM after 1500 cycles. So, the
sole reason for this slight variation in the properties is the impurities present in the
PCMs, which might be absorption of vaopurs from surrounding environment.
Figure 3.28 FTIT spectra of uncycled (fresh)and cycled (1500 cycles) myristic acid

85
Figure 3.29 shows the FT-IR spectrum of the uncycled (fresh) and cycled (1500
cycle) PEG 6000. As can be seen in the Figure, both curves are depicting a similar
behavior at a particular frequency band and no peak shift is visible. It can be mentioned
here that the PCM during the cycling process does not undergo any
compositional/functional group changes. Therefore, it can be assumed that the variation
in the thermal properties of the PCM with an increasing number of melting/freezing
cycles may be due to the presence of impurities in the material.
Figure 3.29 FT-IR spectra of PEG 6000 before and after thermal cycle test
3.4 Techno-economic analysis of O-PCMs
The techno-economic analysis of the PEG 6000 with the other five PCMs is discussed
in this section. As per the available research papers, the thermal cycle test of different
PCMs in the temperature range of 52-65 ˚C are given in Table 3.4. The comparison of
the thermal properties and latent heat at the initial and after cycle test of previously
tested PCMs in the temperature range of 52-65 °C are given in Table 3.4. Sharma et al.
(2002) performed the cycle testing of stearic acid (M.P. - 63.0 ˚C), and paraffin wax (a)
(M.P. - 53.0 ˚C) for 1500 thermal cycles. Shukla et al. (2008) conducted the accelerated

86
thermal cycles testing for paraffin wax (b) (M.P. 60-62 ˚C) and Sari (2003) considered
palmitic acid (M.P. - 61.31˚C) and myristic acid (M.P. - 52.99 ˚C) for 1200 thermal
cycle test. For a comparison of these PCMs for an economic analysis purpose, a
temperature range of 52-65˚C has been considered and paraffin wax (a and b), stearic
acid, myristic, and palmitic acid has been chosen for comparison with the PEG 6000 in
the present study. As can be seen in the Table 3.4 and Ref (Sharma et al., 2002), the
latent heat of fusion of fresh (uncycled) paraffin wax (a) is 184.0 J/g which was reduced
to 136.0 J/g (by 26%) after the 1500 thermal cycles. Stearic acid (155.0 J/g) was also
tested in the same study and showed a 21% reduction (155 to 123.0 J/g) in the latent
heat of fusion after the 1500 thermal cycle test. Shukla et al. (2008) also tested the
paraffin wax (b) of a melting temperature 60-62 ˚C for 600 melt/freeze cycles and
reported a 16.15% reduction in the latent heat of fusion and -1.7% in melting
temperature. It is important to mention here that paraffin (b) had lost 16.15 % of latent
heat in just 600 thermal cycles and this loss in latent heat is expected to increase should
it be selected for the 1500 thermal cycles. Another study for the cycle test of myristic
and palmitic acid was carried out by Sari (2003). The results of this study showed a
11.3% reduction % in the latent heat of myristic acid and 13% in the case of palmitic
acid after 1200 melt/freeze cycles. It is noteworthy here that the PCMs have been tested
only for the 1200 thermal cycles by Sari (2003). So a further reduction in the latent heat
of these PCMs is expected if these PCMs are tested for more number of thermal cycles.
A variation of +3 °C in the melting temperature of paraffin and -1°C that of stearic acid
during the cycle test have been reported in the Ref. (Sharma et al., 2002). A variation of
+6.78 °C in the melting temperature of the myristic acid and 9.5% in the case of
palmitic acid have been reported in the Ref. (Sarı, 2003).

87
In the present work, the PEG 6000 has been tested for 1500 melt/freeze cycles
and a reduction of 25% in the latent heat of fusion and 3.79 °C in melting temperature
have been observed. It can also be seen that the reduction in latent heat and melting
temperature of PEG 6000 are lesser than in comparison to the other quoted PCMs in the
Table 3.4. It is interesting to note that the latent heat of the PEG 6000 is 231.03 J/g
which is 25%, 49%, 77.7%, 30.8%, and 16.7% higher than that of paraffin wax (a),
stearic acid, paraffin wax (b), myristic acid, and palmitic acids, respectively. After the
repeated 1500 melt/freeze cycles, the PEG 6000 has 173.16 J/g latent heat which is also
higher than that of paraffin (a and b), stearic acid and close to that of myristic acid after
the completion of the total cycle test by the other researchers. It can also be seen that the
variation in the thermal properties of PEG-6000 remains within that of the variations of
the PCMs tested by past researchers. The latent heat of PEG 6000 after 1500 thermal
cycles is almost equal to that of the uncycled paraffin wax (a), palmitic acid and
myristic acid and much higher than of stearic acid (almost 10%) and paraffin wax (b)
(33%).
The variations in the latent heat of previously tested PCMs have shown an
irregularity, while, in the case of PEG 6000, the variation in the latent heat has been a
consistent value which makes it an attractive phase change material for thermal energy
storage applications in the temperature range of 52-65 ˚C. The cost analysis is also
given in Table 3.4 for the PCMs tested in the past studies and the PEG 6000. The cost
of PEG 6000 was taken as an average from the bulk price quoted by various
international chemical suppliers. The comparison shows that the cost of all PCMs is in
the similar range so the suitability of the PCMs for different thermal energy storage

88
applications in this temperature range can be decided on the basis of their energy
storage capacity and long term stability.
The results of this study can be very much helpful for predicting the life of thermal
energy storage materials for their particular applications. Also, if it is assumed that a
PCM undergoes approximately 300 melt/freeze cycles in a year excluding the cloudy
and rainy days, these tested O-PCMs can be effectively used as thermal energy storage
for five consecutive years. Also, it is recommended that all commercial grade PCMs
should undergo an accelerated thermal cycle test before their use for thermal energy
storage. It is because their thermophysical properties may vary from what is quoted by
the companies when tested. These materials can be efficiently used as solar energy
storage for low and medium temperature application such as solar water heaters and
dryers.
Table 3.4: Comparative life cycle and techno-economic analysis of O-PCMs
PCM
No. of
Cycles
Latent heat (J/g) Melting point
(˚C)
Cost
(USD/
kg)
Ref.
Initial* Final# Initial* Final
#
Paraffin wax (a) 1500 184 136 53.0 50.0 2.0 (Sharma et
al., 2002)
Stearic acid 1500 155 123 63.0 64.0 1.6 (Sharma et
al., 2002)
Paraffin wax (b) 600 130 109 58 59 1.5 (Shukla et
al., 2008)
Myristic acid 1200 176.6 156.6 52.99 46.21 1.5 (Sarı, 2003)
Palmitic acid 1200 197.9 172.4 61.31 55.47 1.8 (Sarı, 2003)
Myristic acid 1500 222.20 220.77 54.03 52.96 1.5 Present
work
Palmitic acid 1500 213.46 175.29 62.21 60.45 1.6 Present
work
PEG 6000 1500 231.03 173.16 59.9 56.11 1.6 Present
work

89
3.5 Summary
In this chapter, the variations in the thermophysical and chemical properties of the
paraffin, palmitic acid, myristic acid, and PEG 6000 were investigated during
accelerated thermal cycle test. Assuming that the minimum lifespan of the thermal
energy storage is 5 years, repetitive 1500 thermal cycles were performed and the
properties of the PCMs were measured at the 0th
cycle and after the 100th
, 500th
, 1000th
,
and 1500th
thermal cycles using a differential scanning calorimeter. The following
conclusions can be drawn from this study:
The melting temperatures of paraffin, palmitic acid and myristic acid are found
to be varied in the range of +0.72 to +3.27 ˚C, -0.29 to +1.76 ˚C, and -2 to +1.2
˚C respectively, which is not a very significant variation and these PCMs are
stable enough to be used as thermal energy storage materials.
The latent heat of fusion of paraffin, palmitic acid and myristic acid are found to
vary in the range of -9.8 to 14%, 3.28 to 18%, and 0.9 to 10% when compared
with that of the pure PCM. Paraffin and palmitic acid show a slightly larger
variation as compared to myristic acid which signifies that myristic acid is more
stable.
The variation in the melting temperature of PEG 6000 is found to be in the range
of 3.77 to 3.86 ˚C and the variation in the latent heat of fusion of the material is
between 13.4% and 25%. This variation is a bit higher than that of other PCMs,
but is a potential PCM for solar thermal energy storage.
FT-IR spectrum of paraffin and palmitic acid show new peaks at wavenumber
1103 cm-1
and 3500 cm-1
, which can be inferred as one of the reasons behind
variation in the thermal properties of the materials.

90
There are no peak shifts in the FT-IR spectra for myristic acid and PEG 6000
after 1500 repeated thermal cycles. This signifies their chemical stability. The
thermal variation is purely due to impurities present in the materials.
All selected O-PCMs have shown significant thermal and chemical stability with
a mild variation in their melting temperature and the latent heat of fusion during
repeated 1500 melt/freeze cycles.
Accelerated thermal cycle test for potential phase change materials is strongly
recommended to ensure their long term suitability for thermal energy storage.

91
CHAPTER 4: ENHANCEMENT IN HEAT TRANSFER OF ORGANIC PCM
4.1 Introduction
Previous studies and present accelerated thermal cycle tests (Chapter 3) have shown that
the organic PCMs possess an extremely low thermal conductivity and this drawback
limits their use in many domestic and industrial energy storage applications. A
significant improvement can be achieved by simply dispersing the solid metal particles
in micro or nano size in the organic PCMs. Adding the micro size particles, enhances
the chances of sedimentation during the flow of the PCM while nano size particles do
not exhibit such properties (Das et al., 2008). Also, due to the larger surface to volume
ratio, the dispersion of nano particles of solid metal or metal oxide enhances the thermal
conductivity and increases the heat transfer rate of the base PCM (Khodadadi &
Hosseinizadeh, 2007; Sharma et al., 2014). A large variety of nanomaterials with unique
thermophysical properties have been used in the past to enhance the thermal
performance of the base PCM (Arico et al., 2005; Kannan et al., 2005). Section 2.3
shows that several studies have been conducted to enhance the thermal conductivity of
organic PCMs in the past using nanoparticles of solid metal and metal oxides, however,
there is still a need for more research to explore the effects of the various nanoparticles
on the thermophysical properties of various PCMs. The reviewed literature shows that
although the nano TiO2 has been used to enhance the thermal properties of the aqueous
solution, these nanoparticles have not been explored much with the organic PCMs.
In this chapter, the phase change behavior of the prepared novel composites of
palmitic acid and solid nano-particles of titanium dioxide (TiO2) for thermal energy
storage will be investigated. The nano particles of TiO2 are dispersed in the base PCM

92
(PA in the present study), in different weight fractions (0.5, 1.0, 3.0 and 5%) and their
effect on the thermophysical properties of PA will be investigated.
4.2 Methodology
4.2.1 Materials
Palmitic acid with a melting temperature range of 60-62 °C, molecular weight of 256.43
g/mole, and purity of ≥ 98% was purchased from the R&M Chemical, UK. Nano-
particles of titanium dioxide (TiO2) anatase form of 21nm, and surfactant Sodium
dodecyl benzene sulfonate (SDBS) were provided by Sigma–Aldrich, Germany. All the
procured chemicals in the experiments were used without any further purification.
4.2.2 Preparation of composite materials
A well-established two-step method as shown in Figure 4.1 was adopted for the
preparation of composite PCMs of palmitic acid and different weight fractions of TiO2
nano-particles. Palmitic acid was considered as the base PCM and 0.5, 1.0, 3.0, and 5.0
wt% TiO2 nano-particles as the supporting materials for thermal conductivity
enhancement; and the prepared nano-enhanced organic phase change materials
(NEOPCMs) were named as NEOPCM1, NEOPCM2, NEOPCM3, and NEOPCM4.
While preparing the nanofluid, certain factors were kept in mind, i.e. uniform and stable
dispersions, low agglomeration and no chemical reactions between the nano-materials
and the base material. SDBS in the ratio of 1:1 wt% of TiO2 was used as the capping
agent (surfactant) for the uniform dispersions of nano-particles in palmitic acid.
Uniform and stable dispersions of nano-particles help in faster melting/freezing rate of
the PCM due to a higher thermal conductivity. In addition, for improving the nano-
particle dispersions and minimizing the aggregation, the liquid NEOPCMs were

93
subjected to intensive ultrasonication using an ultrasonic vibrator (VCX 500, SONICS
made) at a frequency of 40 kHz (Chandrasekar et al., 2010; Shao et al., 2016).
Vibrational energy created at this frequency helps to disperse the nano-particles
uniformly into the base liquid PCM. The residing time for 0.5, 1.0, 3.0, and 5.0 wt%
nanofluids were set as 30, 35, 45, 60 minutes, respectively. A higher residing time may
induce the defect in the nanofluid (Fan et al., 2015). During the entire sonication
process, it was ensured that the temperature of the sonicator remains significantly above
the melting temperature of palmitic acid to confirm its liquid state during the process.
Figure 4.1 Preparation steps of PA/TiO2 composites
4.2.3 Instruments
4.2.3.1 For preparation of composite PCMs
The adopted instruments for preparation of composite PCMs were:
A hot plate with stirring facility C-MAG HS7 230V IKA 3581200 make having
ceramic top that is kept in the Advanced Materials Laboratory, Department of
Mechanical Engineering, University of Malaya.
Ultrasonic probe sonicator SONICS 500 Watt, VCX 500 installed at the
Department of Chemical Engineering, University of Malaya.

94
4.2.3.2 Chemical analysis of NEOPCMs
To ensure the uniform dispersion and to visualize the surface morphology of the
composite PCM, a field emission scanning electron microscope (FESEM- CARL
ZEISS- AURIGA 60) was used. In order to determine the changes in the
compositional/functional groups during the cycle test, the Fourier Transform Infrared
(FT-IR) spectroscope (Brand: Bruker, Model: IFS66v/S) was used between the
wavenumbers of 4000 to 400 cm-1
with the spectral resolution of 2 cm-1
. Crystalloid
phase of the NEOPCMs was investigated with an x-ray test conducted by an x-ray
diffractometer (XRD: EMPYREAN, PANALYTICAL). Thermogravimetric analysis
(TGA) curves depicting the thermal stability, and derivative thermogravimetry (DTG)
curves depicting the rate of decomposition of composite PCM was obtained by Mettler
Toledo TGA/STDA 851-Error ± 5 µg at a heating rate of 10°/min in the temperature
range of 50-500 °C. FESEM, FT-IR, XRD, and TGA facilities were acquired at
NANOCAT Lab, Institute of Postgraduate Studies, University of Malaya.
4.2.3.3 Thermal reliability test
The thermal reliability test of palmitic acid/TiO2 composite NEOPCMs for 1500
thermal cycles was carried out using an accelerated thermal cycle tester as explained in
the Section 3.2.3. The melting temperature of palmitic acid is nearly 62 °C so the
temperature range of 40 to 80 °C was chosen in order to ensure that the material gets
melted and solidified completely during the cycle test.
95
4.2.3.4 DSC analysis
The phase change temperature and latent heat of fusion of PA and NEOPCMs were
measured by a differential scanning calorimeter; model METTLER TOLEDO 820C
with an error of ± 0.25 °C. For a detailed description of this measurement, Section 3.2.4
can be referred.
4.2.3.5 Thermal conductivity measurement
The thermal conductivity of the pure PA and NEOPCMs was measured using the KD-2
pro, which is based on the hot wire technique and a well-established technique for such
measurements. All the thermal conductivity measurements were taken when the
materials were in a solid state and at a temperature of 30°C. For this measurement, the
pure and composite PCMs were formed into a solid cylindrical form of 5.0 cm in length
and 2.5 cm in diameter using a die and a hydraulic press at a pressure of 1.5 tonnes.
Two holes of 1 mm diameter each were drilled on the flat surface of these cylindrical
samples. The gap between these holes was kept equal to the distance between the probes
of KD-2 pro. The temperature was maintained at a constant of 30 °C using a water bath.
A time gap of 15 min was kept between two subsequent conductivity measurements in
order to stabilize the temperature. Three measurements were recorded for each of the
composites at this temperature and the average value was considered for reporting.
4.3 Results and discussion
4.3.1 Morphology of palmitic acid and NEOPCM
FESEM images, showing the micro-structural features of nano TiO2 and NEOPCM4 in
the solid state are shown in Figure 4.2. The spherical shape of the TiO2 nano-particles
can be seen in Figure 4.2 (a). The FESEM images show the uniform dispersion of TiO2

96
nano-particles in palmitic acid (see Figure 4.2 (b and c)). This is due to the repulsive
bond of the surfactant. Melting of the NEOPCM around the PA lump can be seen at
some places due to the concentration of the electric beam on that particular location of
the material, which makes it melt.
Figure 4.2 FESEM images of (a) TiO2, (b) NEPCM4 (5wt% TiO2) at 5000
magnification, and (c) NEPCM4 at 20000 magnifications.
4.3.2 FT-IR analysis of palmitic acid and NEOPCMs
FT-IR curves of TiO2 nano-particles, PA, and NEOPCM1-4 between wavenumbers of
400 and 4000 cm-1
are shown in Figure 4.3. The band at 648 cm-1
corresponds to the
band stretching vibration of Ti-O. The band between 400 and 800 cm-1
represents the
Ti-O vibrations. Two absorption peaks corresponding to 1642 and 3424 cm-1
are
characteristic of the O-H bending of the hydroxyl group. The peaks at 2918 and 2850
(a) (b)
(c)

97
represent the symmetrical stretching vibration of the –CH3 and –CH2 groups in PA.
Nitrile stretch (C=N) appears at around wavenumber 2400 cm-1
. C=O stretching
vibration is assigned by a peak seen at 1700 cm-1
. The deformation-vibration of –CH3
and –CH2 group in PA can be recognized at the peak of 1465 cm-1
. The peaks at 1300
cm-1
and 943 cm-1
are corresponding to the in-plane and out-plane bending vibration of
the –OH group of PA. The symmetric peaks at 722 and 678 cm-1
correspond to the
swinging vibration of the –OH functional group. FT-IR spectrum of NEPOCM1-4
shows neither any new peaks nor any significant peak shifts in the composite PCMs
which signifies that only a physical interaction exists between PA, TiO2 and SDBS.
These spectra also do not show any chemical rearrangements of the functional group
which implies that no chemical reaction has taken place between PA and TiO2.
Figure 4.3 FT-IR Spectrum of pure PA, TiO2, and NEOPCMs
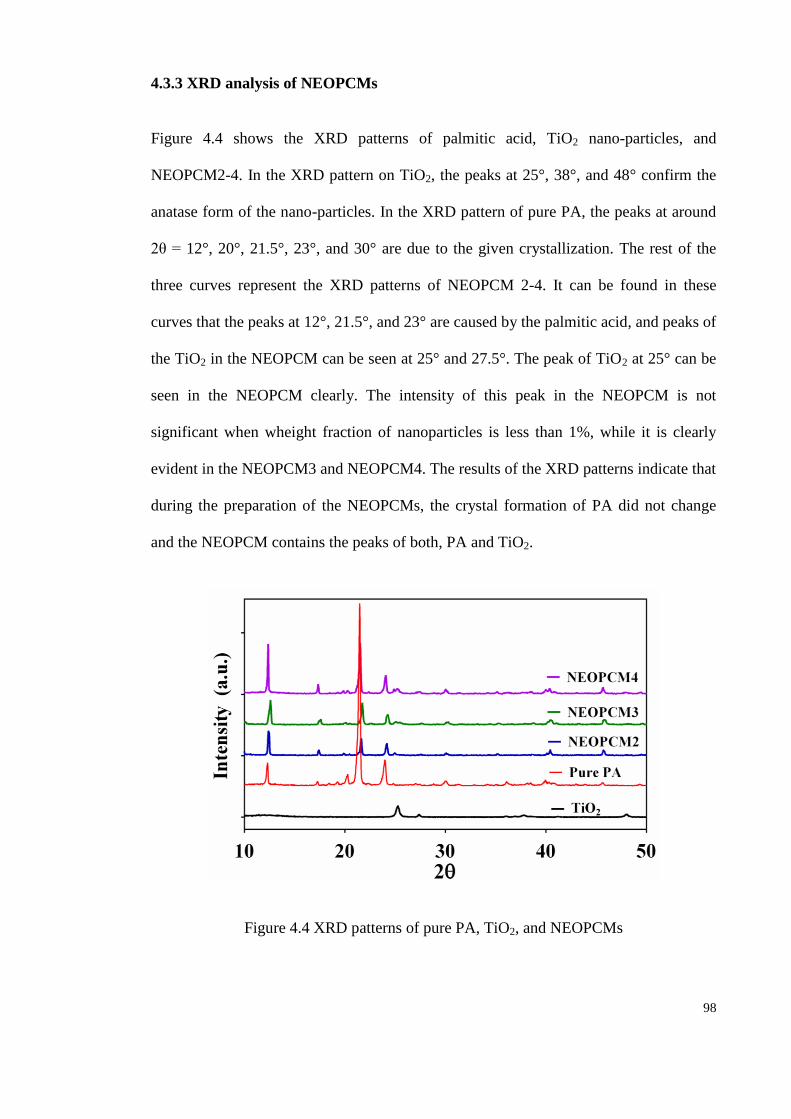
98
4.3.3 XRD analysis of NEOPCMs
Figure 4.4 shows the XRD patterns of palmitic acid, TiO2 nano-particles, and
NEOPCM2-4. In the XRD pattern on TiO2, the peaks at 25°, 38°, and 48° confirm the
anatase form of the nano-particles. In the XRD pattern of pure PA, the peaks at around
2θ = 12°, 20°, 21.5°, 23°, and 30° are due to the given crystallization. The rest of the
three curves represent the XRD patterns of NEOPCM 2-4. It can be found in these
curves that the peaks at 12°, 21.5°, and 23° are caused by the palmitic acid, and peaks of
the TiO2 in the NEOPCM can be seen at 25° and 27.5°. The peak of TiO2 at 25° can be
seen in the NEOPCM clearly. The intensity of this peak in the NEOPCM is not
significant when wheight fraction of nanoparticles is less than 1%, while it is clearly
evident in the NEOPCM3 and NEOPCM4. The results of the XRD patterns indicate that
during the preparation of the NEOPCMs, the crystal formation of PA did not change
and the NEOPCM contains the peaks of both, PA and TiO2.
Figure 4.4 XRD patterns of pure PA, TiO2, and NEOPCMs

99
4.3.4 Thermal energy storage properties
Upon increasing the temperature of the PA, the microstructure of the solid PA starts
loosening up the compactness. When the temperature is further increased, the molecules
of palmitic acid absorb the latent heat and change its phase to liquid, which is the result
of the conversion of the absorbed energy into kinetic energy, which overcomes the
intermolecular forces. Due to this conversion, the measurements of the latent heat and
melting temperature of the material are of paramount importance. DSC analysis has
been carried out for measuring the thermal energy storage properties of the pure PA and
NEOPCMs of different TiO2 nano-particle weight fractions.
Figure 4.5 DSC measurement of PA and NEOPCMs
Figure 4.5 shows the DSC curves of pure palmitic acid and the four prepared
NEOPCMs of 0.5, 1.0, 3.0, and 5.0 wt% nano TiO2. The melting point was estimated by
the tangent at the point of the highest slope on the face portion of the peak and the latent
heat of fusion as the area under the curve. It can be clearly seen in the Figure that all

100
DSC curves of PA and all NEOPCMs are of similar shape. The measured values of the
melting temperature, latent heat of fusion and calculated PCM percentage using
Equation 4.1 are shown in Table 4.1.
=
(4.1)
Table 4.1: DSC data of melting of PA and NEOPCMs
Sample name Melting temperature
(°C)
Latent heat of fusion
(kJ/kg)
PCM percentage
(%)
PA 62.21 213.46 100.0
NEOPCM1 62.47 209.02 98.0
NEOPCM2 60.16 202.9 95.0
NEOPCM3 60.75 184.43 86.4
NEOPCM4 61.59 180.03 84.3
As can be seen in Table 4.1, the melting temperature of the pue PA is 62.21 °C
and that of NEOPCM4 is 61.59 °C, which implies that the phase change characteristics
of pure PCM and NEOPCM are very close to each other. An irregular variation in the
melting temperature was measured with an increasing nano-particle volume fraction.
The melting temperature of the prepared composite PCMs is measured to be varied in
the range of -0.26 and +2 °C and latent heat of fusion between 2% and 15.5%. The
maximum reduction of +2 °C in the melting temperature of the NEOPCM is observed
compared to O-PCM (PA in the present case), which is in the case of NEOPCM2. On
the other hand, a regular degradation in the latent heat of fusion has been measured with
an increasing nano-particle volume fraction. This decrease in the latent heat of the
NEOPCMs is due to the changes in the physiochemical properties caused by the

101
dispersion of TiO2 nano-particles, which was expected. Lowering the latent heat of
fusion with the increase in the nano-particle wt% signifies that a lesser amount of heat is
required to change the phase from solid to liquid which consequently reduces the
melting/solidification of the O-PCMs. The maximum deviation of 15.5% of the latent
heat of fusion is observed in the case of the NEOPCM4 in comparison with the pure
PA, which is not very much significant for such a higher loading of the nano-particles.
As can be seen in Table 4.1, as expected, the percentage of the PCM in the NEOPCMs
decreases with the increase in the nano-particle mass fractions. The minimum PCM
percentage is 84.3% for the high loading of 5 wt% nano-particles, which implies that
the chances of the leaking of the O-PCM in the composite are less. A correlation is also
developed to predict the latent heat of the NEOPCMs based on the curve fitting of the
experimental data as a function of the weight fraction of nano-particles dispersed into
the base PCM, as given below:
= ( − ) (4.2)
Figure 4.6 shows the measured and calculated latent heat of fusion for the
NEOPCMs. The latent heat of the NEOPCMs can be calculated using the composite
theory (Wu et al., 2010):
= (4.3)
where and are the latent heat of fusion of the composite and pure O-
PCM, respectively, and is the weight fraction of the nano-particles dispersed into the
base O-PCM.

102
Figure 4.6 Effect of mass fraction of TiO2 nanoparticles on the latent heat
As can be seen in the Figure 4.6, the measured latent heat of each composite is
smaller than that of the calculated value and this deviation gets wider with the increase
in the wt% of the nano-particles, which might be due to the surface morphology and
structure of the material. Similar deviations in the measured and calculated values were
found in the investigations of Wu et al. (2010), Wang et al. (2009), and Sari et al.
(2009), which confirms the reliability of the current results.
4.3.5 Thermal stability
Thermal gravimetric analysis was carried out for the pure PA and NEOPCM1-
NEOPCM4 to investigate their thermal stability. The TGA curves for the pure PA and
NEOPCM4 are shown in Figure 4.7, while Figure 4.8 shows the DTG curve of these
materials. The weight loss of the pure PA occurred between 202 and 282 °C and
between 202 and 286 °C for NEOPCM4. Below 200 °C, the weight loss is around 4%,
which can be attributed as the removal of the absorbed water. The charred residue

103
amount of the PA after 500 °C was determined to be less than 0.5% and it remained
constant thereafter, so it can be considered that the pure PA completely degraded at 282
°C, which can be understood as the complete breakage of the polymer chains into
monomers. In the case of NEOPCM4, which is the composite PCM of the high nano-
particle concentration (5 wt%) in the present study, the charred amount of residue after
500 °C was around 4.5% and this remained constant thereafter. So, the maximum
degradation of the NEOPCM4 occurred at around 286 °C which is close to that of the
pure PCM. This minor delay in the degradation may be due to the fact that the addition
of nano-particles in the pure PCM serves as a thermal retardant against the temperature,
which results in the delay in the decomposition. So, it can be understood from the TGA
and DTG (Figure 4.8) curves that the dispersion of nano-particles in the pure PA has
improved the stability of this PCM. Since, no decompositions of the material have been
noticed until 200 °C, the pure PA and NEOPCMs can be effectively used for the
cooling/heating applications of buildings and solar thermal energy storage applications.
Figure 4.7 TGA curves of PA and NEOPCM4
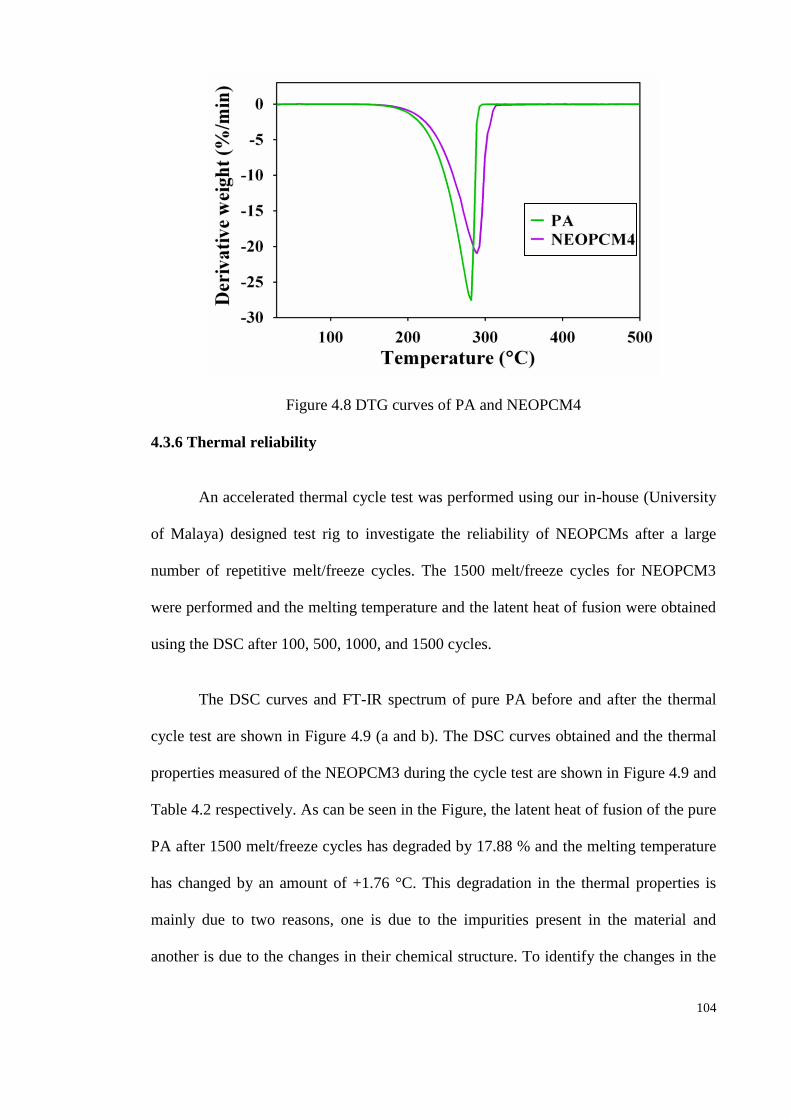
104
Figure 4.8 DTG curves of PA and NEOPCM4
4.3.6 Thermal reliability
An accelerated thermal cycle test was performed using our in-house (University
of Malaya) designed test rig to investigate the reliability of NEOPCMs after a large
number of repetitive melt/freeze cycles. The 1500 melt/freeze cycles for NEOPCM3
were performed and the melting temperature and the latent heat of fusion were obtained
using the DSC after 100, 500, 1000, and 1500 cycles.
The DSC curves and FT-IR spectrum of pure PA before and after the thermal
cycle test are shown in Figure 4.9 (a and b). The DSC curves obtained and the thermal
properties measured of the NEOPCM3 during the cycle test are shown in Figure 4.9 and
Table 4.2 respectively. As can be seen in the Figure, the latent heat of fusion of the pure
PA after 1500 melt/freeze cycles has degraded by 17.88 % and the melting temperature
has changed by an amount of +1.76 °C. This degradation in the thermal properties is
mainly due to two reasons, one is due to the impurities present in the material and
another is due to the changes in their chemical structure. To identify the changes in the

105
chemical structure, the FT-IR spectrum of the PA was taken before and after the thermal
cycle test and the curves are presented in Figure 4.9 (b). It is clearly visible in the Figure
that an absorption peak has been created in the pure PA after the cycle test at around
3500 cm-1
, whereas, along with the impurities being present in the material, this can be
inferred as a possible reason for the degradation of the material properties.
Figure 4.9 (a) Melting DSC curves (b) FT-IR spectrum of pure PA before and after the
thermal cycle test
Figure 4.10 shows the DSC curves and FT-IR spectrums of NEOPCM3 before
and after the cycle test. As can be seen in the Table 4.1, the maximum jump in the
reduction of latent heat of fusion was observed in NEOPCM3, so this composite sample
was selected for thermal reliability test. The Table 4.2 shows that during the thermal
cycle test, the melting temperature of NEOPCM3 after the 100th
, 500th
, 1000th
, and
1500th
thermal cycles changed by 0.26, -2.05, -1.46, and -0.62 ˚C, respectively. In
comparison with the pure PA, a variation of -2.0%, -0.26%, -1.42%, and -2.54% in the
latent heat of fusion was observed after the 100th
, 500th
, 1000th
, and 1500th
cycles,
respectively. It can be understood by looking at the variations in the melting
temperatures and the latent heat of fusion that the changes are not significant even after
a large number of melt/freeze cycles. The depreciation in the latent heat of fusion of
(a) (b)

106
NEOPCM3 is within the acceptable level of the LHTES applications (Sharma et al.,
2016). So, if 300 melt/freeze cycles are considered in a calendar year, these NEOPCMs
can be effectively used for five consecutive years for thermal energy storage in many
domestic and industrial applications.
Figure 4.10 (a) Melting DSC curves (b) FT-IR spectrum of NEOPCM3 before and after
thermal cycle test
Table 4.2.Thermal properties of NEOPCM3 before and after the thermal cycle test
No. of test cycles Melting temperature
(°C)
Latent heat of fusion
(kJ/kg)
0 60.75 184.43
100 60.47 181.52
500 60.16 182.99
1000 61.02 184.02
1500 60.59 180.03
To study the changes in the compositional/functional group of the NEOPCMs
during the cycle tests, the FT-IR spectrum of NEOPCM3 before and after the cycle test
was obtained and is shown in Figure 4.10 (b). As can be seen in the spectrum, no new
peak has appeared after the 1500 melt/freeze cycles and no old peak has disappeared,
(a)
(a) (b)

107
which signifies that the accelerated thermal cycle test has not affected the chemical
structure of the NEOPCM. Accordingly, the PA/TiO2 composite O-PCMs show the
stable chemical and thermal properties after such a large number of thermal cycles.
Figures 4.9 and 4.10 shows that the dispersion of the nano TiO2 enhances the
thermal and chemical stability of the pure PA significantly. The addition of the 3% TiO2
decreases the degradation in the latent heat from 17.88% to 2.4% and melting
temperature from 1.76 °C to 0.16 °C. This enhanced chemical and thermal stability of
the PA/TiO2 composite makes them highly suitable for effective solar thermal energy
storage.
4.3.7 Thermal conductivity
The energy storage and its discharge rate of the phase change materials is very
much dependent on their thermal conductivity (Wu et al., 2010). Higher thermal
conductivity increases the heat transfer rate, which in turn increases the melting and
solidification process and this leads to a lesser solidification/melting time. In the present
study, the TiO2 nano-particles of 21nm average size, dispersed in different wt% into the
liquid PA. The thermal conductivity of the prepared NEOPCMs was measured in the
solid state at a temperature of 30 °C, which is below melting point using KD-2 Pro. This
equipment is based on the hot wire method. It is a well-known fact, that if the thermal
conductivity is measured at different temperatures, the enhancement in the value of
thermal conductivity is not very much significant (Sharma et al., 2015) so keeping this
in mind, the conductivity has been measured at one particular temperature. The values
of the measured thermal conductivity against the wt% of nano-particles are presented in
Figure 4.11(a). As can be seen, the thermal conductivity consistently increases with the
increase in the weight fraction of the nano-particles. The addition of a very small

108
amount of nano-particles (0.5 weight%, NEOPCM1) increases the thermal conductivity
by 12.7%. The enhancement in the thermal conductivity was 20.6%, 46.6%, and 80% in
the case of the NEOPCM2, NEOPCM3, and NEOPCM4, respectively. This
enhancement shows that the thermal conductivity of NEOPCMs is directly proportional
to the nano-particle wt%. The nonlinear behavior of the thermal conductivity
enhancement is mainly due to the agglomeration caused by a higher percentage of the
TiO2 nano-particles in the PA (Harikrishnan et al., 2013). The enhancement of the
thermal conductivity also ascertains the lesser melting and solidification time of
NEOPCMs compared to pure PA. Supercooling effect in the case of the NEOPCMs is
also diminished due to the fact that the TiO2 nano-particles dispersed into palmitic acid
act as a nucleating agent, which helps in achieving the congruent melting and
solidification of the NEOPCMs (Harikrishnan et al., 2013). Additionally, Figure 4.11
(b) shows the thermal conductivity ratio (=
), where k is the thermal conductivity of
the NEOPCM and k0 is that of pure palmitic acid. The value of this ratio is greater than
1 for all NEOPCMs, which also signifies the enhanced thermal conductivity of all
composite PCMs. A correlation to predict the thermal conductivity of NEOPCMs as a
function of loading of the nano-particles has been developed on the basis of the best fit
curve of the experimental data and is given below:
= ( ) (4.4)
Where is the thermal conductivity of composite PCMs, is the
conductivity of pure O-PCM, and is the weight fraction of TiO2 nano-particles.

109
Figure 4.11 (a) Thermal conductivity and (b) conductivity ratio of PA and NEOPCM1-
NEOPCM4
4.3.8 Summary and comparison of thermal conductivity with previous studies
Table 4.3 shows the thermal conductivity and the latent heat of fusion of nano enhanced
PCMs prepared in previous studies based on the dispersion of the nano-particles of
metal oxides such as Al2O3, CuO, SiO2, ZnO, Fe2O3, and TiO2 and the results are
compared with the findings of the current study. Wang et al. (2014) prepared the
nanocomposites of paraffin and nano TiO2 and reported a 13% enhancement in the
thermal conductivity with a dispersion of 7% at the cost of 9% reduction in the latent
heat. In another study, Harikrishnan et al. (2014) prepared the mixture of stearic acid
and lauric, and the nano TiO2 was mixed together. A dispersion of 1% TiO2 enhanced
the thermal conductivity by approximately 42% and a 2% reduction in the latent heat of
fusion. In their another work, Harikrishnan et al. (2013) prepared a NEPCM of stearic
acid and nano TiO2 and they reported that the addition of the 0.3% nano TiO2 enhanced
the thermal conductivity by approximately 63%. In a recent study, Motahar et al.
(2014a) dispersed the nano TiO2 into organic PCM n-octadecane and found that the
dispersion of the 5% nanoparticles enhances the thermal conductivity by 26.6%. An
addition of 4% of Fe2O3, Al2O3, ZnO and SiO2 have also shown enhanced thermal
conductivity of paraffin by 87.5%, 135%, 90%, and 90% respectively (Babapoor &
(a) (b)

110
Karimi, 2015). The present study shows an increment of approximately 80% in thermal
conductivity when the TiO2 nano-particles dispersion of 5%. This can be considered as
a significant enhancement when compared with the existing NEPCMs. Furthermore, it
can be seen in Table 4.3 that the latent heat of the pure PA is higher than that of the
many PCMs which shows the suitability of this organic candidates in many domestic
and commercial energy storage applications. In addition, the thermal reliability results
also ensure the long term use of these NEOPCMs.
Table 4.3 Comparison of thermal conductivity and the latent heat of fusion of
NEOPCMswith previous similar composites
Composite Thermal Conductivity
(W/mK)
Latent heat (kJ/kg) Ref
Base PCM NEPCM Base PCM NEPCM
Paraffin/7% TiO2 0.22 0.25 165 150 (Wang et al.,
2014)
(SA+LA)/1% TiO2 0.19 0.27
176.98 173.22 (Harikrishnan
et al., 2014)
n-octadecane/5% TiO2 0.45 0.57 - - (Motahar et
al., 2014a)
Paraffin/4% Fe2O3
0.4
0.75
212
105
(Babapoor &
Karimi, 2015)
Paraffin/4% Al2O3 0.94 200
Paraffin/4% ZnO 0.76 182
Paraffin/4% SiO2 0.76 200
Paraffin/5% γ-Al2O3 0.22 0.275 142.2 134.1 (Wang et al.,
2010)
Paraffin/5% CuO 0.25 0.2663 - - (Jesumathy et
al., 2012)
Paraffin/10% Al2O3 0.13 0.138 243.1 212.3 (Ho & Gao,
2009)
Palmitic acid/5% TiO2 0.19 0.35 213.46 180.03 Present study

111
4.4 Summary
This experimental study was conducted on the preparation and characterization of
palmitic acid/TiO2 nano-enhanced organic phase change materials. The TiO2 nano-
particles in 0.5, 1.0, 3.0, and 5.0 wt% were dispersed into liquid palmitic acid (PA) and
the effect of its weight fraction on the thermo-physical properties of the NEOPCMs
were measured using the DSC and thermal conductivity apparatus. The results of this
study can be summarized as below:
The FESEM and XRD images confirm the uniform dispersion of the
nano-particles and the FT-IR spectrum show that the TiO2 nano-particles
are in chemical compatibility with the PA and the interaction between
the base O-PCM and nano-particles is purely physical.
DSC results of the NEOPCMs do not exhibit any significant changes in
the melting temperature (maximum 3.3% deviation). A variation of about
15.5% is found for the latent heat of fusion. These finding show that this
composite PCM has great potential to be used as thermal energy storage
materials.
The accelerated thermal cycle test of the NEOPCM showed that the
prepared composite material does not lose its thermal and chemical
properties even after a large number of melt/freeze cycles. During the
cycle test, the deviation in the melting temperature was found to be in the
range of -0.4 to +0.98% and in the latent heat of fusion +0.2 to 2.4%.
Addition of nanoparticles of TiO2 improves the chemical and thermal
stability of the pure PA.

112
Thermal conductivity was found to be increasing with the increase of the
loading of the nano-particles. An 80% enhancement in thermal
conductivity was seen in the case of the NEOPCM4 compared to pure
PA. The prepared composites have shown the enhanced thermal
properties without significantly affecting the thermal energy storage
capacity, so, these NEOPCMs can be used as potential candidates for
solar energy storage applications.

113
CHAPTER 5: MATHEMATICAL MODELING FOR ENHANCED
SOLIDIFICATION IN AN ENCLOSURE
5.1 Introduction
Understanding of the results of the thermal cycle tests and of composite nano enhanced
organic PCMs has led to the understanding that the dispersion of the nano particles of
metal or metal oxides enhances the thermal conductivity significantly which in turn
increases the heat transfer rate of PCMs. During the charging (melting) process, the
PCM remains in a liquid state and it becomes essential to store it in a leak proof
container. The shape of the container affect the heat transfer process within the PCM
significantly (Verma et al., 2008). The behavior of the melting/freezing phenomenon in
the PCM can be very well predicted using analytical or numerical methods. A
parametric investigation of solidification phenomenon of nanofluid flled in the
trapezoidal cavity has been carried out using ANSYS Fluent. The FLUENT has a
specific model to simulate and predict the phase front interface during melting/freezing
process and crystal growth. This computational fluid dynamics (CFD) software has
shown its capability in predicting the melt/freeze phenomenon very accurately in
previous studies The effect of nanoparticle concentration, trapezoidal wall, cold wall
temperature and Grashof number on the total solidification time has been investigated in
this chapter.
5.2 Methodology
5.2.1 Geometry
A two-dimensional (2D) trapezoidal cavity of 100 mm2 internal area, as shown in
Figure 5.1, is considered in this study. The length (L) of the cavity is 10 mm and the
height (H) is varied in such a way that the internal area of the cavity remains constant at

114
100 mm2. Three types of trapezoidal cavities are formed based on three different angles
such as θ = 2.72°, 5.42
° and 7.69
°. Details of these geometries are given in Table 5.1.
Figure 5.1 Sketch of the two dimensional trapezoidal cavity
Table 5.1 Configuration of tested trapezoidal geometries
Tested cavity Length (L), mm Height (H), mm Inclination angle (θ)
Square cavity 10 10 0°
Cavity 1 10 10.52 2.72°
Cavity 2 10 11.20 5.42°
Cavity 3 10 11.91 7.69°
5.2.2 Boundary conditions
The horizontal walls are assumed to be insulated, non-conducting, and impermeable to
heat transfer. The mathematical relations given in the following section are identical to
the work of Khanafer et al. (2003) and Khodadadi & Hosseinizadeh (2007), thus they
can be used to benchmark our numerical model by comparing our findings with theirs.
The left and right inclined walls are kept at constant temperatures of Th = 283.15 K and
y
L x
H g
Tc Th
θ

115
Tc = 273.15 K, respectively. The nanofluid in the cavity is considered to be Newtonian,
laminar, and incompressible. Thermo-physical properties of the nanofluids are assumed
to be constant in the case of water-Cu nanofluid, whereas the density variation in the
buoyancy force is handled by the Boussinesq approximation. In the case of paraffin-Cu
nanofluid, the thermophysical properties have been considered temperature dependent
and discussed in the following sections. The user defined functions (UDF) for
accommodating the variation in the thermophysical properties with the temperature
were written using language C and appended in the prepared ANSYS Fluent numerical
model. The nanoparticles are assumed to have a uniform shape and size (10 nm
diameter). The left lower corner of the cavity is the origin of a coordinate system.
Gravity acts in the negative y-direction, i.e., = and = − .
The initial and boundary conditions for the present investigation are as follows:
At the left inclined wall, 0, hu v T T , at = and
At the right inclined wall, 0, cu v T T at = and
At horizontal surfaces, 0T
u vy
, at = , and
Table 5.2 Thermo-physical properties of the base fluid (water) and the Cu nanoparticles
Property Copper nanoparticles Base fluid (water)
= 8954 997.1
-
⁄ 383 4179
⁄ 400 0.6
- 5
- 6.2
- 0.125
-
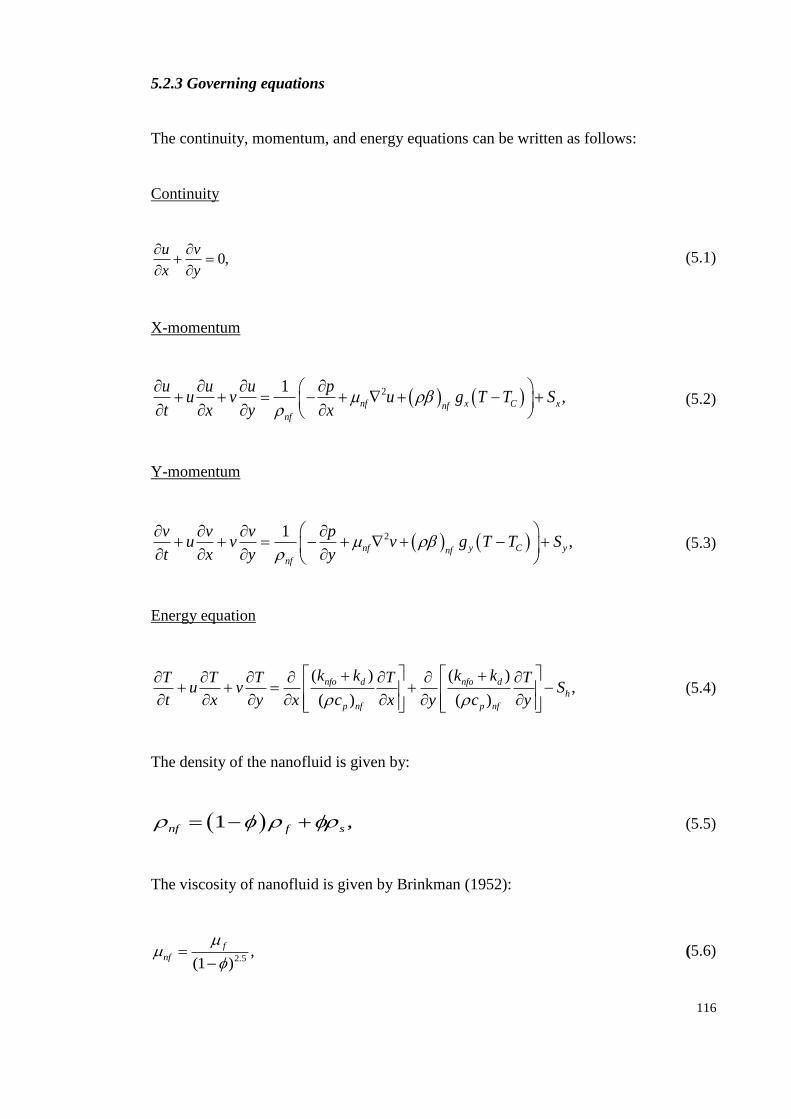
116
5.2.3 Governing equations
The continuity, momentum, and energy equations can be written as follows:
Continuity
0,u v
x y
(5.1)
X-momentum
21,nf x xn Cf
nf
u u u pu v u g T T S
t x y x
(5.2)
Y-momentum
21,nf y yn Cf
nf
v v v pu v v g T T S
t x y y
(5.3)
Energy equation
( ) ( ),
( ) ( )
nfo d nfo d
h
p nf p nf
k k k kT T T T Tu v S
t x y x c x y c y
(5.4)
The density of the nanofluid is given by:
1 ,nf f s (5.5)
The viscosity of nanofluid is given by Brinkman (1952):
2.5,
(1 )
f
nf
(5.6)

117
The heat capacitance of the nanofluid and part of the Boussinesq are:
( ) (1 )( ) ( )p nf p f p sc c c (5.7)
( ) (1 )( ) ( )nf f s (5.8)
The latent heat of the nanofluid is evaluated using
( ) (1 )( )h nf h fL L (5.9)
The thermal conductivity of the quiescent (subscript 0) nanofluid is given as (Wasp,
1977):
2 2 ( )
2 2 ( )
nfo s f f s
f s f f s
k k k k k
k k k k k
(5.10)
The effective thermal conductivity of the nanofluid is:
0 ,eff nf dk k k (5.11)
Where dk is the thermal conductivity enhancement term due to the thermal dispersion
and is given as (Amiri & Vafai, 1994):
2 2( ) .d p nf pk C c u v d (5.12)
The constant C is obtained from work of Wakao and Kaguei (1982).
In Eqs. (2)-(4), S is the source terms which are given by:
( ) , ( ) ,
[( ) ]
x y
nf
h
S A f u S A f v
LfS
t
(5.13)

118
where 2
3
(1 )( )
M fA f
f
causes the gradual change in velocity from a finite value in the
liquid to zero in the solid in the computational cells. Here 0.001, a small
computational constant used to avoid division by zero and M (105 in the current
investigation) is the mushy zone constant reflecting the morphology of the
melting/solidification.
The sensible enthalpy ,h and total enthalpy, He is written as:
,
c
T
c p nf
T
h h C dT (5.14)
e hH h fL (5.15)
where fLh is latent heat which varies between zero for solid to Lh for liquid, and f is
given by:
0
1
s
ss l
l s
l
if T T
T Tf if T T T
T T
if T T
(5.16)
Where Ts and Tl are the solidus and liquidus temperatures, respectively.
The calculation of the Nusselt number is an effective way to represent the heat transfer
rate of a nanofluid. A local Nusselt number ( LNu ) is calculated with the following
equation:
nf
Lwf
k H TNu
k T n
(5.17)

119
An average Nusselt number is calculated by integrating the local Nusselt number:
0
1S
ave L
i
Nu Nu dsS
(5.18)
Where s is the distance along the inclined wall and Si is the length of the inclined wall.
5.2.4 Simulation cases
A total of sixty two CFD simulations as shown in Table 5.3 were carried out for
validation and to study the effect of various parameters, such as the inclination angle of
a trapezoidal section, nanoparticle volume fraction, and wall temperature difference on
the total solidification time of the nanofluid. Case 1 CFD model, which is based on a
rectangular cavity of 8.89 cm × 6.35 cm filled with solid gallium, is used to investigate
the propagation of the melt front of gallium. Case 2 is based on the solidification of
water filled in a trapezoidal cavity and is used to investigate the temperature distribution
at a certain height of the cavity. Eight simulations, i.e., Cases 3-10 are based on a square
cavity of 1 cm length, filled with nanofluid, and these cases are used to validate the U-
velocity at the vertical mid plane and the temperature profiles at the horizontal mid
plane for Gr = 104 and 10
5 against such results from Khanafer et al. (2003). The
remaining cases are based on a trapezoidal cavity. Thirteen simulations, i.e., Cases 11-
23, were used to investigate the effect of the nanoparticle volume fraction, ϕ, inclination
angle, θ, and temperature difference, ΔT on the total solidification time of the nanofluid
in a trapezoidal cavity. Three simulation cases (24-26) are used to investigate the effect
of Gr on the mode of heat transfer. Cases 27-62 (thirty six simulations) are used to
calculate an average Nusselt number along the hot wall of the trapezoidal cavity for
various values of Gr, θ, and ϕ.

120
Table 5.3 Simulation cases
Sim.*
cases
Inclination
angle, θ ° Material
ΔT
(°C) Gr Remarks
1 (square
cavity) 0 Solid gallium 9.7
-
Used to validate the phase front of
Gau and Viskanta (1986), Brent et
al. (1988), and Khodadadi et al.
(2007)
2
(trapezoidal
cavity)
- Pure water - -
Used to validate the temperature
profile of solidifying water in the
cavity (Duggirala et al., 2006)
3-10 (square
cavity) 0
0, 0.1, and
0.2 Cu-H2O
nanofluid
-
104
105
Used to validate the temperature
profile and U-velocity results of
Khanafer et al. (2003)
11-13
(trapezoidal
cavity)
2.72
0, 0.1, and
0.2 Cu-H2O
nanofluid
10
-
To study the effect of nanoparticle
volume fraction on solidification of
nanofluid
14-16
(trapezoidal
cavity)
2.72
5.42
7.69
0.2 Cu-H2O
nanofluid 10 -
To study the effect of inclination
angles on solidification of
nanofluid
17-19
(trapezoidal
cavity)
2.72
5.42
7.69
0.2 Cu-H2O
nanofluid 10 -
To study the phase front
propagation in trapezoidal cavity
20-23
(trapezoidal
cavity)
2.72 0.2 Cu-H2O
nanofluid
10
20
30
55
110
- To study the effects of temperature
difference on the solidification
24-26
(trapezoidal
cavity)
2.72 0.2 Cu-H2O
nanofluid -
105
106
107
To study the effect of conduction
or convection dominated heat
transfer
27-62
(trapezoidal
cavity)
2.72
5.42
7.69
0, 0.1, and
0.2 Cu-H2O
nanofluid
-
103
104
105
To compute the values of average
Nusselt number
*Simulation

121
5.2.5 Mesh independency test
Structured and uniform square grid spacing for x and y-direction, as shown in Figure
5.2, is used for all the numerical simulation cases reported here. The grid independence
study is carried out from coarse to fine grid using five different uniform grids 50 × 50,
80 × 80, 120 × 120, 150 × 150, and 200 × 200. The complete solidification time for all
grids are numerically computed and shown in Table 5.4. Between the grid size of 50 ×
50 and 120 × 120, the fluctuation in results is as high as 4% but increasing the grid size
beyond 120 × 120 reduces the variation substantially down (to 1%), so the grid size of
120 × 120 is considered in the present study with the finer grid on the side walls.
Figure 5.2 Meshed trapezoidal cavity

122
Table 5.4 Mesh independency test
Sr.
No.
Inclination
angle
Mesh size Total solidification time (s) Deviation
(%)
1. 2.72
o 50 50 1292 -
2. 2.72
o 80 80 1304 0.92
3. 2.72
o 120 120 1360 4.118
4. 2.72
o 160 160 1378 1.306
5. 2.72
o 200 200 1392 1.006
5.2.6 Numerical methods
The Semi-Implicit Method for Pressure-Linked Equations (SIMPLE) method within the
commercial CFD package ANSYS Fluent (13.0., 2011) is used to solve the governing
Eqs. 5.1 – 5.4. The Enthalpy-porosity approach is used for the phase change region
inside the PCM, by which the porosity in each cell is set equal to the liquid fraction in
that cell. The Quadratic upstream interpolation for convective kinematics (QUICK)
differencing scheme is used for solving the momentum and energy equations, whereas
the Pressure Staggering Option (PRESTO) scheme is used for pressure correction
equations. In the enthalpy method, the solution is based on a fixed grid and governing
equations are modified such that they are valid for both phases. Also, the mushy zone
constant (M) is set to 105 kg/m
3s. The time step size used for all the simulations in this
study is 0.5 s and number of iterations for each time step are 800. The under-relaxation
factor of all the components, such as velocity components, pressure correction, thermal
energy etc. is kept at 0.3. Convergence criteria are set at 10-6
for continuity and
momentum and 10-8
for thermal energy.

123
Numerical simulations of solidification begin with the steady state natural
convection within the trapezoidal cavity filled with nanofluid (Cu-H2O). At t = 0s, the
left wall of the cavity is kept at 10°C higher than that of the solidification point of water
(273.15 K) and the right wall is held at the solidification temperature. The nanofluid is
maintained at uniform temperature 273.15 K throughout the cavity at t = 0s. Then, the
temperatures of both inclined walls are lowered by an equal amount (10°C).
Consequently, solidification of nanofluid begins at the right wall and the solid-liquid
interface travels towards the left until the complete solidification of the nanofluid within
cavity is calculated. This phenomenon is discussed below.
5.2.7 Selection of nano enhanced phase change materials
This particular study has been divided in two sections. One belongs to the organic PCM
based nano-enhanced phase change material and another is the inorganic PCM based
nano-enhanced phase change material. Paraffin is chosen as organic PCM and water as
inorganic. Cu nanoparticles of 20 nm are chosen as dispersant in both PCMs and their
effects on thermo-physical properties are determined. The data for the thermophysical
properties of the nano enhanced organic PCMs are limited in the literature, so a
preliminary analysis for determining the effect of nanoparticles on the thermal
performance of organic PCM and effect of trapezoidal cavity on the solidification of
paraffin based nanofluid is carried out. Then using the same methodology, a detailed
parametric study is carried out to investigate the effect of various pertinent parameters
such as nanoparticle volume fraction, cold wall temperature, Grashof number, inclined
walls of trapezoidal cavity etc. on the heat transfer mechanism during solidification of
Cu-water nanofluid filled inside a trapezoidal cavity.

124
5.3 Results and discussion
5.3.1 Validation of the numerical model
The results of the Case 1 CFD model are compared with those of an experimental study
of Gau and Viskanta (1986), numerical predictions by Brent et al. (1988) and
Khodadadi and Hosseinizadeh (2007) of the melting of solid gallium in a two-
dimensional rectangular cavity (height, Ly = 6.35 cm; width, Lx = 8.9 cm) in Figure 5.3.
The horizontal walls are adiabatic and vertical walls have different but constant
temperatures. A uniform internal temperature at the melting point of gallium, 302.95 K
is set to the cavity. At t = 0s, the temperature of the left vertical wall is suddenly raised
to a prescribed temperature above the melting point, resulting in the melting of the
gallium. The values of the governing dimensionless numbers and aspect ratio are listed
in Table 5.5. The melt front is plotted at different times, i.e., 2, 6, 10 and 17 minutes, in
Figure 5.3. It is evident from this Figure that a reasonably good agreement exists
between the computed and experimental melt front positions with a small discrepancy
between the measured and calculated results. This discrepancy between the predicted
phase front of the present CFD model and the experimental results may be due to the
sub-cooling of approximately 2 °C in the solid (Gong et al., 1999). In addition, at
specific times, e.g., 2 min, 6 min and 10 min, our results are relatively much closer to
that of the experiment than the numerical prediction of Khodadadi et al. (2007).
Table 5.5 Parameters used in the validation of melting of gallium
AR Aspect ratio 0.714
Ra Rayleigh number 3 × 10⁵
Pr Prandtl number 0.021
Ste Stefan number 0.040
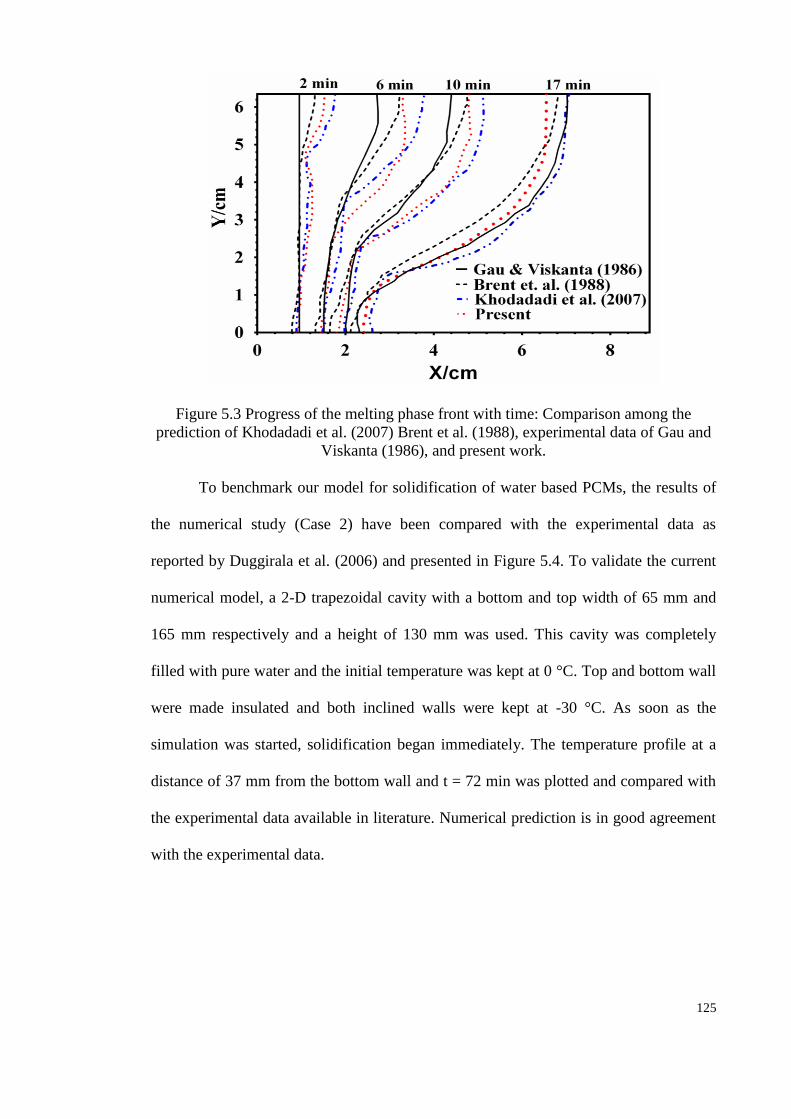
125
Figure 5.3 Progress of the melting phase front with time: Comparison among the
prediction of Khodadadi et al. (2007) Brent et al. (1988), experimental data of Gau and
Viskanta (1986), and present work.
To benchmark our model for solidification of water based PCMs, the results of
the numerical study (Case 2) have been compared with the experimental data as
reported by Duggirala et al. (2006) and presented in Figure 5.4. To validate the current
numerical model, a 2-D trapezoidal cavity with a bottom and top width of 65 mm and
165 mm respectively and a height of 130 mm was used. This cavity was completely
filled with pure water and the initial temperature was kept at 0 °C. Top and bottom wall
were made insulated and both inclined walls were kept at -30 °C. As soon as the
simulation was started, solidification began immediately. The temperature profile at a
distance of 37 mm from the bottom wall and t = 72 min was plotted and compared with
the experimental data available in literature. Numerical prediction is in good agreement
with the experimental data.

126
Figure 5.4 Comparison of the temperature profile at y = 37 mm in the pure water
between the experimental data of Duggirala et al. (2006) and present work.
The results from Case 3-10 CFD models, which are based on a square cavity of
1 cm, have been checked against numerical results reported by Khanafer et al. (2003).
Figure 5.5(a), and 5.5(b) show the U-velocity distribution at the vertical mid plane for
Gr = 104 and 10
5, respectively based on nanoparticle volume fractions of 0, 0.1, and 0.2.
Figure 5.5(c) shows the temperature distribution at the horizontal mid plane of the
differential heated square cavity of height 1 cm filled with nanofluid of nanoparticle
volume fraction 0.2, for Gr = 104 and 10
5. In general, for all of the nanoparticle volume
fractions, the well-established trend of the horizontal velocity is seen exhibiting an
accelerated flow near the top and bottom horizontal walls and a weak flow near the
center of the cavity which shows the nanofluid behaves like a base fluid (water) near the
center. Overall, the CFD results for all nanoparticle volume fractions are close to those
from the literature (Khanafer et al., 2003). In particular, the results for the water (ϕ=0)
for the both Grashof numbers have an excellent agreement. However, small
discrepancies can be seen for ϕ =0.1 and ϕ =0.2 especially at the peaks. Figure 5.5(c)
shows the temperature distribution at the horizontal mid plane for Gr = 104 and 10
5

127
based on nanoparticle volume fraction of 0.2. The temperature distribution of the CFD
models is consistent with that of Khanafer et al. (2003) for both Gr. All of the above
comparisons were used to validate our CFD models.
Figure 5.5 Comparison of the U-velocity along the vertical mid plane of the
cavity between present work and those of Khanafer et al. (2003) for (a) Gr = 104, and
(b) Gr = 105, and (c) comparison of temperature on the mid plane for ϕ = 0.2.
(a)
(b)

128
Figure 5.5 continued…
1
Figure 5.5 Comparison of the U-velocity along the vertical mid plane of the cavity
between present work and those of Khanafer et al. (2003) for (a) Gr = 104, and (b) Gr
= 105, and (c) comparison of temperature on the mid plane for ϕ = 0.2.
Table 5.6 shows the comparison of variation of average Nusselt number (avgNu )
given in Eq. (18) with the Grashof number along the hot wall to validate the present
results with those reported by Khanafer et al. (2003), Ho et al. (2008), and Das and Ohal
(2009) for a square cavity filled with pure water. A good agreement is obtained between
the present and benchmark solutions.
Table 5.6 Comparison of the average Nusselt number for square cavity where Pr = 6.2
(water) for ϕ = 0.0
Literature Grbf = 103 Grbf = 10
4 Grbf = 10
5
Present 1.9377 4.1093 8.2521
Khanafer et al. (2003) 1.9806 4.0653 8.3444
Ho et al. (2008) Not applicable 3.9494 7.8258
Das and Ohal (2009) 2.3097 4.6512 9.3662
(c)

129
5.3.2 Solidification of paraffin-Cu nanoparticles nanofluid filled in trapezoidal
cavity
A nanofluid of liquid paraffin and copper nanoparticles was considered to be filled up in
a trapezoidal cavity and a parametric investigation was carried out to study the effect of
the trapezoidal cavity and Cu nanoparticle concentration on the total solidification time
of the paraffin based nanofluid. The thermo physical properties of paraffin wax and Cu
nanoparticles are given in the Table 5.7. As can be seen in the Table, the solidus and
liquidus temperature of paraffin are different, and this difference defines the phase
transition from solid to liquid state.
Table 5.7 Thermophysical properties of paraffin and Cu nanoparticles
Property Paraffin wax Cu
Density (kg/m3) 5
( − 5)
8954
Specific heat (J/kgK) 2890 383
Thermal conductivity (W/mK) 0.21 if T < Tsolidus
0.12 if T > Tliquidus
400
-
Viscosity (Ns/m2)
(− 5
)
-
Latent heat (J/Kg) 173,400 -
Thermal expansion coefficient (1/K) - 1.67 × 10⁻⁵
Solidus temperature (K) 319 -
Liquidus temperature (K) 321 -

130
5.3.2.1 Effect of trapezoidal cavity of the total solidification time
To study the effect of trapezoidal cavity on the total solidification time of Cu
nanoparticle enhanced paraffin, the three different inclination angle of side walls θ as
discussed in the Section 5.3.1 and temperature difference of 10 K are considered in the
present study and the results of trapezoidal cavity are compared with that of square
cavity and shown in Figure 5.6. This parametric investigation is carried out considering
that the nanofluid has 10% concentration of Cu nanoparticles dispersed into liquid
paraffin. It can be noted that the internal area of these selected cavity geometry is same
i.e. 10 mm2. As can be seen in the Figure that, the total solidification time of the
nanofluid decreases with the increase of angle of the side walls. A total reduction of
22% in the solidification time is observed when the inclination angle is 7.69° compared
to that of square cavity (θ = 0°). This reduction is because of the surface area normal to
the direction of heat transfer increases with increase of θ.
Figure 5.6 Liquid fraction in trapezoidal cavity filled with nanofluid of 10% Cu
nanoparticled

131
5.3.2.2 Effect of nanoparticle volume fraction on the total solidification time of
paraffin based nanofluid
To study the effect of Cu nanoparticle concentration on the solidification time of liquid
paraffin, the nanoparticles were considered to be dispersed in volume fractions of 0%,
10%, and 20%. For the nanofluid with 10% nanoparticles dispersed, the total
solidification time was observed to be 40 % less than that of in case of pure paraffin.
And this solidification time was reduced by 53% in case of 20% nanofluid.
Figure 5.7 Liquid fraction in trapezoidal cavity of θ = 7.69° filled with paraffin and
different concentration of Cu nanoparticles
5.3.3 Solidification of water-Cu nanoparticles nanofluid filled in trapezoidal cavity
This section discusses the heat transfer phenomenon during the solidification of the Cu-
water nanofluid filled in the trapezoidal cavity of different inclination angle of the side
walls. The three different concentrations of Cu nanoparticles 0%, 10%, and 20% are
considered for a detailed parametric investigation to assess the feasibility of such
geometry for PCM containment. The effect of the nanoparticle concentration (ϕ),

132
inclination angle of side walls (θ), and the temperature difference between hot and cold
walls (ΔT) have been investigated. In addition, the average values of the Nusselt
number, Nuave calculated for various values of Grashof number (Grbf), ϕ, and θ along
the hot wall of trapezoidal cavities have been calculated and discussed.
5.3.3.1 Effect of nanoparticle volume fraction on solidification time
The vertical walls of the square cavity were inclined to form a trapezoidal cavity in such
a way that the internal area remains constant for all inclination angles. Solidification
was studied for three different angles, θ = 2.72°, 5.42°, and 7.69°. For θ = 2.72 °, the
reduction in solidification time is almost 8% and then it further increases with
inclination.
The dependency of the solidification time on the dispersed copper nanoparticle
volume fractions (ϕ = 0, 0.1, and 0.2), in the base fluid (H2O) filled in a trapezoidal
cavity of θ = 2.72° is investigated in Cases 11-13 CFD models. Note that, the internal
area (10 mm2) of the trapezoidal cavity is kept equal to the square cavity used by
Khodadadi et al. (2007). The solidification time for Cases 11-13 and those from the
literature are presented in Figure 5.8. The increase of the nanoparticle volume fractions
decreases the solidification time of the nanofluids for all cases. For example, the total
solidification time of the trapezoidal cavity (θ=2.72°) for ϕ=0 and 0.2 are about 2700s
and 1300s, respectively. In general, the last 30% of the fluids needs about a half of the
total solidification time before it completely solidifies and this is true for all cases. A
possible reason for the reduction in solidification time with the dispersion of the solid
nanoparticles is that, when there is a higher heat transfer rate of NEPCM, the crystal
grows rapidly. It may also be due to the fact that less energy per unit mass of nanofluid
is required to solidify it because of the lower latent heat of fusion.

133
Now, compare the trapezoidal cavity with the square cavity. The nanofluid
requires less time to solidify completely in the trapezoidal cavity than in the square
cavity. The solidification time in the trapezoidal cavity of θ = 2.72° filled with pure
water is almost 10% less than that of water filled in a square cavity, while this time is
approximately 5% and 8% less for the trapezoidal cavity of θ = 2.72° filled with
nanoparticle volume fractions of 0.1 and 0.2 respectively. This enhancement of the heat
transfer may be due to a higher surface area normal to the direction of heat transfer in
the trapezoidal cavity than that in the square one. In other words, the length of the side
walls of the trapezoidal cavity is higher than that of the side vertical walls of the square
cavity.
Figure 5.8 Effect of nanoparticle volume fraction on solidification time of nanofluid
within the square and trapezoidal cavity of θ = 2.72°.
5.3.3.2 Effect of inclination angles
Figure 5.9 shows the effect of the inclination angle of the side walls, θ, on the
solidification time for Cases 14-16, which are based on θ = 2.72°, 5.42° and 7.69°, ϕ =
0.2 and the temperature difference of 10 K. For a comparison, the total solidification

134
time of the nanofluid (ϕ = 0.2) under the same temperature difference in a square cavity
is included in the Figure. Note that the internal area of the trapezoidal cavities of these
cases and that of the square cavity were kept constant and equal to 10 mm2. The
solidification time of the nanofluid within the trapezoidal cavities decreases with the
increase of θ. The total solidification time for the trapezoidal cavity of θ = 7.69° filled
with nanofluid (ϕ = 0.2) is approximately 140s (11.3%) less than that for the square
cavity. This may be because of the surface area that is normal to the direction of heat
transfer increases with increase of θ, resulting in the enhanced heat transfer rate.
Figure 5.9 Effects of inclination angles on solidification time of nanofluid within a
trapezoidal cavity at ΔT = 10° C and ϕ = 0.2
The heat transfer phenomenon for solidification consists of both conduction and
convection energy transfer. To understand this phenomenon in the solidification of the
nanofluid, the propagation of the solid-liquid interface for Cases 17, 18 and 19 are
shown in Figure 5.10a, 5.10b and 5.10c, respectively at 10s, 100s, 300s, 600s, 900s and
1200s. In general, the higher the inclination angle of side walls, the quicker the phase
front moves. For example, at 900s, the phase front has reached near the extreme left

135
corner of the cavity for the case of θ =7.69° (Figure 5.10c). However, this is not the
same for the case of θ =2.72° (Figure 5.10a) where the phase front is yet to reach the
left inclined side wall. The Figure also shows the apparent difference in phase velocities
for all inclination angles and the solid-liquid interface is parallel to the cold wall which
means the heat transfer in all these cases is consistently conduction dominated.
Figure 5.10 Solid – liquid interface position at different time during solidification
process for temperature difference of 10°C and ϕ = 0.2. (a) θ = 2.72°
(a)
(b)

136
Figure 5.9 continued…
Figure 5.10 Solid – liquid interface position at different time during solidification
process for temperature difference of 10°C and ϕ = 0.2. (a) θ = 2.72°, (b) θ = 5.42° and
(c) θ = 7.69°.
Velocity vectors at a certain time during the solidification of pure water (ϕ = 0)
are shown in Figure 5.11. Figure 5.11 (a) shows the velocity vectors at 200s for three
inclination angles (θ = 2.72°, 5.42°, and 7.69°). The Figure shows that for a particular
ΔT, the strength of circulation diminishes with increase in θ. This is due to the decrease
in the vertical velocity with increase in θ. Instantaneous velocity vectors during the
solidification of pure water filled in a cavity with θ = 7.69° are presented in Figure 5.11
(b). In the early time step of 50 s, two vortices nearly equal in size formed in the CW
and CCW directions. As the solidification progresses this dual vortex structure persists
but because the solid-liquid interface moves towards the left, both vortices shrink in
covered space and their strength decays.
(c)

137
Figure 5.11 Velocity field for pure water (ϕ = 0), and temperature difference = (a) at t = 200s, (b) for θ = 7.69 °
5.3.3.3 Effects of temperature difference and Grashof number
The variation of the liquid fraction against the solidification time of Cases 20-23, which
are based on ϕ = 0.2 at five different temperature differences, ΔT = 10°, 20°, 30°, 55°
and 110° in the trapezoidal cavity with inclination angle, θ = 2.72o is shown in Figure
5.12. The increasing temperature difference consistently decreases the solidification
time. Similar to the low temperature difference, the phase front moves parallel to the
(a)
Solid-liquid
θ = 2.72° θ = 5.42° θ = 7.69
(b)
50s 600s 1500s

138
cold wall for a large temperature difference of 110 °C as well, which signifies that
conduction still dominates the heat transfer phenomenon as shown in Figure 5.13.
Figure 5.12 Effect of temperature difference on the solidification of nanofluid of
nanoparticle volume fraction 0.2 inside cavity of θ = 2.72°.
Figure 5.13 Effect of temperature difference on the solid-liquid interface at 100s during
solidification of nanofluid of nanoparticle volume fraction 0.2 inside cavity of θ =
2.72°.
(b)

139
To study the effect of natural convection on heat transfer, the Gr is varied from
105 to 10
7 (Cases 24-26) and the results are shown in Figure 5.14. The Figure shows the
solid-liquid interface at two different times (100s and 300s) during solidification for all
three Grashof numbers. For Gr≤105 the solid-liquid interface is almost parallel to the
cold wall and moves towards hot wall with uniform velocity until complete
solidification from which conduction dominated heat flow can be inferred. As the Gr
increases (106, and 10
7), buoyancy force increases within the liquid which causes the
interface to deflect and rapid solidification appears in the lower half of the cavity
compared to the upper half which indicates the natural convection dominated heat flow.
Figure 5.14 Solid – liquid interface position for ϕ = 0.2 and θ = 2.72° at (a) 100s, and
(b) 300s.
5.3.3.4 Effect of Grashof number on Nusselt number
Figure 5.15 shows the variation of the average Nusselt number along the hot wall for
Cases 27 - 62 where the Grashof number (Gr) is varied from 103 to 10
5, cavity
inclination angles (θ) from 0o to 7.69
o and nanoparticle volume fractions (ϕ) from 0 to
0.2. Pr = 6.2 are used in all these cases. The Nusselt number depends strongly on the
inclination angle and it increases with the increasing angle. In general, the Nusselt
number increases with an increase of the nanoparticle volume fractions and this occurs

140
for all Grashof numbers because the thermal conductivity of the nanofluid enhances
with the void fraction. For low Grashof numbers (<103
and 104), the increase in the
Nusselt number versus the angles is small because of the dominant conductive heat
transfer but as we increase the Grashof number (≥ 105), the buoyancy-driven heat
transfer dominates and a higher difference in Nusselt number versus the angle can be
seen. It should be noted that the trend in the Figure for the average Nusselt number
along the hot wall against the inclination angle would be downward if the Nusselt
number is based on the effective thermal conductivity .
Figure 5.15 Effect of Grashof number, nanoparticle volume fraction and inclination
angle on average Nusselt number for Pr = 6.2.
141
5.4 Summary
The solidification process of the nano-enhanced organic and inorganic phase change
materials in the isosceles trapezoidal cavities has been studied using CFD. Various
nanoparticle volume concentrations, inclination angles, and Grashof numbers have been
considered to study their effect on the heat transfer. This study has the following
conclusions:
The heat transfer performance of NEPCM is significantly enhanced with the use
of a trapezoidal cavity when compared to a square cavity having the same
internal area.
For the temperature difference of 10° C, and a small inclination angle (2.72°) in
the side walls of square cavity decreases the solidification time of nanofluid of
20% nanoparticle volume fraction by approximately 7% while increasing the
inclination angle to 5.42° and 7.69°, it reduces by 11% and 11.5% respectively.
In short, the solidification time reduces with an increase of the inclination angle.
NEPCM as used in the current study shows great ability to store/release the
thermal energy in comparison to conventional PCMs. Increasing nanoparticle
volume fraction decreases the solidification time.
The heat transfer rate greatly depends upon the temperature difference and
increasing temperature difference increases the heat transfer rate for all values of
nanoparticle volume fractions and inclination angles but, the mode of heat
transfer remains conduction.
The mode of heat transfer depends on the value of the Grashof number. For low
values of Gr (≤ 105), conduction is the main heat transfer mechanism while for
higher values of Gr (> 105), heat transfer takes place majorly by convection.

142
CHAPTER 6: CONCLUSIONS AND FUTURE WORKS
6.1 Conclusions
The performance of four organic phase change materials during an accelerated thermal
cycle test was investigated experimentally to assess their thermal energy storage
capabilities. The changes in their thermal properties during the cycle test were
monitored using the differential scanning calorimeter (DSC) and the changes in the
compositional/functional group were studied using the Fourier transformation and
infrared spectrometer (FT-IR). The results of this study and understating obtained from
the literature review were used to prepare a novel nano-enhanced composite of an
organic PCM and nano titanium dioxide (TiO2) of various mass fractions. In addition, a
novel geometry was also proposed for containing the PCMs for practical use. The
output of this research can be summarized as follows:
The results of the accelerated thermal cycle test of paraffin, palmitic acid,
myristic acid, and polyethylene glycol (PEG 6000) show that the organic PCMs are
more stable than inorganic PCMs when they undergo a large number of melt/freeze
cycles. In this study, a new organic PCM viz. polyethylene glycol (PEG) of molecular
weight 6000 was also tested for a 1500 melt/freeze cycles and the variations in thermal
and chemical properties were monitored. The results show that PEG 6000 is a potential
candidate for low temperature solar thermal energy storage applications. The variations
in the thermal properties of all four PCMs were not very much significant and this
makes them highly suitable for many industrial and domestic energy storage devices.
Also, the FT-IR results show that these PCMs do not lose their compositional/functional
group for the 1500 thermal cycle test, which makes them chemically stable for long
term use.

143
Dispersion of nanoparticles in the base PCM is a well-established way to
enhance the thermal conductivity of organic PCMs. Nano particles of titanium dioxide
(TiO2) were dispersed in liquid palmitic acid (PA) in various mass fractions and the
thermal properties of these composites were measured. It was observed that the thermal
conductivity of palmitic acid increases with the increase in the mass fraction of
nanoparticles at the slight expense of the latent heat of fusion. It was also observed that
the addition of nano TiO2 makes PA more stable thermally and chemically in
comparison to the base PA. The XRD and FESEM images show the uniform dispersion
and FT-IR spectra of composite PCMs exhibit the chemical compatibility of PA and
nano TiO2. The accelerated thermal cycle test of the nano enhanced organic PCM
reveals the thermal reliability of the composite, which show the potential of energy
storage capacity of these materials.
A novel trapezoidal geometry for encapsulation of organic/inorganic PCMs was
also proposed and a detailed parametric study was carried out numerically using the
CFD technique. The effect of the geometry aspect ratio in terms of the inclination angle
of the geometry wall, cold wall temperature, nanoparticle mass fraction, Grashof
number, etc. were investigated and discussed. The results of this study revealed that the
geometry shape plays a very important role in improving the heat transfer process
during the solidification/melting of PCMs. Trapezoidal geometry has shown the
expedited heat transfer process which resulted in a reduced solidification time of the
PCM. Grashof number was found to be an important factor for deciding the conduction
and/or convection driven heat transfer process. This particular geometry can be very
much suitable for solar water heating systems and mold casting processes.

144
6.2 Future works
This study mainly concentrated on the investigation of the thermal energy storage
properties of organic and nano enhanced organic phase change materials. An
accelerated thermal cycle test of paraffin, fatty acid and poly ethylene glycol was
conducted and their thermal and chemical properties were investigated during the cycle
test. This study can be extended by testing these materials for a longer number of
thermal cycles. Glycols are the potential thermal energy storage materials, so new
glycols and their eutectics can be tested for a large number thermal cycles in the future.
Another potential concept which can be investigated in the future is the use of a
mixture of different nanoparticles as a dispersant for enhancing the thermal conductivity
of organic PCMs. The major issue with nano composite PCMs is the leakage when they
are in the liquid state. To avoid this issue, they need to be encapsulated properly to be
prepared in form stable phase change materials which can also be investigated in the
future. TiO2 of micro size and other metal or metal oxides of micro size can be used to
prepare form stable materials. Form stable phase change materials provide as advantage
of not being encapsulated and avoid the requirement of encapsulation materials.
The shape of the container for holding the PCMs plays an important role as well.
A careful selection of enclosure geometry can affect the heat transfer process in PCMs
significantly. A trapezoidal shape for containing the PCMs has been investigated
numerically in this study, which can further be extended for other irregular geometry
too. A trapezoidal cavity with inbuilt fins inside can also be investigated as fins are able
to enhance the heat transfer rate greatly. The numerical study of the
solidification/melting phenomenon can be made more realistic by considering variable
thermal properties of PCMs.

145
REFERENCES
13.0., ANSYS Fluent. (2011). User's Guide. ANSYS Inc., USA.
Abdollahzadeh, Jamalabadi MY, & Park, Jae Hyun. (2014). Effects of Brownian motion
on freezing of PCM containing nanoparticles. Thermal Science(00), 94-94.
Abhat, A. (1983). Low temperature latent heat thermal energy storage: Heat storage
materials. Solar Energy, 30(4), 313-332.
Abhat., A., Heine., D., Heinisch., M., Malatidis., A.N., & Neuer., G. (1981).
Development of a modular heat exchanger with integrated latent heat energy
store Report no. BMFT FBT 81-050. Institut fuer Kemtechnik und
Energiewandlung e.V., Stuttgart, Germany,.
Agyenim, Francis, Hewitt, Neil, Eames, Philip, & Smyth, Mervyn. (2010). A review of
materials, heat transfer and phase change problem formulation for latent heat
thermal energy storage systems (LHTESS). Renewable and Sustainable Energy
Reviews, 14(2), 615-628.
Ahmad, Maha, Bontemps, André, Sallée, Hébert, & Quenard, Daniel. (2006).
Experimental investigation and computer simulation of thermal behaviour of
wallboards containing a phase change material. Energy and Buildings, 38(4),
357-366.
Al-Hinti, I., Al-Ghandoor, A., Maaly, A., Abu Naqeera, I., Al-Khateeb, Z., & Al-
Sheikh, O. (2010). Experimental investigation on the use of water-phase change
material storage in conventional solar water heating systems. Energy Conversion
and Management, 51(8), 1735-1740.
Ali Memon, Shazim, Yiu Lo, Tommy, Shi, Xian, Barbhuiya, Salim, & Cui, Hongzhi.
(2013). Preparation, characterization and thermal properties of Lauryl
alcohol/Kaolin as novel form-stable composite phase change material for
thermal energy storage in buildings. Applied Thermal Engineering, 59(1–2),
336-347.
Alkan, Cemil. (2006). Enthalpy of melting and solidification of sulfonated paraffins as
phase change materials for thermal energy storage. Thermochimica Acta, 451(1–
2), 126-130.
Alkan, Cemil, Sarı, Ahmet, Karaipekli, Ali, & Uzun, Orhan. (2009). Preparation,
characterization, and thermal properties of microencapsulated phase change
material for thermal energy storage. Solar Energy Materials and Solar Cells,
93(1), 143-147.
Alkilani, Mahmud M., Sopian, K., Alghoul, M. A., Sohif, M., & Ruslan, M. H. (2011).
Review of solar air collectors with thermal storage units. Renewable and
Sustainable Energy Reviews, 15(3), 1476-1490.

146
Amin, NAM, Bruno, Frank, & Belusko, Martin. (2014). Effective thermal conductivity
for melting in PCM encapsulated in a sphere. Applied Energy, 122, 280-287.
Amiri, A., & Vafai, K. (1994). Analysis of dispersion effects and non-thermal
equilibrium, non-Darcian, variable porosity incompressible flow through porous
media. International Journal of Heat and Mass Transfer, 37(6), 939-954.
Arasu, A. Valan, & Mujumdar, Arun S. (2012). Numerical study on melting of paraffin
wax with Al2O3 in a square enclosure. International Communications in Heat
and Mass Transfer, 39(1), 8-16.
Arico, Antonino Salvatore, Bruce, Peter, Scrosati, Bruno, Tarascon, Jean-Marie, & Van
Schalkwijk, Walter. (2005). Nanostructured materials for advanced energy
conversion and storage devices. Nature materials, 4(5), 366-377.
Assis, E., Katsman, L., Ziskind, G., & Letan, R. (2007). Numerical and experimental
study of melting in a spherical shell. International Journal of Heat and Mass
Transfer, 50(9–10), 1790-1804.
Athienitis, A. K., & Chen, Y. (2000). The effect of solar radiation on dynamic thermal
performance of floor heating systems. Solar Energy, 69(3), 229-237.
Athienitis, A. K., Liu, C., Hawes, D., Banu, D., & Feldman, D. (1997). Investigation of
the thermal performance of a passive solar test-room with wall latent heat
storage. Building and Environment, 32(5), 405-410.
Atkinson, C. M. L., Larkin, J. A., & Richardson, M. J. (1969). Enthalpy changes in
molten n-alkanes and polyethylene. The Journal of Chemical Thermodynamics,
1(5), 435-440.
Babapoor, Aziz, & Karimi, Gholamreza. (2015). Thermal properties measurement and
heat storage analysis of paraffinnanoparticles composites phase change material:
Comparison and optimization. Applied Thermal Engineering, 90, 945-951.
Bal, Lalit M., Satya, Santosh, & Naik, S. N. (2010). Solar dryer with thermal energy
storage systems for drying agricultural food products: A review. Renewable and
Sustainable Energy Reviews, 14(8), 2298-2314.
Bal, Lalit M., Satya, Santosh, Naik, S. N., & Meda, Venkatesh. (2011). Review of solar
dryers with latent heat storage systems for agricultural products. Renewable and
Sustainable Energy Reviews, 15(1), 876-880.
Bansal, N. K., & Buddhi, D. (1992). An analytical study of a latent heat storage system
in a cylinder. Energy Conversion and Management, 33(4), 235-242.
Barry, Edward J. (1940). Solar water heater: US Patent 2,213,894.
Biswas, Kaushik, Lu, Jue, Soroushian, Parviz, & Shrestha, Som. (2014). Combined
experimental and numerical evaluation of a prototype nano-PCM enhanced
wallboard. Applied Energy(0).
147
Bouadila, Salwa, Fteïti, Mehdi, Oueslati, Mohamed Mehdi, Guizani, Amenallah, &
Farhat, Abdelhamid. (2014). Enhancement of latent heat storage in a rectangular
cavity: Solar water heater case study. Energy Conversion and Management,
78(0), 904-912.
Brent, A. D., Voller, V. R., & Reid, K. J. (1988). Enthalpy-porosity technique for
modeling convection-diffusion phase change: application to the melting of a
pure metal
Numerical Heat Transfer, 13(3), 297-318.
Brinkman, H.C. (1952). The Viscosity of concentrated suspensions and solutions the
viscosity of concentrated suspensions and solutions. J. Chem. Phys., 20, 571-
581.
Buddhi, D, Sawhney, RL, Sehgal, PN, & Bansal, NK. (1987). A simplification of the
differential thermal analysis method to determine the latent heat of fusion of
phase change materials. Journal of Physics D: Applied Physics, 20(12), 1601.
Buddhi., D., & Sawhney., R.L. (1994). In: Proceedings of thermal energy storage and
energy conversion;.
Burchill, S. (1983). Smectite-polymer interactions in aqueous systems. Clay Minerals,
18(4), 373-397.
Butler, JL, & Troeger, JM. (1981). Drying peanuts using solar energy stored in a rock
bed.
Cabeza, L. F., Castell, A., Barreneche, C., de Gracia, A., & Fernández, A. I. (2011).
Materials used as PCM in thermal energy storage in buildings: A review.
Renewable and Sustainable Energy Reviews, 15(3), 1675-1695.
Cabeza, L. F., Mehling, H., Hiebler, S., & Ziegler, F. (2002). Heat transfer enhancement
in water when used as PCM in thermal energy storage. Applied Thermal
Engineering, 22(10), 1141-1151.
Chaabane, Monia, Mhiri, Hatem, & Bournot, Philippe. (2014). Thermal performance of
an integrated collector storage solar water heater (ICSSWH) with phase change
materials (PCM). Energy Conversion and Management, 78(0), 897-903.
Chandrasekar, M., Suresh, S., & Chandra Bose, A. (2010). Experimental investigations
and theoretical determination of thermal conductivity and viscosity of
Al2O3/water nanofluid. Experimental Thermal and Fluid Science, 34(2), 210-
216.
Chandrasekaran, P., Cheralathan, M., Kumaresan, V., & Velraj, R. (2014). Enhanced
heat transfer characteristics of water based copper oxide nanofluid PCM (phase
change material) in a spherical capsule during solidification for energy efficient
cool thermal storage system. Energy(0).

148
Charvát, Pavel, Klimeš, Lubomír, & Ostrý, Milan. (2014). Numerical and experimental
investigation of a PCM-based thermal storage unit for solar air systems. Energy
and Buildings, 68, Part A(0), 488-497.
Chen, Changzhong, Wang, Linge, & Huang, Yong. (2011). Electrospun phase change
fibers based on polyethylene glycol/cellulose acetate blends. Applied Energy,
88(9), 3133-3139.
Chen, Yin-Ju, Nguyen, Duc-Dung, Shen, Ming-Yuan, Yip, Ming-Chuen, & Tai, Nyan-
Hwa. (2013). Thermal characterizations of the graphite nanosheets reinforced
paraffin phase-change composites. Composites Part A: Applied Science and
Manufacturing, 44, 40-46.
Chihara, Shoichi, Isaki, Tsutomu, Kakiuchi, Hiroyuki, & Yamazaki, Masanori. (1998).
Heat storage material composition: Google Patents.
Cho, Jeong-Sook, Kwon, Aehwa, & Cho, Chang-Gi. (2002). Microencapsulation of
octadecane as a phase-change material by interfacial polymerization in an
emulsion system. Colloid and Polymer Science, 280(3), 260-266.
Choi, Da Hee, Lee, Juhyuk, Hong, Hiki, & Kang, Yong Tae. (2014). Thermal
conductivity and heat transfer performance enhancement of phase change
materials (PCM) containing carbon additives for heat storage application.
International Journal of Refrigeration, 42, 112-120.
Choi, J. K., Lee, J. G., Kim, J. H., & Yang, H. S. (2001). Preparation of microcapsules
containing phase change materials as heat transfer media by in-situ
polymerization. Journal of Industrial and Engineering Chemistry, 7(6), 358-
362.
Choi, S.U.S., & Eastman, J.A. (1995). Enhancing thermal conductivity of fluids with
nanoparticles.
Constantinescu, M., Dumitrache, L., Constantinescu, D., Anghel, E. M., Popa, V. T.,
Stoica, A., & Olteanu, M. (2010). Latent heat nano composite building
materials. European Polymer Journal, 46(12), 2247-2254.
Cui, Yanbin, Liu, Caihong, Hu, Shan, & Yu, Xun. (2011). The experimental exploration
of carbon nanofiber and carbon nanotube additives on thermal behavior of phase
change materials. Solar Energy Materials and Solar Cells, 95(4), 1208-1212.
D.V. Hale, M.J. Hoover, & O'Niell, M.J. (1971). Phase Change Materials Hand-book.
AL: NASA CR-61363, Marshal Space Flight Center.
Das, M.K., & Ohal, P.S. (2009). Natural convection heat transfer augmentation in a
partially heated and partially cooled square cavity utilizing nanofluids,.
International Journal of Numerical Methods for Heat & Fluid Flow, 19(3/4),
411-311.

149
Das, S.K, Choi, S.U.S, Yu, W, & Pradeep, R. (2008). Nanofluids: Science and
Technology, . Hoboken, NJ.
Delgado, Mónica, Lázaro, Ana, Mazo, Javier, & Zalba, Belén. (2012). Review on phase
change material emulsions and microencapsulated phase change material
slurries: Materials, heat transfer studies and applications. Renewable and
Sustainable Energy Reviews, 16(1), 253-273.
Demirbas, M. Fatih. (2006). Thermal Energy Storage and Phase Change Materials: An
Overview. Energy Sources, Part B: Economics, Planning, and Policy, 1(1), 85-
95.
Desgrosseilliers, Louis, Whitman, Catherine A., Groulx, Dominic, & White, Mary
Anne. (2013). Dodecanoic acid as a promising phase-change material for
thermal energy storage. Applied Thermal Engineering, 53(1), 37-41.
Dimaano, Maria Natalia R., & Watanabe, Takayuki. (2002). The capric–lauric acid and
pentadecane combination as phase change material for cooling applications.
Applied Thermal Engineering, 22(4), 365-377.
Dincer, I., & Rosen, M.A. (2002). Thermal energy storage, Systems and Aplications.
Chichester (England): John Wiley & Sons.
Duggirala, R. K., Lin, C. X., & Ghenai, C. (2006). Investigation of double-diffusive
convection during the solidification of a binary mixture (NH4Cl–H2O) in a
trapezoidal cavity. Experiments in Fluids, 40(6), 918-927.
Durupt, N., Aoulmi, A., Bouroukba, M., & Rogalski, M. (1995). Heat capacities of
liquid polycyclic aromatic hydrocarbons. Thermochimica Acta, 260(0), 87-94.
Dutil, Yvan, Rousse, Daniel R., Salah, Nizar Ben, Lassue, Stéphane, & Zalewski,
Laurent. (2011). A review on phase-change materials: Mathematical modeling
and simulations. Renewable and Sustainable Energy Reviews, 15(1), 112-130.
Elefsiniotis, A, Becker, Th, & Schmid, U. (2014). Thermoelectric Energy Harvesting
Using Phase Change Materials (PCMs) in High Temperature Environments in
Aircraft. Journal of Electronic Materials, 43(6), 1809-1814.
Elsayed, Moustafa M, Taha, Ibrahim S, & Sabbagh, Jaffar A. (1994). Design of solar
thermal systems: Scientific Publishing Center, King Abdulaziz University.
Enibe, S. O. (2002). Performance of a natural circulation solar air heating system with
phase change material energy storage. Renewable Energy, 27(1), 69-86.
Enibe, S. O. (2003). Thermal analysis of a natural circulation solar air heater with phase
change material energy storage. Renewable Energy, 28(14), 2269-2299.
Entrop, A. G., Brouwers, H. J. H., & Reinders, A. H. M. E. (2011). Experimental
research on the use of micro-encapsulated Phase Change Materials to store solar

150
energy in concrete floors and to save energy in Dutch houses. Solar Energy,
85(5), 1007-1020.
Ettouney, Hisham, El-Dessouky, Hisham, & Al-Ali, Amani. (2005). Heat transfer
during phase change of paraffin wax stored in spherical shells. Journal of solar
energy engineering, 127(3), 357-365.
Faghri, Amir, & Zhang, Tuwen. (2006). Transport phenomena in multiphase systems.
London, UK: Elsevier Inc.
Fan, Li-Wu, Fang, Xin, Wang, Xiao, Zeng, Yi, Xiao, Yu-Qi, Yu, Zi-Tao, . . . Cen, Ke-
Fa. (2013). Effects of various carbon nanofillers on the thermal conductivity and
energy storage properties of paraffin-based nanocomposite phase change
materials. Applied Energy, 110(0), 163-172.
Fan, Li. Wu, Zhu, Zi. Qin, Zeng, Yi, Xiao, Yu. Qi, Liu, Xue. Ling, Wu, Yu. Yue, . . .
Cen, Ke. Fa. (2015). Transient performance of a PCM-based heat sink with high
aspect-ratio carbon nanofillers. Applied Thermal Engineering, 75, 532-540.
Fan, Liwu, & Khodadadi, J. M. (2011). Thermal conductivity enhancement of phase
change materials for thermal energy storage: A review. Renewable and
Sustainable Energy Reviews, 15(1), 24-46.
Fang, Xin, Fan, Li-Wu, Ding, Qing, Wang, Xiao, Yao, Xiao-Li, Hou, Jian-Feng, . . .
Cen, Ke-Fa. (2013). Increased thermal conductivity of eicosane-based composite
phase change materials in the presence of graphene nanoplatelets. Energy &
Fuels, 27(7), 4041-4047.
Farid, Mohammed M., Khudhair, Amar M., Razack, Siddique Ali K., & Al-Hallaj, Said.
(2004). A review on phase change energy storage: materials and applications.
Energy Conversion and Management, 45(9–10), 1597-1615.
Farrell, Anthony J., Norton, Brian, & Kennedy, David M. (2006). Corrosive effects of
salt hydrate phase change materials used with aluminium and copper. Journal of
Materials Processing Technology, 175(1–3), 198-205.
Fath, Hassan ES. (1995). Thermal performance of a simple design solar air heater with
built-in thermal energy storage system. Energy Conversion and Management,
36(10), 989-997.
Fauzi, Hadi, Metselaar, Hendrik S. C., Mahlia, T. M. I., Silakhori, Mahyar, & Nur,
Hadi. (2013). Phase change material: Optimizing the thermal properties and
thermal conductivity of myristic acid/palmitic acid eutectic mixture with acid-
based surfactants. Applied Thermal Engineering, 60(1–2), 261-265.
Fazilati, Mohammad Ali, & Alemrajabi, Ali Akbar. (2013). Phase change material for
enhancing solar water heater, an experimental approach. Energy Conversion and
Management, 71(0), 138-145.

151
Feldman, D., Banu, D., & Hawes, D. (1995a). Low chain esters of stearic acid as phase
change materials for thermal energy storage in buildings. Solar Energy
Materials and Solar Cells, 36(3), 311-322.
Feldman, D., Banu, D., Hawes, D., & Ghanbari, E. (1991). Obtaining an energy storing
building material by direct incorporation of an organic phase change material in
gypsum wallboard. Solar Energy Materials, 22(2–3), 231-242.
Feldman, D., Banu, D., & Hawes, D. W. (1995b). Development and application of
organic phase change mixtures in thermal storage gypsum wallboard. Solar
Energy Materials and Solar Cells, 36(2), 147-157.
Feldman, D., Shapiro, M. M., Banu, D., & Fuks, C. J. (1989). Fatty acids and their
mixtures as phase-change materials for thermal energy storage. Solar Energy
Materials, 18(3–4), 201-216.
Feng, Li Li, Tong, Jing Jing, & Wang, Chong Yun. (2013). Preparation and Thermal
Propertites of Polyethylene Glycol/Silica Hollow Nanospheres Composite as
Shape-Stabilized Phase Change Materials. Advanced Materials Research, 773,
534-537.
Finke, H. L., Gross, M. E., Waddington, Guy, & Huffman, H. M. (1954). Low-
temperature Thermal Data for the Nine Normal Paraffin Hydrocarbons from
Octane to Hexadecane. Journal of the American Chemical Society, 76(2), 333-
341.
Flejtuch, Kinga. (2004). Badanie przemian fazowych wybranych układów polieterów
pod kątem akumulacji energii cieplnej.
Fukai, Jun, Hamada, Yuichi, Morozumi, Yoshio, & Miyatake, Osamu. (2002). Effect of
carbon-fiber brushes on conductive heat transfer in phase change materials.
International Journal of Heat and Mass Transfer, 45(24), 4781-4792.
Fukai, Jun, Kanou, Makoto, Kodama, Yoshikazu, & Miyatake, Osamu. (2000). Thermal
conductivity enhancement of energy storage media using carbon fibers. Energy
Conversion and Management, 41(14), 1543-1556.
Gau, C., & Viskanta, R. (1986). Melting and Solidification of a Pure Metal on a Vertical
Wall. Journal of Heat Transfer, 108(1), 174-181.
George, A. (1989). Handbook of thermal design: McGraw Hill Book Co.
Goli, Pradyumna, Legedza, Stanislav, Dhar, Aditya, Salgado, Ruben, Renteria,
Jacqueline, & Balandin, Alexander A. (2014). Graphene-enhanced hybrid phase
change materials for thermal management of Li-ion batteries. Journal of Power
Sources, 248, 37-43.
Gong, Zhen-Xiang, Devahastin, Sakamon, & Mujumdar, Arun S. (1999). Enhanced heat
transfer in free convection-dominated melting in a rectangular cavity with an
isothermal vertical wall. Applied Thermal Engineering, 19(12), 1237-1251.

152
Harikrishnan, S., Deenadhayalan, M., & Kalaiselvam, S. (2014). Experimental
investigation of solidification and melting characteristics of composite PCMs for
building heating application. Energy Conversion and Management, 86, 864-872.
Harikrishnan, S., Magesh, S., & Kalaiselvam, S. (2013). Preparation and thermal energy
storage behaviour of stearic acid–TiO2 nanofluids as a phase change material for
solar heating systems. Thermochimica Acta, 565, 137-145.
Hasan, A., & Sayigh, A. A. (1994). Some fatty acids as phase-change thermal energy
storage materials. Renewable Energy, 4(1), 69-76.
Hasnain, S. M. (1998). Review on sustainable thermal energy storage technologies, Part
I: heat storage materials and techniques. Energy Conversion and Management,
39(11), 1127-1138.
Hasnain, S.M. (1990). Latent heat thermal energy storage for solar heating applications.
PhD Thesis. University of Leeds.
Hawes, D. W., Feldman, D., & Banu, D. (1993). Latent heat storage in building
materials. Energy and Buildings, 20(1), 77-86.
Hawes, DW, Banu, D, & Feldman, D. (1992). The stability of phase change materials in
concrete. Solar energy materials and solar cells, 27(2), 103-118.
Himran, Syukri, Suwono, Aryadi, & Mansoori, G. Ali. (1994). Characterization of
Alkanes and Paraffin Waxes for Application as Phase Change Energy Storage
Medium. Energy Sources, 16(1), 117-128.
Ho, C. J., Chen, M. W., & Li, Z. W. (2008). Numerical simulation of natural convection
of nanofluid in a square enclosure: Effects due to uncertainties of viscosity and
thermal conductivity. International Journal of Heat and Mass Transfer, 51(17–
18), 4506-4516.
Ho, Ching Jenq, & Gao, JY. (2009). Preparation and thermophysical properties of
nanoparticle-in-paraffin emulsion as phase change material. International
Communications in Heat and Mass Transfer, 36(5), 467-470.
Hong, Hiki, Kim, Sun Kuk, & Kim, Yong-Shik. (2004). Accuracy improvement of T-
history method for measuring heat of fusion of various materials. International
Journal of Refrigeration, 27(4), 360-366.
Hormansdorfer, Gerd. (1989). Latent heat storage material and use thereof: Google
Patents.
Hosseinizadeh, S. F., Darzi, A. A. Rabienataj, & Tan, F. L. (2012). Numerical
investigations of unconstrained melting of nano-enhanced phase change material
(NEPCM) inside a spherical container. International Journal of Thermal
Sciences, 51(0), 77-83.

153
HP Garg, SC Mullick, & Bhargava, AK. (1985). Solar thermal energy storage:
Dordrecht: Reidel Publishing Company.
Hwang, Yi-Jeong, Lee, Young-Ho, Oh, Chul, Jun, Young-Doo, & Oh, Seong-Geun.
(2006). Preparation and characterization of PEG-grafted silica particles using
emulsion. Journal of Industrial and Engineering Chemistry, 12(3), 380-386.
Ip, KCW., & Gates, JR. (2000). Thermal storage for sustainable dwellings. Maastricht,
The Netherlands.
Ismail, K. A. R., Alves, C. L. F., & Modesto, M. S. (2001). Numerical and experimental
study on the solidification of PCM around a vertical axially finned isothermal
cylinder. Applied Thermal Engineering, 21(1), 53-77.
Jegadheeswaran, S., & Pohekar, Sanjay D. (2009). Performance enhancement in latent
heat thermal storage system: A review. Renewable and Sustainable Energy
Reviews, 13(9), 2225-2244.
Jeon, Jisoo, Lee, Jung-Hun, Seo, Jungki, Jeong, Su-Gwang, & Kim, Sumin. (2013).
Application of PCM thermal energy storage system to reduce building energy
consumption. Journal of Thermal Analysis and Calorimetry, 111(1), 279-288.
Jesumathy, Stella, Udayakumar, M, & Suresh, S. (2012). Experimental study of
enhanced heat transfer by addition of CuO nanoparticle. Heat and Mass
Transfer, 48(6), 965-978.
Jiang, Yanjiao, Hussain, Hazrat, & Kressler, Joerg. (2014). Poly (vinyl alcohol) Cryogel
Formation Using Biocompatible Ice Nucleating Agents. Macromolecular
Materials and Engineering.
Jiao, Changmei, Ji, Baohua, & Fang, Dong. (2012). Preparation and properties of lauric
acid–stearic acid/expanded perlite composite as phase change materials for
thermal energy storage. Materials Letters, 67(1), 352-354.
Jurinak, J. J., & Abdel-Khalik, S. I. (1978). Properties optimization for phase-change
energy storage in air-based solar heating systems. Solar Energy, 21(5), 377-383.
Jurinak, J. J., & Abdel-Khalik, S. I. (1979a). On the performance of air-based solar
heating systems utilizing phase-change energy storage. Energy, 4(4), 503-522.
Jurinak, J. J., & Abdel-Khalik, S. I. (1979b). Sizing phase-change energy storage units
for air-based solar heating systems. Solar Energy, 22(4), 355-359.
Kaizawa, Akihide, Maruoka, Nobuhiro, Kawai, Atsushi, Kamano, Hiroomi, Jozuka,
Tetsuji, Senda, Takeshi, & Akiyama, Tomohiro. (2008). Thermophysical and
heat transfer properties of phase change material candidate for waste heat
transportation system. Heat and Mass Transfer, 44(7), 763-769.
Kakiuchi, H, Yamazaki, M, Yabe, M, Chihara, S, Terunuma, T, Sakata, Y, & Usami, T.
(1998). A study of erythritol as phase change material. IEA Annex, 10, 11-13.

154
Kannan, Ruben Y, Salacinski, Henryk J, Butler, Peter E, & Seifalian, Alexander M.
(2005). Polyhedral oligomeric silsesquioxane nanocomposites: the next
generation material for biomedical applications. Accounts of chemical research,
38(11), 879-884.
Karaıpeklı, A., Sarı, A., & Kaygusuz, K. (2009). Thermal Properties and Thermal
Reliability of Capric Acid/Stearic Acid Mixture for Latent Heat Thermal Energy
Storage. Energy Sources, Part A: Recovery, Utilization, and Environmental
Effects, 31(3), 199-207.
Karaipekli, Ali, & Sarı, Ahmet. (2010). Preparation, thermal properties and thermal
reliability of eutectic mixtures of fatty acids/expanded vermiculite as novel
form-stable composites for energy storage. Journal of Industrial and
Engineering Chemistry, 16(5), 767-773.
Karthikeyan, S., Ravikumar Solomon, G., Kumaresan, V., & Velraj, R. (2014).
Parametric studies on packed bed storage unit filled with PCM encapsulated
spherical containers for low temperature solar air heating applications. Energy
Conversion and Management, 78(0), 74-80.
Kaygusuz, Kamıl. (2000). Experimental and theoretical investigation of a solar heating
system with heat pump. Renewable Energy, 21(1), 79-102.
Ke, Huizhen, Li, Dawei, Zhang, Huidan, Wang, Xiaoling, Cai, Yibing, Huang, Fenglin,
& Wei, Qufu. (2013). Electrospun form-stable phase change composite
nanofibers consisting of capric acid-based binary fatty acid eutectics and
polyethylene terephthalate. Fibers and Polymers, 14(1), 89-99.
Kenisarin, Murat M. (2010). High-temperature phase change materials for thermal
energy storage. Renewable and Sustainable Energy Reviews, 14(3), 955-970.
Kenisarin, Murat, & Mahkamov, Khamid. (2007). Solar energy storage using phase
change materials. Renewable and Sustainable Energy Reviews, 11(9), 1913-
1965.
Kenisarin, Murat, & Mahkamov, Khamid. (2016). Salt hydrates as latent heat storage
materials:Thermophysical properties and costs. Solar Energy Materials and
Solar Cells, 145, Part 3, 255-286.
Khalifa, Abdul Jabbar N., Suffer, Kadhim H., & Mahmoud, Mahmoud Sh. (2013). A
storage domestic solar hot water system with a back layer of phase change
material. Experimental Thermal and Fluid Science, 44(0), 174-181.
Khanafer, Khalil, Vafai, Kambiz, & Lightstone, Marilyn. (2003). Buoyancy-driven heat
transfer enhancement in a two-dimensional enclosure utilizing nanofluids.
International Journal of Heat and Mass Transfer, 46(19), 3639-3653.
Khateeb, Siddique A., Farid, Mohammed M., Selman, J. Robert, & Al-Hallaj, Said.
(2004). Design and simulation of a lithium-ion battery with a phase change

155
material thermal management system for an electric scooter. Journal of Power
Sources, 128(2), 292-307.
Khodadadi, J. M., & Hosseinizadeh, S. F. (2007). Nanoparticle-enhanced phase change
materials (NEPCM) with great potential for improved thermal energy storage.
International Communications in Heat and Mass Transfer, 34(5), 534-543.
Khudhair, Amar M., & Farid, Mohammed M. (2004). A review on energy conservation
in building applications with thermal storage by latent heat using phase change
materials. Energy Conversion and Management, 45(2), 263-275.
Kim, KH, Kim, HK, Park, CW, Peck, JH, & Kang, CD. (2011). Experimental Study on
Melting/solidification of adjoining Two Different PCMs in a Concentric Vertical
Cylinder. Proceedings of the KSME, 130-135.
Konuklu, Yeliz, Unal, Murat, & Paksoy, Halime O. (2014). Microencapsulation of
caprylic acid with different wall materials as phase change material for thermal
energy storage. Solar Energy Materials and Solar Cells, 120, 536-542.
Kuznik, Frédéric, David, Damien, Johannes, Kevyn, & Roux, Jean-Jacques. (2011). A
review on phase change materials integrated in building walls. Renewable and
Sustainable Energy Reviews, 15(1), 379-391.
Kuznik, Frédéric, & Virgone, Joseph. (2009). Experimental assessment of a phase
change material for wall building use. Applied Energy, 86(10), 2038-2046.
Kuznik, Frédéric, Virgone, Joseph, & Johannes, Kevyn. (2011). In-situ study of thermal
comfort enhancement in a renovated building equipped with phase change
material wallboard. Renewable Energy, 36(5), 1458-1462.
Lane, G.A. (1983). Solar Heat Storage:Latent Heat Materials, Vol. I (Vol. I). Florida:
CRC Press, Inc.
Lane, G.A. (1986). Solar Heat Storage:Latent Heat Materials, Vol. II, Technology.
Florida: CRC Press.
Lane, George A. (1980). Low temperature heat storage with phase change materials.
International Journal of Ambient Energy, 1(3), 155-168.
Li, Hairong, Jiang, Ming, Li, Qi, Li, Denian, Chen, Zongyi, Hu, Waping, . . . Xie,
Haian. (2013). Aqueous preparation of polyethylene glycol/sulfonated graphene
phase change composite with enhanced thermal performance. Energy
Conversion and Management, 75, 482-487.
Li, Min. (2013). A nano-graphite/paraffin phase change material with high thermal
conductivity. Applied Energy, 106(0), 25-30.
Li, Wei, Zhang, Rong, Jiang, Nan, Tang, Xiao-fen, Shi, Hai-feng, Zhang, Xing-xiang, . .
. Zhang, Ningxin. (2013). Composite macrocapsule of phase change
materials/expanded graphite for thermal energy storage. Energy, 57, 607-614.

156
Li, Z, Sun, WG, Wang, G, & Wu, ZG. (2014). Experimental and numerical study on the
effective thermal conductivity of paraffin/expanded graphite composite. Solar
Energy Materials and Solar Cells, 128, 447-455.
Lin, Kunping, Zhang, Yinping, Xu, Xu, Di, Hongfa, Yang, Rui, & Qin, Penghua.
(2005). Experimental study of under-floor electric heating system with shape-
stabilized PCM plates. Energy and Buildings, 37(3), 215-220.
Liu, Cheng, Yuan, Yanping, Zhang, Nan, Cao, Xiaoling, & Yang, Xiaojiao. (2014). A
novel PCM of lauric–myristic–stearic acid/expanded graphite composite for
thermal energy storage. Materials Letters, 120(0), 43-46.
Liu, Ming, Saman, Wasim, & Bruno, Frank. (2012). Review on storage materials and
thermal performance enhancement techniques for high temperature phase
change thermal storage systems. Renewable and Sustainable Energy Reviews,
16(4), 2118-2132.
Lopez, Jérôme, Caceres, Gustavo, Palomo Del Barrio, Elena, & Jomaa, Wahbi. (2010).
Confined melting in deformable porous media: A first attempt to explain the
graphite/salt composites behaviour. International Journal of Heat and Mass
Transfer, 53(5–6), 1195-1207.
Lorsch, H.G. , Kauffman, K.W. , & Denton, J.C. . (1976). Thermal energy storage for
heating and air conditioning, future energy production system. Heat and Mass
Transfer, 1, 69-85.
Lorsch, Harold G, Kauffman, Kenneth W, & Denton, Jesse C. (1975). Thermal energy
storage for solar heating and off-peak air conditioning. Energy conversion,
15(1), 1-8.
M. Zábranský, V. Růžička, V. Major, & Domalski., E.S. (1996). Heat capacity of
liquids: critical review and recommended values. Journal of Physical and
Chemical Reference Data.
Ma, Biao, Adhikari, Sanjeev, Chang, Yujiao, Ren, Junping, Liu, Jiang, & You,
Zhanping. (2013). Preparation of composite shape-stabilized phase change
materials for highway pavements. Construction and Building Materials, 42,
114-121.
Mahdaoui, M, Kousksou, T, Blancher, S, Ait Msaad, A, El Rhafiki, T, & Mouqallid, M.
(2014). A numerical analysis of solid–liquid phase change heat transfer around a
horizontal cylinder. Applied Mathematical Modelling, 38(3), 1101-1110.
Mahfuz, M. H., Anisur, M. R., Kibria, M. A., Saidur, R., & Metselaar, I. H. S. C.
(2014). Performance investigation of thermal energy storage system with Phase
Change Material (PCM) for solar water heating application. International
Communications in Heat and Mass Transfer, 57(0), 132-139.

157
Mathur, Sharad, & Moudgil, Brij Mohan. (1997). Adsorption mechanism (s) of poly
(ethylene oxide) on oxide surfaces. Journal of colloid and interface science,
196(1), 92-98.
Mazman, Muhsin, Cabeza, Luisa F., Mehling, Harald, Nogues, Miquel, Evliya, Hunay,
& Paksoy, Halime Ö. (2009). Utilization of phase change materials in solar
domestic hot water systems. Renewable Energy, 34(6), 1639-1643.
Mehling, Herald, & Cabeza, Luisa F. (2008). Heat and cold storage with PCM: An up
to date introduction into basics and applications. Berlin Heidelberg: Springer-
Verlag.
Mehrali, Mohammad, Latibari, Sara Tahan, Mehrali, Mehdi, Metselaar, Hendrik Simon
Cornelis, & Silakhori, Mahyar. (2013). Shape-stabilized phase change materials
with high thermal conductivity based on paraffin/graphene oxide composite.
Energy Conversion and Management, 67, 275-282.
Memon, Shazim Ali, Lo, Tommy Yiu, Barbhuiya, S. A., & Xu, Weiting. (2013).
Development of form-stable composite phase change material by incorporation
of dodecyl alcohol into ground granulated blast furnace slag. Energy and
Buildings, 62(0), 360-367.
Meng, Qinghao, & Hu, Jinlian. (2008). A poly(ethylene glycol)-based smart phase
change material. Solar Energy Materials and Solar Cells, 92(10), 1260-1268.
Meng, Xin, Zhang, Huanzhi, Sun, Lixian, Xu, Fen, Jiao, Qingzhu, Zhao, Ziming, . . .
Liu, Yingliang. (2013). Preparation and thermal properties of fatty acids/CNTs
composite as shape-stabilized phase change materials. Journal of Thermal
Analysis and Calorimetry, 111(1), 377-384.
Messerly, John F., Guthrie, George B., Todd, Samuel S., & Finke, Herman L. (1967).
Low-temperature thermal data for pentane, n-heptadecane, and n-octadecane.
Revised thermodynamic functions for the n-alkanes, C5-C18. Journal of
Chemical & Engineering Data, 12(3), 338-346.
Mettawee, Eman-Bellah S., & Assassa, Ghazy M. R. (2006). Experimental study of a
compact PCM solar collector. Energy, 31(14), 2958-2968.
Mills, Andrew, Farid, Mohammed, Selman, J. R., & Al-Hallaj, Said. (2006). Thermal
conductivity enhancement of phase change materials using a graphite matrix.
Applied Thermal Engineering, 26(14–15), 1652-1661.
Moeini Sedeh, Mahmoud, & Khodadadi, J. M. (2013). Thermal conductivity
improvement of phase change materials/graphite foam composites. Carbon,
60(0), 117-128.
Morrison, D. J., & Abdel-Khalik, S. I. (1978). Effects of phase-change energy storage
on the performance of air-based and liquid-based solar heating systems. Solar
Energy, 20(1), 57-67.

158
Motahar, Sadegh, Nikkam, Nader, Alemrajabi, Ali A, Khodabandeh, Rahmatollah,
Toprak, Muhammet S, & Muhammed, Mamoun. (2014a). Experimental
investigation on thermal and rheological properties of n-octadecane with
dispersed TiO 2 nanoparticles. International Communications in Heat and Mass
Transfer, 59, 68-74.
Motahar, Sadegh, Nikkam, Nader, Alemrajabi, Ali A, Khodabandeh, Rahmatollah,
Toprak, Muhammet S, & Muhammed, Mamoun. (2014b). A novel phase change
material containing mesoporous silica nanoparticles for thermal storage: a study
on thermal conductivity and viscosity. International Communications in Heat
and Mass Transfer, 56, 114-120.
Neeper, D. A. (2000). Thermal dynamics of wallboard with latent heat storage. Solar
Energy, 68(5), 393-403.
Nkwetta, Dan Nchelatebe, & Haghighat, Fariborz. (2014). Thermal energy storage with
phase change material—A state-of-the art review. Sustainable Cities and
Society, 10(0), 87-100.
Nkwetta, Dan Nchelatebe, Vouillamoz, Pierre-Edouard, Haghighat, Fariborz, El-
Mankibi, Mohamed, Moreau, Alain, & Daoud, Ahmed. (2014). Impact of phase
change materials types and positioning on hot water tank thermal performance:
Using measured water demand profile. Applied Thermal Engineering, 67(1–2),
460-468.
Oliver, Alicia. (2012). Thermal characterization of gypsum boards with PCM included:
Thermal energy storage in buildings through latent heat. Energy and Buildings,
48(0), 1-7.
Ona, Erwin P, Zhang, Xuemei, Kyaw, Kyaw, Watanabe, Fujio, Matsuda, Hitoki,
Kakiuchi, Hiroyuki, . . . Chihara, Shouichi. (2001). Relaxation of Supercooling
of Erythritol for Latent Heat Storage. Journal of chemical engineering of Japan,
34(3), 376-382.
Pan, Lin, Tao, Quanhong, Zhang, Shudong, Wang, Shuangshuang, Zhang, Jian, Wang,
Suhua, . . . Zhang, Zhongping. (2012). Preparation, characterization and thermal
properties of micro-encapsulated phase change materials. Solar Energy
Materials and Solar Cells, 98(0), 66-70.
Paris, Jean, Falardeau, Michel, & Villeneuve, CÉCile. (1993). Thermal Storage by
Latent Heat: A Viable Option for Energy Conservation in Buildings. Energy
Sources, 15(1), 85-93.
Parks, George S., Moore, George E., Renquist, Melvin L., Naylor, Benjamin F.,
McClaine, Leslie A., Fujii, Paul S., & Hatton, John A. (1949). Thermal Data on
Organic Compounds. XXV. Some Heat Capacity, Entropy and Free Energy Data
for Nine Hydrocarbons of High Molecular Weight. Journal of the American
Chemical Society, 71(10), 3386-3389.

159
Parks, George S., West, Theo J., Naylor, Benjamin F., Fujii, Paul S., & McClaine,
Leslie A. (1946). Thermal Data on Organic Compounds. XXIII. Modern
Combustion Data for Fourteen Hydrocarbons and Five Polyhydroxy Alcohols.
Journal of the American Chemical Society, 68(12), 2524-2527.
Peck, Jong Hyeon, Kim, Jae-Jun, Kang, Chaedong, & Hong, Hiki. (2006). A study of
accurate latent heat measurement for a PCM with a low melting temperature
using T-history method. International journal of refrigeration, 29(7), 1225-
1232.
Pielichowska, K., Głowinkowski, S., Lekki, J., Biniaś, D., Pielichowski, K., & Jenczyk,
J. (2008). PEO/fatty acid blends for thermal energy storage materials.
Structural/morphological features and hydrogen interactions. European Polymer
Journal, 44(10), 3344-3360.
Pielichowska, Kinga, & Pielichowski, Krzysztof. (2014). Phase change materials for
thermal energy storage. Progress in Materials Science, 65(0), 67-123.
Pielichowski, Krzysztof, & Flejtuch, Kinga. (2003a). Binary blends of polyethers with
fatty acids: a thermal characterization of the phase transitions. Journal of
applied polymer science, 90(3), 861-870.
Pielichowski, Krzysztof, & Flejtuch, Kinga. (2003b). Differential Scanning Calorimetry
Study of Blends of Poly(ethylene glycol) with Selected Fatty Acids.
Macromolecular Materials and Engineering, 288(3), 259-264.
Pielichowski, Krzysztof, & Flejtuch, Kinga. (2005). Recent developments in polymeric
phase change materials for energy storage: poly (ethylene oxide)/stearic acid
blends. Polymers for advanced technologies, 16(2‐3), 127-132.
Porisini, Fernanda Coen. (1988). Salt hydrates used for latent heat storage: corrosion of
metals and reliability of thermal performance. Solar Energy, 41(2), 193-197.
Prakash, J., Garg, H. P., & Datta, G. (1985). A solar water heater with a built-in latent
heat storage. Energy Conversion and Management, 25(1), 51-56.
Py, Xavier, Olives, Régis, & Mauran, Sylvain. (2001). Paraffin/porous-graphite-matrix
composite as a high and constant power thermal storage material. International
Journal of Heat and Mass Transfer, 44(14), 2727-2737.
Rathod, Manish K., & Banerjee, Jyotirmay. (2013). Thermal stability of phase change
materials used in latent heat energy storage systems: A review. Renewable and
Sustainable Energy Reviews, 18(0), 246-258.
Regin, A. Felix, Solanki, S. C., & Saini, J. S. (2008). Heat transfer characteristics of
thermal energy storage system using PCM capsules: A review. Renewable and
Sustainable Energy Reviews, 12(9), 2438-2458.

160
Reyes, Alejandro, Mahn, Andrea, & Vásquez, Francisco. (2014). Mushrooms
dehydration in a hybrid-solar dryer, using a phase change material. Energy
Conversion and Management, 83(0), 241-248.
Rozanna, D., Chuah, T. G., Salmiah, A., Choong, Thomas S. Y., & Sa'ari, M. (2005).
Fatty Acids as Phase Change Materials (PCMs) for Thermal Energy Storage: A
Review. International Journal of Green Energy, 1(4), 495-513.
Sadhishkumar, S, & Balusamy, T. (2014). Performance improvement in solar water
heating systems—A review. Renewable and Sustainable Energy Reviews, 37,
191-198.
Salyer, Ival O. (2000). Water heating unit with integral thermal energy storage: Google
Patents.
Sari, Ahmet. (2005). Eutectic mixtures of some fatty acids for low temperature solar
heating applications: Thermal properties and thermal reliability. Applied
Thermal Engineering, 25(14), 2100-2107.
Sarı, Ahmet. (2003). Thermal reliability test of some fatty acids as PCMs used for solar
thermal latent heat storage applications. Energy Conversion and Management,
44(14), 2277-2287.
Sarı, Ahmet. (2014). Composites of polyethylene glycol (PEG600) with gypsum and
natural clay as new kinds of building PCMs for low temperature-thermal energy
storage. Energy and Buildings, 69(0), 184-192.
Sarı, Ahmet, Alkan, Cemil, Karaipekli, Ali, & Uzun, Orhan. (2009). Microencapsulated
n-octacosane as phase change material for thermal energy storage. Solar Energy,
83(10), 1757-1763.
Sarı, Ahmet, & Karaipekli, Ali. (2007). Thermal conductivity and latent heat thermal
energy storage characteristics of paraffin/expanded graphite composite as phase
change material. Applied Thermal Engineering, 27(8–9), 1271-1277.
Sarı, Ahmet, Karaipekli, Ali, & Alkan, Cemil. (2009). Preparation, characterization and
thermal properties of lauric acid/expanded perlite as novel form-stable
composite phase change material. Chemical Engineering Journal, 155(3), 899-
904.
Sari, Ahmet, & Kaygusuz, Kamil. (2001). Thermal performance of myristic acid as a
phase change material for energy storage application. Renewable Energy, 24(2),
303-317.
Sari, Ahmet, & Kaygusuz, Kamil. (2002a). Thermal performance of a eutectic mixture
of lauric and stearic acids as PCM encapsulated in the annulus of two concentric
pipes. Solar Energy, 72(6), 493-504.

161
Sari, Ahmet, & Kaygusuz, Kamil. (2002b). Thermal performance of palmitic acid as a
phase change energy storage material. Energy Conversion and Management,
43(6), 863-876.
Sari, Ahmet, & Kaygusuz, Kamil. (2006). Thermal Energy Storage Characteristics of
Myristic and Stearic Acids Eutectic Mixture for Low Temperature Heating
Applications1. Chinese Journal of Chemical Engineering, 14(2), 270-275.
Sari, Ahmet, & Kaygusuz, Kamİl. (2001). Thermal energy storage system using stearic
acid as a phase change material. Solar Energy, 71(6), 365-376.
Sari, Ahmet, Sari, Hayati, & Önal, Adem. (2004). Thermal properties and thermal
reliability of eutectic mixtures of some fatty acids as latent heat storage
materials. Energy conversion and management, 45(3), 365-376.
Sarier, Nihal, & Onder, Emel. (2012). Organic phase change materials and their textile
applications: An overview. Thermochimica Acta, 540(0), 7-60.
Shabtay, Yoram L, & Black, John RH. (2014). Compact Hot Water Storage Systems
Combining Copper Tube with High Conductivity Graphite and Phase Change
Materials. Energy Procedia, 48, 423-430.
Shalaby, S. M., & Bek, M. A. (2014). Experimental investigation of a novel indirect
solar dryer implementing PCM as energy storage medium. Energy Conversion
and Management, 83(0), 1-8.
Shalaby, S. M., Bek, M. A., & El-Sebaii, A. A. (2014). Solar dryers with PCM as
energy storage medium: A review. Renewable and Sustainable Energy Reviews,
33(0), 110-116.
Shao, Jingjing, Darkwa, Jo, & Kokogiannakis, Georgios. (2016). Development of a
novel phase change material emulsion for cooling systems. Renewable Energy,
87, Part 1, 509-516.
Sharma, Atul, Sharma, S. D., & Buddhi, D. (2002). Accelerated thermal cycle test of
acetamide, stearic acid and paraffin wax for solar thermal latent heat storage
applications. Energy Conversion and Management, 43(14), 1923-1930.
Sharma, Atul, Shukla, A., Chen, C. R., & Dwivedi, S. (2013). Development of phase
change materials for building applications. Energy and Buildings, 64(0), 403-
407.
Sharma, Atul, Tyagi, V. V., Chen, C. R., & Buddhi, D. (2009). Review on thermal
energy storage with phase change materials and applications. Renewable and
Sustainable Energy Reviews, 13(2), 318-345.
Sharma, R. K., Ganesan, P., Sahu, J. N., Metselaar, H. S. C., & Mahlia, T. M. I. (2014).
Numerical study for enhancement of solidification of phase change materials
using trapezoidal cavity. Powder Technology, 268(0), 38-47.

162
Sharma, R. K., Ganesan, P., Tyagi, V. V., & Mahlia, T. M. I. (2016). Accelerated
thermal cycle and chemical stability testing of polyethylene glycol (PEG) 6000
for solar thermal energy storage. Solar Energy Materials and Solar Cells, 147,
235-239.
Sharma, R. K., Ganesan, P., Tyagi, V. V., Metselaar, H. S. C., & Sandaran, S. C.
(2015). Developments in organic solid–liquid phase change materials and their
applications in thermal energy storage. Energy Conversion and Management,
95, 193-228.
Sharma, S. D., Kitano, H., & Sagara, K. (2004). Phase Change Materials for Low
Temperature Solar Thermal Applications: Research Reports of Faculty of
Engineering-Mie University.
Sharma, SD, Buddhi, D, & Sawhney, RL. (1999). Accelerated thermal cycle test of
latent heat-storage materials. Solar Energy, 66(6), 483-490.
Shilei, Lv, Neng, Zhu, & Guohui, Feng. (2006). Eutectic mixtures of capric acid and
lauric acid applied in building wallboards for heat energy storage. Energy and
Buildings, 38(6), 708-711.
Shukla, A, Buddhi, D, Sharma, SD, & Sagara, K. (2003). Accelerated thermal cycle test
of erythritol for the latent heat storage application. Paper presented at the
Proceedings of the EM4 Indore workshop IEA ECES IA annex.
Shukla, Anant, Buddhi, D, & Sawhney, RL. (2008). Thermal cycling test of few
selected inorganic and organic phase change materials. Renewable Energy,
33(12), 2606-2614.
Shukla, Anant, Buddhi, D., & Sawhney, R. L. (2009). Solar water heaters with phase
change material thermal energy storage medium: A review. Renewable and
Sustainable Energy Reviews, 13(8), 2119-2125.
Soares, N., Costa, J. J., Gaspar, A. R., & Santos, P. (2013). Review of passive PCM
latent heat thermal energy storage systems towards buildings’ energy efficiency.
Energy and Buildings, 59(0), 82-103.
Solé, Aran, Neumann, Hannah, Niedermaier, Sophia, Martorell, Ingrid, Schossig, Peter,
& Cabeza, Luisa F. (2014). Stability of sugar alcohols as PCM for thermal
energy storage. Solar Energy Materials and Solar Cells, 126(0), 125-134.
Solomon, Gnanadurai Ravikumar, & Velraj, Ramalingam. (2013). Analysis of the heat
transfer mechanisms during energy storage in a Phase Change Material filled
vertical finned cylindrical unit for free cooling application. Energy Conversion
and Management, 75(0), 466-473.
Song, Shaokun, Dong, Lijie, Qu, Zhengyao, Ren, Jing, & Xiong, Chuanxi. (2014).
Microencapsulated capric–stearic acid with silica shell as a novel phase change
material for thermal energy storage. Applied Thermal Engineering, 70(1), 546-
551.

163
Stovall, T. K., & Tomlinson, J. J. (1995). What are the Potential Benefits of Including
Latent Storage in Common Wallboard? Journal of Solar Energy Engineering,
117(4), 318-325.
Stritih, U., & Butala, V. (2010). Experimental investigation of energy saving in
buildings with PCM cold storage. International Journal of Refrigeration, 33(8),
1676-1683.
Tahan Latibari, Sara, Mehrali, Mohammad, Mehrali, Mehdi, Indra Mahlia, Teuku
Meurah, & Cornelis Metselaar, Hendrik Simon. (2013). Synthesis,
characterization and thermal properties of nanoencapsulated phase change
materials via sol–gel method. Energy, 61(0), 664-672.
Talja, Riku A, & Roos, Yrjö H. (2001). Phase and state transition effects on dielectric,
mechanical, and thermal properties of polyols. Thermochimica acta, 380(2),
109-121.
Talmatsky, Ella, & Kribus, Abraham. (2008). PCM storage for solar DHW: An
unfulfilled promise? Solar Energy, 82(10), 861-869.
Tan, F. L. (2008). Constrained and unconstrained melting inside a sphere. International
Communications in Heat and Mass Transfer, 35(4), 466-475.
Tang, Bingtao, Qiu, Meige, & Zhang, Shufen. (2012). Thermal conductivity
enhancement of PEG/SiO< sub> 2</sub> composite PCM by in situ Cu doping.
Solar Energy Materials and Solar Cells, 105, 242-248.
Tatsidjodoung, Parfait, Le Pierrès, Nolwenn, & Luo, Lingai. (2013). A review of
potential materials for thermal energy storage in building applications.
Renewable and Sustainable Energy Reviews, 18(0), 327-349.
Telkes, Maria. (1952). Nucleation of Supersaturated Inorganic Salt Solutions. Industrial
& Engineering Chemistry, 44(6), 1308-1310.
Ting, KC, Giannakakos, PN, & Gilbert, SG. (1987). Durability of latent heat storage
tube-sheets. Solar Energy, 39(2), 79-85.
Turnpenny, J. R., Etheridge, D. W., & Reay, D. A. (2000). Novel ventilation cooling
system for reducing air conditioning in buildings.: Part I: testing and theoretical
modelling. Applied Thermal Engineering, 20(11), 1019-1037.
Tyagi, V. V., Pandey, A. K., Giridhar, G., Bandyopadhyay, B., Park, S. R., & Tyagi, S.
K. (2012). Comparative study based on exergy analysis of solar air heater
collector using thermal energy storage. International Journal of Energy
Research, 36(6), 724-736.
Tyagi, V. V., Pandey, A. K., Kaushik, S. C., & Tyagi, S. K. (2012). Thermal
performance evaluation of a solar air heater with and without thermal energy
storage. Journal of Thermal Analysis and Calorimetry, 107(3), 1345-1352.

164
Tyagi, Vineet Veer, & Buddhi, D. (2007). PCM thermal storage in buildings: A state of
art. Renewable and Sustainable Energy Reviews, 11(6), 1146-1166.
van Miltenburg, J. C. (2000). Fitting the heat capacity of liquid n-alkanes: new
measurements of n-heptadecane and n-octadecane. Thermochimica Acta, 343(1–
2), 57-62.
Verma, Prashant, Varun, & Singal, S. K. (2008). Review of mathematical modeling on
latent heat thermal energy storage systems using phase-change material.
Renewable and Sustainable Energy Reviews, 12(4), 999-1031.
VijayaVenkataRaman, S., Iniyan, S., & Goic, Ranko. (2012). A review of solar drying
technologies. Renewable and Sustainable Energy Reviews, 16(5), 2652-2670.
Wakao, N., & Kaguei, S. (1982). Heat and Mass Transfer in Packed Beds. Gordon and
Breach Science Publishers, New York, 175-205.
Wang, Jifen, Xie, Huaqing, Guo, Zhixiong, Guan, Lihui, & Li, Yang. (2014). Improved
thermal properties of paraffin wax by the addition of TiO2 nanoparticles.
Applied Thermal Engineering, 73(2), 1541-1547.
Wang, Jifen, Xie, Huaqing, Li, Yang, & Xin, Zhong. (2010). PW based phase change
nanocomposites containing γ-Al2O3. Journal of thermal analysis and
calorimetry, 102(2), 709-713.
Wang, Jifen, Xie, Huaqing, & Xin, Zhong. (2009). Thermal properties of paraffin based
composites containing multi-walled carbon nanotubes. Thermochimica Acta,
488(1–2), 39-42.
Wang, Weilong, Yang, Xiaoxi, Fang, Yutang, & Ding, Jing. (2009). Preparation and
performance of form-stable polyethylene glycol/silicon dioxide composites as
solid–liquid phase change materials. Applied Energy, 86(2), 170-174.
Wang, Weilong, Yang, Xiaoxi, Fang, Yutang, Ding, Jing, & Yang, Jianping. (2007).
Preparation of polyethylene glycol/silicon dioxide phase change materials.
JOURNAL OF CHEMICAL INDUSTRY AND ENGINEERING-CHINA-, 58(10),
2664.
Waqas, Adeel, & Ud Din, Zia. (2013). Phase change material (PCM) storage for free
cooling of buildings—A review. Renewable and Sustainable Energy Reviews,
18(0), 607-625.
Wasp, F.J. (1977). Solid-liquid slurry pipeline transportation. Trans. Tech. Berlin.
Wu, Shuying, Zhu, Dongsheng, Zhang, Xiurong, & Huang, Jin. (2010). Preparation and
melting/freezing characteristics of Cu/paraffin nanofluid as phase-change
material (PCM). Energy & Fuels, 24(3), 1894-1898.

165
Xu, Biwan, & Li, Zongjin. (2013). Paraffin/diatomite composite phase change material
incorporated cement-based composite for thermal energy storage. Applied
energy, 105, 229-237.
Yavari, Fazel, Fard, Hafez Raeisi, Pashayi, Kamyar, Rafiee, Mohammad A., Zamiri,
Amir, Yu, Zhongzhen, . . . Koratkar, Nikhil. (2011). Enhanced Thermal
Conductivity in a Nanostructured Phase Change Composite due to Low
Concentration Graphene Additives. The Journal of Physical Chemistry C,
115(17), 8753-8758.
Yinping, Zhang, & Yi, Jiang. (1999). A simple method, the-history method, of
determining the heat of fusion, specific heat and thermal conductivity of phase-
change materials. Measurement Science and Technology, 10(3), 201.
Yu, Wenhua, France, David M., Routbort, Jules L., & Choi, Stephen U. S. (2008).
Review and Comparison of Nanofluid Thermal Conductivity and Heat Transfer
Enhancements. Heat Transfer Engineering, 29(5), 432-460.
Yuan, Yanping, Zhang, Nan, Tao, Wenquan, Cao, Xiaoling, & He, Yaling. (2014).
Fatty acids as phase change materials: A review. Renewable and Sustainable
Energy Reviews, 29(0), 482-498.
Zábranský, Milan, Růžička, Vlastimil, & Domalski, Eugene S. (2001). Heat Capacity of
Liquids: Critical Review and Recommended Values. Supplement I. Journal of
Physical and Chemical Reference Data, 30(5), 1199-1689.
Zalba, Bel n, Marı n, Jos Ma, Cabeza, Luisa F., & Mehling, Harald. (2003). Review on
thermal energy storage with phase change: materials, heat transfer analysis and
applications. Applied Thermal Engineering, 23(3), 251-283.
Zeng, Ju-Lan, Gan, Juan, Zhu, Fu-Rong, Yu, Sai-Bo, Xiao, Zhong-Liang, Yan, Wen-
Pei, . . . Cao, Zhong. (2014). Tetradecanol/expanded graphite composite form-
stable phase change material for thermal energy storage. Solar Energy Materials
and Solar Cells, 127, 122-128.
Zhang, Nan, Yuan, Yanping, Wang, Xi, Cao, Xiaoling, Yang, Xiaojiao, & Hu,
Shuchun. (2013). Preparation and characterization of lauric–myristic–palmitic
acid ternary eutectic mixtures/expanded graphite composite phase change
material for thermal energy storage. Chemical Engineering Journal, 231(0),
214-219.
Zhang, Ping, Song, Lei, Lu, Hongdian, Wang, Jian, & Hu, Yuan. (2010). The influence
of expanded graphite on thermal properties for paraffin/high density
polyethylene/chlorinated paraffin/antimony trioxide as a flame retardant phase
change material. Energy Conversion and Management, 51(12), 2733-2737.
Zhang, X. X., Fan, Y. F., Tao, X. M., & Yick, K. L. (2004). Fabrication and properties
of microcapsules and nanocapsules containing n-octadecane. Materials
Chemistry and Physics, 88(2–3), 300-307.

166
Zhang, Zhengguo, Shi, Guoquan, Wang, Shuping, Fang, Xiaoming, & Liu, Xiaohong.
(2013). Thermal energy storage cement mortar containing n-
octadecane/expanded graphite composite phase change material. Renewable
Energy, 50(0), 670-675.
Zhang, Zhengguo, Zhang, Ni, Peng, Jing, Fang, Xiaoming, Gao, Xuenong, & Fang,
Yutang. (2012). Preparation and thermal energy storage properties of
paraffin/expanded graphite composite phase change material. Applied Energy,
91(1), 426-431.

167
Appendices
List of papers accepted for publication in journals
1. R.K. Sharma, P. Ganesan, V.V. Tyagi, H.S.C. Metselaar, S. Sandaran. (2016),
―Thermal properties and heat storage analysis of palmitic acid-TiO2 composite
as nano-enhanced organic phase change material (NEOPCM)‖, Applied Thermal
Engineering (Accepted for publication). (ISI-Cited).
2. R.K. Sharma, P. Ganesan, V.V. Tyagi. (2016). ―Long term thermal and chemical
reliability study of different organic phase change materials for thermal energy
storage applications‖, Journal of Thermal Analysis and Calorimetry (Accepted
for publication). (ISI-Cited).
3. R. K. Sharma, P. Ganesan, V. V. Tyagi, T.M.I. Mahlia. (2016). ―Accelerated
thermal cycle and chemical stability testing of Polyethylene glycol (PEG) 6000
for solar thermal energy storage‖, Solar Energy materials and Solar Cells, 147,
235-239. (ISI-Cited).
4. R. K. Sharma, P. Ganesan, V. V. Tyagi, H. S. C. Metselaar, S. C. Sandaran.
(2015). ―Developments in organic solid–liquid phase change materials and their
applications in thermal energy storage‖, Energy Conversion and Management,
95, 193-228. (ISI-Cited).
5. R. K. Sharma, P. Ganesan, J. N. Sahu, H. S. C. Metselaar, T.M.I. Mahlia.
(2014). ―Numerical study for enhancement of solidification of phase change
materials using trapezoidal cavity‖, Powder technology, 268, 38-47. (ISI-Cited).
Conference proceedings
1. R. K. Sharma, P. Ganesan, “Numerical study of freezing of cu-water nanofluid
in a trapezoidal cavity‖, 3rd
International Conference on Clean Energy and
Technology (CEAT) 2014, held at Kuching, Malaysia between November
24-26, 2014. (Scopus-Cited)


