
Reliability Test Report - MACOM Test Report... · Reliability Test Report. ......
29
Page 1 of 29 Reliability Test Report
Transcript of Reliability Test Report - MACOM Test Report... · Reliability Test Report. ......

Page 1 of 29
Reliability Test Report

Page 2 of 29
Reliability flow Chart:

Page 3 of 29
Test Group 1
1.1 Dimensional Analysis:
1.1.1 Test Purpose: These measurements are to verify that the units meet the dimensional specifications outlined in the data sheet. 1.1.2 Test Method/Specification: Refer to dimensional section of MAFL-009272-CD0AC0 data sheet See Figure 1.1A
Figure 1.1A - MAFL-009272-CD0AC0 outline dimensions

Page 4 of 29
1.1.3 Measurement Results: Sample(s) Description: MAFL-009272-CD0AC0 Quantity: 30 PCS All 30 samples measured meet the data sheet dimensional specifications. The measurement results can be seen in Figure 1.1B.
Figure 1.1B – Dimensional results

Page 5 of 29
1.2 Solvent Resistance Test:
SGS Report Reference: SZRL06006F/2009 –Section 1. 1.2.1 Test Purpose: The purpose of this test is to verify that the markings will not become illegible on the component parts when subjected to solvents. 1.2.2 Test Method/Specification: Refer to Mil-STD-883G Method 2015.13. 1.2.3 Appearance Inspection: Appearance inspection performed before and after test. 1.2.4 Sample(s) Inspection before Test: Sample(s) Description: MAFL-009272-CD0AC0 Quantity: 2 PCS (1#, 2#) Appearance Inspection: No visual damage was found on samples before test. See Photo 1.2A. 1.2.5 Test Procedure: Lab Environmental Conditions: Ambient temperature: 25±3ºC, Relative humidity: 55±20%RH. 1.2.6 Test Result(s): Standard’s failure criteria: After subjection to the test, evidence of damage to the device and any specified markings which are missing in whole or in part, faded, smeared, blurred, or shifted (dislodged) to the extent that they cannot be readily identified from a distance of at least 15.0 cm (6 inches) with normal room lighting and without the aid of magnification or with a viewer having a magnification no greater than 3X shall constitute a failure.
Appearance Inspection: No visual damage was found on samples after test. See Photo 1.2B.
Photo 1.2A Samples Before Test Photo 1.2B Samples After Test

Page 6 of 29
1.3 Terminal Fatigue Testing:
SGS Report Reference: SZRL06006F/2009 –Section 2. 1.3.1 Test Purpose: This test is designed to check the capabilities of the device solder pads to withstand a delamination (peel) stress of specified tension and time. 1.3.2 Test Method/Specification: Refer to Mil-STD-883G Method 2004.5 condition D. Test Condition:
• A minimum tension of 8 ounces (2.22 N) shall be applied, without shock, to each solder pad to be tested in a direction perpendicular to the solder pad surface and maintained for 30 seconds minimum.
Test Profile:
1.3.3 Appearance Inspection: Appearance inspection performed before and after test. 1.3.4 Sample(s) Inspection before Test: Sample(s) Description: MAFL-009272-CD0AC0 Quantity: 5 PCS (3#~7#) Appearance Inspection: No visual damage was found on samples before test. See Photo 1.3C. 1.3.5 Test Procedure: Test Equipment: Name: Testometric Model: CMT6503 Equipment No. : 10611042 Lab Environmental Conditions: Ambient temperature: 25±3ºC, Relative humidity: 55±20%RH.
Page 7 of 29
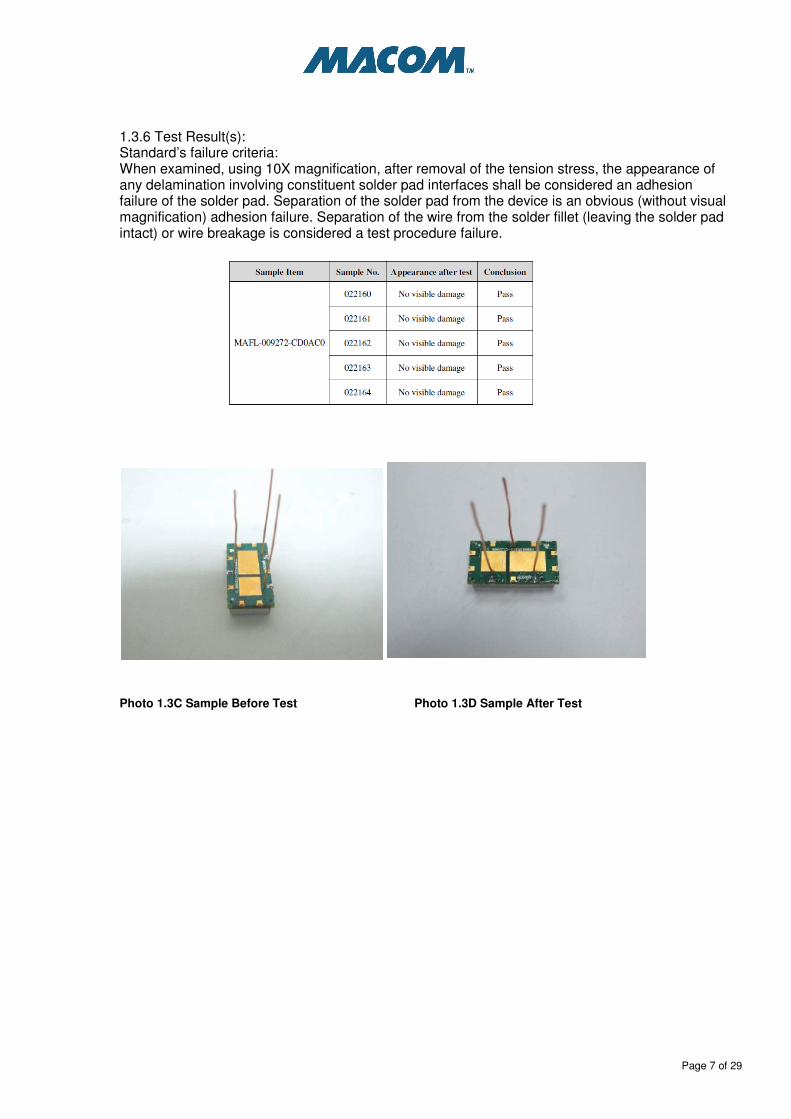
1.3.6 Test Result(s): Standard’s failure criteria: When examined, using 10X magnification, after removal of the tension stress, the appearance of any delamination involving constituent solder pad interfaces shall be considered an adhesion failure of the solder pad. Separation of the solder pad from the device is an obvious (without visual magnification) adhesion failure. Separation of the wire from the solder fillet (leaving the solder pad intact) or wire breakage is considered a test procedure failure.
Photo 1.3C Sample Before Test Photo 1.3D Sample After Test

Page 8 of 29
Test Group 2 2.1 Steam Age Test:
SGS Report Reference: SZRL06006F/2009 –Section 3. 2.1.1 Test Purpose: The test aim is to verify the samples’ ability to resist the environment conditions. 2.1.2 Test Method/Specification: Refer to client’s requirements.
• Test Temperature: 35ºC
• Test Humidity: 95%RH
• Test Duration: 168hours 2.1.3 Appearance Inspection: Appearance inspection performed before and after test. 2.1.4 Sample(s) Inspection before Test: Sample(s) Description: MAFL-009272-CD0AC0 Quantity: 10 PCS Appearance Inspection: No visual damage was found on samples before test. See Photo 2.1B. 2.1.5 Test Procedure: Test Equipment: Name: Temp & Humidity Chamber Model: ETH-B0-100 Equipment No. : POLY-I-242 Lab Environmental Conditions: Ambient temperature: 25±3ºc, Relative humidity: 55±20%RH 2.1.6 Test Result(s): Appearance Check: No visual damage was found on samples after test. See Photo 2.1C.
Photo 2.1B Samples Before Test Photo 2.1C Samples After Test

Page 9 of 29
2.2 Bake Test: SGS Report Reference: SZRL06006F/2009 –Section 4.
2.2.1 Test Purpose: The test aim is to verify the samples’ ability to resist the environment conditions. 2.2.2 Test Method/Specification: Refer to client’s requirements.
• Test Temperature: 150ºC
• Test Duration: 100hours 2.2.3 Appearance Inspection: Appearance inspection performed before and after test. 2.2.4 Sample(s) Inspection before Test: Sample(s) Description: MAFL-009272-CD0AC0 Quantity: 10 PCS
Appearance Inspection: No visual damage was found on samples before test. See Photo 2.2B.
2.2.5 Test Procedure: Test Equipment: Name: Thermal Shock Chamber Model: TS300 Equipment No. : SZREL-010 Lab Environmental Conditions: Ambient temperature: 25±3ºc, Relative humidity: 55±20%RH
2.2.6 Test Result(s):
Appearance Check: No visual damage was found on samples after test. See Photo 2.2C
Photo 2.2B Samples Before Test Photo 2.2C Samples After Test
Page 10 of 29
2.3 Solderability Test:
2.3.1 Test Purpose: The purpose of this test is to verify the solderability of the samples subjected to the steam age and bake testing outlined in sections 2.1 & 2.2. 2.3.2 Test Method/Specification: Refer to Mil-STD-883 Method 2003.8.
• Dip and Look solderability Test.
• Solder Temperature 245ºC ± 5 ºC
• Solder: SN60
• Immersion rate: 1” per second ± 0.25” per second
• Dwell Time: 5 seconds ± 0.5 second. 2.3.3 Appearance Inspection: Appearance inspection performed before and after test. 2.3.4 Sample(s) Inspection before Test: Sample(s) Description: MAFL-009272-CD0AC0 Quantity: 10 PCS after Steam age test. 10PCS after Bake test.
Appearance Inspection: No visual damage was found on samples before test.
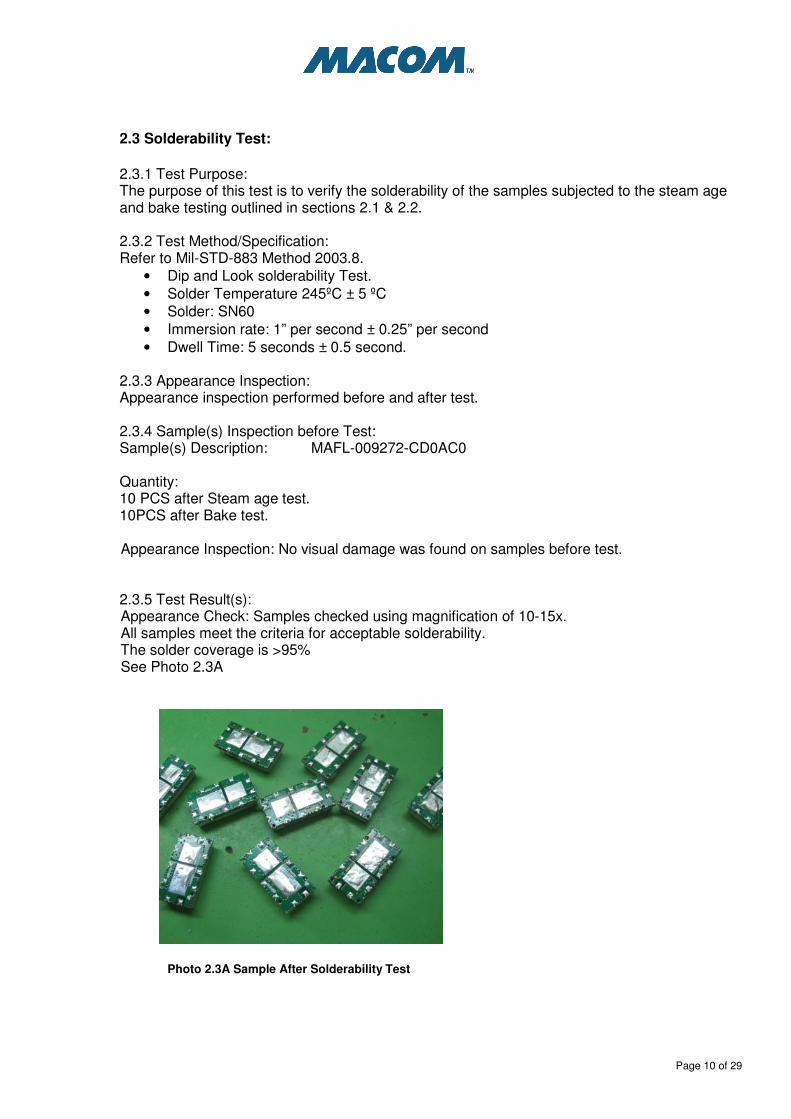
2.3.5 Test Result(s): Appearance Check: Samples checked using magnification of 10-15x. All samples meet the criteria for acceptable solderability. The solder coverage is >95% See Photo 2.3A
Photo 2.3A Sample After Solderability Test

Page 11 of 29
Test Group 3:
3.1: High Temperature Life Stabilization Bake Test: SGS Report Reference: SZRL06006F/2009 –Section 5. 3.1.1 Test Purpose: The purpose of this test is to determine the effect on microelectronic devices of storage at elevated temperatures without electrical stress applied. 3.1.2 Test Method/Specification: Refer to Mil-STD-883G Method 1008.2 condition A.
• Test Temperature: 100ºC
• Test Duration: 500hours 3.1.3 Appearance Inspection: Appearance inspection performed before and after test. 3.1.4 Sample(s) Inspection before Test: Sample(s) Description: MAFL-009272-CD0AC0 Quantity: 76 PCS
Appearance Inspection: No visual damage was found on samples before test. See Photo 3.1B.
3.1.5 Test Procedure: Test Equipment: Name: Ramp Temperature Cycling Chamber Model: WK-800/70/25 Equipment No. : SZREL-009 Lab Environmental Conditions: Ambient temperature: 25±3ºC, Relative humidity: 55±20%RH
3.1.6 Test Result(s):
Appearance Check: No visual damage was found on samples after test. See Photo 3.1C.
Photo 3.1B Sample Before Test Photo 3.1C Sample After Test

Page 12 of 29
3.2: Thermal Shock Test: SGS Report Reference: SZRL06006F/2009 –Section 6.
3.2.1 Test Purpose: The purpose of this test is to determine the resistance of the part to sudden exposure to extreme changes in temperature and the effect of alternate exposures to these extremes. 3.2.2 Test Method/Specification: Refer to Mil-STD-883G Method 1011.9 condition A.
• Low Temperature: 0ºC.
• High Temperature: 100 ºC.
• Dwell Time: 10 minutes.
• Test Cycles: 100.
• Total duration: about 34 hours.
3.2.3 Appearance Inspection: Appearance inspection performed before and after test. 3.2.4 Sample(s) Inspection before Test: Sample(s) Description: MAFL-009272-CD0AC0
Quantity: 76 PCS (after Hi temp Life Stabilization Bake Test). Appearance Inspection: No visual damage was found on samples before test.
See Photo 3.2C.
3.2.5 Test Procedure: Test Equipment: Name: Thermal Shock Chamber Model: TS300 Equipment No. : SZREL-010 Lab Environmental Conditions: Ambient temperature: 25±3ºC, Relative humidity: 55±20%RH 3.2.6 Test Result(s):
Appearance Check: No visual damage was found on samples after test. See Photo 3.2D.
Photo 3.2C Sample Before Test Photo 3.2D Sample After Test

Page 13 of 29
3.3: Functional Test: 3.3.1 Initial Functional Test Results The 76 units were functionally tested for Insertion loss before being subjected to High Temperature Life Stabilization Bake and Thermal Shock outlined in sections 3.1 & 3.2. All 76 units passed to specification. The initial test results are plotted in Figure 3.3A below.
Port1_reflection
-45
-35
-25
-15
-5
5
Freq(
MHz)
80.7
22
169.
063
257.
405
345.
747
434.
089
522.
43
610.
772
699.
114
787.
456
875.
797
964.
139
1020
1055
1090
1125
1160
1195
1230
1325
1500
1675
1850
2025
2200
2287
.523
75
2462
.526
0027
7529
50
Freq(MHz)
dB
Port2_port3_transmission
-120
-95
-70
-45
-20
5
Fre
q(M
Hz)
80
.72
2
169
.06
3
257
.40
5
345
.74
7
434
.08
9
52
2.4
3
610
.77
2
699
.11
4
787
.45
6
875
.79
7
964
.13
9
10
20
10
55
10
90
11
25
11
60
11
95
12
30
13
25
15
00
16
75
18
50
20
25
22
00
22
87
.5
23
75
24
62
.5
26
00
27
75
29
50
Freq(MHz)
dB

Page 14 of 29
Port1_port2_transmission
-100
-80
-60
-40
-20
0
Fre
q(M
Hz)
80
.722
16
9.0
63
25
7.4
05
34
5.7
47
43
4.0
89
52
2.4
3
61
0.7
72
69
9.1
14
78
7.4
56
87
5.7
97
96
4.1
39
10
20
10
55
10
90
11
25
11
60
11
95
12
30
13
25
15
00
16
75
18
50
20
25
22
00
22
87
.5
23
75
24
62
.5
26
00
27
75
29
50
Freq(MHz)
dB
Port1_port3_transmission
-85
-65
-45
-25
-5
Freq(
MHz)
80.7
22
169.
063
257.
405
345.
747
434.
089
522.
43
610.
772
699.
114
787.
456
875.
797
964.
139
1020
1055
1090
1125
1160
1195
1230
1325
1500
1675
1850
2025
2200
2287
.5
2375
2462
.5
2600
2775
2950
Freq(MHz)
dB
Figure 3.3A – Test Plots before Temperature Testing.

Page 15 of 29
3.3.2 Functional Test Results After Temperature testing The 76 units were functionally re-tested after High Temperature Life Stabilization Bake and Thermal Shock. All 76 units continue to pass specification. The test results after Temperature testing are plotted in Figure 3.3B below.
Port1_reflection
-45
-35
-25
-15
-5
5
Freq(
MHz)
80.7
22
169.
063
257.
405
345.
747
434.
089
522.
43
610.
772
699.
114
787.
456
875.
797
964.
139
1020
1055
1090
1125
1160
1195
1230
1325
1500
1675
1850
2025
2200
2287
.523
75
2462
.526
0027
7529
50
Freq(MHz)
dB
Port2_port3_transmission
-120
-95
-70
-45
-20
5
Fre
q(M
Hz)
80
.72
2
16
9.0
63
25
7.4
05
34
5.7
47
43
4.0
89
52
2.4
3
61
0.7
72
69
9.1
14
78
7.4
56
87
5.7
97
96
4.1
39
102
0
105
5
109
0
112
5
116
0
119
5
123
0
132
5
150
0
167
5
185
0
202
5
220
0
22
87
.5
237
5
24
62
.5
260
0
277
5
295
0
Freq(MHz)
dB

Page 16 of 29
Port1_port2_transmission
-100
-80
-60
-40
-20
0F
req
(MH
z)
80
.72
2
16
9.0
63
25
7.4
05
34
5.7
47
43
4.0
89
52
2.4
3
61
0.7
72
69
9.1
14
78
7.4
56
87
5.7
97
96
4.1
39
102
0
105
5
109
0
112
5
116
0
119
5
123
0
132
5
150
0
167
5
185
0
202
5
220
0
22
87.5
237
5
24
62.5
260
0
277
5
295
0
Freq(MHz)
dB
Port1_port3_transmission
-85
-65
-45
-25
-5
Freq(
MHz)
80.7
22
169.
063
257.
405
345.
747
434.
089
522.
43
610.
772
699.
114
787.
456
875.
797
964.
139
1020
1055
1090
1125
1160
1195
1230
1325
1500
1675
1850
2025
2200
2287
.5
2375
2462
.5
2600
2775
2950
Freq(MHz)
dB
Figure 3.3B – Test Plots after Temperature Testing.

Page 17 of 29
Test Group 4: 4.1 Convection Oven Profile: 4.1.1 Test Purpose: The purpose of this test is to determine the resistance of the part to high temperature experienced during Convection Oven reflow. 4.1.2 Test Method/Specification: Refer to client’s reflow requirements.
• Test Temperature: 230ºC
• Test Duration: 30seconds. See Figure 4.1A
Figure 4.1A-Reflow Profile 4.1.3 Appearance Inspection: Appearance inspection performed before and after test. 4.1.4 Sample(s) Inspection before Test: Sample(s) Description: MAFL-009272-CD0AC0
Quantity: 10 PCS Appearance Inspection: No visual damage was found on samples before test.
See Photo 4.1B.
4.1.5 Test Procedure: Test Equipment: 7 Zone Convection Reflow Oven.

Page 18 of 29
4.1.6 Test Result(s):
Appearance Check: No visual damage was found on samples after test. See Photo 4.1C.
Photo 4.1B Samples Before Test Photo 4.1C Samples After Test
4.2: Functional Test After Reflow: 4.2.1 Functional Test Results after Convection Reflow The 10 finished good units were functionally tested for Insertion Loss after the Convection oven reflow outlined in section 4.1. All 10 units pass functional specification after reflow. The test results after Convection oven reflow are plotted in Figure 4.2A below.
Port1_reflection
-45
-35
-25
-15
-5
5
Freq(
MHz)
80.7
22
169.
063
257.
405
345.
747
434.
089
522.
43
610.
772
699.
114
787.
456
875.
797
964.
139
1020
1055
1090
1125
1160
1195
1230
1325
1500
1675
1850
2025
2200
2287
.5
2375
2462
.5
2600
2775
2950
Freq(MHz)
dB

Page 19 of 29
Port2_port3_transmission
-120
-95
-70
-45
-20
5
Fre
q(M
Hz)
80
.72
2
16
9.0
63
25
7.4
05
34
5.7
47
43
4.0
89
52
2.4
3
61
0.7
72
69
9.1
14
78
7.4
56
87
5.7
97
96
4.1
39
10
20
10
55
10
90
11
25
11
60
11
95
12
30
13
25
15
00
16
75
18
50
20
25
22
00
22
87
.5
23
75
24
62
.5
26
00
27
75
29
50
Freq(MHz)
dB
Port1_port2_transmission
-100
-80
-60
-40
-20
0
Fre
q(M
Hz)
80
.722
16
9.0
63
25
7.4
05
34
5.7
47
43
4.0
89
52
2.4
3
61
0.7
72
69
9.1
14
78
7.4
56
87
5.7
97
96
4.1
39
10
20
10
55
10
90
11
25
11
60
11
95
12
30
13
25
15
00
16
75
18
50
20
25
22
00
22
87.5
23
75
24
62.5
26
00
27
75
29
50
Freq(MHz)
dB
Port1_port3_transmission
-85
-65
-45
-25
-5
Freq(
MHz)
80.7
22
169.
063
257.
405
345.
747
434.
089
522.
43
610.
772
699.
114
787.
456
875.
797
964.
139
1020
1055
1090
1125
1160
1195
1230
1325
1500
1675
1850
2025
2200
2287
.5
2375
2462
.5
2600
2775
2950
Freq(MHz)
dB
Figure 4.2A – Test Plots after Reflow.
Page 20 of 29
Test Group 5: 5.1 Salt Atmosphere Test: SGS Report Reference: SZRL06006F/2009 –Section 7. 5.1.1 Test Purpose: This test provides a controlled corrosive environment which has been utilized to produce relative corrosion resistance information for specimens of metals and coated metals exposed in a given test chamber. 5.1.2 Test Method/Specification: Refer to Mil-STD-883G Method 1009.8 condition A.
• Concentration of salt solution: 0.5%�3.0% NaCl (m/m)
• Chamber temperature: 35ºC
• PH of salt solution at (35±2) ºC: 6.5�7.2
• Exposure period: 24h
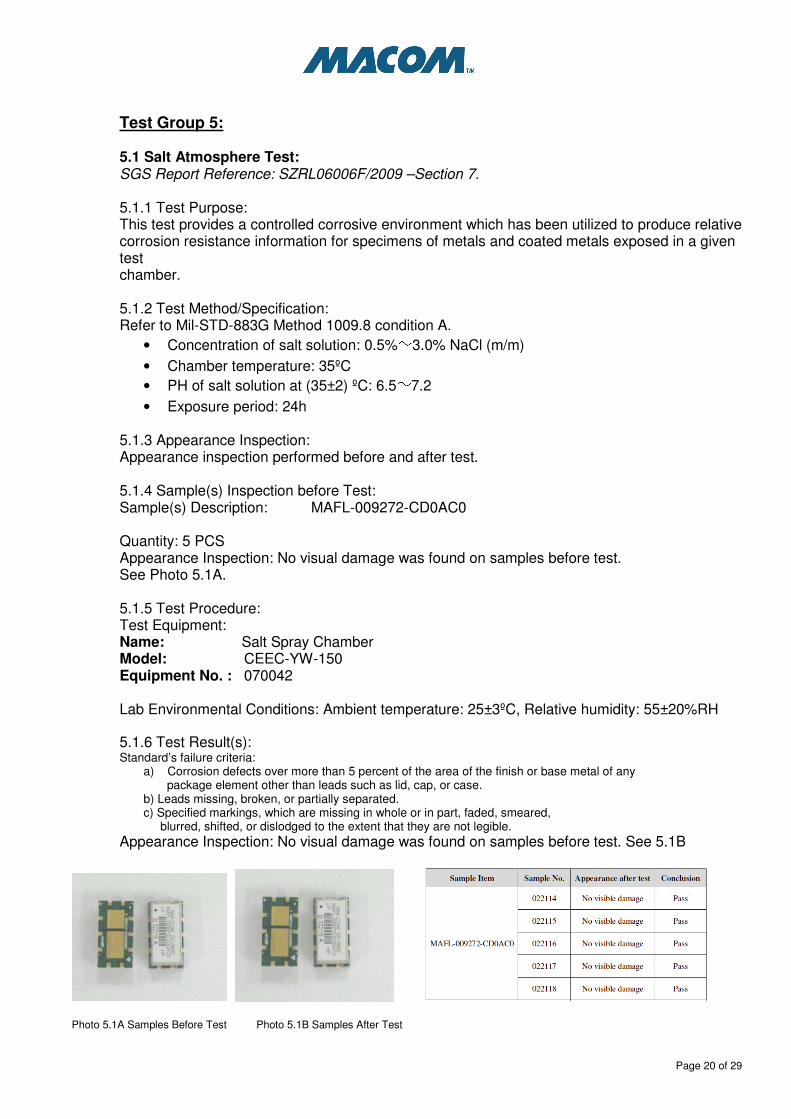
5.1.3 Appearance Inspection: Appearance inspection performed before and after test. 5.1.4 Sample(s) Inspection before Test: Sample(s) Description: MAFL-009272-CD0AC0 Quantity: 5 PCS Appearance Inspection: No visual damage was found on samples before test. See Photo 5.1A. 5.1.5 Test Procedure: Test Equipment: Name: Salt Spray Chamber Model: CEEC-YW-150 Equipment No. : 070042 Lab Environmental Conditions: Ambient temperature: 25±3ºC, Relative humidity: 55±20%RH 5.1.6 Test Result(s): Standard’s failure criteria:
a) Corrosion defects over more than 5 percent of the area of the finish or base metal of any package element other than leads such as lid, cap, or case. b) Leads missing, broken, or partially separated. c) Specified markings, which are missing in whole or in part, faded, smeared, blurred, shifted, or dislodged to the extent that they are not legible.
Appearance Inspection: No visual damage was found on samples before test. See 5.1B
Photo 5.1A Samples Before Test Photo 5.1B Samples After Test

Page 21 of 29
Test Group 6:
6.1 Pressure Cooker Test: SGS Report Reference: SZRL06006F/2009 –Section 8. 6.1.1 Test Purpose: This test is performed to evaluate the moisture resistance integrity of non-hermetic packaged solid state devices using moisture condensing or moisture saturated steam environments. 6.1.2 Test Method/Specification: Refer to JESD22-A-102-C and client’s requirements.
• Vapor pressure: 15 PSI
• Test Temperature: 121ºC
• Test Duration: 96hours 6.1.3 Appearance Inspection: Appearance inspection performed before and after test. 6.1.4 Sample(s) Inspection before Test: Sample(s) Description: MAFL-009272-CD0AC0 Quantity: 38 PCS Appearance Inspection: No visual damage was found on samples before test. 6.1.5 Test Procedure: Test Equipment: Name: Pressure Cooker Tester Brand: KSON Model: PCT-S/S022 Lab Environmental Conditions: Ambient temperature: 25±3ºC, Relative humidity: 55±20%RH. 6.1.6 Test Result(s):
Appearance Check: No visual damage was found on samples after test. See Photo 6.1B
Photo 6.1B Sample After Test

Page 22 of 29
6.2 Temp/Humidity Test: SGS Report Reference: SZRL06006F/2009 –Section 9. 6.2.1Test Purpose: This test is performed for the purpose of evaluating the reliability of non-hermetic packaged solid-state devices in humid environments. 6.2.2 Test Method/Specification: Refer to JESD22-A-101-B and client’s requirements.
• Test Temperature: 85ºC
• Test Humidity: 85%RH • Test Duration: 500hours
6.2.3 Appearance Inspection: Appearance inspection performed before and after test. 6.2.4 Sample(s) Inspection before Test: Sample(s) Description: MAFL-009272-CD0AC0 Quantity: 38 PCS (after Pressure Cooker Test) Appearance Inspection: No visual damage was found on samples before test. See Photo 6.2B. 6.2.5 Test Procedure: Test Equipment: Name: Triple Temp & Humidity Chamber Brand: GIANT FORCE Model: GTH-162TR-SP/MAA0605-012 Lab Environmental Conditions: Ambient temperature: 25±3ºC, Relative humidity: 55±20%RH. 6.2.6 Test Result(s):
Appearance Check: Slight Oxidation after test – but acceptable. See Photo 6.2C.
Photo 6.2B Sample Before Test Photo 6.2C Samples After Test

Page 23 of 29
6.3: Functional Test: 6.3.1 Initial Functional Test Results: The 38 units were functionally tested for Insertion loss before being subjected to Pressure Cooker and Temp/Humidity testing outlined in sections 6.1 & 6.2. All 38 units passed to specification. The initial test results are plotted in Figure 6.3A below.
Port1_reflection
-45
-35
-25
-15
-5
5
Freq
(MHz)
80.722
169.
063
257.
405
345.74
7
434.
089
522.
43
610.
772
699.
114
787.45
6
875.79
7
964.
139
1020
1055
1090
1125
1160
1195
1230
1325
1500
1675
1850
2025
2200
2287
.5
2375
2462
.5
2600
2775
2950
Freq(MHz)
dB
Port2_port3_transmission
-120
-95
-70
-45
-20
5
Fre
q(M
Hz)
80.7
22
169.0
63
257.4
05
345.7
47
434.0
89
522.4
3
610.7
72
699.1
14
787.4
56
875.7
97
964.1
39
1020
1055
1090
1125
1160
1195
1230
1325
1500
1675
1850
2025
2200
2287.5
2375
2462.5
2600
2775
2950
Freq(MHz)
dB

Page 24 of 29
Port1_port2_transmission
-100
-80
-60
-40
-20
0
Fre
q(M
Hz)
80.7
22
169.0
63
257.4
05
345.7
47
434.0
89
522.4
3
610.7
72
699.1
14
787.4
56
875.7
97
964.1
39
1020
1055
1090
1125
1160
1195
1230
1325
1500
1675
1850
2025
2200
2287.5
2375
2462.5
2600
2775
2950
Freq(MHz)
dB
Port1_port3_transmission
-85
-65
-45
-25
-5
Freq(
MHz)
80.7
22
169.
063
257.
405
345.
747
434.
089
522.
43
610.
772
699.
114
787.
456
875.
797
964.
139
1020
1055
1090
1125
1160
1195
1230
1325
1500
1675
1850
2025
2200
2287
.5
2375
2462
.5
2600
2775
2950
Freq(MHz)
dB
Figure 6.3A – Test Plots before Pressure Cooker and Temp/Humidity testing.

Page 25 of 29
6.3.2 Functional Test Results After Pressure & Humidity testing: The 38 units were functionally re-tested after Pressure Cooker and Temp/Humidity testing. All 38 units continue to pass specification. The test results after Temperature testing are plotted in Figure 6.3B below.
Port1_reflection
-45
-35
-25
-15
-5
5
Freq(
MHz)
80.7
22
169.
063
257.
405
345.
747
434.
089
522.
43
610.
772
699.
114
787.
456
875.
797
964.
139
1020
1055
1090
1125
1160
1195
1230
1325
1500
1675
1850
2025
2200
2287
.5
2375
2462
.5
2600
2775
2950
Freq(MHz)
dB
Port2_port3_transmission
-120
-95
-70
-45
-20
5
Fre
q(M
Hz)
80
.72
2
16
9.0
63
25
7.4
05
34
5.7
47
43
4.0
89
52
2.4
3
61
0.7
72
69
9.1
14
78
7.4
56
87
5.7
97
96
4.1
39
102
0
105
5
109
0
112
5
116
0
119
5
123
0
132
5
150
0
167
5
185
0
202
5
220
0
22
87
.5
237
5
24
62
.5
260
0
277
5
295
0
Freq(MHz)
dB

Page 26 of 29
Port1_port2_transmission
-100
-80
-60
-40
-20
0
Fre
q(M
Hz)
80
.72
2
16
9.0
63
25
7.4
05
34
5.7
47
43
4.0
89
52
2.4
3
61
0.7
72
69
9.1
14
78
7.4
56
87
5.7
97
96
4.1
39
10
20
10
55
10
90
11
25
11
60
11
95
12
30
13
25
15
00
16
75
18
50
20
25
22
00
22
87
.5
23
75
24
62
.5
26
00
27
75
29
50
Freq(MHz)
dB
Port1_port3_transmission
-85
-65
-45
-25
-5
Freq(
MHz)
80.7
22
169.
063
257.
405
345.
747
434.
089
522.
43
610.
772
699.
114
787.
456
875.
797
964.
139
1020
1055
1090
1125
1160
1195
1230
1325
1500
1675
1850
2025
2200
2287
.5
2375
2462
.5
2600
2775
2950
Freq(MHz)
dB
Figure 6.3B – Test Plots after Pressure Cooker and Temp/Humidity testing.

Page 27 of 29
Test Group 7:
7.1 Lead Material & plating:
7.1.1 Test Purpose: Measurements performed to verify that the lead plating thickness and composition meet specification.
7.1.2 Test Method/Specification: Refer to Substrate material drawing 1000035332-CTJC000 for plating specification.
• Plating Thickness: o Ni: 3-5µm, o Au: (flash) 0.1 -.05µm
7.1.3 Sample(s) Inspection before Test: Sample(s) Description: MAFL-009272-CD0AC0 Quantity: 3 PCS Appearance Inspection: No visual damage was found on samples before test. 7.1.4 Test Procedure: XRF and cross sectional analysis. 7.1.5. Test Results: Lead plating on all samples meet the required thickness and composition specifications. See Photo 7.1A
Photo 7.1A- Cross Section of sample and thickness measurements.

Page 28 of 29
7.2 Glass Transition Test: 7.2.1 Test Purpose
7.2.2 Test Method/Specification
7.2.3 Sample(s) Inspection before Test:
Photo 7.2A Sample Before Test
7.2.4 Test Setup
Page 29 of 29
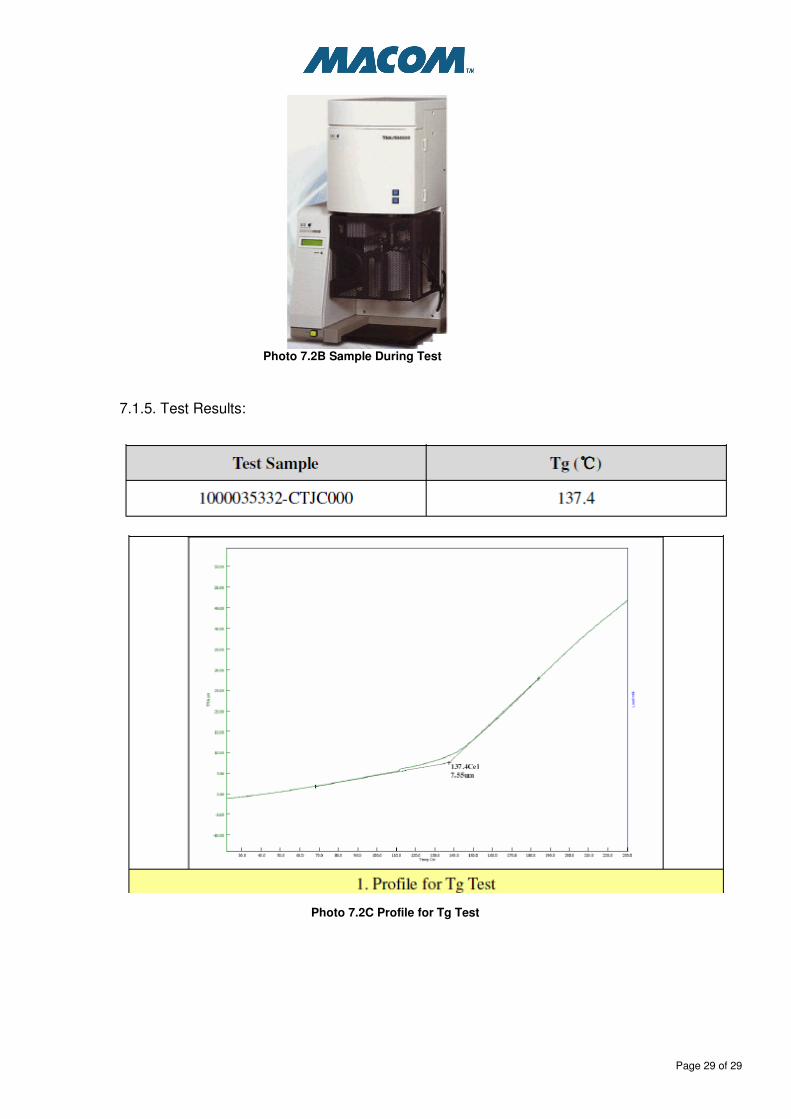
Photo 7.2B Sample During Test
7.1.5. Test Results:
Photo 7.2C Profile for Tg Test


