Reliability of Miniaturized Transistors from the ...
21
micromachines Review Reliability of Miniaturized Transistors from the Perspective of Single-Defects Michael Waltl Christian Doppler Laboratory for Single-Defect Spectroscopy (SDS) at the Institute for Microelectronics, TU Wien, Gusshausstrasse 27-29/E360, 1040 Vienna, Austria; [email protected] Received: 18 June 2020; Accepted: 27 July 2020; Published: 29 July 2020 Abstract: To analyze the reliability of semiconductor transistors, changes in the performance of the devices during operation are evaluated. A prominent effect altering the device behavior are the so called bias temperature instabilities (BTI), which emerge as a drift of the device threshold voltage over time. With ongoing miniaturization of the transistors towards a few tens of nanometer small devices the drift of the threshold voltage is observed to proceed in discrete steps. Quite interestingly, each of these steps correspond to charge capture or charge emission event of a certain defect in the atomic structure of the device. This observation paves the way for studying device reliability issues like BTI at the single-defect level. By considering single-defects the physical mechanism of charge trapping can be investigated very detailed. An in-depth understanding of the intricate charge trapping kinetics of the defects is essential for modeling of the device behavior and also for accurate estimation of the device lifetime amongst others. In this article the recent advancements in characterization, analysis and modeling of single-defects are reviewed. Keywords: device reliability; nanoscale transistor; bias temperature instabilities (BTI); defects; single-defect spectroscopy; non-radiative multiphonon (NMP) model; time-dependent defect spectroscopy 1. Introduction The complementary metal-oxide-semiconductor (CMOS) technology is the cornerstone of a vast number of integrated circuits, which are the building blocks of numerous electronic applications. Such circuits typically consist of a large number nMOS and pMOS transistors and their performance and geometry have been successively improved over the last decades. For instance, the width and length of the transistors have been reduced and the gate insulating layers have been thinned. Furthermore new device geometries such as FinFETs [1–3] and gate-all-around FETs [4–7] have been introduced. Notwithstanding this development, the reliable operation of the transistors at their nominal bias conditions is of utmost importance for all technologies. However, the most fundamental device parameters like the threshold voltage, the sub-threshold slope and the on-current, are affected by charge trapping at defects in the atomic structure of the devices. Such defects can be located at the interface between the insulator and substrate, but also inside the insulator and inside the semiconductor bulk material. In order to reduce the defect density of transistors post-oxidation annealing (POA) processes are applied during the fabrication process. The decisive importance of POA for improving the performance of transistors becomes even more obvious when Si and SiC based MOS devices are compared. While H 2 annealing is regularly used within CMOS processes [8–10] similar POA steps could not lead to an improvement of the electron mobility in SiC devices [11]. However, by using NO or NH 3 for POA, a considerable increase in carrier mobility can be observed for SiC MOS transistors [12,13]. Micromachines 2020, 11, 736; doi:10.3390/mi11080736 www.mdpi.com/journal/micromachines
Transcript of Reliability of Miniaturized Transistors from the ...

micromachines
Review
Reliability of Miniaturized Transistorsfrom the Perspective of Single-Defects
Michael Waltl
Christian Doppler Laboratory for Single-Defect Spectroscopy (SDS) at the Institute for Microelectronics,TU Wien, Gusshausstrasse 27-29/E360, 1040 Vienna, Austria; [email protected]
Received: 18 June 2020; Accepted: 27 July 2020; Published: 29 July 2020�����������������
Abstract: To analyze the reliability of semiconductor transistors, changes in the performance of thedevices during operation are evaluated. A prominent effect altering the device behavior are the socalled bias temperature instabilities (BTI), which emerge as a drift of the device threshold voltage overtime. With ongoing miniaturization of the transistors towards a few tens of nanometer small devicesthe drift of the threshold voltage is observed to proceed in discrete steps. Quite interestingly, each ofthese steps correspond to charge capture or charge emission event of a certain defect in the atomicstructure of the device. This observation paves the way for studying device reliability issues like BTIat the single-defect level. By considering single-defects the physical mechanism of charge trappingcan be investigated very detailed. An in-depth understanding of the intricate charge trapping kineticsof the defects is essential for modeling of the device behavior and also for accurate estimation of thedevice lifetime amongst others. In this article the recent advancements in characterization, analysisand modeling of single-defects are reviewed.
Keywords: device reliability; nanoscale transistor; bias temperature instabilities (BTI); defects;single-defect spectroscopy; non-radiative multiphonon (NMP) model; time-dependent defectspectroscopy
1. Introduction
The complementary metal-oxide-semiconductor (CMOS) technology is the cornerstone of a vastnumber of integrated circuits, which are the building blocks of numerous electronic applications. Suchcircuits typically consist of a large number nMOS and pMOS transistors and their performance andgeometry have been successively improved over the last decades. For instance, the width and lengthof the transistors have been reduced and the gate insulating layers have been thinned. Furthermorenew device geometries such as FinFETs [1–3] and gate-all-around FETs [4–7] have been introduced.Notwithstanding this development, the reliable operation of the transistors at their nominal biasconditions is of utmost importance for all technologies. However, the most fundamental deviceparameters like the threshold voltage, the sub-threshold slope and the on-current, are affected bycharge trapping at defects in the atomic structure of the devices. Such defects can be located at theinterface between the insulator and substrate, but also inside the insulator and inside the semiconductorbulk material. In order to reduce the defect density of transistors post-oxidation annealing (POA)processes are applied during the fabrication process. The decisive importance of POA for improvingthe performance of transistors becomes even more obvious when Si and SiC based MOS devicesare compared. While H2 annealing is regularly used within CMOS processes [8–10] similar POAsteps could not lead to an improvement of the electron mobility in SiC devices [11]. However,by using NO or NH3 for POA, a considerable increase in carrier mobility can be observed for SiC MOStransistors [12,13].
Micromachines 2020, 11, 736; doi:10.3390/mi11080736 www.mdpi.com/journal/micromachines

Micromachines 2020, 11, 736 2 of 21
Although a number of defects can become passivated using POA during fabrication,the interaction of high energetic carriers with atoms at the semiconductor/insulator interfaceduring operation can break Si-H bonds and can lead to an electrically active dangling bond [14].The bond rupture mechanism leading to the creation of interface states is typically referred tohot-carrier-degradation (HCD). In order to explain HCD in miniaturized devices the physical originfor HCD has been recently extended to cold carriers, where a series of collisions with low energeticparticles can also lead to the creation of interfaces states [15]. Such an increase of dangling bonds atthe interface can be observed as decrease of the device mobility, due to an increase of the interfacescattering of carriers. The reduced mobility evolves as a reduction in the sub-threshold slope and canbe for instance observed when IDVG measurements are performed [16,17], but can also be evaluatedas the CV characteristics of the device alters [18].
Another important reliability issue in miniaturized devices is the so called bias temperatureinstabilities (BTI) [19–24]. BTI typically manifest as a drift of the drain-source current over time whenconstant biases are applied to a transistor, and is studied up electric oxide fields of Eox ≤ 8 MV/cm.The physical origin of this phenomenon is charge trapping at defects which can be located at thesemiconductor/oxide interface or directly in the oxide. The impact of BTI on the device behavior ismostly expressed in terms of an equivalent shift of the threshold voltage ∆Vth, which can for instancebe calculated from the current measurement data using an initial IDVG characteristics of a device,when traditional measurement tools are used [25]. Alternatively, employing the fast-Vth method,where the gate bias is controlled by an operational amplifier in order to obtain a constant current fluxthrough the device, allows for direct measurement of the ∆Vth [26]. A typical temporal drift of thesource current which can be measured when BTI is studied is shown in Figure 1 (left).
10 4 10 2 100 102
Measurement Time [s]
320
310
300
290
280
270
Sour
ce C
urre
nt [
nA]
pMOS TransistorW x L = 10 m x 10 mT=100°C, ts=1ksVGs/VGr/=-2.4V/-0.5V
10 4 10 2 100 102
Measurement Time [s]
440
420
400
380
Sour
ce C
urre
nt [
nA]
pMOS TransistorW x L = 150nm x 120nmT=100°C, ts=1ksVGs/VGr/=-2.4V/-0.5V
Figure 1. The main difference in the bias temperature instabilities (BTI) behavior of large-area andnanoscale devices is the number of defects contributing to the device behavior, and also the amplitudeof impact of a single defect on the current flux through the device. (left) While in large-area devices anumber of defects is responsible for a continuous drift of the drain-source current over time (right) thecharge transitions of defects can be directly observed as discrete steps in the respective current signalrecorded from nanoscale metal-oxide-semiconductor (MOS) transistors.
The inset indicates the number of defects affecting the device behavior. Quite interestingly,although the same physical mechanism are responsible for charge trapping in large-area andminiaturized devices, the picture of the drift of the device current is different for the scaled MOStransistors, see Figure 1 (right). While the source-current exhibits a continuous drift at large-areadevices, charge trapping evolves in discrete steps of the device current, recorded at nanoscale MOStransistors. This is due to the fact that scaling of the devices on the one hand reduces the number ofdefects per device, but on the other hand the impact of a single defect on the overall device behaviorgets considerably increased. Thus nanoscale devices inherently provide a zoom mechanism enablingto study charge trapping at the single-defect level.
The discrete steps in the current signal were first documented by Ralls et al. [27] and have sincethen been the basis for a number of investigations considering random telegraph noise (RTN) [28–33]

Micromachines 2020, 11, 736 3 of 21
aiming at the analysis of the physical origin of charge trapping. An significant advantage of evaluatingRTN to conventional trapping analysis is that the charge capture and charge emission times can beextracted directly from single measurement traces. However, as only defects with a trap level closeto the Fermi level of the conducting channel produce RTN signals tracing the bias and temperaturedependence of the charge trapping kinetics of certain defect is limited to a very narrow bias andtemperature range. To overcome this limitation and to enable a thorough study of the trapping behaviorof a multitude of defects the time-dependent defect spectroscopy (TDDS) has been proposed [34,35].The measurement sequences used for TDDS relies on the measure-stress-measure (MSM) scheme,which will be discussed in the following. Afterwards the TDDS is presented and finally charge trappingmodels and recent results from single defect studies are reviewed.
2. Measurement Techniques for Characterization of Devices
Over the recent years a number of measurement methods have been developed in order toproperly characterize the impact of defects on the device behavior. Most of the methods aim at applyinga high stress bias for a specific period of time, and afterwards the state of the device is evaluatedconsidering various ways. For instance stress-IV measurements, where IDVG sweeps are measuredafter a stress cycle has elapsed [17] have been used, but also hysteresis measurements [36,37], CVmeasurements [38,39], DLTS measurements [40–44] and on-the-fly methods [45–47] have been appliedfor assessment of the impact of charge trapping on the device performance. A common observation ofthe many measurement techniques used is that the ∆Vth is observed to recover very fast, as soon as thestress bias is released [26,48–50]. To circumvent this limitation ultra-fast measurement setups havebeen developed [51,52]. With these methods short measurement delays of a few tens of nanosecondscan be achieved, whereas conventional tools exhibit delays in the hundreds of microseconds regime.The ultra-fast methods clearly reveal a significantly larger ∆Vth [52] at nanoseconds delays. However,a considerable disadvantage of the high-speed methods is a typically high measurement noise of morethan 10 mV in ∆Vth, as the signal-noise-ratio decreases at higher signal bandwidth. Thus the ultra-fastmethods do not allow to resolve single charge transitions which are typically in the order of a fewmicrovolt up to 10–15 mV [53,54]. However, a high measurement resolution is inevitable to study thephysical mechanism of charge trapping, which has to be performed at the single defect level.
To perform single defect spectroscopy MSM sequences are typically used. Patterns for MSMcharacterization of charge trapping in large-area devices and miniaturized transistors are shownin Figure 2, and rely on repeatedly applying stress and recovery cycles.
VDs
VDr
Drai
n Bi
as
. . . . . .
Stress cycleRecovery cycle
Measurement Time
VGr
VGs
Gate
Bia
s
1 2 . . . . . .
. . . . . .
N
Stress cycleRecovery cycle
VDs
VDr
Drai
n Bi
as
. . . .
Stress cycleRecovery cycle
Measurement Time
VGr
VGs
Gate
Bia
s
1 2 3 . . . .
. . . .
N
Stress cycleRecovery cycle
Figure 2. Schematic of the bias signals which are typically used for the measure-stress-measure(MSM) scheme which is applied for (left) the characterization of large-area devices, and (right) fordefect-spectroscopy in nanoscale devices. An IDVG sweep is measured within a narrow gate bias rangebefore the first stress cycle is applied. While the stress and recovery times are successively increasedafter each cycle for the characterization of large-area devices, N repetitions of the same sequence areperformed when single-defects in nanoscale devices are studied.

Micromachines 2020, 11, 736 4 of 21
Before the first stress cycle is applied, an IDVG sweep within a narrow gate bias range is typicallyperformed. As mentioned before, the IDVG characteristics serves for the calculation of the ∆Vth fromthe recorded drain-source current in a post-processing step. The narrow bias range of the voltagesweep is important in order to preserve the pristine state of the device, as a gate voltage sweepover a too wide bias range can already cause considerable degradation of the device characteristics.If large-area devices are characterized the stress and recovery time of the subsequent measurementcycles are continuously increased for each cycle. By doing so the number of traps which can contributeto the drift of the threshold voltage ∆Vth successively increase. It has to be noted that, in order toaccurately explain the so measured temporal behavior of ∆Vth the entire measurement sequence has tobe simulated [55], as the ∆Vth also shows a considerable permanent degradation, that is, the ∆Vth doesnot vanish at the end of each recovery trace, and otherwise the permanent part would not be describedby the simulations. In contrast to MSM sequences with increasing stress/recovery times applied forthe characterization of large-area devices, the a fixed timing is used for stress/recovery cycles whenTDDS measurements employing scaled transistors are performed. The main idea is that the defectswhich emit their charge during the recovery cycle get charged in the next stress cycle again and soon. In this way statistical information on charge capture and emission of defects can be collected andevaluated, which will be discussed in Section 4 in more detail.
An important criterion when applying MSM measurements is the energetic and spatialdistribution of the traps which can contribute to the measurement signal. One condition for chargetrapping concerns the timing of the MSM sequence and the charge capture and charge emission timeof the defects at the respective bias condition and device temperature. The second boundary conditionfor charge trapping is defined by the stress and recovery bias used for the experiment. These biasesdetermine the so called active energy region (AER) for charge trapping which is shown in Figure 3 forthe NBTI/pMOS case.
2.0 1.5 1.0 0.5 0.0Distance [nm]
6
4
2
0
2
4
Ener
gy [
eV]
EGH = -8.1MV/cmEGL = -1.3MV/cm
SiO2 Si
pMOS: Stress Measure
Figure 3. The band-diagram of a pMOS transistor is shown with a possible trap band of defects beingresponsible for the drift of the threshold voltage when negative BTI (NBTI) is considered. Also shownis the active energy region (AER, green area) for charge trapping which defines the energetic area of thedefects which can contribute to the measurement signal at given bias conditions. The transition regionshown in the band-diagram between the Si bulk material and the insulator which is in accordance withab-initio calculations [56–58]. Quite recently, BTI in various technologies has been successfully explainusing the modified band-structure [55].
In principle, the defects which exhibit a trap level below the Fermi level of the channel canbecome charged, and the defects with a trap level above the Fermi level remain neutral. Thus thekey prerequisite of a defect to change its charge state during an MSM cycle is that its trap level isshifted below the Fermi level of the channel during the stress phase, but lies above the same duringthe recovery phase. The green area shown in Figure 3 is the energetic region where this conditionis fulfilled, and thus marks the energetic area for defects which can affect the device behavior. Also

Micromachines 2020, 11, 736 5 of 21
shown is the hole trap band, which has been extracted for planar pMOS devices employing MSMmeasurements [55]. For this the reliability simulator Comphy has been used, which relies on thenon-radiative multiphonon (NMP) defect model [34]. Next, the main properties of BTI are brieflydiscussed and afterwards defect models used to explain charge trapping are outlined.
3. Patterns of Bias Temperature Instabilities
The impact of BTI on the device characteristics is typically expressed in terms of an equivalentshift of the device threshold voltage ∆Vth, which can be calculated from the drain-source currentbehavior using an IDVG characteristics [59]. In general, the impact of BTI on devices can be classifiedinto positive BTI (PBTI), where a positive gate bias is applied at the gate terminal of the MOS transistorduring stress, and negative BTI (NBTI), which is referred to when a negative stress bias is used [60].In the literature mostly the NBTI/pMOS case is considered as in this case the ∆Vth appears morepronounced compared to the PBTI/nMOS case. The main reason lies in the about ten times highertrap density present in pMOS devices compared to their nMOS counterparts [61], which makesthe assessment of the later with generalized measurement difficult. It has to be mentioned at thispoint, that recently a custom-designed defect probing instrument has been proposed and used tocharacterized NBTI and PBTI at ∆Vth resolution of a few tens of micro-volts [53]. Despite the challengesfor instrumentation, the experiments are typically conducted at accelerated stress conditions, thatis, significantly larger biases and temperatures, as used for nominal device operation. The ideais to accelerate device degradation and recovery and to calibrate the models to the correspondingmeasurement data. Afterwards, the calibrated tools are used to estimate the impact of BTI on thedevice performance at normal operating conditions. This procedure, however, requires accuratephysical models in order to ensure high quality of the extrapolations. Thus suitable models have to beable to explain the different patterns of BTI at various stress and recovery bias conditions and alsocapture the temperature activation of charge trapping. The most basic properties of BTI are brieflysummarized next.
3.1. Temperature Dependence of Charge Emission Times
Several recovery traces recorded at the same stress and biases conditions but at differenttemperatures are shown in Figure 4 (left) for a large-area transistor. The traces have been normalizedto ∆Vth(tr = 1 ms). As can be seen, a similar trend for the recovery behavior of the ∆Vth can beobserved at different temperatures. This indicates, that only a weak temperature dependence of chargetrapping can be extracted from these measurements, which is an important parameter for developingof charge trapping models. But a significant change of the emission time can be observed when theaverage emission time of defects in nanoscale devices is evaluated, see Figure 4 (right). With increasingdevice temperature the defects move towards shorter emission times, clearly indicating a considerabletemperature activation of the charge trapping kinetics. Although both cases rely on the same physicalmechanisms, significant differences in thermal activation can be observed. This underlines once morethe importance of investigating the behavior of individual defects in detail and taking this into accountin the models.
Micromachines 2020, 11, 736 6 of 21
10 3 10 1 101 103
Recovery Time [s]
400
300
200
100
0V t
h/V t
h(t=
1ms)
[1]
pMOS Transistor:W x L = 10 m x 10 mVs = 2V, ts = 12ks
T=50°CT=100°CT=150°CT=175°C
1050
V th
[mV]
T = 50°C
#1 #2#3
1050
V th
[mV]
T = 100°C
#1
#2#3
10 3 10 1 101 103
Recovery Time [s]
1050
V th
[mV]
T = 150°C
#1
#2#3
pMOS TransistorW x L = 150nm x 100nm
Figure 4. The temporal recovery behavior of a large-area and a nanoscale pMOS transistor is shown atdifferent device temperatures. (left) Quite interestingly, the recovery traces of a large-area transistorcan show only a very week temperature dependence when normalized to a certain reference value.(right) However, single-defect investigations clearly reveal a significant temperature dependence ofcharge trapping. Also shown here for the nanoscale device are the single recovery traces recorded atthe same bias conditions, stress time and device temperature, which are used to determine the averageemission time of the visible defects.
3.2. Bias Dependence of Charge Trapping
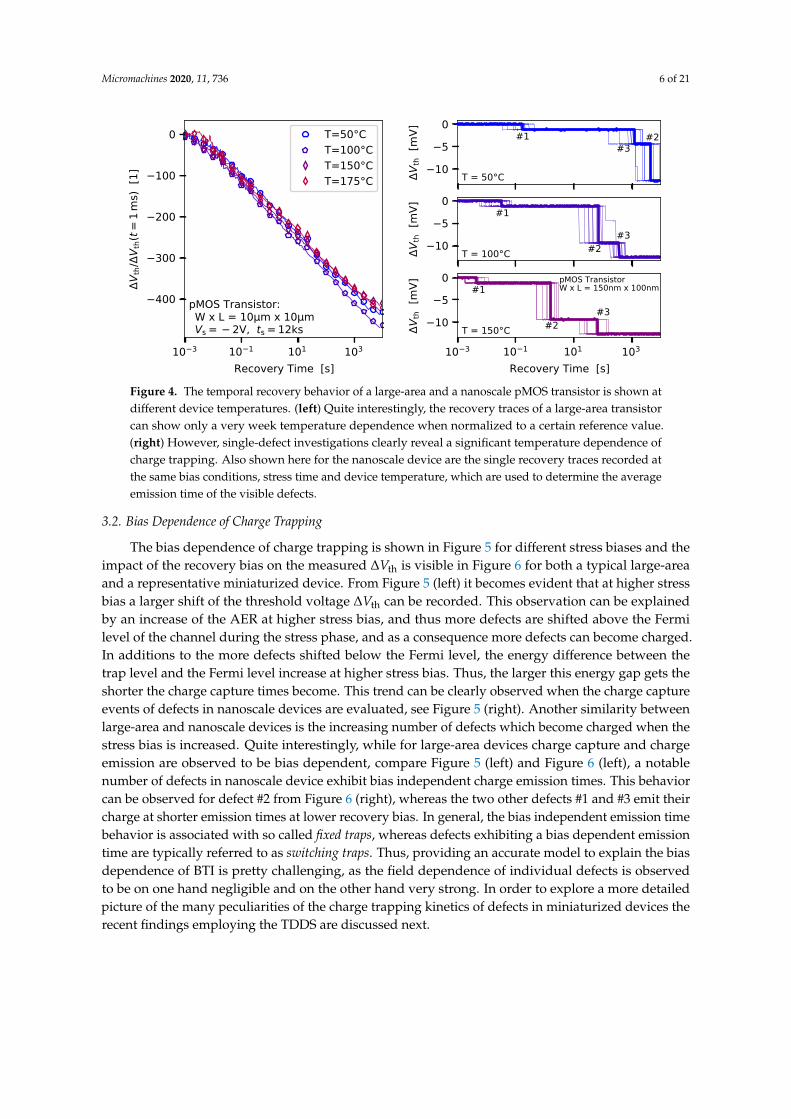
The bias dependence of charge trapping is shown in Figure 5 for different stress biases and theimpact of the recovery bias on the measured ∆Vth is visible in Figure 6 for both a typical large-areaand a representative miniaturized device. From Figure 5 (left) it becomes evident that at higher stressbias a larger shift of the threshold voltage ∆Vth can be recorded. This observation can be explainedby an increase of the AER at higher stress bias, and thus more defects are shifted above the Fermilevel of the channel during the stress phase, and as a consequence more defects can become charged.In additions to the more defects shifted below the Fermi level, the energy difference between thetrap level and the Fermi level increase at higher stress bias. Thus, the larger this energy gap gets theshorter the charge capture times become. This trend can be clearly observed when the charge captureevents of defects in nanoscale devices are evaluated, see Figure 5 (right). Another similarity betweenlarge-area and nanoscale devices is the increasing number of defects which become charged when thestress bias is increased. Quite interestingly, while for large-area devices charge capture and chargeemission are observed to be bias dependent, compare Figure 5 (left) and Figure 6 (left), a notablenumber of defects in nanoscale device exhibit bias independent charge emission times. This behaviorcan be observed for defect #2 from Figure 6 (right), whereas the two other defects #1 and #3 emit theircharge at shorter emission times at lower recovery bias. In general, the bias independent emission timebehavior is associated with so called fixed traps, whereas defects exhibiting a bias dependent emissiontime are typically referred to as switching traps. Thus, providing an accurate model to explain the biasdependence of BTI is pretty challenging, as the field dependence of individual defects is observedto be on one hand negligible and on the other hand very strong. In order to explore a more detailedpicture of the many peculiarities of the charge trapping kinetics of defects in miniaturized devices therecent findings employing the TDDS are discussed next.

Micromachines 2020, 11, 736 7 of 21
10 3 10 1 101 103
Recovery Time [s]
0
5
10
15
20V t
h [m
V]
pMOS TransistorW x L = 10 m x 10 m
Vs = 2VVs = 1.6VVs = 1.2V
10 3 10 1 101 103
Recovery Time [s]
0
2
4
6
8
V th
[mV]
T = 100°C
#1
#2
#3
pMOS TransistorW x L = 150nm x 100nm
Vs=-2.6VVs=-2.2VVs=-1.8VVs=-1.4V
Figure 5. The temporal behavior of the drift of the threshold voltage is shown for pMOS transistorswith two different geometries. (left) For large-area devices a continuous drift of the Vth can be observed.As more defects become charged at higher stress biases the recorded ∆Vth increases too. (right) Innanoscale devices the number of single charge transitions, that is, the number of discrete steps in the∆Vth, increase with higher stress bias. Also the average charge capture time move toward smallervalues at higher stress biases.
10 3 10 2 10 1 100 101 102 103
Recovery Time [s]
0
20
40
60
80
100
V th
[mV]
pMOS TransistorW x L = 10 m x 10 mVs = 2V, ts = 1ks, T = 100C
Vr=-0.8VVr=-0.6VVr=-0.4VVr=-0.2V
10 3 10 1 101 103
Recovery Time [s]
12.5
10.0
7.5
5.0
2.5
0.0
V th
[mV]
T = 100°C
#1
#2
#3
pMOS TransistorW x L = 150nm x 100nm
Vs=-0.2VVs=-0.4VVs=-0.6VVs=-0.8V
Figure 6. The recovery of the threshold voltage for pMOS transistors is shown from the perspective ofa (left) large-area transistors and (right) a nanoscale transistor. In case of large-area devices the ∆Vth
shift which recovers appears to be seemingly lower at lower recover bias. However, the main reasonfor this observation is that the trap level of most of the defects is shifted far above the Fermi level of thechannel, compared to the case for larger recovery biases, which leads to small charge emission timesbelow the measurement delay. Thus, a significant bias dependence of the overall device recovery canbe observed. The recovery behavior of defects from a nanoscale device exhibit emission times whichcan be either change with recovery bias (defects #1 and #3), or can be independent of the selectedrecovery bias (defect #2). Also remarkable is that defects can become shifted outside measurementwindow when the recover bias becomes too large.
4. Time-Dependent Defect Spectroscopy of Metal-Oxide-Semiconductor (MOS) Transistors
Most of the characterization techniques proposed to investigate defect distributions and densitiesat various bias and temperature conditions employing large-area devices. One prominent exampleis the so called deep level transient spectroscopy (DLTS) [40] which has been adopted to extract theinterface state density of MOS transistors [62]. In DLTS the interface traps can get charged by majoritieswhen an accumulation pulse is applied. When the bias is switched to deep inversion, the traps emittheir charge which can be observed as a temporal change in the device capacitance.
The time-dependent defect spectroscopy (TDDS) makes use of the principle of DLTS, applies it tominiaturized devices and augments it by a statistical analysis. The main prerequisite of TDDS is thatthe devices are small enough to reveal charge transition events as discrete steps of measurable sizein the device current. According to recent reports the step height of the defects is proportional to theeffective gate area, that is, η = Aη0 [61,63–66]. In contrast, the number of traps significantly decreases

Micromachines 2020, 11, 736 8 of 21
with the device geometry, that is, NT = NT0/A [66]. Quite remarkable, in most recent technologies lessthan one trap per device can be present, however, its impact can evolve so pronounced that a chargetransition can lead to a serious change of the device characteristics. Thus the proper operation of asingle device can be solely determined by only one defect. Furthermore, the step heights produced bythe individual defects which have been observed in single-defect investigations are widely distributed,ranging from several tens of micro-volts up to more than 30 mV and even higher depending on thedevice geometry [53]. To approximate their distribution an exponential distribution can be used [53,67].The detection limit of the steps is basically given by the limited drain/source current measurementresolution of the instruments used. Note that for TDDS often custom-designed circuits are usedenabling highest measurement resolution and performance [53].
The procedure to extract their charge transition kinetics, that is, their respective charge captureand emission times, as well as their steps heights will be discussed next in great detail.
4.1. Extraction of Charge Emission Time
To extract the average charge emission time at a certain gate bias the measure-stress-measure(MSM) scheme from Figure 2 (right) is applied. As already mentioned, during the stress phase a numberof defects is energetically shifted below the Fermi level of the channel can become charged. After acertain stress time has elapsed the gate bias is switched to a recovery bias, and the current through thedevice is recorded, and afterwards mapped to an equivalent ∆Vth which is shown in Figure 7 (top).
8
6
4
2
0
V th
[mV]
N = 38pMOS TransistorW x L = 90nm x 35nmts = 0.1s, Vs/Vr=-2.2V/-0.6V
10 4 10 3 10 2 10 1 100
Emission Time [s]
5
0
Step
Hei
ght
[mV]
Figure 7. To extract the average charge capture time of a defect at a certain recovery bias theMSM sequence from Figure 2 (right) is applied, and N cycles at the same biases, temperature andstress/recovery times are measured. (top) The discrete steps in each recovery trace are extracted andbinned into a (bottom) 2D histogram, which is called spectral map. In case that a number of emissionevents from a certain defect is available, a cluster is formed in the spectral map. Each of the clusterscan be considered the finger print of a defect. The dashed lines in the spectral map indicate the averageemission time, and the average step height, of the defect.
If the device is small enough discrete steps, which correspond to charge emission events of defects,can be observed. Afterwards, a step detection algorithm is applied to the measurement data in order toextract the charge transition events [68,69], which are then binned into a 2D histogram called spectralmap, see Figure 7 (bottom). As can be seen, the charge emission transitions form a cluster in thespectral map, which is considered the fingerprint of the defect. The average step height of the defectscan be considered to follow a normal distribution due to the measurement noise. To check for thedistribution of the single emission time instances the bull percentile function can be analyzed [70,71],see Figure 8 (left).

Micromachines 2020, 11, 736 9 of 21
10 4 10 3 10 2 10 1 100 101
Emission Time [s]
0.1
0.7
7.9
63.2
100.0ln
(-ln(
1-F)
) [%
] = 1.00 = 116.72m
log( e) - log( )
10 4 10 3 10 2 10 1 100
Emission Time [s]
0
50
100
150
Freq
uenc
y [1
]
Defect #ANe/N = 997/1000Exponential Function:
e = 117ms ± 4ms Mean:
e = 116ms
Figure 8. (left) The Weibull percentile function of the emission times indicates that the emissiontimes follow an exponential distribution. (right) By binning the emission times into a histogramand applying the exponential distribution function the average emission time of the defect can becalculated. An almost equal average emission time is obtained when the mean value of transition timesis calculated.
For this the probability estimator [72]
F =i− 0.3
Ne + 0.4, (1)
with i being the rank of the data point in the emission time series sorted in ascending order, and Ne isthe total number of emission events which are assigned to a certain defect. In case of β = 1, as canbe seen for the log-linear function in Figure 8 (left), the Weibull distribution function transfers to anexponential distribution function
fWB(x) = λβ(λx)β−1e−(λx)β β=1−−−−−−→ fEXP(x) = λe−λx, (2)
with λ = 1/τe. Alternatively, the exponential distribution of the charge emission events also becomesevident when the emission time points are binned into a histogram, see Figure 8 (right). It has to benoted that the quality of the histogram depends on the number of data points available and on thenumber of chosen bins. A more direct approach to calculate the average charge emission time is tocalculate the mean value of the considered emission events
τe =1
Ne
Ne−1
∑i=0
τe,i. (3)
As noted in Figure 8 (right), by doing so the average emission time calculated lies well within theuncertainty of the estimation using the exponential distribution function. In a next step the chargecapture of the defects has be extracted which will be discussed.
4.2. Extraction of Charge Capture Time
In contrast to the direct extraction of the charge emission time from the recovery traces, the chargecapture time cannot be determined directly, but can be extracted employing an indirect approach.For charge capture it can be assumed that the longer the stress time is the larger the probability of adefect to get charged becomes, when the same stress bias is considered. Thus, the expectation value ofthe occupancy, that is, the ratio between the number of recovery traces in which an emission event ofthe corresponding defect can be observed Ne and the total number of traces measured NN, follows
O(ts) = A(1− e−tsτc ), (4)

Micromachines 2020, 11, 736 10 of 21
with A the occupancy and τc the charge capture time. The correlation between different stress timesand the occupancy function is shown in Figure 9 (middle). As can be seen from the correspondingspectral maps for defect #B, with increasing stress time the respective cluster becomes brighter, thatis, the occupancy O = Ne/NN increases. After the values for the occupancy have been extracted at anumber of different stress times, the charge capture time can be estimated by applying Equation (4).
10 4 10 2 100 102
Emission Time [s]
0
10
20
Step
Hei
ght
[mV] Ne=3
d=15.2mVe=386.4ms
#B
ts=1ms
10 4 10 2 100 102
Emission Time [s]
0
10
20
Step
Hei
ght
[mV] Ne=17
d=14.9mVe=238.8ms
#B
ts=10ms
10 5 10 3 10 1 101
Stress Time [s]
0.0
0.2
0.4
0.6
0.8
1.0Oc
cupa
ncy
[1]
A=0.97 ± 0.02c=85.1ms ± 8.1ms
10 4 10 2 100 102
Emission Time [s]
0
10
20
Step
Hei
ght
[mV] Ne=65
d=14.6mVe=268.3ms
#B
ts=100ms
10 4 10 2 100 102
Emission Time [s]
0
10
20
Step
Hei
ght
[mV] Ne=98
d=15.2mVe=299.5ms
#B
ts=1s
Figure 9. To extract the charge capture time a series of spectral maps (left and right images) forsequentially increasing stress times is recorded. From each spectral map the occupancy, that is, the ratiobetween the number of emission events of a certain defect and the number of traces measured, canbe extracted. The occupancy follows an exponential behavior (middle) enabling to extract the chargecapture time at a selected stress bias and device temperature.
To determine the charge emission times over a wider bias range, the extraction method has to beperformed for various stress biases. The upper limit for the stress bias is the breakdown voltage ofthe oxide, and the lower limit is given by the trap level of the defect, as this has to be shifted belowthe Fermi level of the channel during the stress phase. It has to be noted that, especially for defectswith large capture time, the extraction scheme can be very time consuming. In order to extend thethe measurement window for slow defects, the measurements can be performed at higher devicetemperatures, which can significantly elevate the extraction of the charge transition times at lowstress biases.
The next steps is to provide an explanation for the extracted charge trapping kinetics of the defect.One promising approach relies on the non-radiative multiphonon theory, and will be amongst othersdiscussed in the following.
5. Modeling of Charge Trapping
Most models developed to explain BTI aim at the reproduction of the temporal behavior of the∆Vth at different stress and recovery biases and at different device temperatures. The measured ∆Vthtypically shows a recoverable component, that is, the part of ∆Vth which can be observed during therecovery cycle, and a permanent component, that is, the fraction of ∆Vth which remains at the end ofthe respective trace. Thus, a suitable model necessarily has to be able to explain both contributions tothe measured threshold voltage shift precisely.
A straight-forward approach to explain the experimental data is to use empirical models. However,such models typically aim at describing the data by simple mathematical formulas, but omit thedetailed physical mechanism behind the phenomena. In the context of device physics experimentaldata can often be modeled using a power law or exponential-like functions [73,74]. Although empiricalmodels can be used for comparing different technologies, they have to be treated with care as theydo not provide a physics based explanation for the observations. Thus extrapolations of the data,for instance to estimate the device lifetime, may not be very accurate. Another disadvantage of

Micromachines 2020, 11, 736 11 of 21
empirical models is that they have been developed to explain a continuous trend in device thresholddegradation and recovery, and are not designed to explain the discrete charge trapping behavior ofscaled devices. To describe such a device behavior a stochastic charge trapping model is requiredrather than an approximation by a simple power law.
Attempts for the description of charge trapping have been based on the assumption that chargecapture an emission can be explained by an elastic tunneling process [75–77]. During an elastictunneling process a charge carrier can transit from a reservoir, that is, the device channel, to a respectivedefect site and get trapped without changing its energy. In this case, the charge transition rates arefound to be proportional to the trap depth, τ ∝ exp−x/x0, which introduced difficulties whendescribing the large charge transition times for miniaturized devices which exhibit thin oxides [78,79].Another limitation of elastic tunneling models is that the tunneling process is almost temperatureindependent, which cannot account for the considerable temperature dependence of charge trapping,see Figure 4 (right). As a consequence, models which assume elastic tunneling may not provide anaccurate description of charge trapping considering BTI.
A very promising approach to model BTI was initially proposed in Reference [78] and has beenrefined in References [34,80]. The model is based on the concept of charge trapping which has beenintroduced to describe the stochastic nature of noise signals, that is, RTN and 1/f noise [81,82] andrelies on hole trapping at defect sites which are located in the oxide supported by a multiphononemission (MPE) process [75,83]. With MPE processes considerably larger charge capture and emissiontimes can be achieved, which makes the model more suitable for BTI [84]. In the initial approach theHDL model has been used to explain charge trapping of switching oxide traps [85]. One characteristicsof switching oxide traps is that their charge capture and emission time are bias dependent. Sucha behavior can be described by three-state defect model. Later a notable number of single defectstudies revealed that defects can also exhibit bias independent charge emission times. Such a behavioris referred to as fixed oxide traps [80]. Such a behavior can be described by the introduction of anadditional defect state to the HDL model, leading to the four-state defect model shown in Figure 10.
State 1neutral dimer
+
State 2’charged dimer
structuralrelaxation
h+ exchange
h+ exchange+
State 1’neutral puckered
State 2charged puckered
+
structuralrelaxation
SiliconOxygen
Figure 10. The non-radiative multiphonon (NMP) defect model has been proposed to explain thecharge trapping kinetics of single defects. The model considers four defect states, two neutral defectstates 1 and 1’ and two charged defect states 2’. The prime states are considered the meta-stable statesof the system whereas the other states are the stable states. Either by exchanging a charge carrier orby structural relaxation the defect can charge its current state within in the NMP model. For a certaindefect candidate, here shown for the E’ center, a certain atomic configuration of a defect can be assignedto one of the states of the defect model.

Micromachines 2020, 11, 736 12 of 21
The four-state NMP model consists of two stable states (1 and 2) and two metastable states (1’ and2’). In the model the transitions between the defect states are either described by an NMP process forthe transitions where a charge exchange takes place, that is, 1→ 2′ or 2→ 1′, or by a thermal barrier,that is, 1→ 1′ or 2→ 2′, where the defect undergoes a structural relaxation but does not change itscharge state. A significant difference between both barriers is that the charge transfer reaction leadsto bias dependent transition times, while the thermal barriers results in bias independent transitiontimes. In order to ensure the physical accuracy of the model an atomic configuration of a certain defectcandidate can be assigned to each state of the model. In Figure 10 the atomic configurations of the socalled E’ center, which have been calculated using ab-initio methods, are shown [86]. This defect classhas been proposed as hole trap candidate in pMOS transistors [87,88]. Further trap candidates aredefects involving hydrogen, namely defects in the hydrogen bridge configuration [89,90] or hydroxylE′ centers [91]. The elongated oxygen bond has been proposed as suitable electron trap candidate forcharge trapping in nMOS devices [92].
In the final section of this paper the different charge trapping behavior of defects which have beenobserved from single defect investigations and the corresponding configuration of the defect model toexplain the trap behavior is discussed.
6. Results
In the following, results from single defect studies performed on nanoscale devices are discussedin detail. The shown charge trapping kinetics has been extracted either by applying TDDS, or fromRTN measurements, and is modeled considering the four-state defect model. It can be observed thatthe model nicely explains the experimental data. In addition to the charge trapping kinetics, the impactof the defects on the device behavior is also an important parameter for device reliability assessment.This can be analyzed by calculating distribution function of step heights of the single charge transitionevents, which is subject of the second part of this section.
6.1. Charge Trapping Kinetics of Single Defects
Extensive studies employing the previously mentioned TDDS have been carried out usingutilizing pMOS and nMOS transistors. These investigations reveled many peculiarities visible inthe charge trapping kinetics of the defects, which all have to be covered by a uniform model. Ithas been observed that the charge emission times of traps can be either (i) bias-dependent, whichis typically referred to as switching trap, or (ii) bias-independent, a behavior which is assigned to socalled fixed oxide traps. In both cases strong bias dependent charge capture times are observed. Anotherremarkable observation is that (iii) defects can show a volatile behavior [93]. More detailed, a smallnumber of defects have been observed to vanish from the spectral map and some of them reappearedin the spectral maps at a later time point. It has to be noted that volatile defects have been observed innMOS and pMOS devices using SiON and high-k gate stacks and are thus not limited to any particulartechnologies. As the phenomenon is stochastic, it is very difficult study it systematically. However,these defects will an essential clue on the chemical nature of oxide traps.
In Figures 11 (left) and 12 (left) the charge trapping kinetics of two defects which have beenextracted from SiON pMOS transistors is shown.

Micromachines 2020, 11, 736 13 of 21
0.0 0.5 1.0 1.5 2.0 2.5Gate Voltage [V]
10 4
10 3
10 2
10 1
100Ch
arge
Tra
nsiti
on T
imes
[s]
e@50Ce@65Ce@80C
c@50Cc@65Cc@80C
2 1 0 1 2 3 4Reaction Coordinate [a.u.]
1.0
0.5
0.0
0.5
1.0
1.5
2.0
Ener
gy [
eV]
1 2' 2
Charge Capture
Charge Emission
Figure 11. (left) The charge trapping kinetics for a fixed trap is shown at different temperatures (symbols... measurement data, lines ... simulations). As can be seen, the fixed trap shows bias dependent chargecapture times, but bias independent charge emission times. (right) To explain this behavior three statesof the defect model are used and the pathways for charge capture an emission are shown together withthe corresponding approximation for the potential energy surfaces.
0.0 0.5 1.0 1.5 2.0 2.5Gate Voltage [V]
10 3
10 2
10 1
100
101
102
Char
ge T
rans
ition
Tim
es [
s]
RTNwindow
e@50Ce@65Ce, RTN@65Ce@80C
c@50Cc@65Cc, RTN@65Cc@80C
2 0 2 4 6Reaction Coordinate [a.u.]
1.0
0.5
0.0
0.5
1.0
1.5
2.0
Ener
gy [
eV]
1 2' 2 1' 1
Charge Capture Charge Emission
Figure 12. (left) The charge transition times of a switching trap shows bias dependent charge captureand charge emission times (symbols ... measurement data, lines ... simulations). (right) To explainthe bias and temperature dependence the four state defect model is used and the correspondingapproximation for the potential energy surfaces (PES) is shown. This kind of defect requires four defectstates in order to properly capture the trapping behavior.
The defect presented in Figure 11 (left) shows a fixed trap characteristic with bias-independentcharge emission times, but bias dependent charge capture times. The corresponding configurationcoordinate diagram with the potential energy surfaces (PESs) used to describe the charge transitions isgiven in Figure 11 (right). As already mentioned, the energy of the atomic configuration of the differentdefect states of the NMP model is calculated using density functional theory. The transitions from onedefect state to another are then approximated by a harmonic oscillator, which is represented by thePESs. The PESs either describe the situation of a neutral defect where the carrier is in its reservoir,or describe the situation where a carrier is trapped at a defect. A transition between the two states,that is, a charger transfer reaction, can occur when a carrier surpasses the energy barrier between twostates. To account for the bias dependence the relative position of the PESs is shifted according to thechange of the trap level when a gate bias is applied at the device. In case of a fixed trap, the transitionbarrier between the states 1 and 2’ becomes relatively small when a gate bias is applied, see dashedPES in Figure 11 (right). The system can further overcome the thermal barrier between the states 2’and 2, and finally transit to the stable charge state 2. In summary, the charge transition proceeds viathe pathway 1→ 2′ → 2. The switching trap from Figure 12 follows the same pathway when a charge

Micromachines 2020, 11, 736 14 of 21
capture event occurs. However, the charge emission behaviors different for both cases. In case of thefixed trap, the thermal barrier between the states 2 and 2’ determines the charge emission process,while the barrier between the states 2’ and 1 is very small, see solid PES in Figure 11. Thus, the chargeemission follows the pathway 2→ 2′ → 1. In contrast, charge emission for the switching trap proceedsvia the pathway 2 → 1′ → 1. Here the barrier between the states 2 and 1’ (solid PES in Figure 12)determines the charge emission time. It has to be noted that the charge transition processes, meaningthe transitions between different charge states of a defect, can be observed in the measurements asdiscrete steps in the current. The thermal barriers are given by the overall charge trapping dynamics,but transitions via these barriers are not directly visible in the measurement data.
Once the defect model is calibrated to a number of defects the parameters can be extended toexplain BTI in large-area devices. For this the trap levels and energy barriers are considered distributed,which enables to calculate a number of defects with different configuration of their PESs. Finally,the superposition of an large ensemble of defects allow explanation of BTI in large-area devices [94].Based on this accurate lifetime estimations can be made. Quite recently, the two-state defect model hasbeen implemented into a 1D reliability simulator Comphy [55] and successfully applied to explain BTIin various technologies. Lately it has also been demonstrated that the defect model in combinationwith TCAD simulations can nicely explain charge trapping in SiC transistors, where a good agreementbetween the extracted trap parameters and results from DFT calculations has been observed [11].Furthermore, it has been demonstrated that empirical models typically omit effects like saturation ofthe ∆Vth with increasing stress time, but rather predict indefinitely large ∆Vth when the stress timebecomes very large. However, such extrapolations are rather un-physical and pessimistic, thus aphysics based approach for explaining charge trapping, like the NMP defect model in combinationwith TCAD simulations, considering the charge trapping kinetics of single defects to explain chargetrapping is preferred.
6.2. Distribution of Step Heights of Single Defects
To estimate the impact of a single defect on the device behavior the charge sheet approximation(CSA), which assumes that the oxide charge is spread over the insulator according to [75]
∆Vth = − qε0εrWL
tox
(1− xT
tox
), (5)
with the elementary charge q, the dielectric constants ε0 and εr, the oxide thickness tox and the positionof the trap xT, is typically used. By applying the CSA the trap density can be estimated from a given∆Vth [55,95]. However, considering the CSA typically leads to an overestimation of the trap density,as the real average impact of a defect on the overall ∆Vth has been observed to be more pronounced,when measurements of different technologies are evaluated [25,49,96]. In order to determine theaverage impact of a single trap on the ∆Vth, the distribution function (CDF) of step heights has to becreated and analyzed [25,96]. To extract the CDF stress-recovery measurements have to be performedemploying a number of devices of the same technology. For each device one recovery trace is measuredafter the device has been stressed for typically 1 ks at oxide fields up to 10 MV/cm. Afterwards,the charge transitions of each trace are extracted and the CDF created, see Figure 13.

Micromachines 2020, 11, 736 15 of 21
0 2 4 6 8 10 12Step Height [mV]
10 2
10 1
100
101
(1-C
DF)/#
devi
ces
pMOS: NT = 15.0, = 1.69
NT1 = 18.1, 1 = 1.43NT2 = 0.1, 2 = 14.45
nMOS: NT = 1.0, = 1.33
NT1 = 0.8, 1 = 0.89NT2 = 0.2, 2 = 4.63
Char
ge S
heet
Appr
oxim
atio
n
W x L = 160nm x 120nm
pMOSnMOS
Figure 13. The complementary cumulative distribution function (CDF) is shown for nMOS and pMOSSiON transistors of equal active gate area. The insulator thickness is tox = 2.2 nm for all devices. As canbe seen, the complementary CDF reveals two branches for both kinds of transistors. Such a behaviorcan be well described by Equation (8) (dashed lines consider uni-modal exponential distribution, dottedlines consider bi-modal exponential distribution). Additionally, the maximum step height calculatedconsidering the CSA is also shown (solid black line). As can be clearly seen, the CSA significantlyunderestimates the effective impact of the single defects on the overall shift of device threshold voltage.Furthermore, it can be seen the number of active traps seems to be higher in pMOS devices comparedto the nMOS counterparts.
It can be seen, that the step heights are exponentially distributed and can be described by therespective probability distribution function (PDF)
f (∆Vth) =1η
e−∆Vth
η (6)
with η the mean threshold voltage shift caused by a single charge transition event of a certain defect.From the PDF the cumulative distribution function (CDF) can now be calculated
F(∆Vth) =∫
f (∆Vth)d∆Vth = 1− e−∆Vth
η . (7)
To study the distribution of the step heights the complementary CDF is used, and is evaluatednormalized to the number of devices
1− CDF#devices
= ∑i
Nie− ∆Vth
ηi , (8)
with Ni the average number of active defects per devices. The expression above already accountsfor multi-modal behavior of the experimental complementary CDFs. Note, one advantage of thenormalization of the complementary CDF is that the number of traps per device is directly accessiblefrom the plots.
A remarkable observation here is that the distribution function of the step heights followa bi-modal exponential distribution. Recent studies [63] suggest that the bi-modal exponentialdistribution is typical for devices employing high-k gate stacks, where one branch is attributedto charge transfer reactions between the channel and the high-k layer, and the second branch accountsfor channel/SiO2 trap interaction. However, it turned out that bi-modal exponential distributions canalso be observed for devices with an SiON insulator [53,96]. In Reference [96] it has been suggestedthat the two branches of the complementary CDF measured from nMOS devices can be separated intogate/defect and channel/defect interactions.

Micromachines 2020, 11, 736 16 of 21
Another important finding is that exponentially distributed amplitudes have also been found forRTN signals [97–99]. These findings strengthen the link between RTN and BTI [25,80]. Furthermore,the average contribution of a single trap to the threshold voltage shift η plays an important role in thecontext of device variability in deeply scaled devices [67,99–101].
7. Conclusions
The characterization and accurate modeling of the reliability of miniaturized transistors poses amajor challenge for measurement instrumentation, defect modeling and device simulation. In orderto explain the experimental observation empirical models are often used. However, such modelstypically omit certain observations, like saturation of the drift of the threshold voltage with increasingstress time. In order to provide a physical description of the measurement data the four-state defectmodel has been proposed, and is discussed here. The defect model is based on the charge trappingkinetics of single defects which can be observed in miniaturized devices. To extract the trappingbehavior the time-dependent defect spectroscopy (TDDS) can be used. From recent TDDS studiesit has been observed that defects exhibit bias dependent charge capture times, but certain defectsexhibit bias-independent charge emission times while others show bias-dependent charge emissiontimes. Both characteristics can be nicely explained by the defect model. To explain the behavior oflarge-area devices a number of defects with distributed trap levels and energy barriers for chargetransitions have to be calculated, and their superposition enable to describe the devices’ behavior.These simulations can be further used to accurately extract the lifetime of the devices under variousoperating conditions. Finally, the distribution function of step heights is discussed, and it is shownthat the typically use charge sheet approximation significantly underestimates the effective impactof a defect on the device behavior. This is especially important for circuit designers to ensure a highrobustness of the applications against charge trapping.
Funding: The research leading to these results has received funding from the the Take-off program of the AustrianResearch Promotion Agency FFG (projects n◦861022 and n◦867414) and the European Community’s FP7 projectn◦261868 (MORDRED).
Conflicts of Interest: The author declares no conflict of interest.
References
1. Hisamoto, D.; Lee, W.-C.; Kedzierski, J.; Anderson, E.; Takeuchi, H.; Asano, K.; King, T.-J.; Bokor, J.; Hu, C. Afolded-channel MOSFET for deep-sub-tenth micron era. In Proceedings of the International Electron DevicesMeeting 1998. Technical Digest, San Francisco, CA, USA, 6–9 December 1998; pp. 1032–1034. [CrossRef]
2. Huang, X.; Lee, W.-C.; Kuo, C.; Hisamoto, D.; Chang, L.; Kedzierski, J.; Anderson, E.; Takeuchi, H.;Choi, Y.-K.; Asano, K.; et al. Sub 50-nm FinFET: PMOS. In Proceedings of the International Electron DevicesMeeting 1999. Technical Digest, Washington, DC, USA, 5–8 December 1999; pp. 67–70.
3. Yu, B.; Chang, L.; Ahmed, S.; Wang, H.; Bell, S.; Yang, C.-Y.; Tabery, C.; Ho, C.; Xiang, Q.; King, T.-J.; et al.FinFET scaling to 10 nm gate length. In Proceedings of the Digest. International Electron Devices Meeting,San Francisco, CA, USA, 8–11 December 2002; pp. 251–254.
4. Loubet, N.; Hook, T.; Montanini, P.; Yeung, C.; Kanakasabapathy, S.; Guillom, M.; Yamashita, T.; Zhang,J.; Miao, X.; Wang, J.; et al. Stacked nanosheet gate-all-around transistor to enable scaling beyond FinFET.In Proceedings of the IEEE Symposium on VLSI Technology, Kyoto, Japan, 5–8 June 2017; pp. T230–T231.
5. Yang, B.; Buddharaju, K.D.; Teo, S.H.G.; Singh, N.; Lo, G.Q.; Kwong, D.L. Vertical Silicon-NanowireFormation and Gate-All-Around MOSFET. IEEE Electron Device Lett. 2008, 29, 791–794. [CrossRef]
6. Bangsaruntip, S.; Cohen, G.M.; Majumdar, A.; Zhang, Y.; Engelmann, S.U.; Fuller, N.C.M.; Gignac, L.M.;Mittal, S.; Newbury, J.S.; Guillorn, M.; et al. High performance and highly uniform gate-all-around siliconnanowire MOSFETs with wire size dependent scaling. In Proceedings of the 2009 IEEE International ElectronDevices Meeting (IEDM), Baltimore, MD, USA, 7–9 December 2009; pp. 1–4.
7. Yeo, K.H.; Suk, S.D.; Li, M.; Yeoh, Y.; Cho, K.H.; Hong, K.; Yun, S.; Lee, M.S.; Cho, N.; Lee, K.; et al.Gate-All-Around (GAA) Twin Silicon Nanowire MOSFET (TSNWFET) with 15 nm Length Gate and 4 nm

Micromachines 2020, 11, 736 17 of 21
Radius Nanowires. In Proceedings of the 2006 International Electron Devices Meeting, San Francisco, CA,USA, 11–13 December 2006; pp. 1–4.
8. Kato, Y.; Takao, H.; Sawada, K.; Ishida, M. The Characteristic Improvement of Si (111)Metal–Oxide–Semiconductor Field-Effect Transistor by Long-Time Hydrogen Annealing. Jpn. J. Appl. Phys.2004, 43, 6848–6853. [CrossRef]
9. Xiong, W.; Gebara, G.; Zaman, J.; Gostkowski, M.; Nguyen, B.; Smith, G.; Lewis, D.; Cleavelin, C.R.; Wise,R.; Yu, S.; et al. Improvement of FinFET electrical characteristics by hydrogen annealing. IEEE ElectronDevice Lett. 2004, 25, 541–543. [CrossRef]
10. Pollack, G.P.; Richardson, W.F.; Malhi, S.D.S.; Bonifield, T.; Shichijo, H.; Banerjee, S.; Elahy, M.; Shah, A.H.;Womack, R.; Chatterjee, P.K. Hydrogen passivation of PolySilicon MOSFET’s from a plasma Nitride source.IEEE Electron Device Lett. 1984, 5, 468–470. [CrossRef]
11. Schleich, C.; Berens, J.; Rzepa, G.; Pobegen, G.; Rescher, G.; Tyaginov, S.; Grasser, T.; Waltl, M. PhysicalModeling of Bias Temperature Instabilities in SiC MOSFETs. In Proceedings of the 2019 IEEE InternationalElectron Devices Meeting (IEDM), San Francisco, CA, USA, 7–11 December 2019.
12. Pippel, E.; Woltersdorf, J.; Olafsson, H.Ö.; Sveinbjörnsson, E.Ö. Interfaces between 4H-SiC and SiO2:Microstructure, nanochemistry, and near-interface traps. J. Appl. Phys. 2005, 97, 034302. [CrossRef]
13. Berens, J.; Rasinger, F.; Aichinger, T.; Heuken, M.; Krieger, M.; Pobegen, G. Detection and CryogenicCharacterization of Defects at the SiO2/4H-SiC Interface in Trench MOSFET. IEEE Trans. Electron Devices2019, 66, 1213–1217. [CrossRef]
14. Bravaix, A.; Guerin, C.; Goguenheim, D.; Huard, V.; Roy, D.; Besset, C.; Renard, S.; Randriamihaja, Y.M.;Vincent, E. Off State Incorporation into the 3 Energy Mode Device Lifetime Modeling for Advanced 40 nmCMOS Node. In Proceedings of the 2010 IEEE International Reliability Physics Symposium, Anaheim, CA,USA, 2–6 May 2010; pp. 55–64. [CrossRef]
15. Tyaginov, S.; Starkov, I.; Enichlmair, H.; Park, J.; Jungemann, C.; Grasser, T. Physics-Based Hot-CarrierDegradation Models. ECS Trans. 2011, 321–352.
16. Doyle, B.S.; Mistry, K.R. The characterization of hot carrier damage in p-channel transistors. IEEE Trans.Electron Devices 1993, 40, 152–156. [CrossRef]
17. Bury, E.; Chasin, A.; Vandemaele, M.; Van Beek, S.; Franco, J.; Kaczer, B.; Linten, D. Array-Based StatisticalCharacterization of CMOS Degradation Modes and Modeling of the Time-Dependent Variability Induced byDifferent Stress Patterns in the {VG, VD} bias space. In Proceedings of the 2019 IEEE International ReliabilityPhysics Symposium (IRPS), Monterey, CA, USA, 31 March–4 April 2019; pp. 1–6.
18. Cohen, N.L.; Paulsen, R.E.; White, M.H. Observation and characterization of near-interface oxide traps withC-V techniques. IEEE Trans. Electron Devices 1995, 42, 2004–2009. [CrossRef]
19. Miura, Y.; Matukura, Y. Investigation of Silicon-Silicon Dioxide Interface Using MOS Structure. Jpn. J.Appl. Phys. 1966, 5, 180. [CrossRef]
20. Grasser, T.; Kaczer, B.; Aichinger, T.; Goes, W.; Nelhiebel, M. Defect Creation Stimulated by ThermallyActivated Hole Trapping as the Driving Force Behind Negative Bias Temperature Instability in SiO2, SiON,and High-k Gate Stacks. In Proceedings of the 2008 IEEE International Integrated Reliability Workshop FinalReport, South Lake Tahoe, CA, USA, 12–16 October 2008; pp. 91–95. [CrossRef]
21. Schroder, D.K.; Babcock, J. Negative Bias Temperature Instability: Road to Cross in Deep Submicron SiliconSemiconductor Manufacturing. J. Appl. Phys. 2003, 94, 1–18. [CrossRef]
22. Gerrer, L.; Ding, J.; Amoroso, S.; Adamu-Lema, F.; Hussin, R.; Reid, D.; Millar, C.; Asenov, A. ModellingRTN and BTI in nanoscale MOSFETs from device to circuit: A review. Microelectron. Reliab. 2014, 54, 682–697.[CrossRef]
23. Onishi, K.; Choi, R.; Kang, C.S.; Cho, H.-J.; Kim, Y.H.; Nieh, R.E.; Han, J.; Krishnan, S.A.; Akbar, M.S.; Lee, J.C.Bias-temperature instabilities of polysilicon gate HfO/sub 2/ MOSFETs. IEEE Trans. Electron Devices 2003,50, 1517–1524. [CrossRef]
24. Martin-Martinez, J.; Rodriguez, R.; Nafria, M.; Aymerich, X. Time-Dependent Variability Related to BTIEffects in MOSFETs: Impact on CMOS Differential Amplifiers. IEEE Trans. Device Mater. Reliab. 2009,9, 305–310. [CrossRef]
25. Kaczer, B.; Grasser, T.; Roussel, P.J.; Franco, J.; Degraeve, R.; Ragnarsson, L.A.; Simoen, E.; Groeseneken, G.;Reisinger, H. Origin of NBTI Variability in Deeply Scaled pFETs. In Proceedings of the 2010 IEEE InternationalReliability Physics Symposium, Anaheim, CA, USA, 2–6 May 2010; pp. 26–32. [CrossRef]

Micromachines 2020, 11, 736 18 of 21
26. Reisinger, H.; Blank, O.; Heinrigs, W.; Muhlhoff, A.; Gustin, W.; Schlunder, C. Analysis of NBTI Degradation-and Recovery-Behavior Based on Ultra Fast VT–Measurements. In Proceedings of the 2006 IEEE InternationalReliability Physics Symposium Proceedings, San Jose, CA, USA, 26–30 March 2006; pp. 448–453. [CrossRef]
27. Ralls, K.S.; Skocpol, W.J.; Jackel, L.D.; Howard, R.E.; Fetter, L.A.; Epworth, R.W.; Tennant, D.M.Discrete Resistance Switching in Submicrometer Silicon Inversion Layers: Individual Interface Traps andLow-Frequency ( 1
f ) Noise. Phys. Rev. Lett. 1984, 52, 228–231. [CrossRef]28. Uren, M.J.; Day, D.J.; Kirton, M.J. 1/f and Random Telegraph Noise in Silicon Metal-Oxide-Semiconductor
Field-Effect Transistors. Appl. Phys. Lett. 1985, 47, 1195–1197. [CrossRef]29. Nagumo, T.; Takeuchi, K.; Yokogawa, S.; Imai, K.; Hayashi, Y. New analysis methods for comprehensive
understanding of Random Telegraph Noise. In Proceedings of the 2009 IEEE International Electron DevicesMeeting (IEDM), Baltimore, MD, USA, 7–9 December 2009; pp. 1–4. [CrossRef]
30. Tega, N.; Miki, H.; Pagette, F.; Frank, D.J.; Ray, A.; Rooks, M.J.; Haensch, W.; Torii, K. Increasing thresholdvoltage variation due to random telegraph noise in FETs as gate lengths scale to 20 nm. In Proceedings ofthe IEEE Symposium on VLSI Technology, Honolulu, HI, USA, 15–17 June 2009; pp. 50–51.
31. Veksler, D.; Bersuker, G.; Vandelli, L.; Padovani, A.; Larcher, L.; Muraviev, A.; Chakrabarti, B.; Vogel, E.;Gilmer, D.C.; Kirsch, P.D. Random telegraph noise (RTN) in scaled RRAM devices. In Proceedings ofthe 2013 IEEE International Reliability Physics Symposium (IRPS), Anaheim, CA, USA, 14–18 April 2013;pp. MY.10.1–MY.10.4. [CrossRef]
32. Wang, R.; Guo, S.; Zhang, Z.; Zou, J.; Mao, D.; Huang, R. Complex Random Telegraph Noise (RTN): WhatDo We Understand? In Proceedings of the 2018 IEEE International Symposium on the Physical and FailureAnalysis of Integrated Circuits (IPFA), Singapore, 16–19 July 2018; pp. 1–7. [CrossRef]
33. Simicic, M.; Weckx, P.; Parvais, B.; Roussel, P.; Kaczer, B.; Gielen, G. Understanding the Impact ofTime-Dependent Random Variability on Analog ICs: From Single Transistor Measurements to CircuitSimulations. IEEE Trans. VLSI Syst. 2019, 27, 601–610. [CrossRef]
34. Grasser, T.; Reisinger, H.; Wagner, P.J.; Goes, W.; Schanovsky, F.; Kaczer, B. The Time Dependent DefectSpectroscopy (TDDS) for the Characterization of the Bias Temperature Instability. In Proceedings of the 2010IEEE International Reliability Physics Symposium, Anaheim, CA, USA, 2–6 May 2010; pp. 16–25. [CrossRef]
35. Grasser, T.; Reisinger, H.; Wagner, P.J.; Kaczer, B. The Time Dependent Defect Spectroscopy for theCharacterization of Border Traps in Metal-Oxide-Semiconductor Transistors. Phys. Rev. B 2010, 82, 245318.[CrossRef]
36. Rao, V.R.; Wittmann, F.; Gossner, H.; Eisele, I. Hysteresis behavior in 85-nm channel length verticaln-MOSFETs grown by MBE. IEEE Trans. Electron Devices 1996, 43, 973–976. [CrossRef]
37. Chatty, K.; Banerjee, S.; Chow, T.P.; Gutmann, R.J. Hysteresis in transfer characteristics in 4H-SiCdepletion/accumulation-mode MOSFETs. IEEE Electron Device Lett. 2002, 23, 330–332. [CrossRef]
38. Pacelli, A.; Lacaita, A.L.; Villa, S.; Perron, L. Reliable extraction of MOS interface traps from low-frequencyCV measurements. IEEE Electron Device Lett. 1998, 19, 148–150. [CrossRef]
39. Romanjek, K.; Andrieu, F.; Ernst, T.; Ghibaudo, G. Improved split C-V method for effective mobilityextraction in sub-0.1-µm Si MOSFETs. IEEE Electron Device Lett. 2004, 25, 583–585. [CrossRef]
40. Lang, D.V. Deep-level transient spectroscopy: A new method to characterize traps in semiconductors.J. Appl. Phys. 1974, 45, 3023–3032. [CrossRef]
41. Bains, S.K.; Banbury, P.C. AC hopping conductivity and DLTS studies on electron-irradiated boron-dopedsilicon. Semicond. Sci. Technol. 1987, 2, 20–29. [CrossRef]
42. Scholz, F.; Hwang, J.; Schroder, D. Low frequency noise and DLTS as semiconductor device characterizationtools. Solid-State Electron. 1988, 31, 205–217. [CrossRef]
43. McLarty, P.K.; Ioannou, D.E.; Colinge, J.P. Bulk traps in ultrathin SIMOX MOSFET’s by current DLTS.IEEE Electron Device Lett. 1988, 9, 545–547. [CrossRef]
44. McLarty, P.K.; Ioannou, D.E. DLTS analysis of carrier generation transients in thin SOI MOSFETs. IEEE Trans.Electron Devices 1990, 37, 262–266. [CrossRef]
45. Denais, M.; Parthasarathy, C.; Ribes, G.; Rey-Tauriac, Y.; Revil, N.; Bravaix, A.; Huard, V.; Perrier, F.On-the-Fly Characterization of NBTI in Ultra–Thin Gate Oxide pMOSFET’s. In Proceedings of the IEEEInternational Electron Devices Meeting, San Francisco, CA, USA, 13–15 December 2004; pp. 109–112.[CrossRef]

Micromachines 2020, 11, 736 19 of 21
46. Deora, S.; Maheta, V.D.; Islam, A.E.; Alam, M.A.; Mahapatra, S. A Common Framework of NBTI Generationand Recovery in Plasma-Nitrided SiON p-MOSFETs. IEEE Electron Device Lett. 2009, 30, 978–980. [CrossRef]
47. Bezza, A.; Rafik, M.; Roy, D.; Federspiel, X.; Mora, P.; Ghibaudo, G. Frequency dependence of TDDBPBTI with OTF monitoring methodology in high-k/metal gate stacks. In Proceedings of the 2014 IEEEInternational Reliability Physics Symposium, Waikoloa, HI, USA, 1–5 June 2014; pp. GD.6.1–GD.6.4.
48. Lelis, A.J.; Habersat, D.; Green, R.; Ogunniyi, A.; Gurfinkel, M.; Suehle, J.; Goldsman, N. Time Dependence ofBias-Stress-Induced SiC MOSFET Threshold-Voltage Instability Measurements. IEEE Trans. Electron Devices2008, 55, 1835–1840. [CrossRef]
49. Waltl, M.; Grill, A.; Rzepa, G.; Goes, W.; Franco, J.; Kaczer, B.; Mitard, J.; Grasser, T. Superior NBTI in high-kSiGe Transistors-Part I: Experimental. IEEE Trans. Electron Devices 2017, 64, 2092–2098. [CrossRef]
50. Kerber, A.; Kerber, M. Fast Wafer Level Data Acquisition for Reliability Characterization of Sub-100 nmCMOS Technologies. In Proceedings of the IEEE International Integrated Reliability Workshop Final Report,South Lake Tahoe, CA, USA, 13–15 December 2004; pp. 41–45. [CrossRef]
51. Du, G.A.; Ang, D.S.; Teo, Z.Q.; Hu, Y.Z. Ultrafast Measurement on NBTI. IEEE Electron Device Lett. 2009,30, 275–277. [CrossRef]
52. Yu, X.; Lu, J.; Liu, W.; Qu, Y.; Zhao, Y. Ultra-fast (ns-scale) Characterization of NBTI Behaviors in Si pFinFETs.IEEE J. Electron Devices Soc. 2020, 8, 577–583. [CrossRef]
53. Waltl, M. Ultra-Low Noise Defect Probing Instrument for Defect Spectroscopy of MOS Transistors.IEEE Trans. Device Mater. Reliab. 2020, 20, 242–250. [CrossRef]
54. Reisinger, H.; Grasser, T.; Gustin, W.; Schlünder, C. The statistical analysis of individual defects constitutingNBTI and its implications for modeling DC- and AC-stress. In Proceedings of the 2010 IEEE InternationalReliability Physics Symposium, Anaheim, CA, USA, 2–6 May 2010; pp. 7–15. [CrossRef]
55. Rzepa, G.; Franco, J.; O’Sullivan, B.J.; Subirats, A.; Simicic, M.; Hellings, G.; Weckx, P.; Jech, M.; Knobloch, T.;Waltl, M.; et al. Comphy—A Compact-Physics Framework for Unified Modeling of BTI. Microelectron. Reliab.2018, 85, 49–65. [CrossRef]
56. Kaneta, C.; Yamasaki, T.; Uchiyama, T.; Uda, T.; Terakura, K. Structure and electronic property of Si(100)SiO2
interface. Microelectron. Eng. 1999, 48, 117–120. [CrossRef]57. Yamashita, Y.; Yamamoto, S.; Mukai, K.; Yoshinobu, J.; Harada, Y.; Tokushima, T.; Takeuchi, T.; Takata, Y.;
Shin, S.; Akagi, K.; Tsuneyuki, S. Direct observation of site-specific valence electronic structure at the SiO2/Siinterface. Phys. Rev. B 2006, 73, 045336. [CrossRef]
58. Huiwen, Z.; Yongsong, L.; Lingfeng, M.; Jingqin, S.; Zhiyan, Z.; Weihua, T. Theoretical study of the SiO2/Siinterface and its effect on energy band profile and MOSFET gate tunneling current. J. Semicond. 2010,31, 082003. [CrossRef]
59. Ullmann, B.; Puschkarsky, K.; Waltl, M.; Reisinger, H.; Grasser, T. Evaluation of Advanced MOSFETThreshold Voltage Drift Measurement Techniques. IEEE Trans. Device Mater. Reliab. 2019, 19, 358–362.[CrossRef]
60. Schroeder, D. Negative Bias Temperature Instability: What do we understand? Microelectron. Reliab. 2007,47, 841–852. [CrossRef]
61. Waltl, M.; Goes, W.; Rott, K.; Reisinger, H.; Grasser, T. A Single-Trap Study of PBTI in SiON nMOS Transistors:Similarities and Differences to the NBTI/pMOS Case. In Proceedings of the 2014 IEEE InternationalReliability Physics Symposium, Waikoloa, HI, USA, 1–5 June 2014; pp. XT18.1–XT18.5. [CrossRef]
62. Wang, K.L.; Evwaraye, A.O. Determination of interface and bulk-trap states of IGFET’s using deep-leveltransient spectroscopy. J. Appl. Phys. 1976, 47, 4574–4577. [CrossRef]
63. Toledano-Luque, M.; Kaczer, B.; Simoen, E.; Roussel, P.; Veloso, A.; Grasser, T.; Groeseneken, G. Temperatureand Voltage Dependences of the Capture and Emission Times of Individual Traps in High-k Dielectrics.Microelectron. Eng. 2011, 88, 1243–1246. [CrossRef]
64. Toledano-Luque, M.; Kaczer, B.; Roussel, P.; Cho, M.; Grasser, T.; Groeseneken, G. Temperature Dependenceof the Emission and Capture Times of SiON Individual Traps after Positive Bias Temperature Stress. J. Vac.Sci. Technol. Nanotechnol. Microelectron. Mater. Process. Meas. Phenom. 2010, 29, 1–2. [CrossRef]
65. Kaczer, B.; Grasser, T.; Martin-Martinez, J.; Simoen, E.; Aoulaiche, M.; Roussel, P.; Groeseneken, G. NBTIfrom the Perspective of Defect States with Widely Distributed Time Scales. In Proceedings of the 2009 IEEEInternational Reliability Physics Symposium, Montreal, QC, Canada, 26–30 April 2009; pp. 55–60. [CrossRef]

Micromachines 2020, 11, 736 20 of 21
66. Kaczer, B.; Franco, J.; Weckx, P.; Roussel, P.J.; Bury, E.; Cho, M.; Degraeve, R.; Linten, D.; Groeseneken, G.;Kukner, H.; et al. The defect-centric perspective of device and circuit reliability—From individual defectsto circuits. In Proceedings of the 2015 45th European Solid State Device Research Conference (ESSDERC),Graz, Austria, 14–18 September 2015; pp. 218–225.
67. Toledano-Luque, M.; Kaczer, B.; Roussel, P.J.; Franco, J.; Ragnarsson, L.A.; Grasser, T.; Groeseneken, G.Depth localization of positive charge trapped in silicon oxynitride field effect transistors after positive andnegative gate bias temperature stress. Appl. Phys. Lett. 2011, 98, 183506. [CrossRef]
68. Stampfer, B.; Schanovsky, F.; Grasser, T.; Waltl, M. Semi-Automated Extraction of the Distribution of SingleDefects for nMOS Transistors. Micromachines 2020, 11, 446. [PubMed]
69. Canny, J. A Computational Approach to Edge Detection. IEEE Trans. Pattern Anal. Mach. Intell. 1986,PAMI-8, 679–698. [CrossRef]
70. Bernard, A.; Bos-Levenbach, E.J. The Plotting of Observations on Probability-Paper; Stichting MathematischCentrum: Amsterdam, the Netherlands, 1955.
71. Hudak, D.; Tiryakioglu, M. On estimating percentiles of the Weibull distribution by the linear regressionmethod. J. Mater. Sci. 2009, 44, 1959–1964. [CrossRef]
72. Tiryakioglu, M.; Hudak, D. On estimating Weibull modulus by the linear regression method. J. Mater. Sci.2007, 42, 10173–10179. [CrossRef]
73. McPherson, J.W. Reliability Physics and Engineering: Time-To-Failure Modeling; Springer: Berlin, Germany,2010.
74. Huard, V.; Denais, M.; Parthasarathy, C. NBTI degradation: From physical mechanisms to modelling.Microelectron. Reliab. 2006, 46, 1–23. [CrossRef]
75. Tewksbury, T. Relaxation Effects in MOS Devices due to Tunnel Exchange with Near-Interface Oxide Traps.Ph.D. Thesis, MIT, Cambridge, MA, USA, 1992.
76. Shen, C.; Li, M..; Foo, C.E.; Yang, T.; Huang, D.M.; Yap, A.; Samudra, G.S.; Yeo, Y. Characterization andPhysical Origin of Fast Vth Transient in NBTI of pMOSFETs with SiON Dielectric. In Proceedings of the2006 International Electron Devices Meeting, San Francisco, CA, USA, 11–13 December 2006; pp. 1–4.
77. Islam, A.E.; Kufluoglu, H.; Varghese, D.; Mahapatra, S.; Alam, M.A. Recent Issues in Negative-BiasTemperature Instability: Initial Degradation, Field Dependence of Interface Trap Generation, Hole TrappingEffects, and Relaxation. IEEE Trans. Electron Devices 2007, 54, 2143–2154. [CrossRef]
78. Grasser, T.; Kaczer, B.; Goes, W.; Aichinger, T.; Hehenberger, P.; Nelhiebel, M. A Two-Stage Model forNegative Bias Temperature Instability. In Proceedings of the 2009 IEEE International Reliability PhysicsSymposium, Montreal, QC, Canada, 26–30 April 2009; pp. 33–44.
79. Campbell, J.P.; Lenahan, P.M.; Cochrane, C.J.; Krishnan, A.T.; Krishnan, S. Atomic-scale defects involved inthe negative-bias temperature instability. IEEE Trans. Device Mater. Reliab. 2007, 7, 540–557. [CrossRef]
80. Grasser, T.; Reisinger, H.; Goes, W.; Aichinger, T.; Hehenberger, P.; Wagner, P.; Nelhiebel, M.; Franco, J.;Kaczer, B. Switching Oxide Traps as the Missing Link between Negative Bias Temperature Instability andRandom Telegraph Noise. In Proceedings of the 2009 IEEE International Electron Devices Meeting (IEDM),Baltimore, MD, USA, 7–9 December 2009; pp. 729–732.
81. Weissman, M. 1/f noise and other slow, nonexponential kinetics in condensed matter. Rev. Mod. Phys. 1988,60, 537–571. [CrossRef]
82. Fleetwood, D.M.; Xiong, H.D.; Lu, Z..; Nicklaw, C.J.; Felix, J.A.; Schrimpf, R.D.; Pantelides, S.T. Unifiedmodel of hole trapping, 1/f noise, and thermally stimulated current in MOS devices. IEEE Trans. Nucl. Sci.2002, 49, 2674–2683. [CrossRef]
83. Kirton, M.; Uren, M. Noise in solid-state microstructures: A new perspective on individual defects, interfacestates and low-frequency (1/f) noise. Adv. Phys. 1989, 38, 367–468. [CrossRef]
84. Henry, C.; Lang, D. Nonradiative Capture and Recombination by Multiphonon Emission in GaAs and GaP.Phys. Rev. B 1977, 15, 989–1016. [CrossRef]
85. Lelis, A.J.; Oldham, T.R. Time dependence of switching oxide traps. IEEE Trans. Nucl. Sci. 1994, 41, 1835–1843.[CrossRef]
86. Schanovsky, F. Atomistic Modeling in the Context of the Bias Temperature Instability. Ph.D. Thesis, TUWien, Vienna, Austria, 2013.
87. Lenahan, P.M.; Conley, J.F. What can electron paramagnetic resonance tell us about the Si/SiO2 system? J.Vac. Sci. Technol. Microelectron. Nanometer Struct. Process. Meas. Phenom. 1998, 16, 2134–2153. [CrossRef]

Micromachines 2020, 11, 736 21 of 21
88. Lenahan, P.M.; Campbell, J.P.; Krishnan, A.T.; Krishnan, S. A Model for NBTI in Nitrided Oxide MOSFETsWhich Does Not Involve Hydrogen or Diffusion. IEEE Trans. Device Mater. Reliab. 2011, 11, 219–226.[CrossRef]
89. de Nijs, J.M.M.; Druijf, K.G.; Afanas’ev, V.V.; van der Drift, E.; Balk, P. Hydrogen induced donor-type Si/SiO2interface states. Appl. Phys. Lett. 1994, 65, 2428–2430. [CrossRef]
90. Blöchl, P.E.; Stathis, J.H. Aspects of defects in silica related to dielectric breakdown of gate oxides inMOSFETs. Phys. Condens. Matter 1999, 273–274, 1022–1026. [CrossRef]
91. Grasser, T.; Goes, W.; Wimmer, Y.; Schanovsky, F.; Rzepa, G.; Waltl, M.; Rott, K.; Reisinger, H.; Afanas’ev, V.;Stesmans, A.; et al. On the Microscopic Structure of Hole Traps in pMOSFETs. In Proceedings of the 2014IEEE International Electron Devices Meeting, San Francisco, CA, USA, 15–17 December 2014.
92. El-Sayed, A.M.; Watkins, M.B.; Afanas’ev, V.V.; Shluger, A.L. Nature of intrinsic and extrinsic electrontrapping in SiO2. Phys. Rev. B 2014, 89. [CrossRef]
93. Grasser, T.; Waltl, M.; Goes, W.; Wimmer, Y.; El-Sayed, A.M.; Shluger, A.L.; Kaczer, B. On the volatility ofoxide defects: Activation, deactivation, and transformation. In Proceedings of the 2015 IEEE InternationalReliability Physics Symposium, Monterey, CA, USA, 19–23 April 2015; pp. 5A.3.1–5A.3.8.
94. Waltl, M.; Rzepa, G.; Grill, A.; Gös, W.; Franco, J.; Kaczer, B.; Witters, L.; Mitard, J.; Horiguchi, N.; Grasser, T.Superior NBTI in High-k SiGe Transistors - Part II: Theory. IEEE Trans. Electron Devices 2017, 64, 2099–2105.[CrossRef]
95. O’Sullivan, B.J.; Ritzenthaler, R.; Dentoni Litta, E.; Simoen, E.; Machkaoutsan, V.; Fazan, P.; Ji, Y.; Kim, C.;Spessot, A.; Linten, D.; et al. Overview of Bias Temperature Instability in Scaled DRAM Logic for MemoryTransistors. IEEE Trans. Device Mater. Reliab. 2020, 20, 258–268. [CrossRef]
96. Waltl, M. Separation of electron and hole trapping components of PBTI in SiON nMOS transistors.Microelectron. Reliab. 2020, in press. [CrossRef]
97. Asenov, A.; Balasubramaniam, R.; Brown, A.R.; Davies, J.H. RTS amplitudes in decananometer MOSFETs:3-D simulation study. IEEE Trans. Electron Devices 2003, 50, 839–845. [CrossRef]
98. Takeuchi, K.; Nagumo, T.; Yokogawa, S.; Imai, K.; Hayashi, Y. Single-charge-based modeling of transistorcharacteristics fluctuations based on statistical measurement of RTN amplitude. In Proceedings of the IEEESymposium on VLSI Technology, Honolulu, HI, USA, 15–17 June 2009; pp. 54–55.
99. Ghetti, A.; Monzio Compagnoni, C.; Spinelli, A.S.; Visconti, A. Comprehensive Analysis of RandomTelegraph Noise Instability and Its Scaling in Deca–Nanometer Flash Memories. IEEE Trans. Electron Devices2009, 56, 1746–1752. [CrossRef]
100. Franco, J.; Kaczer, B.; Roussel, P.J.; Mitard, J.; Cho, M.; Witters, L.; Grasser, T.; Groeseneken, G. SiGe ChannelTechnology: Superior Reliability Toward Ultrathin EOT Devices—Part I: NBTI. IEEE Trans. Electron Devices2013, 60, 396–404. [CrossRef]
101. Franco, J.; Kaczer, B.; Toledano-Luque, M.; Roussel, P.J.; Kauerauf, T.; Mitard, J.; Witters, L.; Grasser, T.;Groeseneken, G. SiGe Channel Technology: Superior Reliability Toward Ultra-Thin EOT Devices—Part II:Time-Dependent Variability in Nanoscaled Devices and Other Reliability Issues. IEEE Trans. Electron Devices2013, 60, 405–412. [CrossRef]
c© 2020 by the author. Licensee MDPI, Basel, Switzerland. This article is an open accessarticle distributed under the terms and conditions of the Creative Commons Attribution(CC BY) license (http://creativecommons.org/licenses/by/4.0/).