Evaluation of Diagnostic and Screening Tests: Validity and Reliability
Upload
haley-rowlandCategory
view
47download
4description
Reliability of diagnostic tests
October 29, 2014
O. Paltiel and R. Calderon
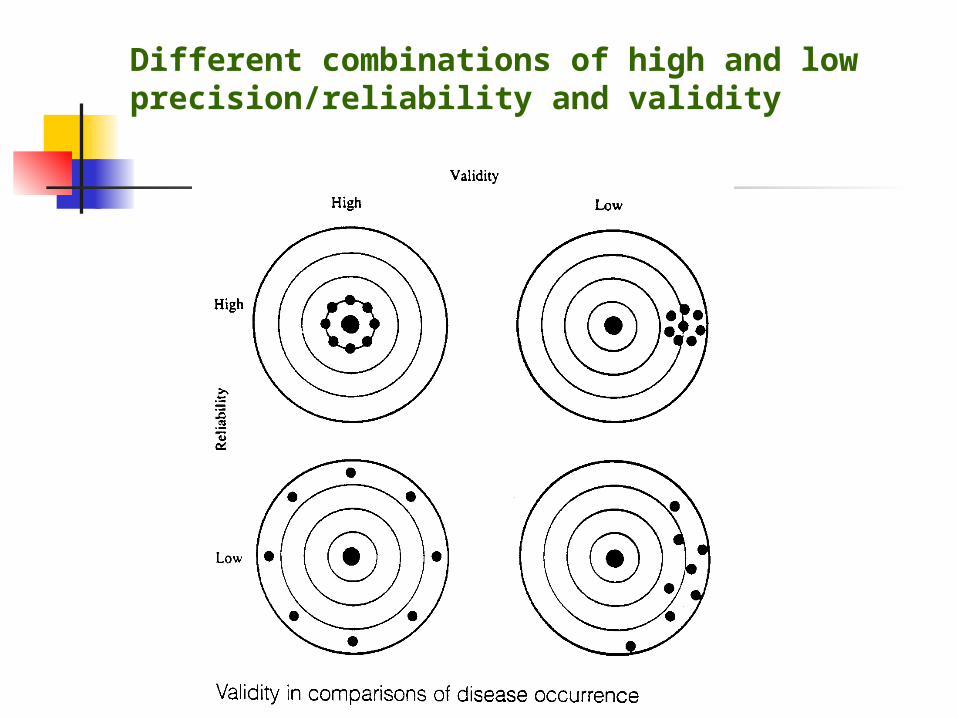
Different combinations of high and low precision/reliability and validity
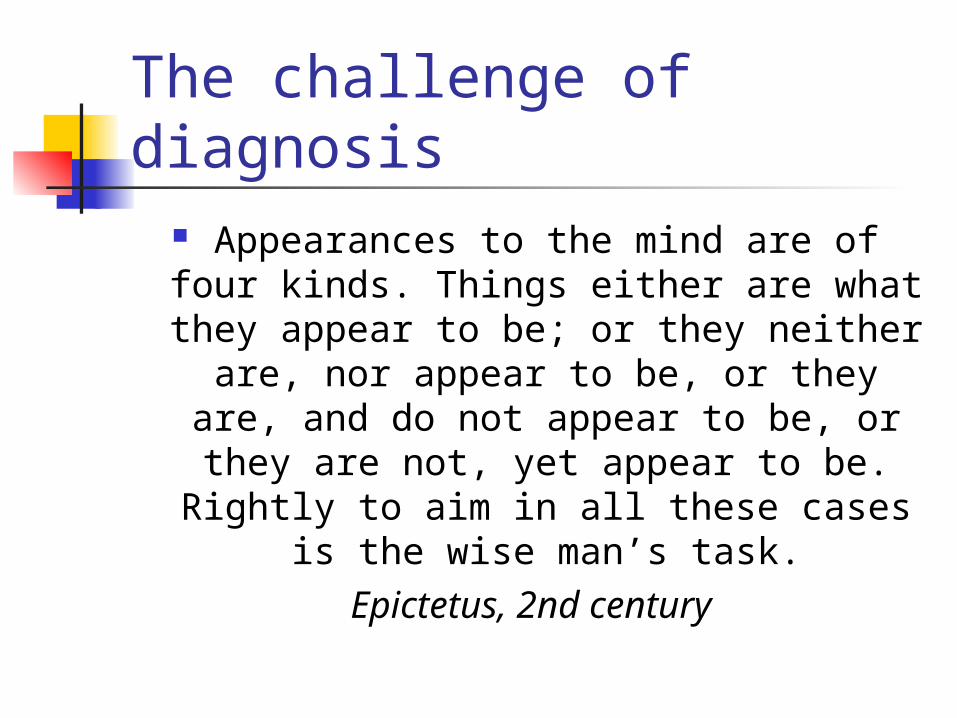
The challenge of diagnosis Appearances to the mind are of four
kinds. Things either are what they appear to be; or they neither are, nor appear to be, or they are, and do not
appear to be, or they are not, yet appear to be. Rightly to aim in all
these cases is the wise man’s task.Epictetus, 2nd century
= Reliability מהימנות Definition “the extent to which
repeated measurements of a stable phenomenon – by different people and instruments, at different times and places – get similar results”
= reproducibility or precision
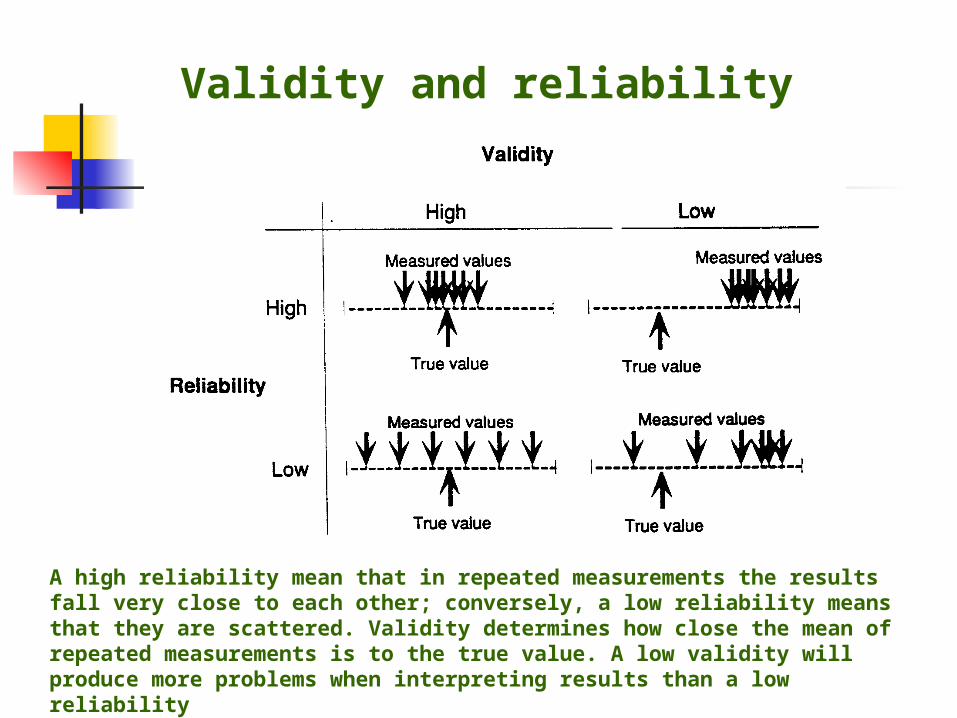
Validity and reliability
A high reliability mean that in repeated measurements the results fall very close to each other; conversely, a low reliability means that they are scattered. Validity determines how close the mean of repeated measurements is to the true value. A low validity will produce more problems when interpreting results than a low reliability
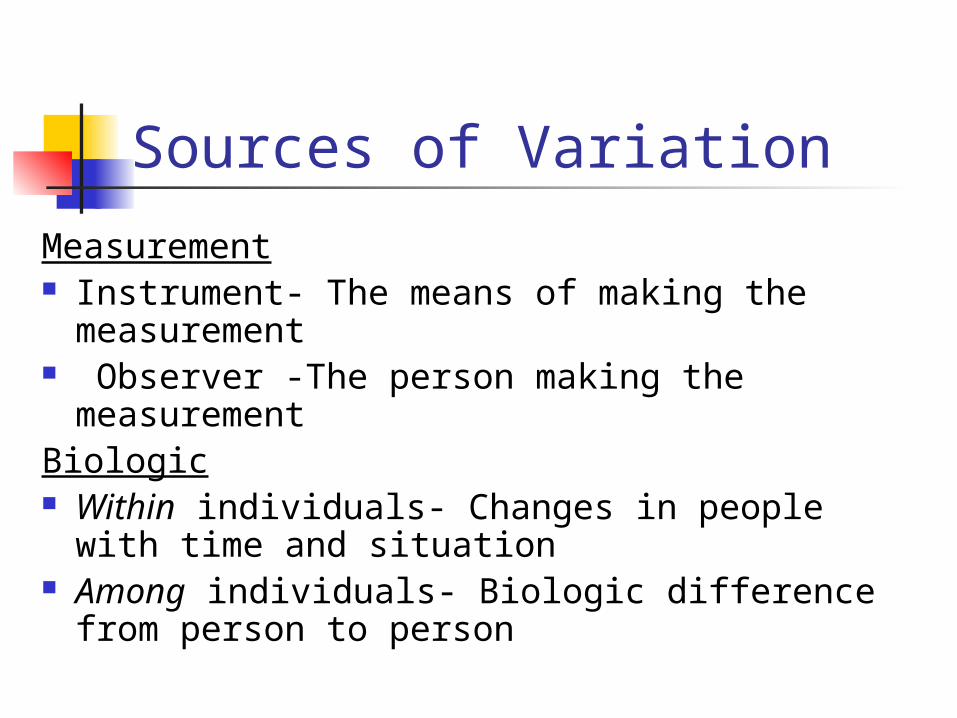
Sources of Variation
Measurement Instrument- The means of making the
measurement Observer -The person making the
measurementBiologic Within individuals- Changes in people with
time and situation Among individuals- Biologic difference from
person to person
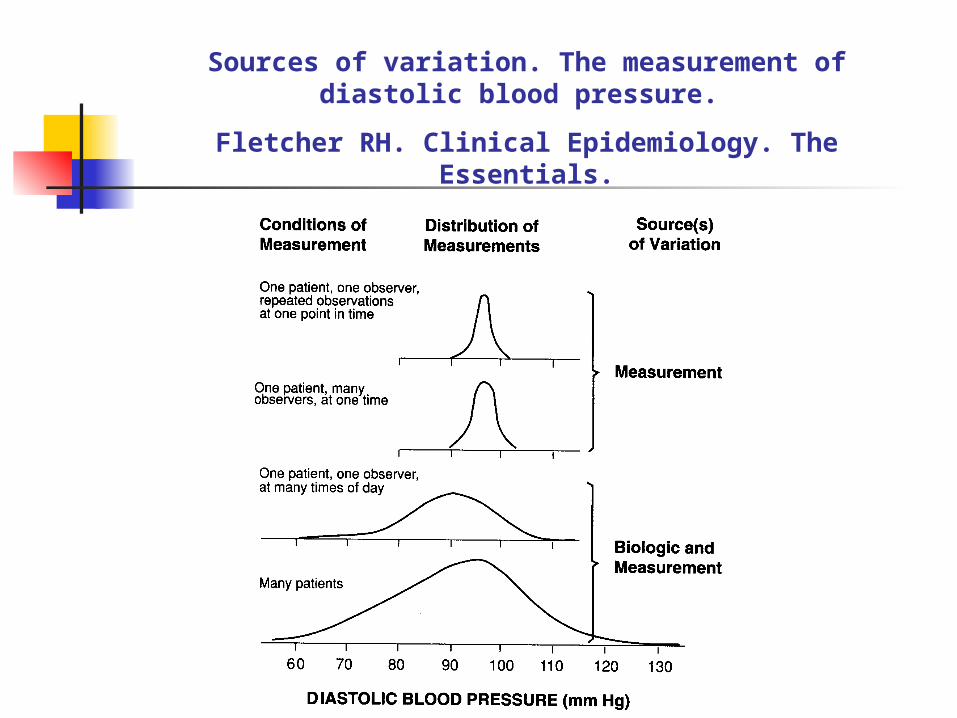
Sources of variation. The measurement of diastolic blood pressure.
Fletcher RH. Clinical Epidemiology. The Essentials.
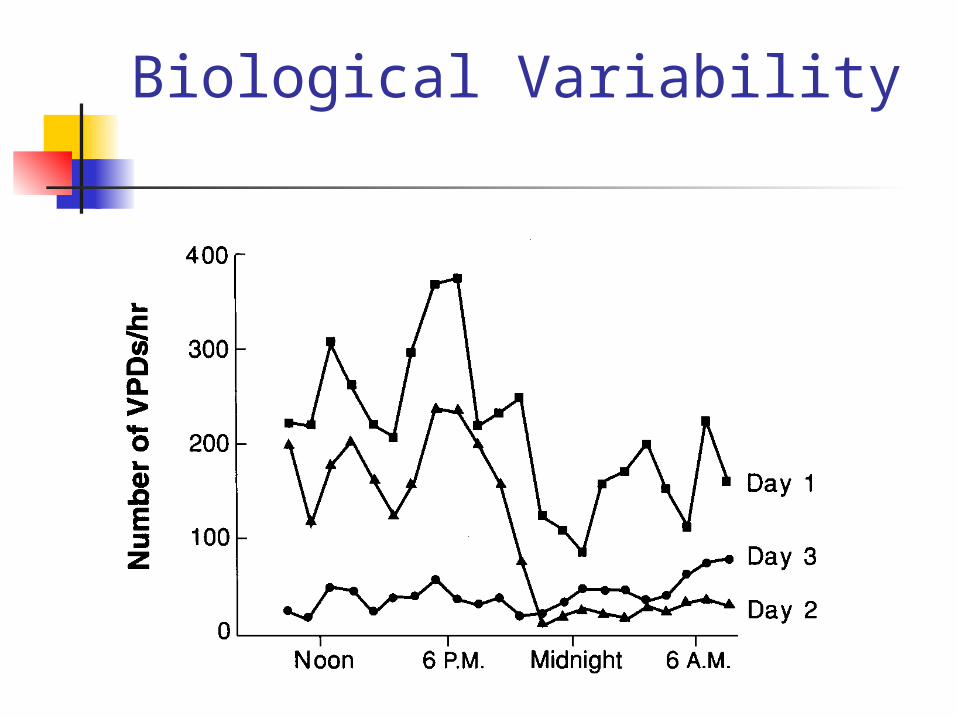
Biological Variability
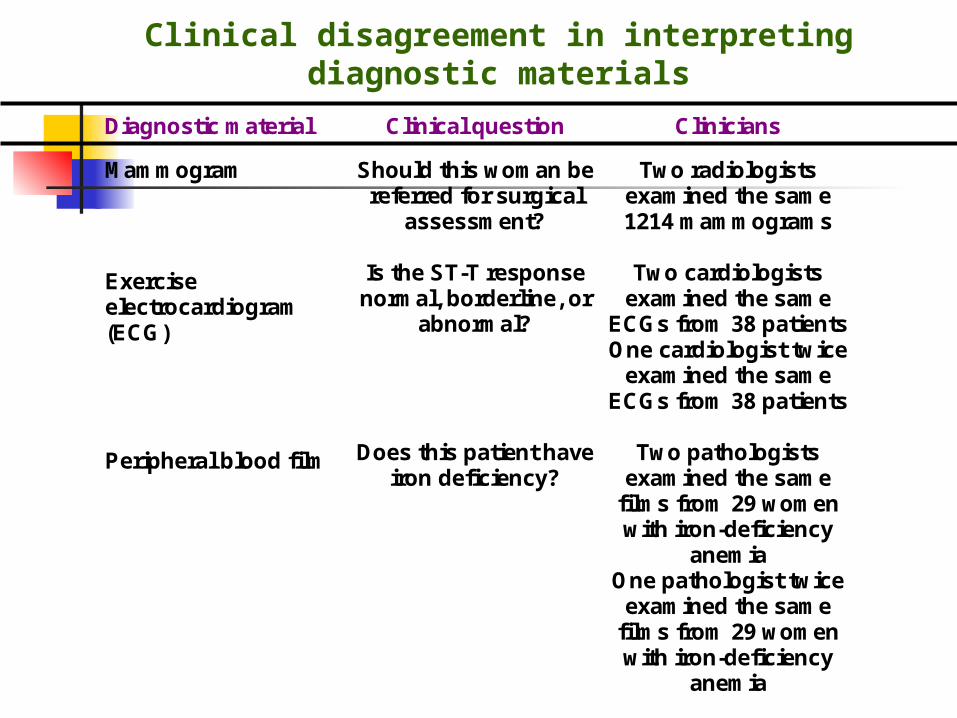
Clinical disagreement in interpreting diagnostic materials
Diagnostic material Clinical question Clinicians
Mammogram
Exercise electrocardiogram (ECG) Peripheral blood film
Should this woman be referred for surgical
assessment?
Is the ST-T response normal, borderline, or
abnormal?
Does this patient have iron deficiency?
Two radiologists examined the same 1214 mammograms
Two cardiologists
examined the same ECGs from 38 patients One cardiologist twice
examined the same ECGs from 38 patients
Two pathologists
examined the same films from 29 women with iron-deficiency
anemia One pathologist twice
examined the same films from 29 women with iron-deficiency
anemia
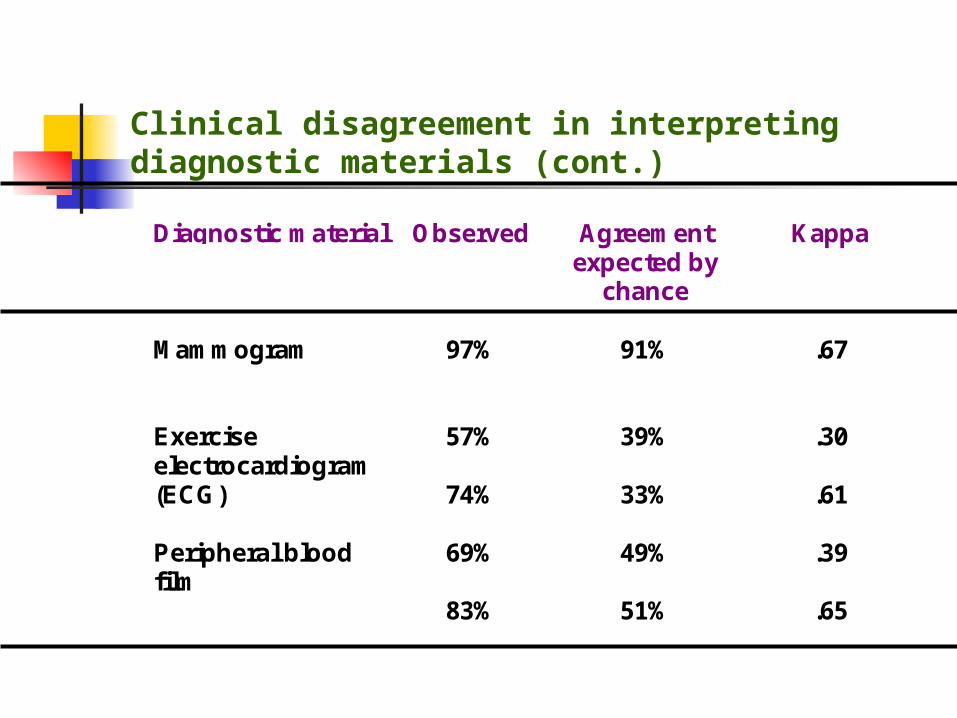
Clinical disagreement in interpreting diagnostic materials (cont.)
Diagnostic material Observed Agreementexpected by
chance
Kappa
Mammogram
Exerciseelectrocardiogram(ECG)
Peripheral bloodfilm
97%
57%
74%
69%
83%
91%
39%
33%
49%
51%
.67
.30
.61
.39
.65
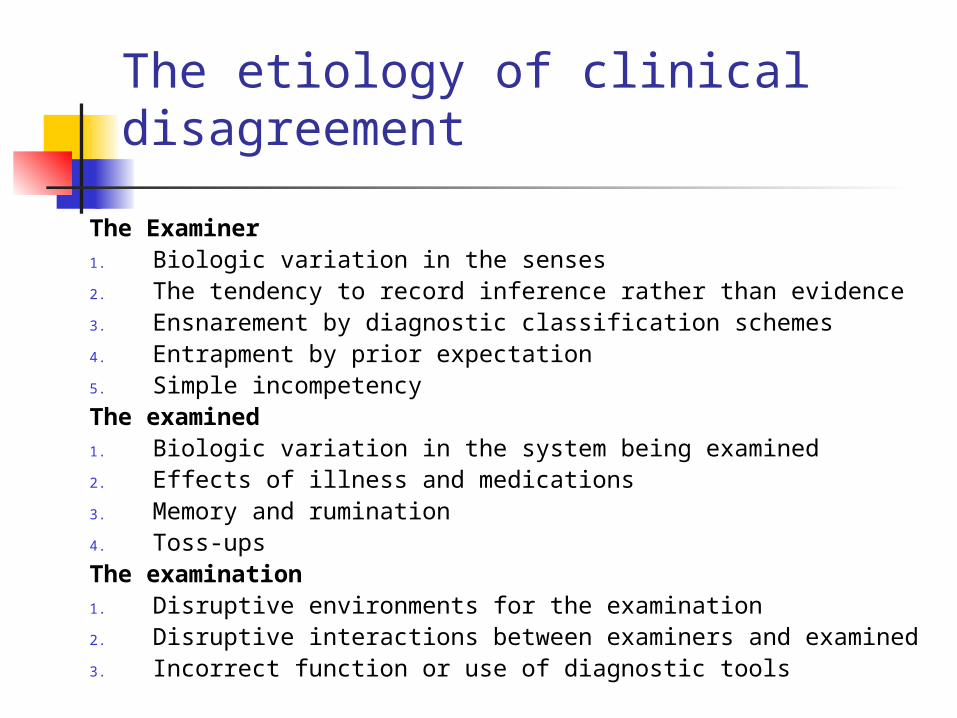
The etiology of clinical disagreement
The Examiner1. Biologic variation in the senses2. The tendency to record inference rather than evidence3. Ensnarement by diagnostic classification schemes4. Entrapment by prior expectation5. Simple incompetencyThe examined1. Biologic variation in the system being examined2. Effects of illness and medications3. Memory and rumination4. Toss-upsThe examination1. Disruptive environments for the examination2. Disruptive interactions between examiners and examined3. Incorrect function or use of diagnostic tools
Alvan Feinstein
“To advance art and science in clinical examination, the equipment a clinician most needs to improve is himself”
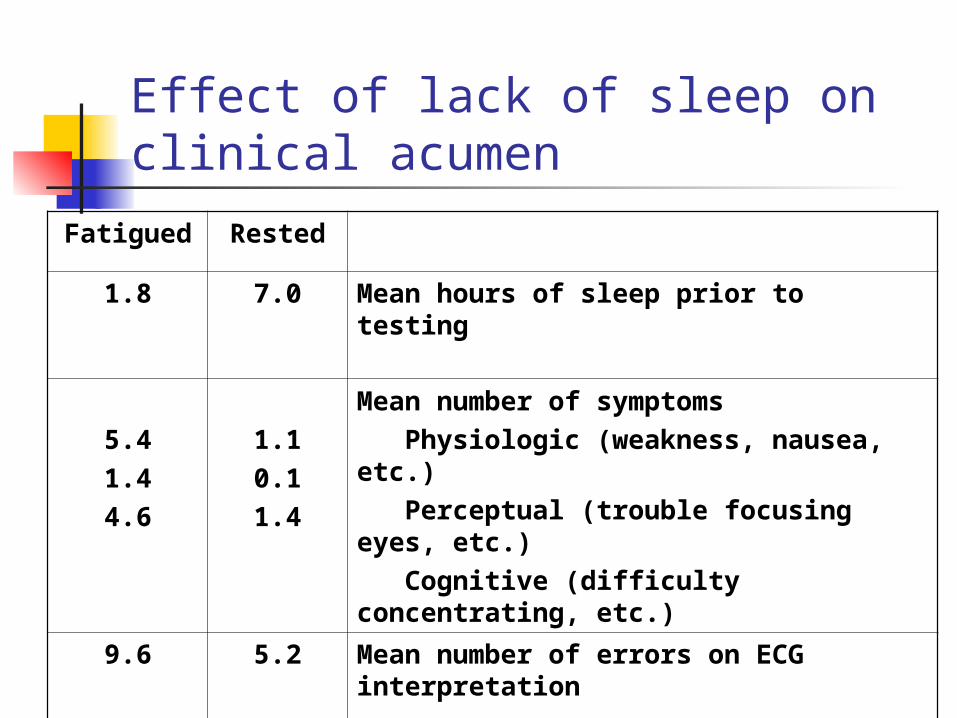
Effect of lack of sleep on clinical acumen
RestedFatigued
Mean hours of sleep prior to testing7.01.8
Mean number of symptoms Physiologic (weakness, nausea, etc.) Perceptual (trouble focusing eyes, etc.) Cognitive (difficulty concentrating, etc.)
1.10.11.4
5.41.44.6
Mean number of errors on ECG interpretation
5.29.6
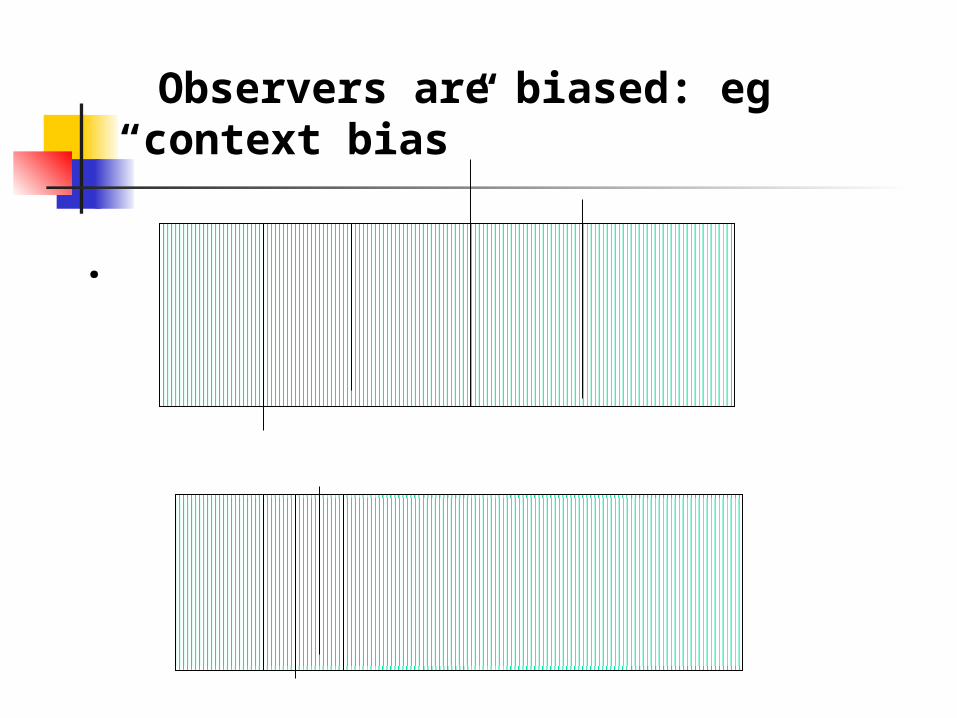
Observers are biased: eg “context bias”
.
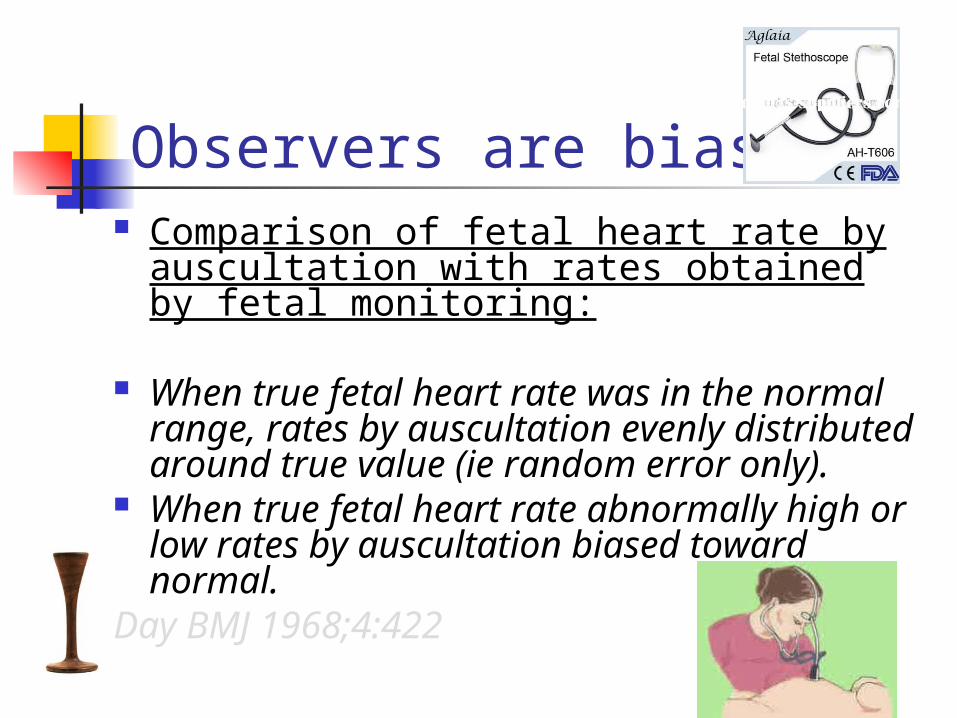
Observers are biased Comparison of fetal heart rate by
auscultation with rates obtained by fetal monitoring:
When true fetal heart rate was in the
normal range, rates by auscultation evenly distributed around true value (ie random error only).
When true fetal heart rate abnormally high or low rates by auscultation biased toward normal.
Day BMJ 1968;4:422
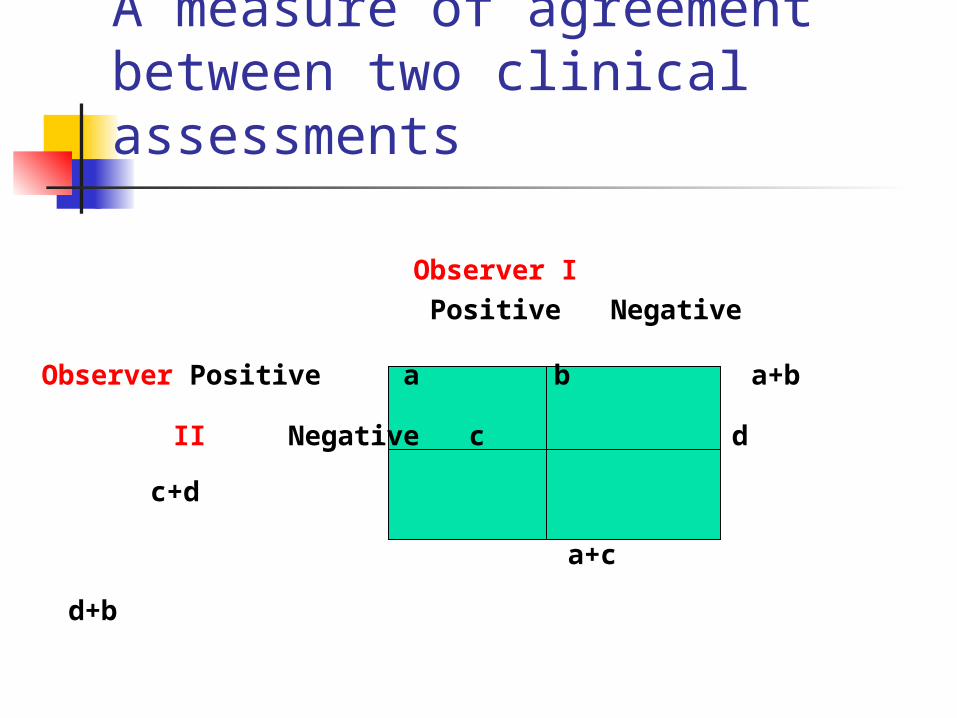
A measure of agreement between two clinical assessments
Observer I Positive Negative
Observer Positive a b a+b
II Negative c d c+d
a+c d+b
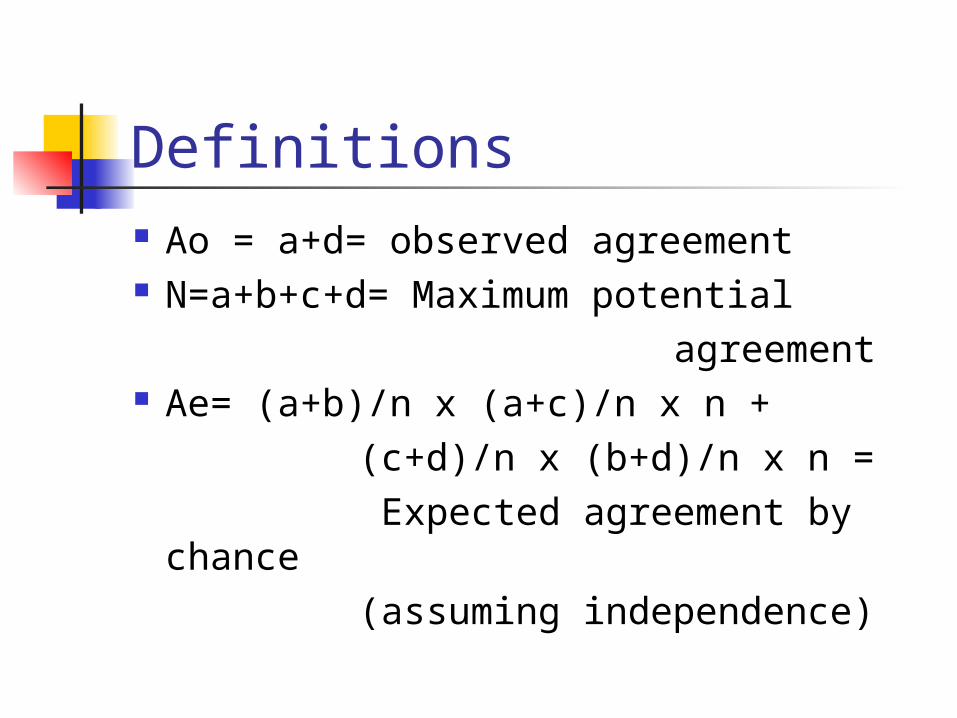
Definitions Ao = a+d= observed agreement N=a+b+c+d= Maximum potential agreement Ae= (a+b)/n x (a+c)/n x n + (c+d)/n x (b+d)/n x n = Expected agreement by chance (assuming independence)
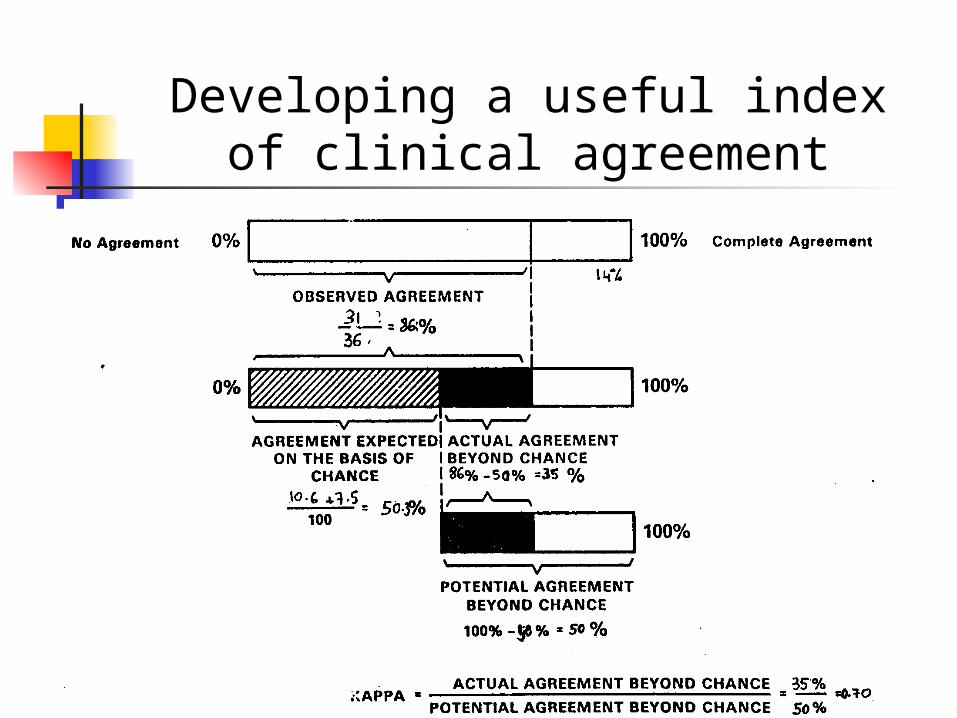
Developing a useful index of clinical agreement
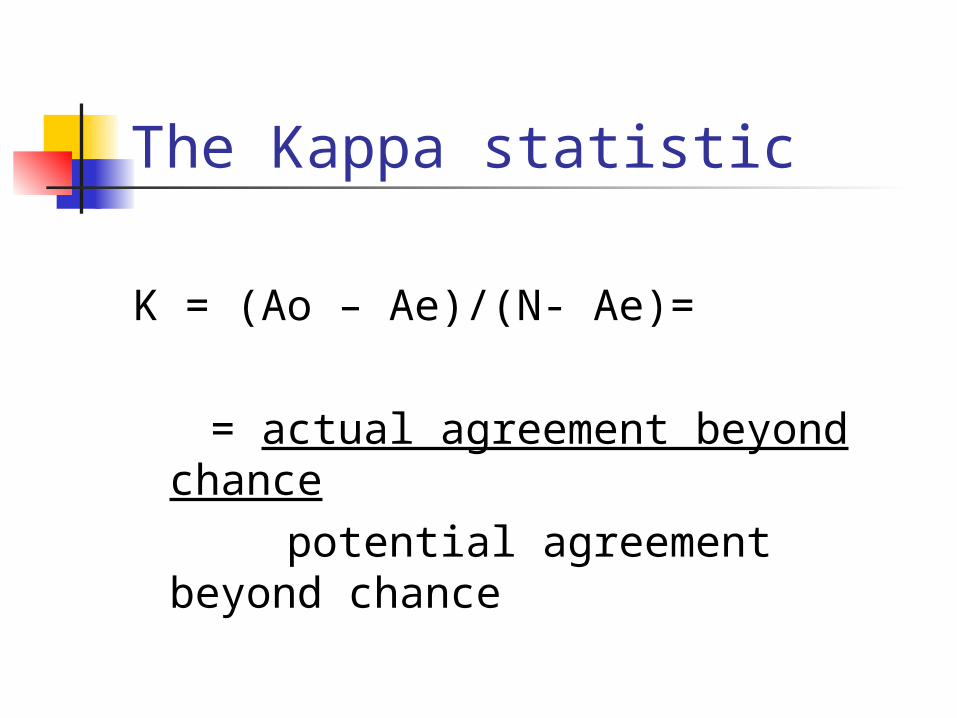
The Kappa statistic
K = (Ao – Ae)/(N- Ae)=
= actual agreement beyond chance
potential agreement beyond chance
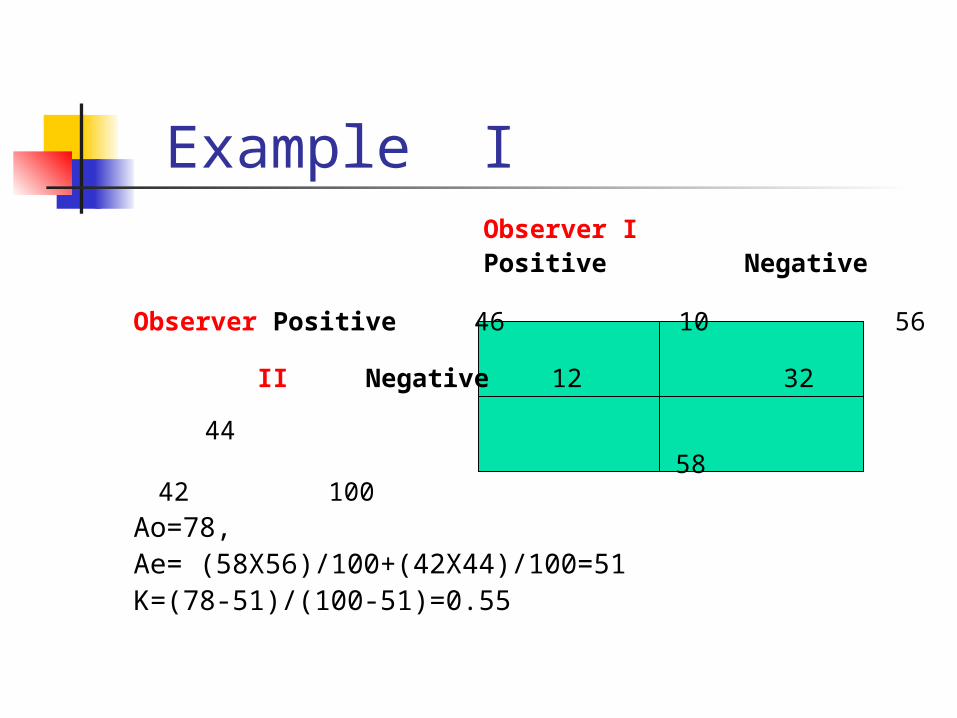
Example I Observer I
Positive Negative
Observer Positive 46 10 56
II Negative 12 32 44
58 42 100Ao=78, Ae= (58X56)/100+(42X44)/100=51K=(78-51)/(100-51)=0.55
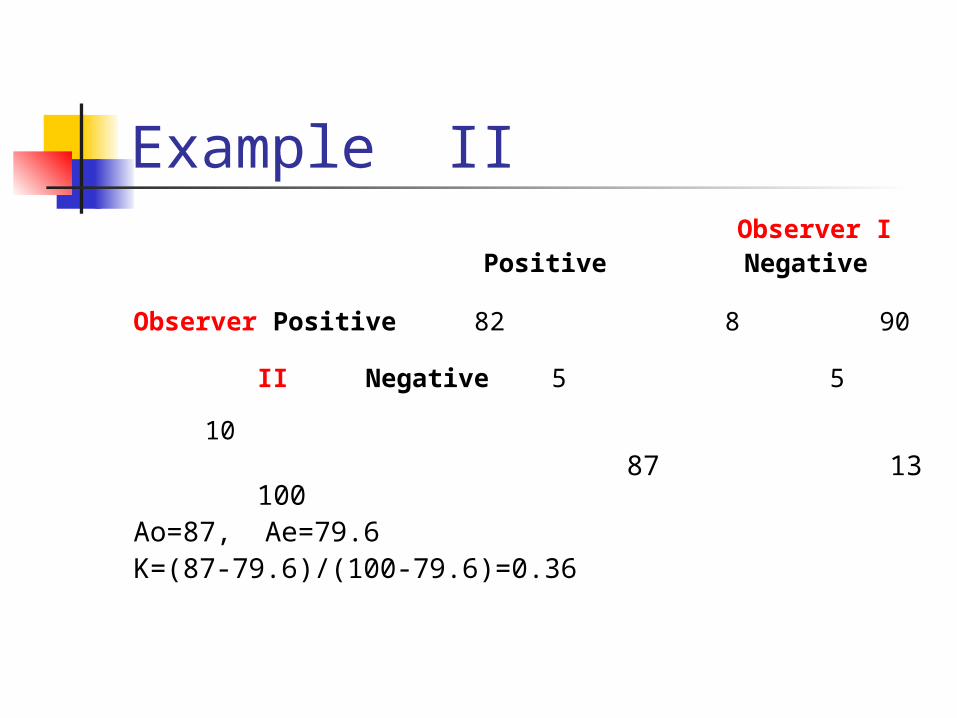
Example II Observer I
Positive Negative
Observer Positive 82 8 90
II Negative 5 5 10 87 13 100Ao=87, Ae=79.6K=(87-79.6)/(100-79.6)=0.36
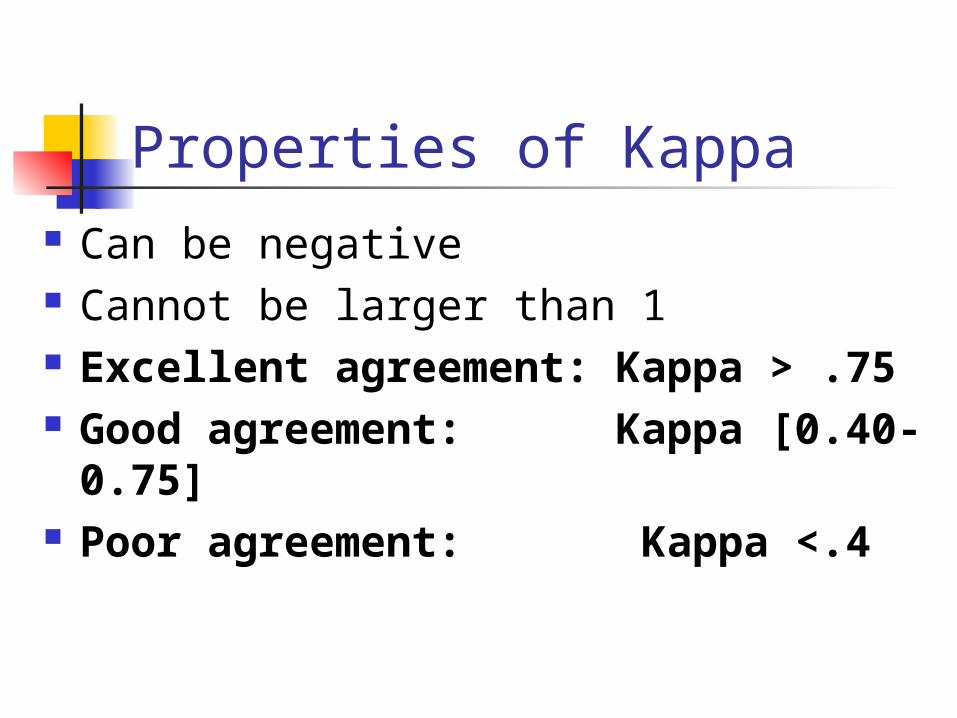
Properties of Kappa Can be negative Cannot be larger than 1 Excellent agreement: Kappa > .75 Good agreement: Kappa [0.40-
0.75] Poor agreement: Kappa <.4
Continuous traits For continuous traits e.g
cholesterol a correlation coefficient can be
used