Reliability-Based versus Allowable Stress Design of ...
125
Reliability-Based versus Allowable Stress Design of Foundations for the Center for Missouri Studies Building A Thesis presented to the Faculty of the Graduate School at the University of Missouri-Columbia In Partial Fulfillment of the Requirements for the Degree Master of Science by NATHANIEL DUMMERTH Dr. John J. Bowders, P.E. Thesis Supervisor DECEMBER 2017
Transcript of Reliability-Based versus Allowable Stress Design of ...

Reliability-Based versus Allowable Stress Design of Foundations for the Center for Missouri Studies Building
A Thesis presented to the Faculty of the Graduate School
at the University of Missouri-Columbia
In Partial Fulfillment of the Requirements for the Degree
Master of Science
by NATHANIEL DUMMERTH
Dr. John J. Bowders, P.E. Thesis Supervisor
DECEMBER 2017

ii
The undersigned, appointed by the dean of the Graduate School, have examined the thesis entitled
Reliability-Based versus Allowable Stress Design of Foundations for the Center for Missouri Studies Building
Presented by Nathaniel Dummerth,
a candidate for the degree of Master of Science in Civil Engineering,
and hereby certify that, in their opinion, it is worthy of acceptance.
______________________________________________ Professor John J. Bowders, P.E.
______________________________________________ Professor Brent L. Rosenblad, P.E.
______________________________________________ Professor Francisco Gomez
iii
Reliability-Based versus Allowable Stress Design of Foundations for the Center for Missouri Studies Building
Abstract
Uncertainty in design parameters is inherent to the field of geotechnical engineering. Allowable
stress design has conventionally been used for foundation design and accounts for uncertainty in
geotechnical parameters and consequences of failure by assigning a global factor of safety.
Allowable stress design is typically a conservative approach and may result in increased
construction costs. The objective of the thesis is to compare allowable stress design with
reliability-based design of foundations. The secondary objective is to initiate a ‘living’ database
of geotechnical parameters for the University of Missouri – Columbia Campus, which will be
expanded by future graduate students.
A geologic history and site investigation results are presented to characterize subsurface
conditions for the Center for Missouri Studies building in Columbia, Missouri and are entered
into the geotechnical database. The existing foundation system of the Center for Missouri Studies
building is evaluated using allowable stress design methods. The existing foundation system is
reconsidered using reliability-based design. In a reliability-based design, uncertainty is quantified
by evaluating the distribution of geotechnical strength parameters and structural loads. Two
alternative foundation types are also considered.
Reliability-based design was shown to be less conservative than allowable stress design. Both
methods produced safe and reliable results, but foundation costs were reduced by seven (7) to
thirty-five (35) percent when reliability-based design was used. The probability of failure of the
foundations was acceptable from both design methods, but was unnecessarily conservative when
using allowable stress design. A final objective of the thesis is to provide a template for future

iv
geotechnical engineering students to assemble an interactive geotechnical database and detailed
subsurface profile for the University of Missouri-Columbia Campus. Appropriate use of the
database and increased implementation of reliability-based design can reduce future design and
construction costs of local foundations while assuring acceptable levels of reliability.

v
Acknowledgements
First and foremost, I would like to thank my advisor Dr. John Bowders for his continuous and
tireless support. Dr. Bowders was the instructor for my first ever course at Mizzou, and has
helped guide me through my undergraduate and graduate careers. His enthusiasm for
geotechnical engineering will continue to inspire me throughout my professional career.
Next, I would like to thank Dr. Brent Rosenblad for serving on my thesis committee and as the
professor for five of my engineering courses at Mizzou. I want to thank Dr. Francisco Gomez for
serving on my thesis committee and his advice throughout the thesis process. I would like to
thank Tanya Harris and Gerald Morgan of MU Campus Facilities for providing access to
Campus geotechnical data. I would also like to thank Dr. Dan Ding for her assistance with
micropile design and Andy Boeckmann for his LRFD advice. I would also like to recognize and
thank my fellow graduate student Ben Shetley for his willingness to provide feedback and
assistance at any time. Many thanks are extended to Mary Ellen Bruce Large from Deep
Foundations Institute and John Wolosick from Hayward Baker for providing detailed
information on up-to-date micropile costs used in industry. Finally, I would like to thank Kent
Richardson from Subsurface Constructors for providing complete plans and cost estimates for
drilled shaft construction.
vi
Table of Contents Abstract .......................................................................................................................................... iii
Acknowledgements ......................................................................................................................... v
Table of Contents ........................................................................................................................... vi
List of Figures .............................................................................................................................. viii
List of Tables .................................................................................................................................. x
1.0 Introduction ............................................................................................................................... 1
1.1. Background .......................................................................................................................... 1
1.2. Objectives ............................................................................................................................. 2
1.3. Scope of Work ...................................................................................................................... 2
1.4. Layout of the Thesis ............................................................................................................. 2
2.0 Methods..................................................................................................................................... 4
2.1. Introduction .......................................................................................................................... 4
2.2. Structure Details ................................................................................................................... 4
2.3. Geology ................................................................................................................................ 9
2.4. Subsurface Investigation ...................................................................................................... 9
2.5. Allowable Stress Design – Conventional Method ............................................................. 20
2.5.1. Existing Foundation Design ........................................................................................ 20
2.5.2. Alternative Design 1 .................................................................................................... 23
2.5.3. Alternative Design 2 .................................................................................................... 26
2.6. Load and Resistance Factor Design – Reliability Method ................................................. 31
2.6.1. Spread Footings ........................................................................................................... 34
2.6.2. Drilled Shafts ............................................................................................................... 37
2.6.3. Driven Piles ................................................................................................................. 43
2.6.4. Micropiles .................................................................................................................... 44
2.7. Cost Analysis Method ........................................................................................................ 47
2.8. Summary ............................................................................................................................ 49
3.0 Results ..................................................................................................................................... 50
3.1. Introduction ........................................................................................................................ 50
3.2. Existing Foundation Design ............................................................................................... 50
3.2.1. Allowable Stress Design .............................................................................................. 50
3.2.2. Load and Resistance Factor Design............................................................................. 51
vii
3.2.3. Cost Analysis ............................................................................................................... 53
3.3. Proposed Alternative Foundation Design 1 ....................................................................... 55
3.3.1. Allowable Stress Design .............................................................................................. 55
3.3.2. Load and Resistance Factor Design............................................................................. 56
3.3.3. Cost Analysis ............................................................................................................... 57
3.4. Proposed Alternative Foundation Design 2 ....................................................................... 58
3.4.1. Allowable Stress Design .............................................................................................. 58
3.4.2. Load and Resistance Factor Design............................................................................. 59
3.4.3. Cost Analysis ............................................................................................................... 60
3.5. Summary ............................................................................................................................ 61
4.0 Discussion ............................................................................................................................... 62
4.1. Introduction ........................................................................................................................ 62
4.2. Existing Foundation – ASD vs. LRFD .............................................................................. 62
4.2.1. Spread Footings ........................................................................................................... 62
4.2.2. Drilled Shafts ............................................................................................................... 65
4.3. Existing Foundation Design vs. Alternative Foundation Designs ..................................... 69
4.3.1. Alternative Design 1 .................................................................................................... 69
4.3.2. Alternative Design 2 .................................................................................................... 70
4.4. Summary ............................................................................................................................ 70
5.0 Conclusions ............................................................................................................................. 72
5.1. Summary ............................................................................................................................ 72
5.2. Conclusions ........................................................................................................................ 72
5.3. Recommendations .............................................................................................................. 74
5.3.1. Practical Implications .................................................................................................. 74
5.3.2. Future Research ........................................................................................................... 75
References ..................................................................................................................................... 77
Appendix A: Boring Logs and Laboratory Test Results .............................................................. 79
Appendix B: gINT Cross-Sections ............................................................................................. 101
Appendix C: Sample Calculations .............................................................................................. 109

viii
List of Figures Figure 2-1 – Location of Proposed Center for Missouri Studies Building (Enclosed by Green Line) ................................................................................................................................................ 6 Figure 2-2 – Borehole Location Plan (Engineering Surveys & Services, 2016) .......................... 11 Figure 2-3 – Summary of Laboratory Test Results for Borings B1-B9 (Engineering Surveys & Services, 2016) .............................................................................................................................. 14 Figure 2-4 - Summary of Laboratory Test Results for Borings B10-B17 (Engineering Surveys & Services, 2016) .............................................................................................................................. 15 Figure 2-5 Profile of Material Found in Each Borehole (See Fig. 2-2 for Borehole Locations) .. 16 Figure 2-6 – Key to Symbols Used in gINT Cross-Sections ........................................................ 17 Figure 2-7 – Example West to East Cross-Section (6th St. at the left side of the drawing and 7th St. at the right side) ....................................................................................................................... 18 Figure 2-8 - Example South to North Cross-Section (Elm St. at the left side of the drawing and Locust St. at the right side) ........................................................................................................... 19 Figure 2-9 - HP Pile Cross-Section (RW Conklin Steel, 2017) .................................................... 24 Figure 2-10 - Typical Micropile Detail (FHWA, 2005) ............................................................... 29 Figure 2-11 - Resistance Factor, φ, for Bearing Resistance of Shallow Foundation on Rock (Abu El-Ela et al., 2013) ........................................................................................................................ 36 Figure 2-12 - Test Quantity Modifier as a Function of Number of Measurements (Abu El-Ela et al., 2013) ....................................................................................................................................... 37 Figure 2-13 - Typical Rock Material Constants, m and s (Loehr et al., 2011b) ........................... 41 Figure 2-14 - Typical Ranges of Geological Strength Index (GSI) of Limestone (Loehr et al., 2011b) ........................................................................................................................................... 42 Figure 2-15 - Resistance Factor for Unit Tip Resistance of Drilled Shaft in Rock (Loehr et al., 2011b) ........................................................................................................................................... 43 Figure 4-1 - Resistance Factor, φ, for Bearing Resistance of Shallow Foundation on Rock (Abu El-Ela et al., 2013) ........................................................................................................................ 64 Figure 4-2 - Resistance Factor for Unit Tip Resistance of Drilled Shaft in Rock (EPG Drilled Shafts, 2011) ................................................................................................................................. 66 Figure 5-1 – Conceptual Relationship Between Decision Making and Reliability-Based Design (Gilbert, 2003)............................................................................................................................... 75 Figure A-1 – Borehole Location Plan ........................................................................................... 80 Figure A-2 – Symbols and Terms Used in Boring Logs .............................................................. 81 Figure A-3 – Summary of Laboratory Test Results for Borings B1-B9....................................... 82 Figure A-4 - Summary of Laboratory Test Results for Borings B10-B17 ................................... 83 Figure A-5 – Log of Boring B1 .................................................................................................... 84 Figure A-6 - Log of Boring B2 ..................................................................................................... 85 Figure A-7 - Log of Boring B3 ..................................................................................................... 86 Figure A-8 - Log of Boring B4 ..................................................................................................... 87 Figure A-9 - Log of Boring B5 ..................................................................................................... 88 Figure A-10 - Log of Boring B6 ................................................................................................... 89 Figure A-11 - Log of Boring B7 ................................................................................................... 90

ix
Figure A-12 - Log of Boring B8 ................................................................................................... 91 Figure A-13 - Log of Boring B9 ................................................................................................... 92 Figure A-14 - Log of Boring B10 ................................................................................................. 93 Figure A-15 - Log of Boring B11 ................................................................................................. 94 Figure A-16 - Log of Boring B12 ................................................................................................. 95 Figure A-17 - Log of Boring B13 ................................................................................................. 96 Figure A-18 - Log of Boring B14 ................................................................................................. 97 Figure A-19 - Log of Boring B15 ................................................................................................. 98 Figure A-20 - Log of Boring B16 ................................................................................................. 99 Figure A-21 - Log of Boring B17 ............................................................................................... 100 Figure B-1 – West to East Cross-Section Showing Borings B4, B17, B5 (6th St. at the left side of the drawing and 7th St. at the right side) .................................................................................... 102 Figure B-2 - West to East Cross-Section Showing Borings B14, B3, B15, B16 (6th St. at the left side of the drawing and 7th St. at the right side) ........................................................................ 103 Figure B-3 - West to East Cross-Section Showing Borings B11, B12, B13 (6th St. at the left side of the drawing and 7th St. at the right side) ................................................................................ 104 Figure B-4 – Diagonal Southwest to Northeast Cross-Section Showing Borings B4, B3, B15, B13 (Corner of Elm St. and 6th St. at the left side of the drawing) ............................................. 105 Figure B-5 - South to North Cross-Section Showing Borings B4, B11, B9, B8 (Elm St. at the left side of the drawing and Locust St. at the right side) ................................................................... 106 Figure B-6 - South to North Cross-Section Showing Borings B5, B16, B13 (Elm St. at the left side of the drawing) .................................................................................................................... 107 Figure B-7 - Diagonal Northwest to Southeast Cross-Section Showing Borings B11, B3, B15, B5 (Corner of Elm St. and 7th St. at the right side of the drawing) ................................................. 108
x
List of Tables Table 2-1 – Drilled Shaft Schedule for Existing Foundation Design (Gouldevans, 2017) ............ 7 Table 2-2 – Spread Footing Schedule for Existing Foundation Design (Gouldevans, 2017)......... 8 Table 2-3 – Summary of RQD Data for Limestone and Shale Sampled at the Center for Missouri Studies Project Site (Engineering Surveys & Services, 2016) ..................................................... 13 Table 2-4 - Comparison of Structural and Geotechnical Resistance for HP 14x73 Pile .............. 25 Table 2-5- Grout-to-Ground Bond Strengths for Different Soil Types (FHWA, 2005) ............... 30 Table 2-6 - Descriptions of the Strength Limit Load Combinations (FHWA, 2011) ................... 33 Table 2-7 - Recommended Probability of Failure for Different Bridge Types (Abu El-Ela et al., 2013) ............................................................................................................................................. 33 Table 2-8 - Shape Correction Factor, cf, as a Function of Footing Shape (Abu El-Ela et al., 2013)....................................................................................................................................................... 35 Table 2-9 - Rock Core Data of Burlington Limestone, Sampled About 1.5 Miles from the Thesis Site (Gunnink and Kiehne, 2002) ................................................................................................. 38 Table 2-10 - Typical mi Constants for Sedimentary Rocks (Loehr et al., 2011b) ........................ 40 Table 2-11 – Estimated Values of End Resistance for Driven Piles (FHWA, 2016) ................... 44 Table 2-12 - Geotechnical Resistance Factors of Axially Loaded Micropiles (AASHTO, 2010) 46 Table 2-13 - Average Price of Each Item Used in Existing Foundation Design (MoDOT, 2014-2016) ............................................................................................................................................. 48 Table 2-14 - Average Price of Each Item Used in Alternative Design 1 (MoDOT, 2014-2016) . 48 Table 2-15 - Average Price of Each Item Used in Alternative Design 2 ...................................... 49 Table 3-1 - Existing Foundation Spread Footing Dimensions and Quantities – ASD ................. 51 Table 3-2 - Drilled Shaft Dimensions and Quantities – ASD ....................................................... 51 Table 3-3 - Values Used to Calculate Tip Resistance of Drilled Shafts ....................................... 52 Table 3-4 - Values Used to Calculate Bearing Capacity of Spread Footings ............................... 53 Table 3-5 - Existing Foundation Spread Footing Dimensions and Quantities - LRFD ................ 53 Table 3-6 - Drilled Shaft Dimensions and Quantities - LRFD ..................................................... 53 Table 3-7 - Cost Summary of Existing Foundation Design - ASD .............................................. 54 Table 3-8 - Cost Summary of Existing Foundation Design - LRFD ............................................ 54 Table 3-9 - Alternative Design 1 Pile Cap Dimensions and Quantities - ASD ............................ 55 Table 3-10 - Alternative Design 1 Spread Footing Dimensions and Quantities - LRFD ............. 56 Table 3-11 - Alternative Design 1 Pile Cap Dimensions and Quantities - LRFD ........................ 56 Table 3-12 - Alternative Design 1 Spread Footing Dimensions and Quantities - LRFD ............. 57 Table 3-13 - Cost Summary of Alternative Design 1 - ASD ........................................................ 58 Table 3-14 - Cost Summary of Alternative Design 1 - LRFD ...................................................... 58 Table 3-15 - Dimensions of Micropile Cross-Section - ASD ....................................................... 59 Table 3-16 - Micropile Quantity and Lengths - ASD ................................................................... 59 Table 3-17 - Dimensions of Micropile Cross-Section - LRFD..................................................... 60 Table 3-18 - Micropile Quantities and Lengths - LRFD .............................................................. 60 Table 3-19 - Cost Summary of Alternative Design 2 - ASD ........................................................ 60 Table 3-20 - Cost Summary of Alternative Design 2 - LRFD ...................................................... 61 Table 4-1 - Probability of Failure of Spread Footings for ASD and LRFD Designs ................... 65

xi
Table 4-2 - Recommended Probability of Failure for Different Bridge Types (Abu El-Ela et al., 2013) ............................................................................................................................................. 67 Table 4-3 - Probability of Failure of Drilled Shafts for ASD and LRFD Designs ....................... 68 Table 4-4 - Comparison of Factor of Safety and Reliability for Existing Foundation Design ..... 68 Table 4-5 - Cost Summary of Each Foundation Option ............................................................... 70

1
1.0 Introduction
1.1. Background
Geotechnical engineering is faced with many sources of uncertainty. The properties of
subsurface materials can be extremely variable, even throughout an individual site. Even heavily
characterized subsurface sites typically sample and test less than one percent of the subsurface
soil or rock. The loads are variable. Due to the variable nature of soils and rock, no site
investigation program can completely capture all the relevant soil properties needed for design.
In this sense, engineering judgement is essential for geotechnical engineers. Uncertainty is
unavoidable, but can be quantified using a reliability-based design approach.
Traditionally, Allowable Stress Design (ASD) has been used to account for uncertainties. The
engineer chooses an appropriate factor of safety by assessing the amount of variability among the
soil and rock properties, and the consequences of a failure or poor performance. Limitations and
biases of the design method are also sources of uncertainty. Uncertainties correspond to more
conservative designs, which are often more expensive. When uncertainty is diminished, designs
can be more efficient, i.e., costs can be reduced while maintaining an acceptable level of
reliability. Therefore, proper evaluation of uncertainty is a critical task for efficient engineering
design.
Uncertainties can be quantified by implementing reliability-based design methods. Load and
resistance factor design (LRFD) is a reliability-based approach to quantify uncertainties in
geotechnical resistance as well as in structural loads. In the thesis, uncertainty in parameters
required for foundation design are evaluated. The distribution of engineering properties and
loads are used in LRFD to design foundations with appropriate reliability.

2
1.2. Objectives
The objective of the thesis is to improve local foundation selection by comparing the relative
foundation costs using ASD and LRFD. The research project is the first of many that will
assemble a geotechnical database for the University of Missouri’s Columbia Campus. The
secondary objective is to use the database to optimize future geotechnical construction on
campus, by quantifying the uncertainty in geotechnical parameters.
1.3. Scope of Work
The MU geotechnical database will compile the results of subsurface investigations that have
been performed on the Columbia, Missouri Campus, using the software gINT Professional
(2017). The first such investigation, on which the thesis is focused, was completed for the Center
for Missouri Studies Building (hereafter, the Center). The existing foundation design of the
Center is evaluated in accordance with both ASD and LRFD. In addition to the existing
foundation layout, two alternative designs are also considered. The alternatives are designed
using both ASD and LRFD approaches. The construction cost of each foundation design is
estimated according to the Unit Bid Prices provided by MoDOT (2014-2016). The total
construction costs of each proposal are compared to determine the most efficient design.
1.4. Layout of the Thesis
The thesis is divided into five chapters. A description of the geologic history, results of the site
investigation program, and foundation design methods are presented in Chapter 2. The
procedures for ASD, LRFD, and cost analysis are discussed. The results of the foundation
analyses and each foundation design are given in Chapter 3. Cost estimates of each foundation
design are also presented in the chapter. Chapter 4 contains a discussion and interpretation of the
results. Comparisons between ASD and LRFD results, the existing and alternative foundation

3
selections, and the costs of each foundation system are discussed in the chapter. Chapter 5
contains conclusions and recommendations for future research and engineering practice.
Throughout the thesis, conventional foundation design is referred to as Allowable Stress Design
(ASD), meaning designed using a factor of safety approach. Reliability-based design is referred
to as Load & Resistance Factor Design (LRFD).

4
2.0 Methods
2.1. Introduction
The overall objective of the thesis is to optimize foundation design near the University of
Missouri-Columbia Campus by comparing the efficiency of Allowable Stress Design (ASD) and
Load & Resistance Factor Design (LRFD). Alternative designs are also proposed for the Center
for Missouri Studies building. A secondary objective is to initiate a geotechnical database of the
subsurface for the MU Campus. Chapter 2 provides the methods and procedures used for the
existing foundation analysis and the design of each alternative foundation system. The chapter
contains background information for the project site. Included are details of the structure, a
geologic history, and results from the field investigation and laboratory testing. The chapter also
includes the ASD and LRFD procedures used for foundation analysis and design. Lastly, the
process of analyzing the costs of the existing and alternative foundations is detailed.
2.2. Structure Details
The site to be considered is the Center for Missouri Studies Building, in downtown Columbia,
Missouri. The building will serve as the new Columbia headquarters of the State Historical
Society of Missouri. The site is bordered by 6th Street to the west, Locust Street to the north, 7th
Street to the east, and Elm Street to the south. Currently under construction, the facility is
expected to be opened in 2019. Figure 2-1 shows a satellite image of the site.
The new facility will be a three-level structure, with an approximate total area of 76,000 square
feet. The main area of the structure, which is the western half of the project site, will have a
finished floor elevation of 714 feet mean sea level (msl). The main area will be supported by
drilled shafts extending into rock. A basement will exist at the eastern half of the site, with a

5
finished floor elevation of 698 feet msl. Spread footings will support the basement portion of the
structure, and will bear directly on limestone. Additionally, a two-level parking structure will be
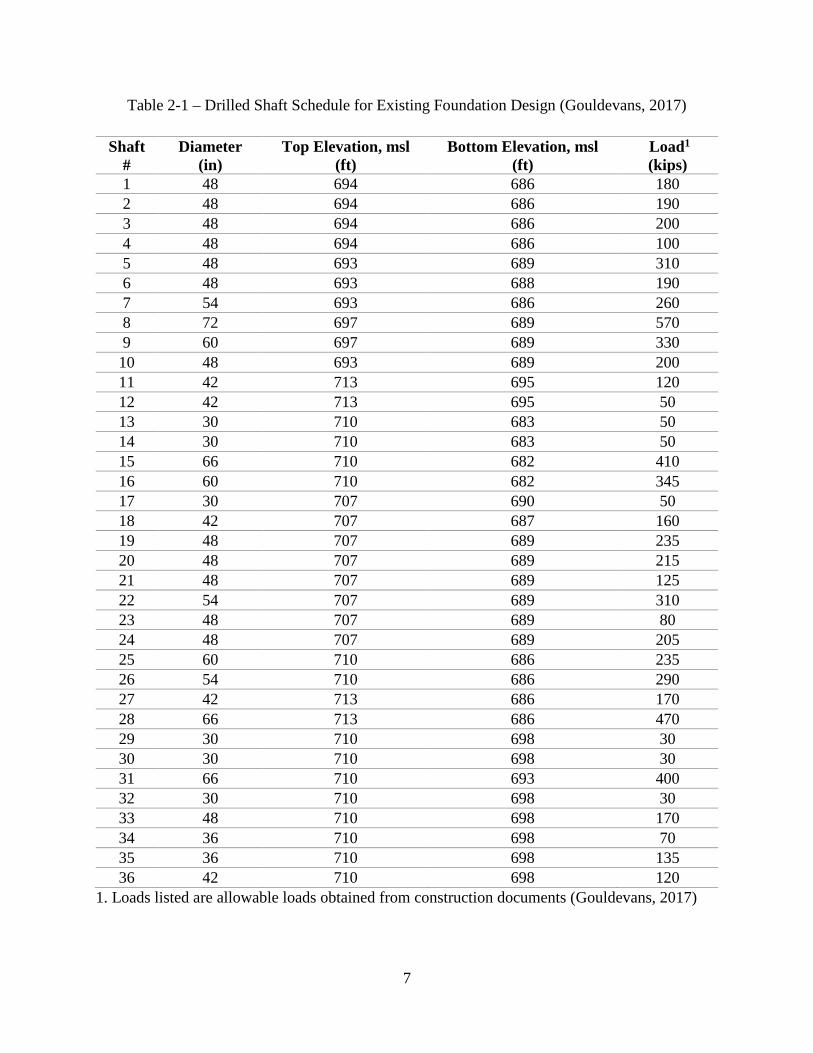
constructed on the northwest corner of the project site. Each drilled shaft in the existing design is
listed in Table 2-1, along with the dimensions and loads. The spread footings of the existing
design are shown in Table 2-2, along with the dimensions of each.

6
Figure 2-1 – Location of Proposed Center for Missouri Studies Building (Enclosed by Green Line)
7
Table 2-1 – Drilled Shaft Schedule for Existing Foundation Design (Gouldevans, 2017)
Shaft #
Diameter (in)
Top Elevation, msl (ft)
Bottom Elevation, msl (ft)
Load1 (kips)
1 48 694 686 180 2 48 694 686 190 3 48 694 686 200 4 48 694 686 100 5 48 693 689 310 6 48 693 688 190 7 54 693 686 260 8 72 697 689 570 9 60 697 689 330 10 48 693 689 200 11 42 713 695 120 12 42 713 695 50 13 30 710 683 50 14 30 710 683 50 15 66 710 682 410 16 60 710 682 345 17 30 707 690 50 18 42 707 687 160 19 48 707 689 235 20 48 707 689 215 21 48 707 689 125 22 54 707 689 310 23 48 707 689 80 24 48 707 689 205 25 60 710 686 235 26 54 710 686 290 27 42 713 686 170 28 66 713 686 470 29 30 710 698 30 30 30 710 698 30 31 66 710 693 400 32 30 710 698 30 33 48 710 698 170 34 36 710 698 70 35 36 710 698 135 36 42 710 698 120
1. Loads listed are allowable loads obtained from construction documents (Gouldevans, 2017)

8
Table 2-2 – Spread Footing Schedule for Existing Foundation Design (Gouldevans, 2017)
Footing # Length (ft) Width (ft) Thickness (ft) Top Elevation, msl (ft) 1 6 6 2 697 2 7 7 2.5 697 3 5 5 2 697 4 7 7 2.5 697 5 7 7 2.5 697 6 8 8 3 697 7 6 6 2 697 8 7 7 2.5 697 9 9 9 3 697 10 9 9 3 697 11 9 9 3 697 12 8 8 3 697 13 6 6 2 697 14 6 6 2 697 15 6 6 2 697 16 7 7 2.5 697 17 6 6 2 697 18 8 8 3 697 19 8 8 3 697 20 6 6 2 697 21 6 6 2 697 22 6 6 2 697 23 6 6 2 697
9
2.3. Geology
The following summary of the geology of the University of Missouri Campus is from Geology of
Boone County, Missouri (Unklesbay, 1952). The Columbia area is covered by glacial drift of
Pleistocene age. The glacial deposits are typically clay, with varying amounts of sand and silt.
The clay is overconsolidated and high shear strengths are typical. The project location contains a
layer of glacial deposits, ranging from 0-20 feet.
Pennsylvanian deposits lie beneath the glacial drift. The Pennsylvanian aged rock is composed
mostly of shale, with interbedded limestone. Pennsylvanian deposits were encountered
throughout the project site. In the Columbia region, the Pennsylvanian layer is thickest when
overlying depressions in the Mississippian layer beneath.
At the MU Campus, the Mississippian aged rock consists primarily of the Burlington formation.
The Burlington formation is a massive, coarse-grained, clastic limestone composed of crinoid
fragments. The upper portion of the Burlington is white to light gray, and often contains
considerable amounts of chert. The entire formation is relatively homogeneous throughout the
upper and lower portions. The Burlington formation exhibits high shear strength and low
compressibility. On the MU Campus, the Burlington ranges in thickness from 6-42 feet. The
surface of the formation is often irregular and weathered. The weathered layer can be up to three
feet thick. The Burlington formation is beneath the entire project location.
2.4. Subsurface Investigation
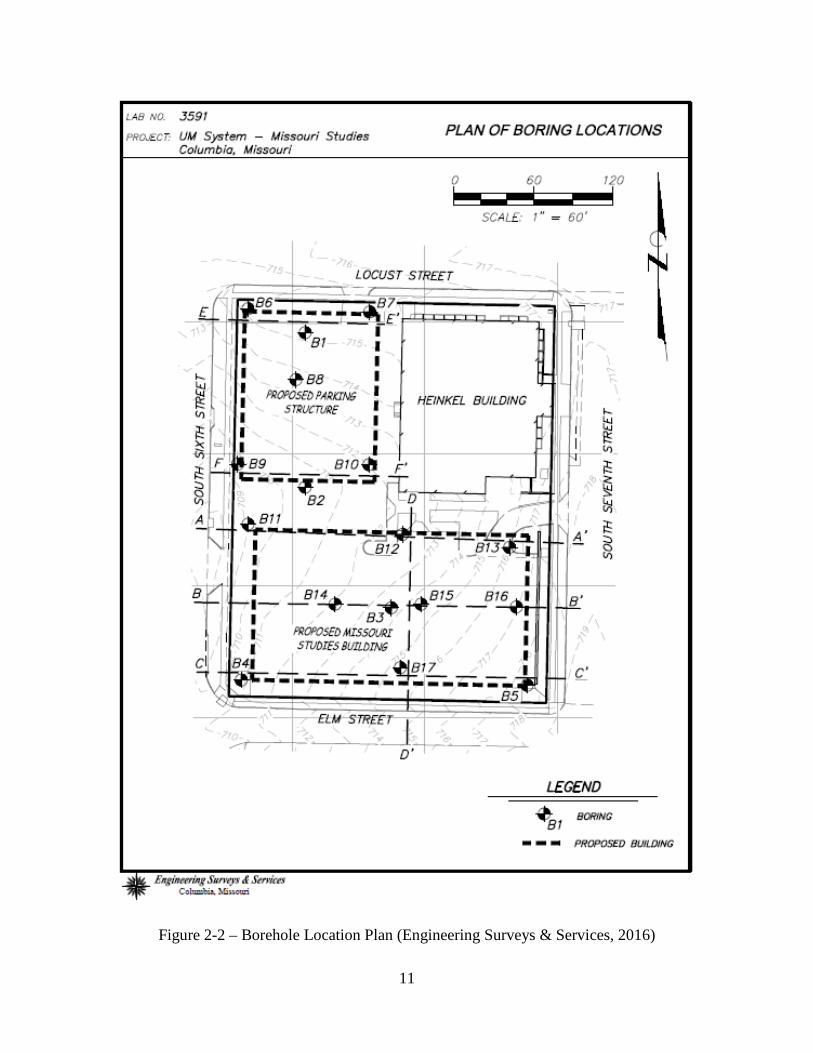
The following site investigation summary of the Center is from the geotechnical report prepared
by Engineering Surveys & Services (2016). Between the preliminary and final site investigation,
17 boreholes were drilled. Ten of the boreholes were drilled within the limits of the main

10
structure, while the other seven were located beneath the proposed parking structure. Disturbed
soil samples, undisturbed soil samples and rock cores were recovered from the boreholes. Visual
classifications were performed to determine soil types and general characteristics. The location
of each borehole is shown in Figure 2-2.
11
Figure 2-2 – Borehole Location Plan (Engineering Surveys & Services, 2016)
12
Laboratory testing was performed on recovered soil and rock samples. Natural moisture content,
dry density, Atterberg limits, and unconfined compressive strength were measured for the soil
samples. Rock cores of Mississippian age were recovered in boreholes B-14 and B-16. The cores
obtained from B-14 contained limestone with thin interbedded shale seams. From B-16, the cores
consisted of Burlington limestone, with some thin shale seams. A summary of the recovered rock
cores is shown in Table 2-3.
The results of the visual classification and laboratory testing indicate a site that consists of shale
and limestone overlain by clay. Most of the boreholes were drilled through a parking lot, so
asphalt and baserock were encountered near the surface. Undocumented fill was found in
boreholes B-2, B-8, B-10, B-13, B-14, and B-15. The uppermost native soil encountered was a
layer of moderate to highly plastic clay. The stratum ranges in thickness from 2 to 11 feet. Sand
and gravel are found throughout much of the clay layer. Generally, the bottom portion of the clay
layer consists of shaley clay. Pennsylvanian aged shale lies beneath the clay, interbedded with
limestone and clay. Only B-5 was terminated in the shale stratum, as the depth of shale reached
31.5 feet beneath the surface at the borehole. The rest of the boreholes were terminated at auger
refusal on limestone. A summary of laboratory test results is shown in Figures 2-3 and 2-4.
In addition to the information provided in the geotechnical report, the subsurface conditions of
the project site are further characterized using gINT Professional software (2017). All borehole
and laboratory testing are reported into gINT for the thesis. The software generates subsurface
cross-sections and several types of graphs and tables. The cross-sections provide a more detailed
subsurface characterization and depths to various strata used for foundation design. Figure 2-5
shows the types and thicknesses of materials encountered in each borehole. The key to symbols
used in the cross-sections is shown in Figure 2-6. The boring logs and summary of lab test results

13
are found in Appendix A. Example cross-sections are shown in Figure 2-7 and 2-8. Additional
cross-sections are found in Appendix B.
Table 2-3 – Summary of RQD Data for Limestone and Shale Sampled at the Center for Missouri
Studies Project Site (Engineering Surveys & Services, 2016)
Boring Core Ground Level, msl (ft) Depth (ft) Recovery (%) RQD (%) B14 1 712 13.2-18.1 89.2 66 B14 2 712 18.1-22.7 73.1 52 B16 1 717.5 16.2-21.2 78 85 B16 2 717.5 21.2-26.5 100 85

14
Figure 2-3 – Summary of Laboratory Test Results for Borings B1-B9 (Engineering Surveys & Services, 2016)

15
Figure 2-4 - Summary of Laboratory Test Results for Borings B10-B17 (Engineering Surveys & Services, 2016)

16
Figure 2-5 Profile of Material Found in Each Borehole (See Fig. 2-2 for Borehole Locations)

17
Figure 2-6 – Key to Symbols Used in gINT Cross-Sections

18
Figure 2-7 – Example West to East Cross-Section (6th St. at the left side of the drawing and 7th St. at the right side)

19
Figure 2-8 - Example South to North Cross-Section (Elm St. at the left side of the drawing and Locust St. at the right side)

20
2.5. Allowable Stress Design – Conventional Method
2.5.1. Existing Foundation Design
ASD procedures are used to evaluate the original foundation system of the Center. The allowable
structural loads applied to each foundation member are provided by the construction documents
(Gouldevans, 2017). The foundation schedule is also given, showing the dimensions and
locations of deep and shallow foundations. The recommended allowable design values of skin
friction and end bearing pressure are found in the geotechnical report (Engineering Surveys &
Services, 2016), as follows:
• Skin Friction in Pennsylvanian Shale/Limestone – 2 ksf
• End Bearing Pressure on Pennsylvanian Shale/Limestone – 20 ksf
• End Bearing Pressure on Burlington (Mississippian) Limestone – 40 ksf
It should be noted that 40 ksf for end bearing on the Burlington formation may be conservative.
Gunnink and Kiehne (2002) conducted Osterberg load tests on drilled shafts that were socketed
into Burlington limestone. The test location was on the University of Missouri – Columbia
Campus, approximately 1.5 miles from the thesis project site. After applying a factor of safety of
three, they concluded that the allowable end bearing pressure of the Burlington limestone is
approximately 500 psi (72 ksf).
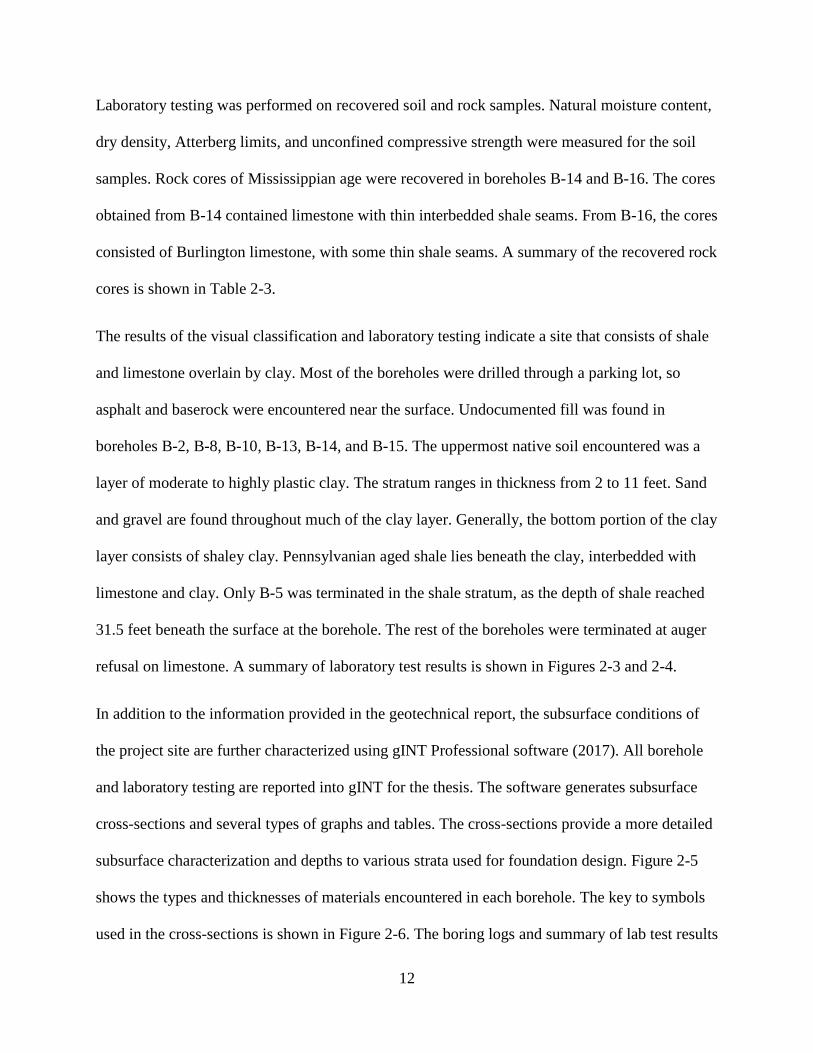
To determine the allowable load on drilled shafts, the end and side areas are calculated, as shown
in Equations 2-1 and 2-2. The ultimate capacity of drilled shafts is calculated as the sum of the
side resistance and end resistance, shown in Equation 2-3. The factor of safety of each drilled
shaft is determined by dividing the structural load by the ultimate capacity.
21
The analysis of the drilled shafts assumes that the shafts were designed for end bearing only, as
Gunnink and Kiehne (2002) state is common in mid-America. Design for end bearing only is
often based on local presumptive values of allowable bearing capacity, which tend to be
conservative, as shown in the design values used above by Engineering Surveys & Services
(2016). According to Cassidy Mathews, Allstate Consultants use presumptive allowable bearing
capacity values of 20 ksf for limestone in the Columbia, Missouri area, and increase the value to
30 ksf if the limestone is known to be intact (personal communication, November 27, 2017). The
ultimate capacity calculated in Equation 2-3 therefore reduces to the ultimate bearing capacity
multiplied by the end area of each shaft.
𝐴𝐴𝑃𝑃 = 𝜋𝜋4𝐷𝐷2 (Eqn. 2-1)
Where:
AP = End Area
D = Diameter of Pier
𝐴𝐴𝑆𝑆 = 𝜋𝜋𝐷𝐷𝜋𝜋 (Eqn. 2-2)
Where:
AS = Side Area
D = Diameter of Pier
L = Length of Pier
22
𝑄𝑄 = 𝑞𝑞𝑢𝑢𝑢𝑢𝑢𝑢𝐴𝐴𝑃𝑃 + 𝑓𝑓𝑆𝑆𝐴𝐴𝑆𝑆 (Eqn. 2-3)
Where:
Q = Ultimate Shaft Capacity
qult = Ultimate End Bearing Pressure
AP = End Area
fs = Skin Friction
AS = Side Area
The structural loads are not provided for the shallow foundations at the Center. A factor of safety
of three is assumed for all spread footings to perform the analysis. The dimensions and locations
of the spread footings are determined from the construction documents (Gouldevans, 2017). The
net allowable bearing capacity of the spread footings is given in the geotechnical report as 10 ksf
(Engineering Surveys & Services, 2016). The allowable structural loads are determined from the
dimensions of each footing. The calculation is shown in Equation 2-4. Since allowable bearing
capacity is equivalent to ultimate bearing capacity divided by the factor of safety, the allowable
structural loads are more simply calculated as the allowable bearing capacity (10 ksf) multiplied
by the area of the footing.

23
𝑃𝑃 = 𝑞𝑞𝑢𝑢𝑢𝑢𝑢𝑢𝐹𝐹𝑆𝑆
𝐴𝐴 (Eqn. 2-4)
Where:
P = Allowable Structural Load
qult = Ultimate Bearing Capacity
FS = Factor of Safety
A = Area of Footing
2.5.2. Alternative Design 1
The first proposed alternative foundation design is a system consisting of driven steel HP piles
and spread footings. The piles are designed with a factor of safety of three. The structural loads
are assumed to be the same as applied on the existing drilled shafts. Loehr et al. (2011a) list three
sizes of steel HP piles, HP 10x42, HP 12x53, and HP 14x73. Each size is considered in
Alternative Design 1. Dimensions of a typical HP pile cross-section are shown in Figure 2-9.
Alternative Design 1 ignores the contribution of skin friction for the ultimate capacity of each
pile. Each pile is driven to the Burlington limestone, so the end resistance is expected to be much
greater than skin friction. This approach is conservative. However, it allows for a more suitable
comparison with the drilled shaft design, which also ignores the contribution of side resistance.
The contribution of skin friction is also ignored in the LRFD approach for driven piles.
According to FHWA (2016), the end resistance of HP piles in rock is typically controlled by the
structural strength of the pile. The structural resistance is calculated using Equation 2-5.
However, the geotechnical resistance (end resistance of the pile) controls this design. The
plugged end area of the pile is used to calculate the end resistance. The plugged area is calculated

24
in Equation 2-6. The ultimate pile end resistance is calculated in Equation 2-7. The results of the
comparison between structural and geotechnical resistance for a sample pile are shown in Table
2-4.
To determine the number of piles required at each pile cap, the structural load is divided by the
ultimate pile end resistance. Each pile is driven to rock, so pile point reinforcement is necessary
for all piles. For simplicity, all pile caps are designed to be two feet thick. Four inches of cover is
provided on all sides of each pile cap. Within each pile cap, the center-to-center spacing between
HP piles is assumed to be three times the depth of the pile.
Figure 2-9 - HP Pile Cross-Section (RW Conklin Steel, 2017)
𝑃𝑃 = 𝐹𝐹𝑦𝑦𝐴𝐴 (Eqn. 2-5)
Where:
P= Structural Nominal Compression Resistance
Fy = Compressive Strength of Steel
A = Cross-Sectional Area of Steel Pile
25
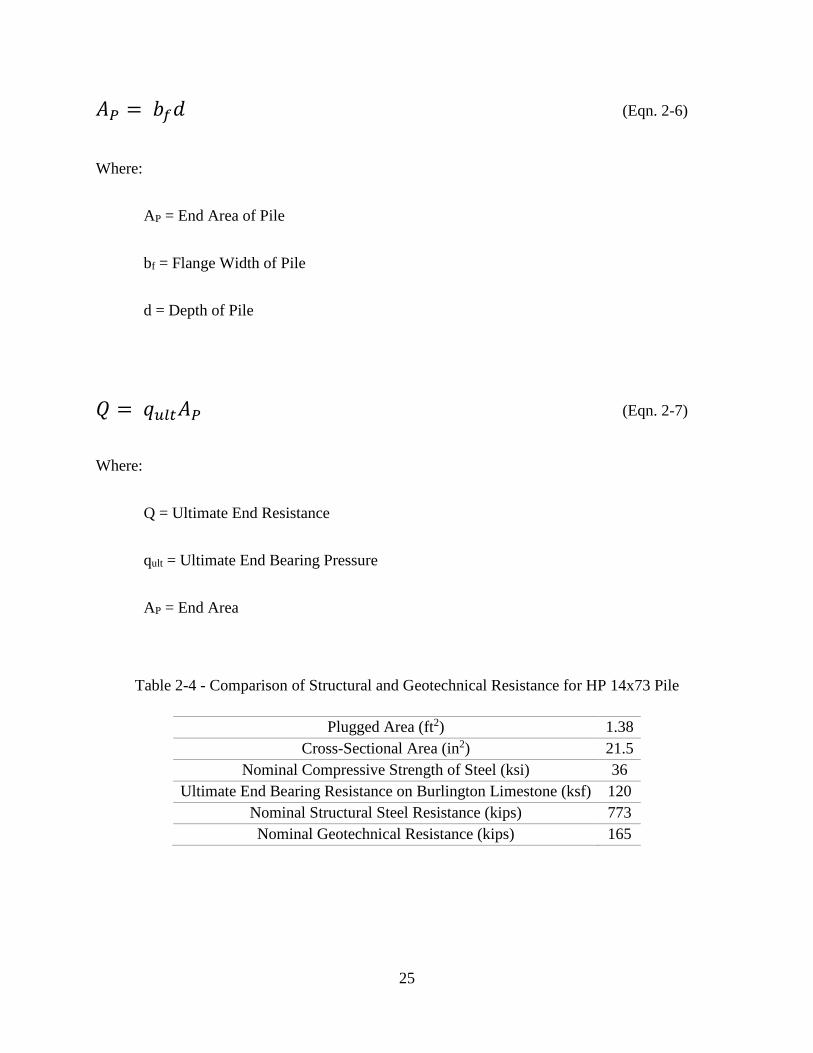
𝐴𝐴𝑃𝑃 = 𝑏𝑏𝑓𝑓𝑑𝑑 (Eqn. 2-6)
Where:
AP = End Area of Pile
bf = Flange Width of Pile
d = Depth of Pile
𝑄𝑄 = 𝑞𝑞𝑢𝑢𝑢𝑢𝑢𝑢𝐴𝐴𝑃𝑃 (Eqn. 2-7)
Where:
Q = Ultimate End Resistance
qult = Ultimate End Bearing Pressure
AP = End Area
Table 2-4 - Comparison of Structural and Geotechnical Resistance for HP 14x73 Pile
Plugged Area (ft2) 1.38 Cross-Sectional Area (in2) 21.5
Nominal Compressive Strength of Steel (ksi) 36 Ultimate End Bearing Resistance on Burlington Limestone (ksf) 120
Nominal Structural Steel Resistance (kips) 773 Nominal Geotechnical Resistance (kips) 165

26
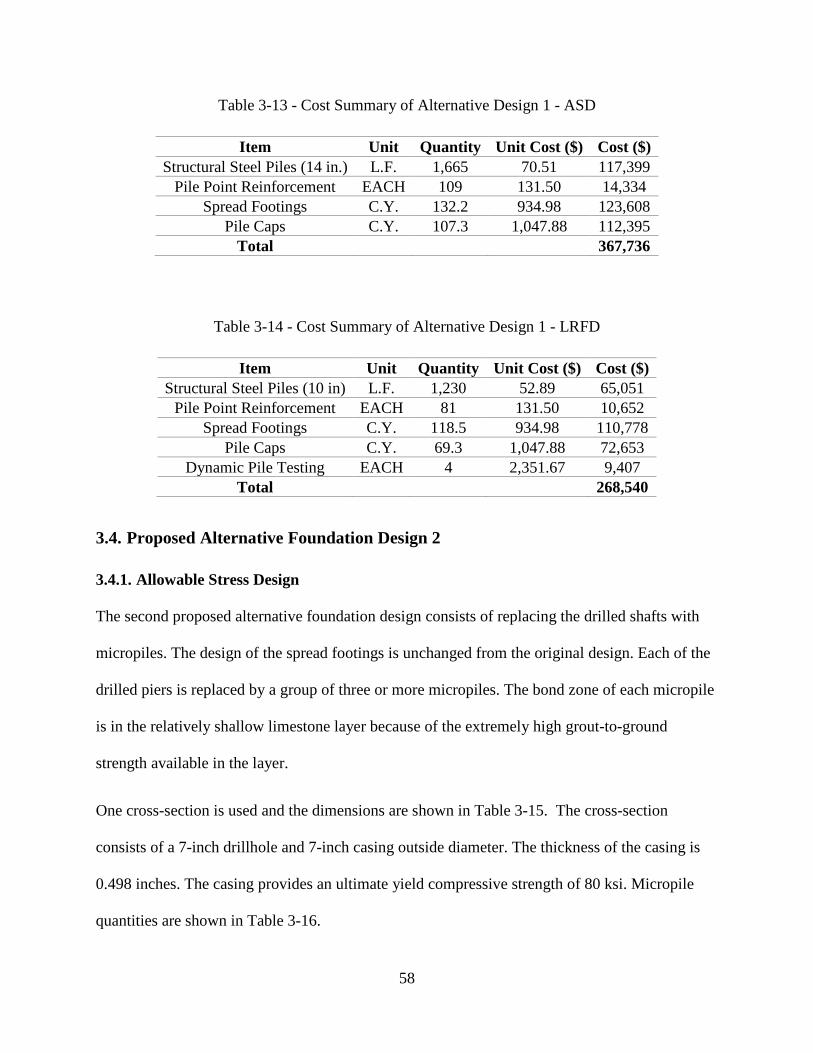
2.5.3. Alternative Design 2
The second proposed design alternative is a system including micropiles and spread footings.
FHWA’s Micropile Design and Construction Reference Manual (2005) is used for the design
procedure. The structural capacity of the micropile typically controls the design (FHWA, 2005).
The structural capacity of the cased section of a micropile is shown in Equation 2-8. For the
uncased portion, the capacity is shown in Equation 2-9.
The geotechnical capacity of micropiles is a function of the bond length. The bond length is the
grout-to-ground portion of the micropile that resists the applied loads. Typically, any
contributions from end bearing are ignored in design. The geotechnical capacity is calculated as
shown in Equation 2-10. Since the applied loads are known, the equation is rearranged to
determine the required bond length (Equation 2-11). Values of grout-to-ground bond strengths
for different soil types can be found in Table 2-5. For the design, the bond length of the
micropiles is within limestone, as highlighted by the thick line in Table 2-5. To be consistent
with the other designs, the micropiles are designed with a factor of safety of three, although
FHWA (2005) recommends a factor of safety of 2.5.
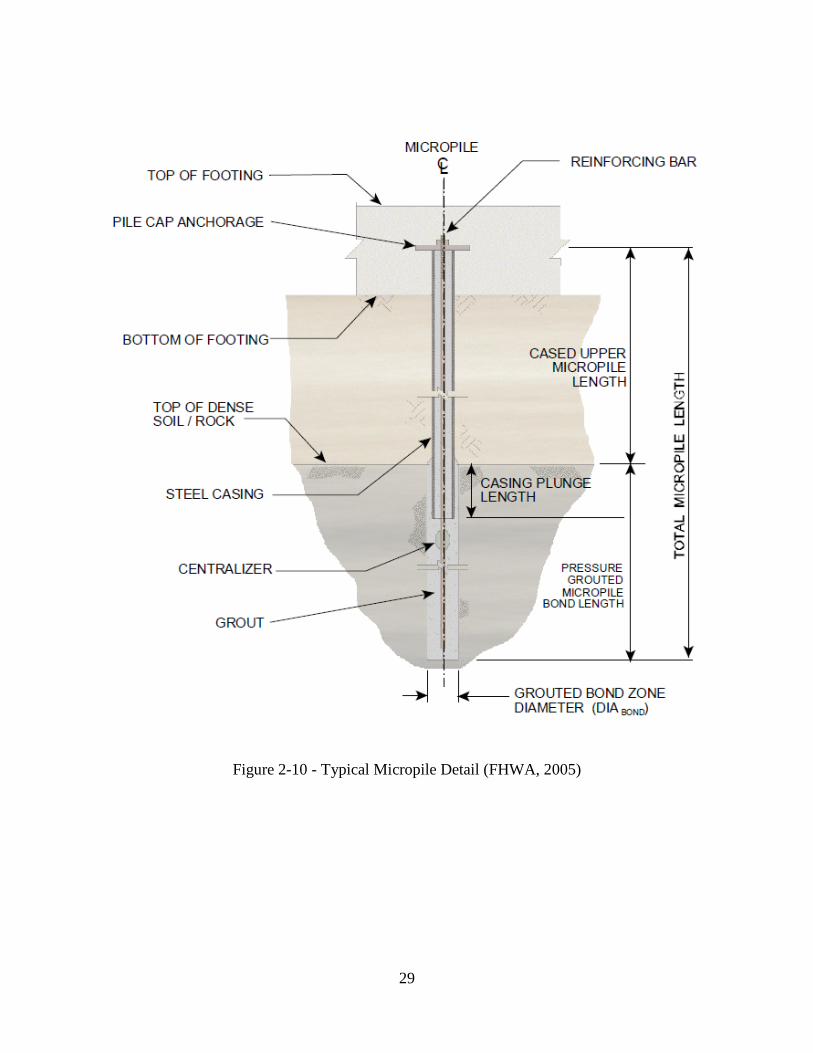
A typical micropile detail is shown in Figure 2-10. As shown, the upper section is cased and
extends through the soil to the top of bedrock. The bond length extends through a suitable dense
stratum, typically rock. The bond length is uncased. A reinforcing bar extends through the entire
length of the micropile to provide additional structural support.

27
𝑃𝑃𝑐𝑐−𝑎𝑎𝑢𝑢𝑢𝑢𝑎𝑎𝑎𝑎𝑎𝑎𝑎𝑎𝑢𝑢𝑎𝑎 = �0.4𝑓𝑓𝑐𝑐−𝑔𝑔𝑔𝑔𝑎𝑎𝑢𝑢𝑢𝑢′ 𝑥𝑥𝐴𝐴𝑔𝑔𝑔𝑔𝑎𝑎𝑢𝑢𝑢𝑢 + 0.47𝐹𝐹𝑦𝑦−𝑠𝑠𝑢𝑢𝑎𝑎𝑎𝑎𝑢𝑢�𝐴𝐴𝑎𝑎𝑎𝑎𝑔𝑔 + 𝐴𝐴𝑐𝑐𝑎𝑎𝑠𝑠𝑐𝑐𝑐𝑐𝑔𝑔��
(Eqn. 2-8)
Where:
Pc-allowable = Allowable Compression Load
f’c = Unconfined Compressive Strength of Grout
Agrout = Area of Grout in Micropile Cross-Section (inside casing only)
Fy-steel = Yield Strength of Steel
Abar = Cross-Sectional Area of Steel Reinforcing Bar
Acasing = Cross-Sectional Area of Steel Casing
𝑃𝑃𝑐𝑐−𝑎𝑎𝑢𝑢𝑢𝑢𝑎𝑎𝑎𝑎𝑎𝑎𝑎𝑎𝑢𝑢𝑎𝑎 = �0.4𝑓𝑓𝑐𝑐′𝑥𝑥𝐴𝐴𝑔𝑔𝑔𝑔𝑎𝑎𝑢𝑢𝑢𝑢 + 0.47𝐹𝐹𝑦𝑦−𝑎𝑎𝑎𝑎𝑔𝑔𝑥𝑥𝐴𝐴𝑎𝑎𝑎𝑎𝑔𝑔� (Eqn. 2-9)

28
𝑃𝑃𝐺𝐺−𝑎𝑎𝑢𝑢𝑢𝑢𝑎𝑎𝑎𝑎𝑎𝑎𝑎𝑎𝑢𝑢𝑎𝑎 = 𝛼𝛼𝑏𝑏𝑏𝑏𝑏𝑏𝑏𝑏𝐹𝐹𝑆𝑆
𝑥𝑥 𝜋𝜋 𝑥𝑥 𝐷𝐷𝑎𝑎 𝑥𝑥 𝜋𝜋𝑎𝑎 (Eqn. 2-10)
Where:
PG-allowable = Allowable Geotechnical Capacity
αbond = Grout to Ground Ultimate Bond Strength
FS = Factor of Safety
Db = Diameter of Drill Hole
Lb = Bond Length
𝜋𝜋𝑎𝑎 = 𝑃𝑃𝐺𝐺−𝑎𝑎𝑢𝑢𝑢𝑢𝑏𝑏𝑎𝑎𝑎𝑎𝑏𝑏𝑢𝑢𝑎𝑎 𝑥𝑥 𝐹𝐹𝑆𝑆𝛼𝛼𝑏𝑏𝑏𝑏𝑏𝑏𝑏𝑏 𝑥𝑥 𝜋𝜋 𝑥𝑥 𝐷𝐷𝑏𝑏
(Eqn. 2-11)
29
Figure 2-10 - Typical Micropile Detail (FHWA, 2005)

30
Table 2-5- Grout-to-Ground Bond Strengths for Different Soil Types (FHWA, 2005)
31
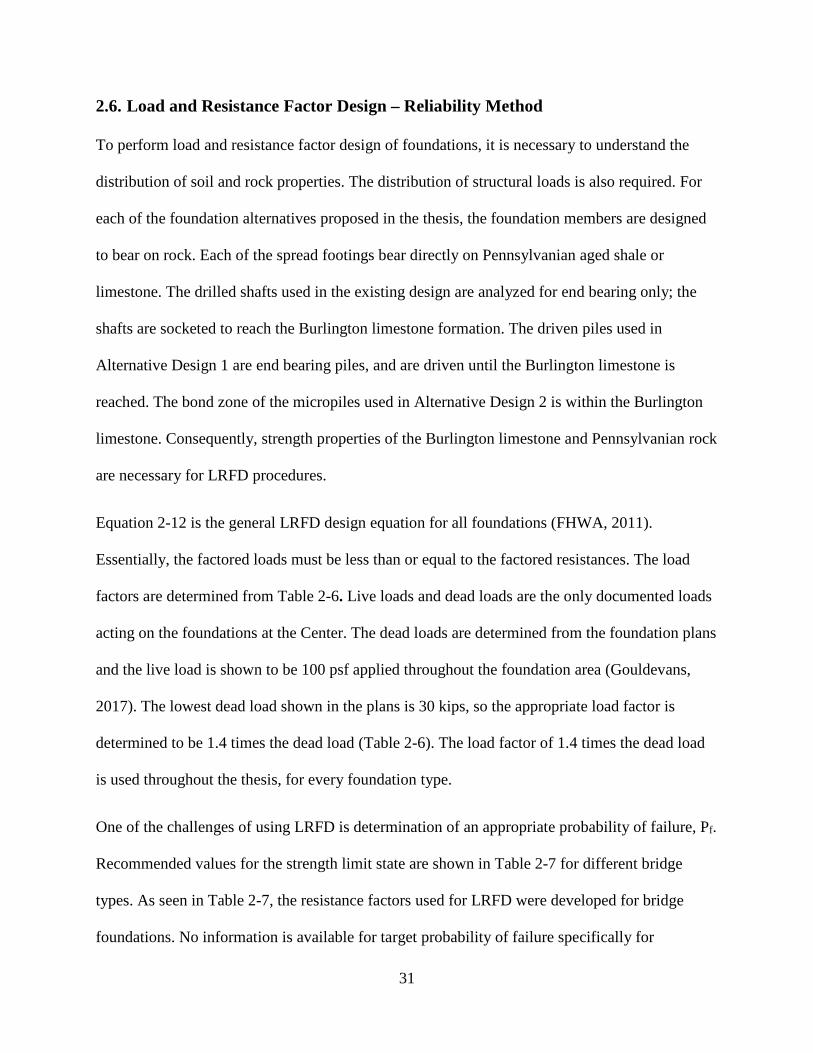
2.6. Load and Resistance Factor Design – Reliability Method
To perform load and resistance factor design of foundations, it is necessary to understand the
distribution of soil and rock properties. The distribution of structural loads is also required. For
each of the foundation alternatives proposed in the thesis, the foundation members are designed
to bear on rock. Each of the spread footings bear directly on Pennsylvanian aged shale or
limestone. The drilled shafts used in the existing design are analyzed for end bearing only; the
shafts are socketed to reach the Burlington limestone formation. The driven piles used in
Alternative Design 1 are end bearing piles, and are driven until the Burlington limestone is
reached. The bond zone of the micropiles used in Alternative Design 2 is within the Burlington
limestone. Consequently, strength properties of the Burlington limestone and Pennsylvanian rock
are necessary for LRFD procedures.
Equation 2-12 is the general LRFD design equation for all foundations (FHWA, 2011).
Essentially, the factored loads must be less than or equal to the factored resistances. The load
factors are determined from Table 2-6. Live loads and dead loads are the only documented loads
acting on the foundations at the Center. The dead loads are determined from the foundation plans
and the live load is shown to be 100 psf applied throughout the foundation area (Gouldevans,
2017). The lowest dead load shown in the plans is 30 kips, so the appropriate load factor is
determined to be 1.4 times the dead load (Table 2-6). The load factor of 1.4 times the dead load
is used throughout the thesis, for every foundation type.
One of the challenges of using LRFD is determination of an appropriate probability of failure, Pf.
Recommended values for the strength limit state are shown in Table 2-7 for different bridge
types. As seen in Table 2-7, the resistance factors used for LRFD were developed for bridge
foundations. No information is available for target probability of failure specifically for

32
foundations of buildings, but it is reasonable to assume that the values from Table 2-7 can be
applied to any foundation. The assumption is valid because a foundation behaves similarly
whether for a bridge or another type of structure. For LRFD procedures in the thesis, the target
probability of failure selected from Table 2-7 is 1/1500. In a later chapter, the probability of
failure for the existing foundation design is back-calculated and compared with the probability of
failure for the LRFD re-designs.
∑𝛾𝛾𝑐𝑐𝑄𝑄𝑐𝑐 ≤ ∑𝜙𝜙𝑐𝑐𝑅𝑅𝑐𝑐𝑐𝑐 (Eqn. 2-12)
Where:
γi = Load Factor
Qi = Force Effect on Foundation (Axial Compression)
φi = Resistance Factor
Rni = Geotechnical Resistance

33
Table 2-6 - Descriptions of the Strength Limit Load Combinations (FHWA, 2011)
Table 2-7 - Recommended Probability of Failure for Different Bridge Types (Abu El-Ela et al., 2013)
Application Classification Recommended Pf
Bridge Foundations (Shallow Foundations)
Major Bridges (>$100M) 1 in 10,000 Major Bridges (<$100M) 1 in 5000 Bridges on Major Roads 1 in 1500 Bridges on Minor Roads 1 in 300

34
2.6.1. Spread Footings
Spread footings at the Center bear directly on Pennsylvanian aged shale or limestone. Abu El-Ela
et al. (2013) detailed LRFD procedures for shallow foundations on rock. The bearing capacity of
shallow foundations can be calculated as a function of uniaxial compressive strength (UCS) and
Rock Quality Designation (RQD), as shown in Equation 2-13.
The shape correction factor is a function of footing shape and is determined from Table 2-8.
Square footings are used in the existing design and in each proposed alternative design, so the
value of cf is 1.25. Figure 2-11 is used to determine the resistance factor to be applied to the
bearing capacity of the spread footing. The coefficient of variation used to determine the
resistance factor is calculated in Equation 2-14. The empirical modifier accounts for the number
of UCS tests performed and is shown in Figure 2-12. The modifier increases as the number of
measurements is decreased. An increased empirical modifier increases the coefficient of
variation, leading to a decreased resistance factor used for design.
Data from two pertinent RQD tests are available for the Center for Missouri Studies project, as
shown in Table 2-3 (Engineering Surveys & Services, 2016). The rock cores from Boring B14
are used for spread footing design. The samples recovered from B14 consist of limestone and
shale of Mississippian age and are not from the intact Burlington limestone, which lies below.
Samples recovered from B14 are likely representative of the rock on which the spread footings
are supported. Unconfined compressive strength test data is not available for Pennsylvanian aged
shale or limestone at the project site. The most relevant data is from Miller’s thesis (2003). In his
study of side shear for drilled shafts, 289 unconfined compression tests were performed on
Pennsylvanian aged material at three sites in Western Missouri. The material tested consists
primarily of shale and limestone, with some coal and siltstone beds. Of the 289 unconfined

35
compression tests performed, the average strength is 131 ksf, with a standard deviation of 18 ksf.
The coefficient of variation of the tests is 0.14. The corresponding resistance factor, as
determined from Figure 2-11, is 0.41. The required area of each footing is calculated as the ratio
of the factored loads to the factored bearing capacity.
𝑞𝑞𝑓𝑓𝑎𝑎𝑐𝑐𝑢𝑢𝑎𝑎𝑔𝑔𝑎𝑎𝑓𝑓 = 𝜙𝜙 ∗ 𝑐𝑐𝑓𝑓(𝑈𝑈𝑈𝑈𝑈𝑈) ∗ 100.013(𝑅𝑅𝑅𝑅𝐷𝐷)−1.34 (Eqn. 2-13)
Where:
qfactored = Factored Bearing Capacity of Spread Footing
φ = Resistance Factor
cf = Shape Correction Factor
UCS = Average Uniaxial Compressive Strength of Rock
RQD = Average Rock Quality Designation Value
Table 2-8 - Shape Correction Factor, cf, as a Function of Footing Shape (Abu El-Ela et al., 2013)
Footing Shape cf Strip (L/B>6 1.00 Rectangular
• L/B=2 1.12 • L/B=5 1.05
Square (L/B=1) 1.25 Circular 1.20

36
Figure 2-11 - Resistance Factor, φ, for Bearing Resistance of Shallow Foundation on Rock (Abu El-Ela et al., 2013)
𝑐𝑐. 𝑜𝑜. 𝑣𝑣𝑦𝑦 = ζ𝜎𝜎𝑦𝑦𝑦𝑦
(Eqn. 2-14)
Where:
c.o.vy = Coefficient of Variation for Mean Value of UCS
σy= Standard Deviation of Mean Value of UCS
y = Mean Value of UCS
ζ = Empirical Modifier to Account for Effects of Quantity of Tests
0.00
0.10
0.20
0.30
0.40
0.50
0.60
0.70
0.00 0.10 0.20 0.30 0.40 0.50 0.60 0.70 0.80 0.90 1.00 1.10 1.20 1.30 1.40 1.50
Resi
stan
ce F
acto
rs, φ
c.o.v of UCS
Prob. Failure (1/100) Prob. Failure (1/300) Prob. Failure (1/1500)
Prob. Failure (1/5000) Prob. Failure (1/10000)
DL/LL=2.0

37
Figure 2-12 - Test Quantity Modifier as a Function of Number of Measurements (Abu El-Ela et al., 2013)
2.6.2. Drilled Shafts
The re-design of the existing drilled shafts from an LRFD approach uses the procedures detailed
by Loehr et al. (2011b). Available data for the Burlington limestone consists of six rock quality
designation (RQD) values and three unconfined strength tests. RQD data of the Burlington
limestone from the Center is shown in Table 2-3. The rock cores recovered from boring B16
consist of the Burlington limestone with thin shale seams. In their study of drilled shaft capacity,
Gunnink and Kiehne (2002) obtained rock cores of Burlington limestone. Three unconfined
compression tests were performed and four RQD values were obtained. The results of the tests
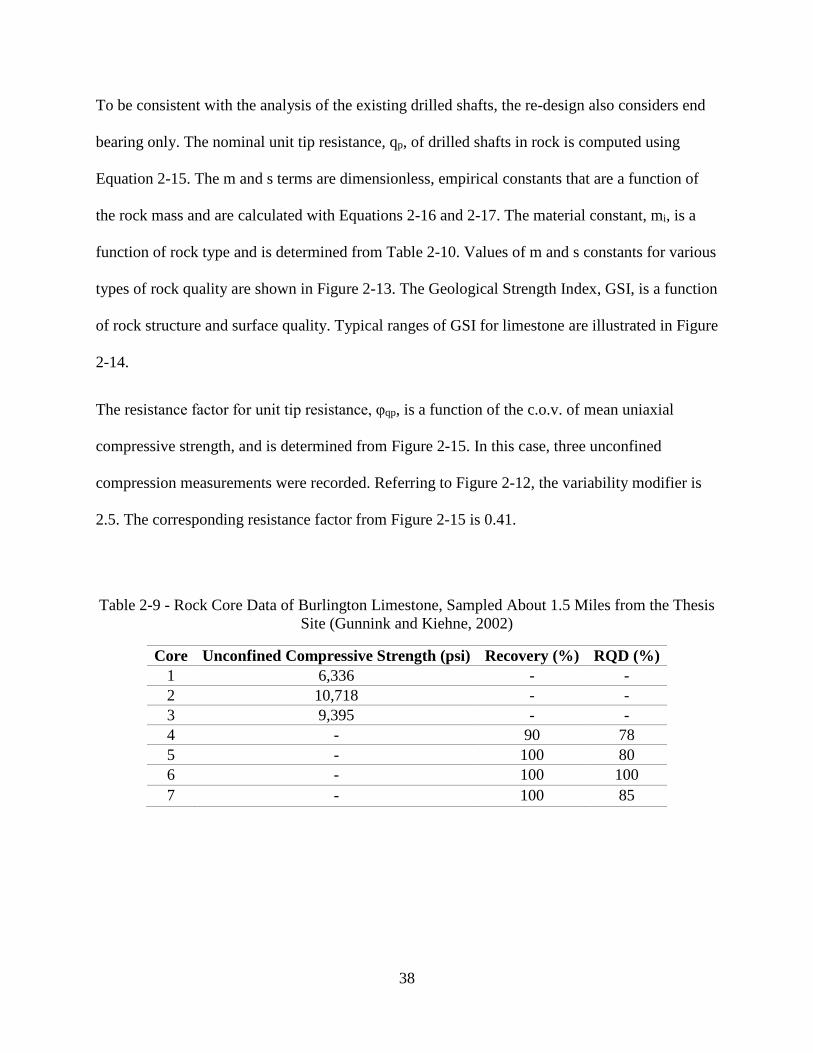
are shown in Table 2-9.
38
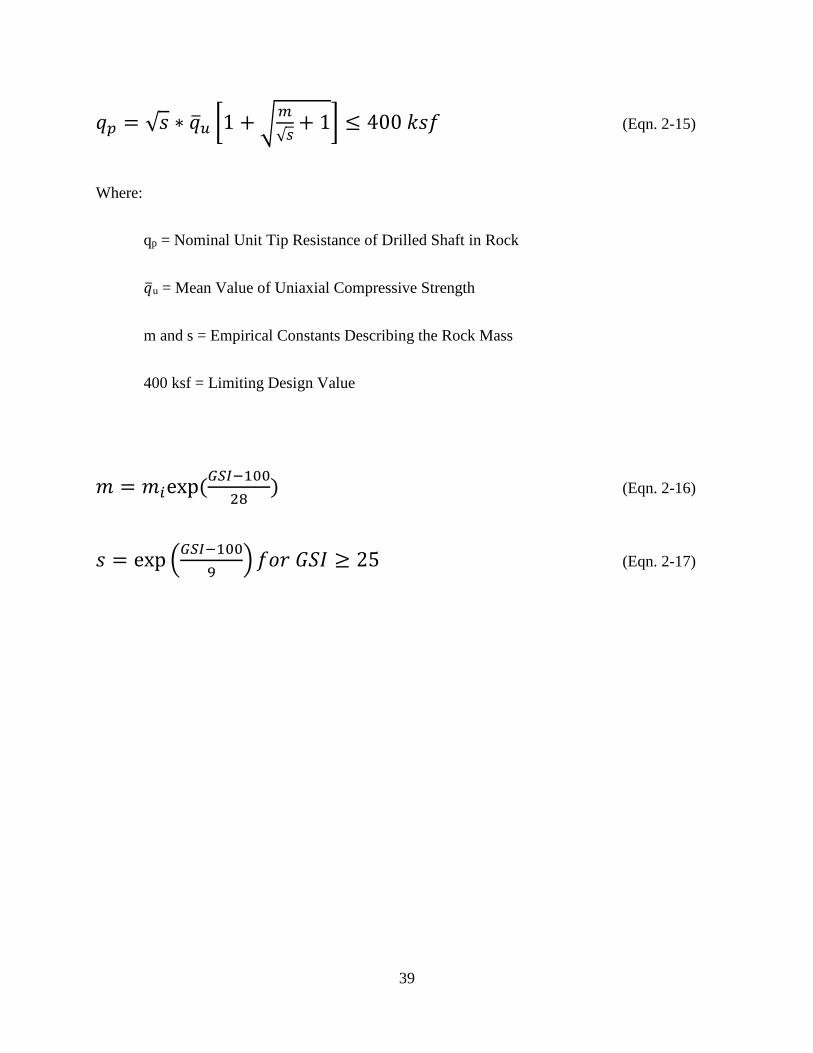
To be consistent with the analysis of the existing drilled shafts, the re-design also considers end
bearing only. The nominal unit tip resistance, qp, of drilled shafts in rock is computed using
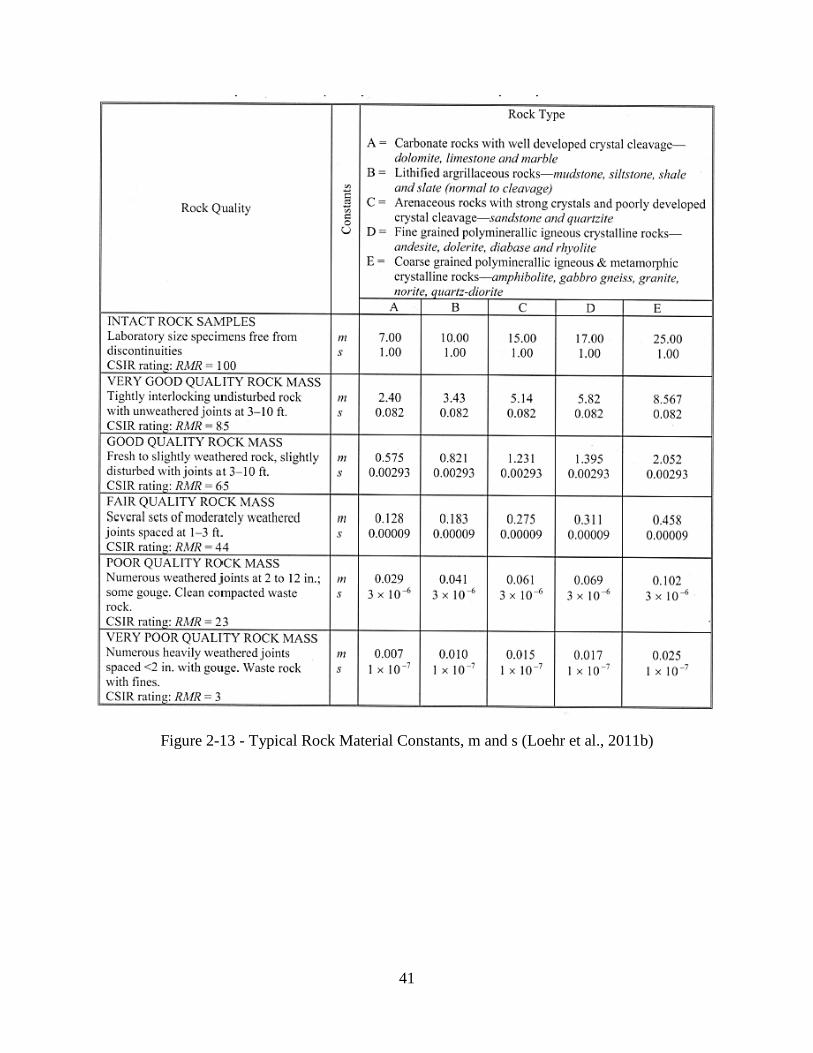
Equation 2-15. The m and s terms are dimensionless, empirical constants that are a function of
the rock mass and are calculated with Equations 2-16 and 2-17. The material constant, mi, is a
function of rock type and is determined from Table 2-10. Values of m and s constants for various
types of rock quality are shown in Figure 2-13. The Geological Strength Index, GSI, is a function
of rock structure and surface quality. Typical ranges of GSI for limestone are illustrated in Figure
2-14.
The resistance factor for unit tip resistance, φqp, is a function of the c.o.v. of mean uniaxial
compressive strength, and is determined from Figure 2-15. In this case, three unconfined
compression measurements were recorded. Referring to Figure 2-12, the variability modifier is
2.5. The corresponding resistance factor from Figure 2-15 is 0.41.
Table 2-9 - Rock Core Data of Burlington Limestone, Sampled About 1.5 Miles from the Thesis Site (Gunnink and Kiehne, 2002)
Core Unconfined Compressive Strength (psi) Recovery (%) RQD (%) 1 6,336 - - 2 10,718 - - 3 9,395 - - 4 - 90 78 5 - 100 80 6 - 100 100 7 - 100 85
39
𝑞𝑞𝑝𝑝 = √𝑠𝑠 ∗ 𝑞𝑞�𝑢𝑢 �1 + �𝑚𝑚√𝑠𝑠
+ 1� ≤ 400 𝑘𝑘𝑠𝑠𝑓𝑓 (Eqn. 2-15)
Where:
qp = Nominal Unit Tip Resistance of Drilled Shaft in Rock
𝑞𝑞�u = Mean Value of Uniaxial Compressive Strength
m and s = Empirical Constants Describing the Rock Mass
400 ksf = Limiting Design Value
𝑚𝑚 = 𝑚𝑚𝑐𝑐exp (𝐺𝐺𝑆𝑆𝐺𝐺−10028
) (Eqn. 2-16)
𝑠𝑠 = exp �𝐺𝐺𝑆𝑆𝐺𝐺−1009
� 𝑓𝑓𝑜𝑜𝑓𝑓 𝐺𝐺𝑈𝑈𝐺𝐺 ≥ 25 (Eqn. 2-17)

40
Table 2-10 - Typical mi Constants for Sedimentary Rocks (Loehr et al., 2011b)
Rock type Class Group Texture Rock mi Constant Se
dim
enta
ry
Clastic
Medium Sandstones 17 ± 4 Fine Siltstones 7 ± 2
Very Fine Claystones 4 ± 2 Fine Greywackes 18 ± 3
Very Fine Shales 6 ± 2 Very Fine Marls 7 ± 2
Non-clastic
Carbonates
Coarse Crystalline Limestones 12 ± 3 Medium Sparitic Limestones 10 ± 2
Fine Micritic Limestones 9 ± 2 Very Fine Dolomites 9 ± 3
Evaporites Medium Gypsum 8 ± 2
Fine Anhydrite 12 ± 2 Organic Very Fine Chalk 7 ± 2
41
Figure 2-13 - Typical Rock Material Constants, m and s (Loehr et al., 2011b)

42
Figure 2-14 - Typical Ranges of Geological Strength Index (GSI) of Limestone (Loehr et al., 2011b)

43
Figure 2-15 - Resistance Factor for Unit Tip Resistance of Drilled Shaft in Rock (Loehr et al., 2011b)
2.6.3. Driven Piles
It is assumed that the piles are supported by the Burlington limestone for the LRFD procedure
for driven piles. The same assumption was made for the ASD approach. Again, the piles are
designed for end bearing contributions only. The end resistance of each pile can be estimated
from RQD values and the unconfined compressive strength of the rock, qu. The nominal end
resistance is estimated as 0.33*qu for RQD values less than 70%. For an RQD value of 100%, the
nominal toe resistance is 0.80*qu. For RQD values between 70-100%, the toe resistance can be
interpolated (FHWA, 2016). A summary of the estimated values is shown in Table 2-11.

44
The RQD values for Boring B14 from Table 2-3 are used for the design. The values listed
represent interbedded layers of shale and limestone. The average of the two RQD values is 59%
and the average unconfined compressive strength of the Burlington limestone is 1270 ksf.
Therefore, the nominal end resistance used for design of driven piles is 419 ksf. For piles driven
to shallow rock (less than 35 feet below ground level), the recommended geotechnical resistance
factor is 0.65 (Loehr et al., 2011a). When a resistance factor of 0.65 is used, dynamic pile testing
must be conducted on 1 to 10 percent of piles. Dynamic pile testing is conducted on 5 percent of
piles for the driven pile design.
Table 2-11 – Estimated Values of End Resistance for Driven Piles (FHWA, 2016)
RQD (%) Nominal Unit End Resistance 0-70 0.33*Unconfined Compressive Strength qu
70-100 Linearly interpolated from 0.33*qu to 0.80*qu
100 0.80*Unconfined Compressive Strength qu
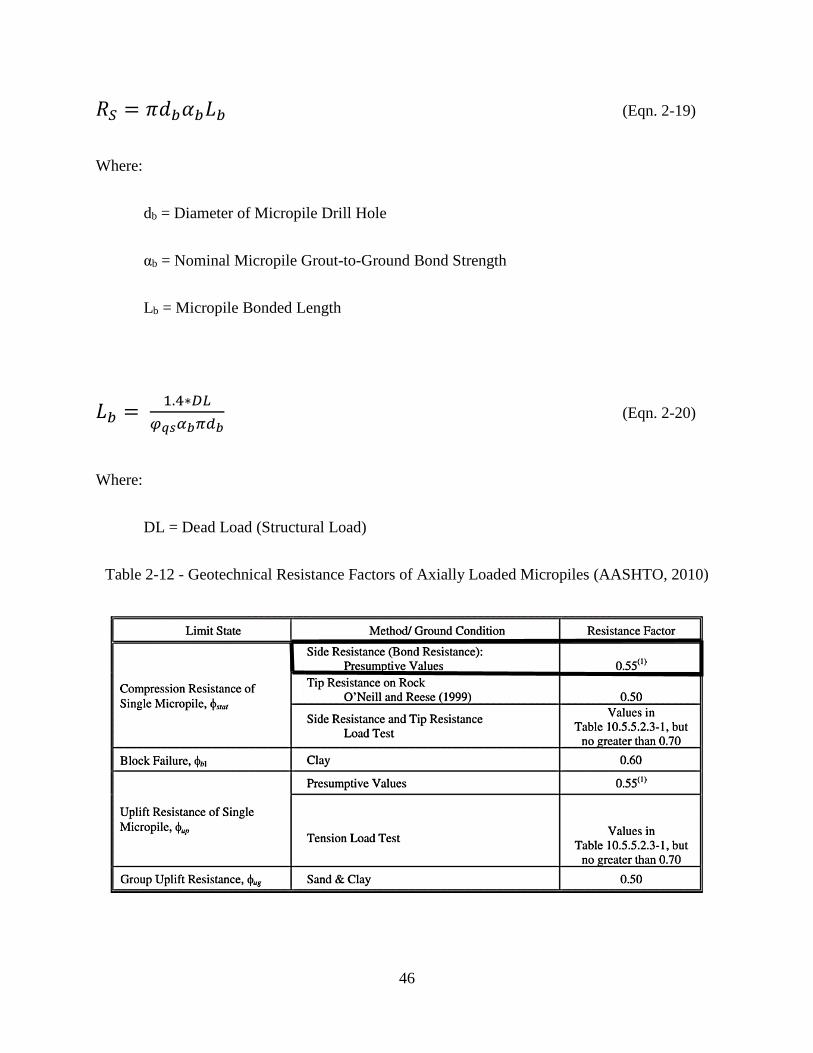
2.6.4. Micropiles
The LRFD procedure for micropiles is detailed in AASHTO’s LRFD Bridge Design
Specifications (2010). The total factored geotechnical resistance of a single micropile in axial
compression is calculated in Equation 2-18. As with ASD procedures for micropiles, the tip
resistance contribution is ignored. The grout-to-ground bond resistance, Rs, is calculated in
Equation 2-19. The nominal grout-to-ground strength, αb, is estimated from Table 2-5. A
presumptive grout-to-ground bond resistance factor of 0.55 is obtained from Table 2-12.
The micropile bonded length, Lb, can be solved directly by rearranging Equations 2-18 and 2-19,
and recognizing that the factored loads are equal to 1.4 times the dead load. The bonded length is
directly calculated in Equation 2-20.

45
𝑅𝑅𝑅𝑅 = 𝜑𝜑𝑅𝑅𝑐𝑐 = 𝜑𝜑𝑞𝑞𝑝𝑝𝑅𝑅𝑝𝑝 + 𝜑𝜑𝑞𝑞𝑠𝑠𝑅𝑅𝑠𝑠 (Eqn. 2-18)
In which:
Rp = qpAp
Rs = qsAs
Where:
RR = Factored Micropile Resistance
Rp = Nominal Tip Resistance
Rs = Nominal Grout-to-Ground Bond Resistance
φqp = Resistance Factor for Tip Resistance
φqs = Resistance Factor for Grout-to-Ground Bond Resistance
qp = Unit Tip Resistance
qs = Unit Grout-to-Ground Bond Resistance
Ap = Area of Micropile Tip
As = Area of Grout-to-Ground Bond Surface
46
𝑅𝑅𝑆𝑆 = 𝜋𝜋𝑑𝑑𝑎𝑎𝛼𝛼𝑎𝑎𝜋𝜋𝑎𝑎 (Eqn. 2-19)
Where:
db = Diameter of Micropile Drill Hole
αb = Nominal Micropile Grout-to-Ground Bond Strength
Lb = Micropile Bonded Length
𝜋𝜋𝑎𝑎 = 1.4∗𝐷𝐷𝐷𝐷𝜑𝜑𝑞𝑞𝑞𝑞𝛼𝛼𝑏𝑏𝜋𝜋𝑓𝑓𝑏𝑏
(Eqn. 2-20)
Where:
DL = Dead Load (Structural Load)
Table 2-12 - Geotechnical Resistance Factors of Axially Loaded Micropiles (AASHTO, 2010)

47
2.7. Cost Analysis Method
MoDOT’s unit bid prices are used to estimate the costs of drilled shafts, rock sockets, driven
piles, pile point reinforcement, spread footings, pile caps, and dynamic pile testing. The values
used in the cost analyses are the average of the statewide costs from the years 2014-2016
(MoDOT, 2014-2016).
The average price of all the items that are used to estimate the cost of the existing foundation
design are listed in Table 2-13. Of the 36 drilled shafts, the structural plans show that 17 are
expected to be socketed into the Burlington limestone (Gouldevans, 2017). The price of each
item required for Alternative Design 1 is shown in Table 2-14.
As with drilled shafts and driven piles, micropiles are priced on a cost per linear foot basis. Up-
to-date industry costs per foot of 7-inch and 9.625-inch micropiles were obtained from John
Wolosick (personal communication, September 28, 2017). The cost of spread footings and
micropile caps are found in MoDOT’s Unit Bid Prices (MoDOT, 2014-2016). A summary of
unit prices for the design is shown in Table 2-15.
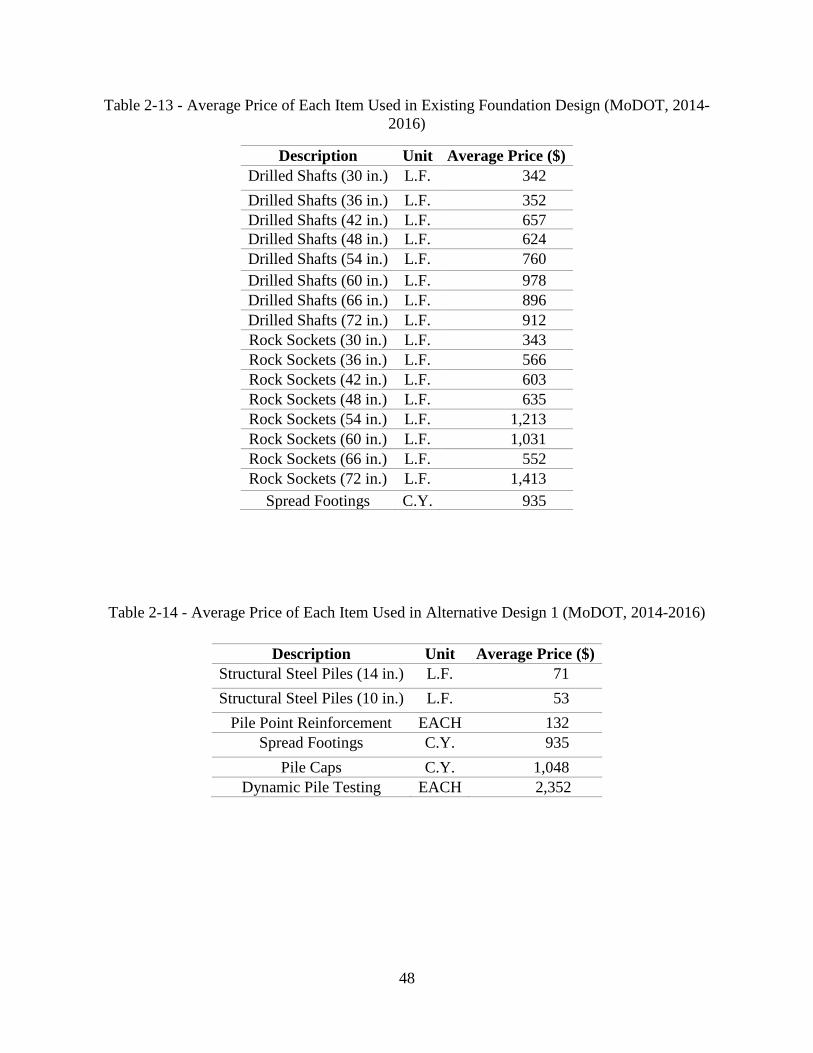
48
Table 2-13 - Average Price of Each Item Used in Existing Foundation Design (MoDOT, 2014-2016)
Description Unit Average Price ($) Drilled Shafts (30 in.) L.F. 342 Drilled Shafts (36 in.) L.F. 352 Drilled Shafts (42 in.) L.F. 657 Drilled Shafts (48 in.) L.F. 624 Drilled Shafts (54 in.) L.F. 760 Drilled Shafts (60 in.) L.F. 978 Drilled Shafts (66 in.) L.F. 896 Drilled Shafts (72 in.) L.F. 912 Rock Sockets (30 in.) L.F. 343 Rock Sockets (36 in.) L.F. 566 Rock Sockets (42 in.) L.F. 603 Rock Sockets (48 in.) L.F. 635 Rock Sockets (54 in.) L.F. 1,213 Rock Sockets (60 in.) L.F. 1,031 Rock Sockets (66 in.) L.F. 552 Rock Sockets (72 in.) L.F. 1,413
Spread Footings C.Y. 935
Table 2-14 - Average Price of Each Item Used in Alternative Design 1 (MoDOT, 2014-2016)
Description Unit Average Price ($) Structural Steel Piles (14 in.) L.F. 71 Structural Steel Piles (10 in.) L.F. 53
Pile Point Reinforcement EACH 132 Spread Footings C.Y. 935
Pile Caps C.Y. 1,048 Dynamic Pile Testing EACH 2,352

49
Table 2-15 - Average Price of Each Item Used in Alternative Design 2
Description Unit Average Price ($) Reference 7-in Micropiles L.F. 70 John Wolosick, 2017
9.625-in Micropiles L.F. 80 John Wolosick, 2017 Spread Footings C.Y. 935 MoDOT Unit Bid Prices, 2014-2016 Micropile Caps C.Y. 1048 MoDOT Unit Bid Prices, 2014-2016
2.8. Summary
Alternative foundation designs are considered for the Center for Missouri Studies building, a
three-level structure in Columbia, Missouri. By examining local geologic history and site
investigation results, it is determined that the project site generally consists of the Burlington
limestone formation, overlain by Pennsylvanian aged shale and limestone. The Pennsylvanian
aged shale is overlain by glacial drift. Example subsurface cross-sections are presented to show
the estimated thicknesses of each subsurface layer.
The original foundation design consists of a system of drilled shafts and spread footings. To
compare ASD and LRFD, two alternative foundation systems are also considered. Each
alternative foundation system is designed using both ASD and LRFD approaches. Further
comparison of ASD and LRFD procedures are made by comparing estimated costs of each
foundation type.
The overall purpose of the thesis is to compare ASD and LRFD, and not to compare different
foundation types. The LRFD methods of obtaining resistance factors in the thesis are not
consistent for each foundation type. If the objective was to compare different foundation types,
the method of obtaining resistance factors should be consistent and the costs should be from the
same source.

50
3.0 Results
3.1. Introduction
The purpose of the thesis is to improve foundation selection by comparing Allowable Stress
Design (ASD) and Load & Resistance Factor Design (LRFD). Chapter 3 provides the results of
the original foundation design, which consists of drilled shafts and spread footings. The results of
both alternative designs are also included. Finally, the cost of each foundation option is
summarized for both ASD and LRFD.
3.2. Existing Foundation Design
3.2.1. Allowable Stress Design
A hybrid foundation system is used in the existing design to support the Center for Missouri
Studies building. The system includes a combination of deep and shallow foundations. Spread
footings are designed to bear directly on Pennsylvanian aged shale or limestone. A total of 23
spread footings are included, and all are located on the eastern half of the project site, supporting
the basement portion of the structure. Square footings are used, ranging in size from five feet by
five feet to nine feet by nine feet. A summary of footing dimensions is shown in Table 3-1.
In addition to the spread footings, 36 drilled shafts are included in the design. The shafts support
the entire western half of the project site where the finished floor elevation is 714 feet, msl. Ten
of the shafts are located on the eastern half of the site, supporting the basement. Each of the
shafts is designed to bear on rock. Of the 36 shafts, 17 extend into the Burlington limestone to
achieve a greater bearing capacity. The other 19 shafts that did not include rock sockets are
designed to bear on Mississippian aged shale or limestone. A summary of shaft diameters is
shown in Table 3-2.

51
Table 3-1 - Existing Foundation Spread Footing Dimensions and Quantities – ASD
Length (ft) Width (ft) Thickness (ft) # of Footings 5 5 2 1 6 6 2 10 7 7 2.5 5 8 8 3 4 9 9 3 3
Total 23
Table 3-2 - Drilled Shaft Dimensions and Quantities – ASD
Diameter (in) # of Shafts Total Design Length (ft) Total Rock Socket Length (ft) 30 6 107.7 0 36 2 24.2 0 42 5 95.1 4 48 13 149.1 39 54 3 49.4 10 60 3 60.2 11 66 3 72.2 7 72 1 8.1 4
Total 36 566 75
3.2.2. Load and Resistance Factor Design
The LRFD method for drilled shafts in rock depends on the distribution of strengths of the
Burlington limestone formation. The mean value of the three unconfined compression tests
discussed in Chapter 2 is 1270 ksf. The Geological Strength Index (GSI) of the limestone is
conservatively estimated from Figure 2-14 as 50. The constant mi is estimated from Table 2-10
as 10. The calculated values of m and s are 1.68 and 0.0039, respectively. From Equation 2-15,
the nominal unit tip resistance is calculated as 496 ksf. Equation 2-15 shows a limit of 400 ksf
for nominal unit tip resistance, so it is the value used in design. All drilled shafts are socketed
into the Burlington limestone in the LRFD re-design.

52
The coefficient of variation of the three unconfined compression tests Gunnink and Kiehne
conducted on the Burlington limestone is 0.255 (2002). Using the variability modifier
determined from Figure 2-12, the c.o.v. for mean value of design is calculated as 0.637. The
corresponding resistance factor determined from Figure 2-15 is 0.14. A summary of values used
to calculate the nominal unit tip resistance is shown in Table 3-3.
The values used to calculate the factored bearing capacity for spread footings are shown in Table
3-4. The distribution of unconfined compressive strength shown in Table 3-4 is from data
collected by Miller on Pennsylvanian aged shale and limestone (2003). A summary of spread
footings used for the design is shown in Table 3-5, while the drilled shafts are shown in Table 3-
6.
Table 3-3 - Values Used to Calculate Tip Resistance of Drilled Shafts
Mean Uniaxial Compressive Strength, 𝑞𝑞�u 1270 ksf Number of Strength Tests 3
Variability Modifier 2.5 Design c.o.v. of Rock Strengths 0.637
Resistance Factor, φqp 0.14 Material Constant, mi 10
Geological Strength Index, GSI 50 Material Constant, m 1.68 Material Constant, s 0.0039
Nominal Unit Tip Resistance, qp 400 ksf Factored Unit Tip Resistance 56 ksf

53
Table 3-4 - Values Used to Calculate Bearing Capacity of Spread Footings
Mean Uniaxial Compressive Strength, UCS 131 ksf Number of Strength Tests 289
Variability Modifier 1 Design c.o.v. of Rock Strengths 0.134
Mean RQD Value (%) 59 Shape Correction Factor, cf 1.25
Resistance Factor, φ 0.41 Factored Bearing Capacity, qfactored 17.5 ksf
Table 3-5 - Existing Foundation Spread Footing Dimensions and Quantities - LRFD
Length (ft) Width (ft) Thickness (ft) # of Footings 5 5 2 1 6 6 2 10 7 7 2.5 5 8 8 3 7
Total 23
Table 3-6 - Drilled Shaft Dimensions and Quantities - LRFD
Diameter (in) # of Shafts Total Design Length (ft) Total Rock Socket Length (ft) 30 20 305 102 36 7 98 32 42 5 83 20 48 3 72 12
Total 36 558 166
3.2.3. Cost Analysis
The total estimated cost of the existing foundation system is $530,000. The summary of costs is
shown in Table 3-7. The total estimated cost of the LRFD re-design is $375,000, as shown in
Table 3-8.

54
Table 3-7 - Cost Summary of Existing Foundation Design - ASD
Item Units Quantity Unit Cost ($) Cost ($) Drilled Shafts (30 in.) L.F. 107.7 341.64 36,805 Drilled Shafts (36 in.) L.F. 24.2 351.50 8,492 Drilled Shafts (42 in.) L.F. 95.1 657.31 62,490 Drilled Shafts (48 in.) L.F. 149.1 624.46 93,076 Drilled Shafts (54 in.) L.F. 49.4 760.11 37,557 Drilled Shafts (60 in.) L.F. 60.2 977.74 58,899 Drilled Shafts (66 in.) L.F. 72.2 895.77 64,710 Drilled Shafts (72 in.) L.F. 8.1 911.78 7,367 Rock Sockets (30 in.) L.F. 0 342.74 - Rock Sockets (36 in.) L.F. 0 566.20 - Rock Sockets (42 in.) L.F. 4 602.99 2,412 Rock Sockets (48 in.) L.F. 39 635.21 24,773 Rock Sockets (54 in.) L.F. 10 1,213.14 12,131 Rock Sockets (60 in.) L.F. 11 1,031.35 11,345 Rock Sockets (66 in.) L.F. 7 551.66 3,862 Rock Sockets (72 in.) L.F. 4 1,412.57 5,650
Spread Footings C.Y. 106.6 934.98 99,714 Total 529,283
Table 3-8 - Cost Summary of Existing Foundation Design - LRFD
Item Unit Quantity Unit Cost ($) Cost ($) Drilled Shafts (30 in.) L.F. 403.2 341.64 137,738 Drilled Shafts (36 in.) L.F. 99.7 351.50 35,033 Drilled Shafts (42 in.) L.F. 55.2 657.31 36,261 Drilled Shafts (48 in.) L.F. 8.1 624.46 5,048 Rock Sockets (30 in.) L.F. 134 342.74 45,926 Rock Sockets (36 in.) L.F. 24 566.20 13,589 Rock Sockets (42 in.) L.F. 8 602.99 4,824 Rock Sockets (48 in.) L.F. 4 635.21 2,541
Spread Footings C.Y. 101.0 934.98 94,416 Total 375,376

55
3.3. Proposed Alternative Foundation Design 1
3.3.1. Allowable Stress Design
The first proposed alternative foundation design is a hybrid system consisting of driven piles and
spread footings. Piles replace each of the drilled shafts on the western half of the project site. The
ten drilled shafts on the eastern half are replaced by spread footings. Consequently, the entire
basement area is supported by spread footings, and piles support the remainder of the structure.
Each drilled shaft is replaced by a group of three or more driven piles, with one pile cap per
group of piles. Pile cap dimensions are shown in Table 3-9. Spread footing dimensions are
shown in Table 3-10.
The design includes 109 HP 14x73 piles. Piles of this size have a plugged end area of 1.38
square feet. The total design length of the piles is 1,665 feet. Pile groups range from three to nine
piles per pile cap. For pile groups consisting of three to four piles, the pile cap measures 6 feet by
6 feet. The pile cap is ten feet by ten feet for groups of five to nine piles.
Table 3-9 - Alternative Design 1 Pile Cap Dimensions and Quantities - ASD
Length (ft) Width (ft) Thickness (ft) # of Pile Caps 6 6 2 18 10 10 2 8
Total 26

56
Table 3-10 - Alternative Design 1 Spread Footing Dimensions and Quantities - LRFD
Length (ft) Width (ft) Thickness (ft) # of Footings 4 4 2 1 5 5 2 6 6 6 2 13 7 7 2.5 5 8 8 3 5 9 9 3 3
Total 33
3.3.2. Load and Resistance Factor Design
When using LRFD procedures, Alternative Design 1 also consists of groups of three or more
driven piles. The largest group contains four piles, so the only pile cap dimension used is 6 feet
by 6 feet, as shown in Table 3-11. A summary of the spread footings used in the LRFD re-design
is shown in Table 3-12.
The design includes 81 HP 10x42 piles. Each pile has an end area of 0.679 square feet. The total
design length of the piles is 1,230 feet. Since dynamic pile testing is required for 5% of piles, it is
performed on four piles.
Table 3-11 - Alternative Design 1 Pile Cap Dimensions and Quantities - LRFD
Length (ft) Width (ft) Thickness (ft) # of Pile Caps 6 6 2 26

57
Table 3-12 - Alternative Design 1 Spread Footing Dimensions and Quantities - LRFD
Length (ft) Width (ft) Thickness (ft) # of Footings 3 3 2 1 4 4 2 5 5 5 2 3 6 6 2 11 7 7 2.5 6 8 8 3 7
Total 33
3.3.3. Cost Analysis
When using ASD methods, the total estimated cost of Alternative Design 1 is $370,000. The cost
of each item is shown in Table 3-13. When Alternative Design 1 is designed using LRFD
procedures, the total estimated cost is $270,000. The summary of costs from the LRFD method is
shown in Table 3-14.
58
Table 3-13 - Cost Summary of Alternative Design 1 - ASD
Item Unit Quantity Unit Cost ($) Cost ($) Structural Steel Piles (14 in.) L.F. 1,665 70.51 117,399
Pile Point Reinforcement EACH 109 131.50 14,334 Spread Footings C.Y. 132.2 934.98 123,608
Pile Caps C.Y. 107.3 1,047.88 112,395 Total 367,736
Table 3-14 - Cost Summary of Alternative Design 1 - LRFD
Item Unit Quantity Unit Cost ($) Cost ($) Structural Steel Piles (10 in) L.F. 1,230 52.89 65,051
Pile Point Reinforcement EACH 81 131.50 10,652 Spread Footings C.Y. 118.5 934.98 110,778
Pile Caps C.Y. 69.3 1,047.88 72,653 Dynamic Pile Testing EACH 4 2,351.67 9,407
Total 268,540
3.4. Proposed Alternative Foundation Design 2
3.4.1. Allowable Stress Design
The second proposed alternative foundation design consists of replacing the drilled shafts with
micropiles. The design of the spread footings is unchanged from the original design. Each of the
drilled piers is replaced by a group of three or more micropiles. The bond zone of each micropile
is in the relatively shallow limestone layer because of the extremely high grout-to-ground
strength available in the layer.
One cross-section is used and the dimensions are shown in Table 3-15. The cross-section
consists of a 7-inch drillhole and 7-inch casing outside diameter. The thickness of the casing is
0.498 inches. The casing provides an ultimate yield compressive strength of 80 ksi. Micropile
quantities are shown in Table 3-16.

59
The grout used for design has a compressive strength of 4,000 psi. Referring to Table 2-5,
gravity grouting (Type A) is the only type of grouting available when the bond zone is in rock, as
it is for this design. Therefore, all grout-to-ground bond strengths are selected for Type A
grouting. The reinforcing steel used for each micropile is #9 rebar which provides an ultimate
yield strength of 80 ksi. The rebar is placed through the entire length of each micropile.
Table 3-15 - Dimensions of Micropile Cross-Section - ASD
Dimensions Diameter of Drill Hole (in) 7.0
Casing Outside Diameter (in) 7.0 Casing Wall Thickness (in) 0.498
Total Area (in2) 38.5 Area of Casing (in2) 10.2 Area of Grout (in2) 28.3
Type of Rebar #9 Area of Rebar (in2) 1.0
Table 3-16 - Micropile Quantity and Lengths - ASD
Diameter of Drill Hole (in) 7.0 # of Micropiles 126
Unbonded Length (ft) 1,360 Bond Length (ft) 537 Total Length (ft) 1,897
3.4.2. Load and Resistance Factor Design
The results of Alternative Design 2 when using LRFD procedures are similar to the results from
ASD methods. As shown in Table 3-17, the dimensions of the micropile cross-section are the
same as when using ASD. The LRFD quantities are shown in Table 3-18.

60
Table 3-17 - Dimensions of Micropile Cross-Section - LRFD
Dimensions
Diameter of Drill Hole (in) 7.0 Casing Outside Diameter (in) 7.0 Casing Wall Thickness (in) 0.498
Total Area (in2) 38.5 Area of Casing (in2) 10.2 Area of Grout (in2) 28.3
Type of Rebar #9 Area of Rebar (in2) 1.0
Table 3-18 - Micropile Quantities and Lengths - LRFD
Diameter of Drill Hole (in) 7.0 # of Micropiles 126
Unbonded Length (ft) 1,360 Bond Length (ft) 456 Total Length (ft) 1,816
3.4.3. Cost Analysis
For ASD, the total estimated cost of Alternative Design 2 is $360,000. The summary of costs is
shown in Table 3-19. When the LRFD approach is used, the total estimated cost of Alternative
Design 2 is $345,000. The summary of LRFD foundation costs are shown in Table 3-20.
Table 3-19 - Cost Summary of Alternative Design 2 - ASD
Description Unit Quantity Unit Cost ($) Cost ($) 7-in Micropiles L.F. 1,897 70 132,787 Spread Footings C.Y. 106.6 934.98 99,714 Micropile Caps C.Y. 119.7 1047.88 125,436
Total
357,936

61
Table 3-20 - Cost Summary of Alternative Design 2 - LRFD
Description Unit Quantity Unit Cost ($) Cost ($) 7-in Micropiles L.F. 1,816 70 127,092 Spread Footings C.Y. 101.0 934.98 94,416 Micropile Caps C.Y. 119.7 1047.88 125,436
Total
346,943
3.5. Summary
In this chapter, the results of all foundation design alternatives are presented. As seen from the
results, the original design consisting of drilled shafts and spread footings is the most expensive.
Alternative Designs 1 and 2 both cost less than the original design, and are similar in overall
costs. When using LRFD methods, the cost of drilled shafts and driven piles are reduced by
approximately 35 percent. The cost of spread footings is reduced by an average of seven percent
when using LRFD methods.

62
4.0 Discussion
4.1. Introduction
The primary objective of the thesis is to improve local foundation design by comparing
Allowable Stress Design (ASD) and Load & Resistance Factor Design (LRFD) for foundations
at the Center for Missouri Studies Building. The secondary objective is to initiate a subsurface
database of the MU Campus. Chapter 4 includes discussion and interpretation of the foundation
design results presented in Chapter 3. The reliability of the existing design and the LRFD re-
design is made in Section 4.2. The results of the alternative foundation designs are discussed in
Section 4.3, including the geotechnical cost estimate of each alternative design.
4.2. Existing Foundation – ASD vs. LRFD
To compare the results of ASD and LRFD designs, the probability of failure can be back-
calculated for the spread footings and drilled shafts of the existing foundation design. As
previously discussed, the target probability of failure for each re-design is 1/1500.
4.2.1. Spread Footings
The area of a spread footing is calculated using Equation 4-1. If using an LRFD approach, an
alternative form is shown in Equation 4-2. By rearranging, the factored bearing capacity can be
solved as a function of the dead load and area of the footing used in LRFD design (Equation 4-
3). The ultimate bearing capacity is solved using Equation 4-4. From the LRFD results, the
factored bearing capacity is 18 ksf and the resistance factor is 0.41, so the ultimate bearing
capacity is 44 ksf.
To determine the probability of failure of the existing spread footings, the original footing area is
used to solve Equation 4-3 for factored bearing capacity. The ultimate bearing capacity has not

63
changed, so Equation 4-4 can be used to determine what the resistance factor would be for the
original design. The probability of failure of the original design can be estimated from Figure 4-1
by applying the resistance factor determined from Equation 4-4. A summary of the back-
calculation procedure for a sample spread footing is shown in Table 4-1.
𝐴𝐴 = 𝑃𝑃𝑞𝑞𝑢𝑢𝑢𝑢𝑢𝑢𝐹𝐹𝐹𝐹
(Eqn. 4-1)
Where:
P = Structural Load
qult = Ultimate Bearing Capacity
FS = Factor of Safety
A = Area of Footing
𝐴𝐴 = 𝐹𝐹𝑎𝑎𝑐𝑐𝑢𝑢𝑎𝑎𝑔𝑔𝑎𝑎𝑓𝑓 𝐷𝐷𝑎𝑎𝑎𝑎𝑓𝑓𝐹𝐹𝑎𝑎𝑐𝑐𝑢𝑢𝑎𝑎𝑔𝑔𝑎𝑎𝑓𝑓 𝑅𝑅𝑎𝑎𝑠𝑠𝑐𝑐𝑠𝑠𝑢𝑢𝑎𝑎𝑐𝑐𝑐𝑐𝑎𝑎
= 1.4∗𝐷𝐷𝐷𝐷𝑞𝑞𝑓𝑓𝑎𝑎𝑓𝑓𝑢𝑢𝑏𝑏𝑓𝑓𝑎𝑎𝑏𝑏
(Eqn. 4-2)
Where:
DL = Dead Load
qfactored = Factored Bearing Capacity

64
𝑞𝑞𝑓𝑓𝑎𝑎𝑐𝑐𝑢𝑢𝑎𝑎𝑔𝑔𝑎𝑎𝑓𝑓 = 1.4∗𝐷𝐷𝐷𝐷𝐴𝐴
(Eqn. 4-3)
𝑞𝑞𝑢𝑢𝑢𝑢𝑢𝑢𝑐𝑐𝑚𝑚𝑎𝑎𝑢𝑢𝑎𝑎 = 𝑞𝑞𝑓𝑓𝑎𝑎𝑓𝑓𝑢𝑢𝑏𝑏𝑓𝑓𝑎𝑎𝑏𝑏𝜑𝜑
(Eqn. 4-4)
Where:
qultimate = Ultimate Bearing Capacity
Figure 4-1 - Resistance Factor, φ, for Bearing Resistance of Shallow Foundation on Rock (Abu El-Ela et al., 2013)
0.00
0.10
0.20
0.30
0.40
0.50
0.60
0.70
0.00 0.10 0.20 0.30 0.40 0.50 0.60 0.70 0.80 0.90 1.00 1.10 1.20 1.30 1.40 1.50
Resi
stan
ce F
acto
rs, φ
c.o.v of UCS
Prob. Failure (1/100) Prob. Failure (1/300) Prob. Failure (1/1500)
Prob. Failure (1/5000) Prob. Failure (1/10000)
DL/LL=2.0

65
Table 4-1 - Probability of Failure of Spread Footings for ASD and LRFD Designs
ASD LRFD
Area of Footing (ft2) 81 64 Factored Dead Load (kips) 1134 1134
Factored Bearing Capacity (ksf) 14 18 Ultimate Bearing Capacity (ksf) 44 44
Resistance Factor 0.32 0.41 Probability of Failure, Pf < 1/10000 1/1500
4.2.2. Drilled Shafts
A similar process is used to determine the probability of failure of the drilled shafts from the
original design. From the results chapter, the factored tip resistance is 56 ksf and the ultimate tip
resistance is 400 ksf. The end area of each original drilled shaft is used to calculate an equivalent
factored tip resistance from Equation 4-5. The resistance factor for tip resistance is calculated
using Equation 4-6. The probability of failure of the original drilled shafts is determined using
Figure 4-2 and Table 4-2. A summary of the back-calculation procedure for a sample drilled
shafts is shown in Table 4-3.
𝑞𝑞𝑝𝑝 = 1.4∗𝐷𝐷𝐷𝐷𝐴𝐴𝑝𝑝
(Eqn. 4-5)
Where:
qp = Factored Tip Resistance
DL = Dead Load
Ap = End Area of Drilled Shaft

66
𝑞𝑞𝑢𝑢𝑢𝑢𝑢𝑢𝑐𝑐𝑚𝑚𝑎𝑎𝑢𝑢𝑎𝑎 = 𝑞𝑞𝑝𝑝𝜑𝜑𝑞𝑞𝑝𝑝
(Eqn. 4-6)
Where:
qultimate = Ultimate Bearing Capacity
φqp = Resistance Factor for Tip Resistance
Figure 4-2 - Resistance Factor for Unit Tip Resistance of Drilled Shaft in Rock (EPG Drilled Shafts, 2011)

67
Table 4-2 - Recommended Probability of Failure for Different Bridge Types (Abu El-Ela et al., 2013)
Application Classification Recommended Pf
Bridge Foundations (Shallow Foundations)
Major Bridges (>$100M) 1 in 10,000 Major Bridges (<$100M) 1 in 5000 Bridges on Major Roads 1 in 1500 Bridges on Minor Roads 1 in 300

68
Table 4-3 - Probability of Failure of Drilled Shafts for ASD and LRFD Designs
ASD LRFD
Shaft End Area (ft2) 12.6 7.8 Factored Dead Load (kips) 434 434
Factored Tip Resistance (ksf) 35 56 Ultimate Tip Resistance (ksf) 400 400
Resistance Factor 0.09 0.14 Probability of Failure 1/10000 1/1500
The reliabilities of the existing foundation design are shown in Table 4-4. The LRFD re-design
assumed a probability of failure of 1/1500. As shown, reliability is equal to one minus the
probability of failure. The overall probability of failure for the existing factor of safety design is
approximately 1/10000. As shown in Table 4-2, a probability of failure of 1/10000 is appropriate
for major bridges costing over 100 million dollars. For the Center, that number is too
conservative. Although a probability of failure of 1/10000 is much lower than 1/1500, the actual
reliability of the foundations is uncertain. Other unknown sources of uncertainty are not included
in the design values of probability of failure. One such source of uncertainty is the uncertainty of
the strength model. The strength model assumes that the strength of soil or rock increases
linearly with depth. Site specific conditions may vary considerably from a linear relationship of
strength with depth.
Table 4-4 - Comparison of Factor of Safety and Reliability for Existing Foundation Design
Existing Design - Drilled
Shafts Existing Design - Spread
Footings Assumed F.S. 3 3
Back-Calculated Pf 1/10000 < 1/10000 Back-Calculated Reliability
% 99.99 > 99.99
LRFD Re-Design Pf 1/1500 1/1500 LRFD Re-Design
Reliability % 99.93 99.93%

69
Even a small number of strength tests can significantly reduce the overall cost of foundations
when implementing LRFD procedures. In the re-design of drilled shafts, only three strength tests
were available for the Burlington limestone. However, the overall cost of the LRFD re-design is
approximately 29% lower than the original factor of safety design. Although the probability of
failure is higher for the re-design, it is still an acceptable value for a project of this size and
overall cost. The LRFD re-design is more efficient than the original design while still
maintaining an acceptable level of reliability.
4.3. Existing Foundation Design vs. Alternative Foundation Designs
As shown in Table 4-5, the existing foundation design is more expensive than each of the
proposed alternative designs. As previously discussed, the original design of the drilled shafts is
quite conservative. The conservative design is due to the allowable end bearing pressure of 40
ksf for the Burlington limestone. As Gunnink and Kiehne (2002) showed, an end bearing value
of 72 ksf is more appropriate. In this case, an allowable end bearing pressure of 40 ksf is a
presumptive value, and results in a conservative design. Presumptive values are often obtained
from building codes, and are typically conservative (Gunnink and Kiehne, 2002). Costs were
significantly reduced for the existing foundation design and for Alternative Design 1. The cost
reduction is due to the combination of using an LRFD approach and the use of a more
appropriate value of end bearing pressure of 72 ksf, rather than the 40 ksf that was used in the
original design. Efficient designs are possible when a site-specific strength value (72 ksf) is used
instead of a presumptive value (40 ksf).
4.3.1. Alternative Design 1
The LRFD results of Alternative Design 1 are significantly more efficient than ASD. As shown
in Table 4-5, using LRFD saves approximately $100,000. Because of the strength data available

70
for the bearing stratum, uncertainty is quantifiable. As with the drilled shaft design, the
presumptive allowable end bearing value is conservative. The total number of piles is decreased
from 109 to 81 when a more appropriate value of end bearing pressure is used. The size of each
pile is also decreased, from HP 14x73 to HP 10x42. The decrease in required material allows for
a more efficient design, and substantial cost savings.
4.3.2. Alternative Design 2
The micropile design in the thesis is conservative. For ASD, a grout-to-ground bond strength of
150 psi is used, which is at the low end for limestone (Table 2-5). The resistance factor for bond
strength used in LRFD design is 0.55, which is the value AASHTO recommends (2010).
AASHTO notes that a resistance factor of 0.55 should be used for preliminary micropile design
only. As described by FHWA (2000), the resistance factor is simply calibrated to factor of safety
design procedures. As such, when designing micropiles for side resistance only, LRFD is just as
conservative as ASD. Thus, the overall cost of Alternative Design 2 is approximately equal for
LRFD and ASD.
Table 4-5 - Cost Summary of Each Foundation Option
ASD ($) LRFD ($)
Existing Design - Drilled Shafts & Spread Footings 530,000 375,000 Alternative Design 1 - Driven Piles & Spread Footings 368,000 269,000 Alternative Design 2 - Micropiles & Spread Footings 358,000 347,000
4.4. Summary
For the existing foundation design and each of the alternatives, LRFD is more cost-effective than
ASD. The back-calculated probability of failure of the foundation system for the existing design
is approximately 1/10000, which is much lower than one would anticipate for a three story, static

71
structure. Cost savings are much greater for Alternative Design 1 than for Alternative Design 2.
The resistance factor used for driven piles is 0.65. For micropiles, the resistance factor is 0.55.
The difference in cost savings is attributed to resistance factors for driven piles being more
developed than resistance factors for bond strength of micropiles.

72
5.0 Conclusions
5.1. Summary
Foundation selection on the University of Missouri-Columbia Campus can be improved by
assembling a database of geotechnical information and using reliability-based designs. The long-
term goal of the project is to collect enough subsurface data to characterize the entire campus.
The thesis includes a subsurface profile for the Center for Missouri Studies building in
Columbia, Missouri. Analysis of the existing foundation system and realistic alternative designs
are also included.
Conventionally, Allowable Stress Design (ASD) has been used for foundation design. However,
Load and Resistance Factor Design (LRFD) better accounts for uncertainties. LRFD quantifies
uncertainties of geotechnical resistance and structural loads. ASD and LRFD are compared by
evaluating the foundation system of the Center. The existing foundation system was analyzed
using LRFD procedures. Two foundation alternative designs were also considered. Each option
was designed using both ASD and LRFD methods. The thesis includes three ASD designs and
three LRFD designs. The thesis serves as a template for future researchers to continue to add
information to the database.
5.2. Conclusions
gINT Professional was used to begin a geotechnical database for the MU Campus. The first
entries were input into the database for the Center by combining results of laboratory testing and
boring logs. The boring logs were used to generate subsurface cross-sections, which can make
foundation design more efficient by depicting depths to various soil and rock strata. With the
database initialized, future researchers can readily input appropriate site investigation data. The

73
goal is for future researchers to use the database to develop preliminary designs and estimates, to
augment future subsurface exploration, and ultimately to reduce the cost of foundations and other
geotechnical infrastructure on the MU Campus.
For each of the three foundation options, the LRFD results were more efficient than ASD results,
meaning the construction costs were decreased while maintaining an acceptable level of
reliability. When designing foundations in rock, as in this thesis, ASD is often based on
presumptive values of allowable bearing capacity. The presumptive value is typically
conservative, because strength of rock can be highly variable. When the strength is unknown,
uncertainty is increased. LRFD quantifies the uncertainty by evaluating the distribution of
strength data of appropriate rock strata, thus providing more accurate bearing capacity values.
This results in improved foundation design and decreased costs. The decreased costs are due to
the use of LRFD methods and the availability of site-specific strength values obtained from rock
testing. The availability of a geotechnical database facilitates the use of LRFD.
The overall reliability of each design was considered. Using LRFD, the foundations were re-
designed with a probability of failure of 1/1500, a suitable level of reliability for the Center. The
probability of failure of the original design, which used ASD, was back-calculated to be
approximately 1/10,000. The ASD results in extremely reliable foundations, but the LRFD
foundations are more efficient when considering the overall balance of cost and reliability. The
use of LRFD methods resulted in approximately 35 percent cost savings for deep foundations
and seven percent cost savings for shallow foundations.

74
5.3. Recommendations
5.3.1. Practical Implications
It is recommended that the scope of future site investigation work be increased. An overall
subsurface profile is more easily characterized when a comprehensive site investigation is
conducted. When possible, tests such as the unconsolidated-undrained compression strength test
should be performed on appropriate rock or soil. The cost savings may not be substantial for
small projects; however, for larger projects increased understanding of subsurface conditions and
adequate rock strength data are essential for efficient design, where the cost savings can greatly
outweigh the price of additional site characterization.
Reliability-based cost decisions should be made using Figure 5-1 as guidance. Sufficiently
reliable foundations are obtained from some combination of design information and
conservatism in the design (Gilbert, 2003). If the cost of information, i.e., the cost of site
investigation is low, the foundation design must be more conservative to maintain an acceptable
level of reliability. Less design conservatism is required as the cost of site investigation is
increased.

75
Figure 5-1 – Conceptual Relationship Between Decision Making and Reliability-Based Design (Gilbert, 2003)
5.3.2. Future Research
The gINT cross-sections were beneficial in determining the depths of various soil and rock layers
for each of the foundation re-designs. For variable sites such as the Center, boring logs may not
fully represent subsurface conditions. The cross-sections are generated by assuming the soil and
rock strata are linear, and interpolating the layers between boreholes. It is suggested that future
researchers use similar software to generate subsurface profiles. At a minimum, cross-sections
should be included along the length of the site, along the width of the site, and diagonally across
the site. If soil or rock parameters are not available for the particular site, they should be obtained
from local sites which exhibit similar subsurface properties. As more students work on the
project, the subsurface conditions of the MU Campus will become better defined, and the
Cost of Foundation
(Design Conservatism)
Cost of Information
Unacceptable Reliability
Less Data
Conventional
More Data
Acceptable Reliability

76
uncertainty of the soil and rock parameters is reduced, thus increasing the reliability when using
a reliability-based design procedure for geotechnical infrastructure.

77
References AASHTO (2010). “LRFD Bridge Design Specifications,” 5th edition, American Association of State Highway Transportation Officials, Washington, D.C. Abu El-Ela, A.A., Bowders, J.J., and Loehr, J.E. (2013). “Reliability Based Design of Shallow Foundations on Jointed Rock Masses using RQD and the Uniaxial Compressive Strength of Intact Rock,” American Rock Mechanics Association, 47th US Rock Mechanics/Geomechanics Symposium, San Francisco, California, June 2013. Engineering Surveys & Services (2016). “Subsurface Investigation, Soil Analysis and Foundation Design Recommendations for Center for Missouri Studies Columbia, Missouri,” Available at University of Missouri Campus Facilities Building and Infrastructure Archives. FHWA (2000). “Micropile Design and Construction Guidelines Implementation Manual,” Report No. FHWA-SA-97-070 FHWA (2005). “Micropile Design and Construction Reference Manual,” Report No. FHWA-NHI-05-039 FHWA (2011). “Implementation of LRFD Geotechnical Design for Bridge Foundations Reference Manual,” Report No. FHWA-NHI-10-039 FHWA (2016). “Design and Construction of Driven Pile Foundations – Volume I,” Report No. FHWA-NHI-16-009 Gilbert, R.B. (2003). “Reliability-Based Design as a Decision Making Tool,” International Workshop on Limit State Design in Geotechnical Engineering Practice (LSD2003). World Scientific Publishing Company. gINT Professional [Computer Software]. (2017). Bentley Systems, Version 10.00.00.41 Gouldevans (2017). “SHSMO Center for Missouri Studies Construction Documents,” Vol. 1. Available at University of Missouri Campus Facilities Building and Infrastructure Archives. Gunnink, Brett and Kiehne, Chad (2002). “Capacity of Drilled Shafts in Burlington Limestone,” Journal of Geotechnical and Environmental Engineering, ASCE, Vol. 128, No. 7, pp. 539-545. Loehr, J.E., J.J. Bowders, L. Ge, W.J. Likos, R. Luna, N. Maerz, and R.W. Stephenson (2011a). “Engineering Policy Guidelines for Design of Driven Piles,” Missouri Department of Transportation, Final Report for Project NUTC R-243-1, 26 pp, August 2011. Also available on the MoDOT Engineering Guide Website titled “751.36 Driven Piles,” http://epg.modot.org/index.php?title=751.36_Driven_Piles Loehr, J.E., J.J. Bowders, L. Ge, W.J. Likos, R. Luna, N. Maerz, B.L. Rosenblad, and R.W. Stephenson (2011b). “Engineering Policy Guidelines for Design of Drilled Shafts,” Missouri Department of Transportation, Final Report for Project TRyy0922, Report

78
cmr12003, 75 pp, October 2011. Also available on the MoDOT Engineering Guide Website titled “751.37 Drilled Shafts,” http://epg.modot.org/index.php?title=751.37_Drilled_Shafts Miller, A. (2003). “Prediction of Ultimate Side Shear for Drilled Shafts in Missouri Shales,” Master’s Thesis, Department of Civil Engineering, University of Missouri, Columbia, Missouri, 372 pp. MoDOT (2014). “2014 Unit Bid Prices,” Retrieved October 10, 2017 http://www.modot.org/eBidLettingPublicWeb/viewStream.do?documentType=general_info&key=2137
MoDOT (2015). “2015 Unit Bid Prices,” Retrieved October 10, 2017 http://www.modot.org/eBidLettingPublicWeb/viewStream.do?documentType=general_info&key=2237
MoDOT (2016). “2016 Unit Bid Prices,” Retrieved October 10, 2017 http://www.modot.org/eBidLettingPublicWeb/viewStream.do?documentType=general_info&key=2437 RW Conklin Steel (2017). “Structural Steel Shape | H-Pile,” Retrieved October 23, 2017, http://www. conklinsteel.com/hpile.html. Unklesbay, A. G. (1952). “Geology of Boone County, Missouri,” State of Missouri, Jefferson City, Mo., 169 pp.

79
Appendix A: Boring Logs and Laboratory Test Results From Engineering Surveys & Services
2016

80
Figure A-1 – Borehole Location Plan

81
Figure A-2 – Symbols and Terms Used in Boring Logs

82
Figure A-3 – Summary of Laboratory Test Results for Borings B1-B9
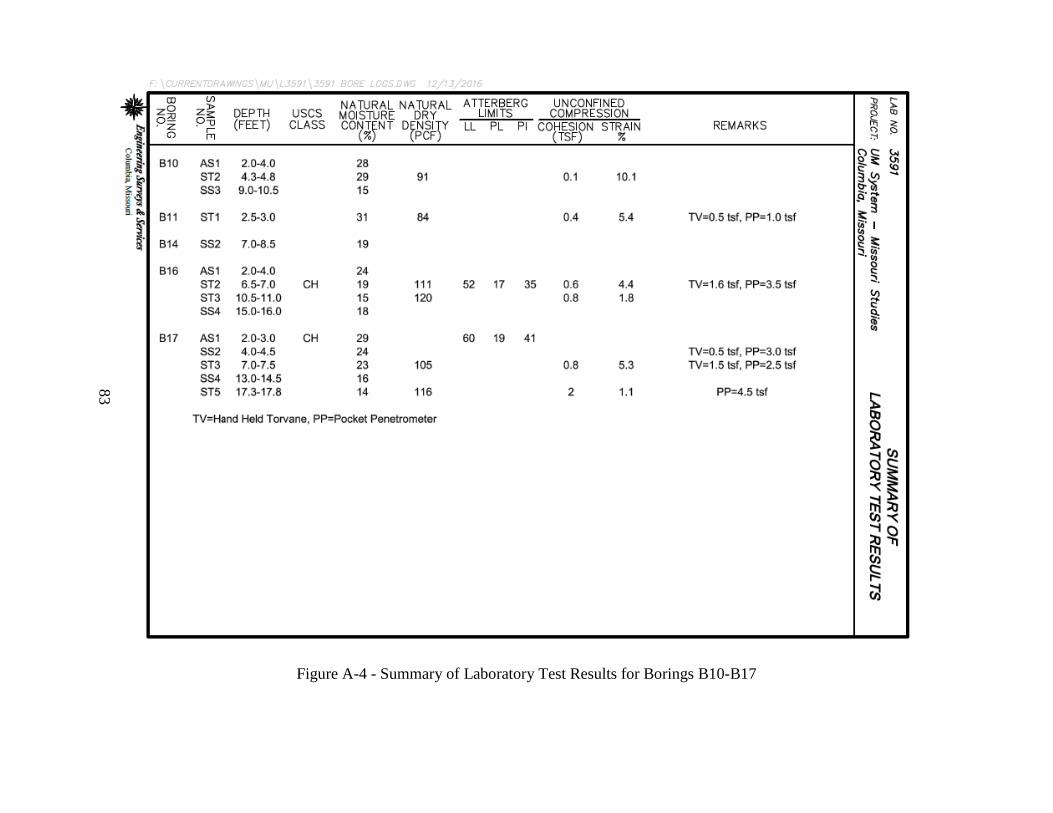
83
Figure A-4 - Summary of Laboratory Test Results for Borings B10-B17

84
Figure A-5 – Log of Boring B1

85
Figure A-6 - Log of Boring B2

86
Figure A-7 - Log of Boring B3

87
Figure A-8 - Log of Boring B4

88
Figure A-9 - Log of Boring B5

89
Figure A-10 - Log of Boring B6

90
Figure A-11 - Log of Boring B7
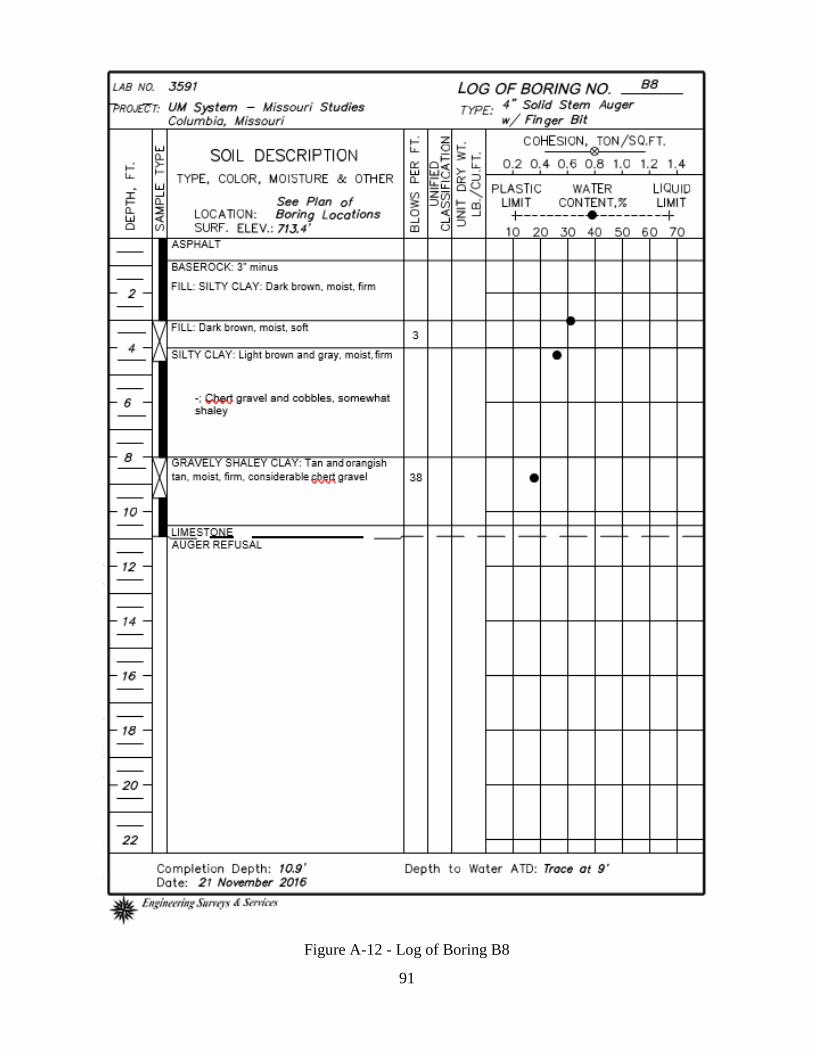
91
Figure A-12 - Log of Boring B8

92
Figure A-13 - Log of Boring B9

93
Figure A-14 - Log of Boring B10

94
Figure A-15 - Log of Boring B11

95
Figure A-16 - Log of Boring B12

96
Figure A-17 - Log of Boring B13
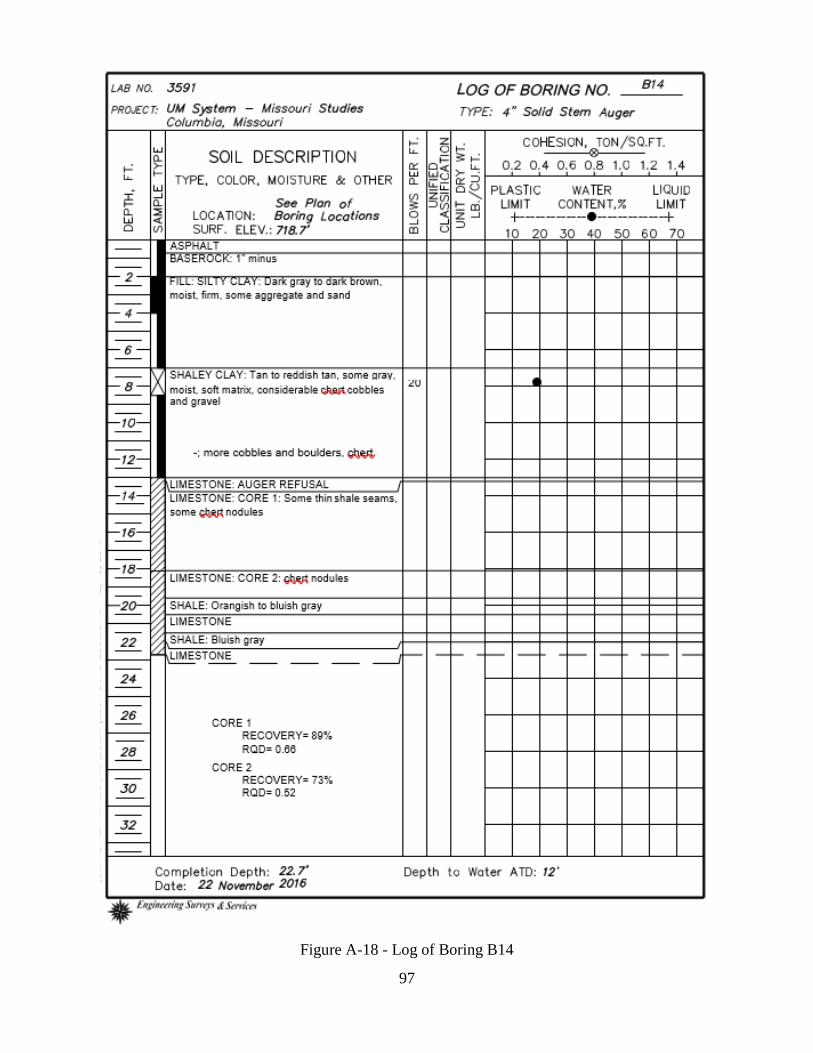
97
Figure A-18 - Log of Boring B14

98
Figure A-19 - Log of Boring B15

99
Figure A-20 - Log of Boring B16

100
Figure A-21 - Log of Boring B17

101
Appendix B: gINT Cross-Sections See Figure A-1 for Borehole Locations

102
Figure B-1 – West to East Cross-Section Showing Borings B4, B17, B5 (6th St. at the left side of the drawing and 7th St. at the right side)

103
Figure B-2 - West to East Cross-Section Showing Borings B14, B3, B15, B16 (6th St. at the left side of the drawing and 7th St. at the right side)
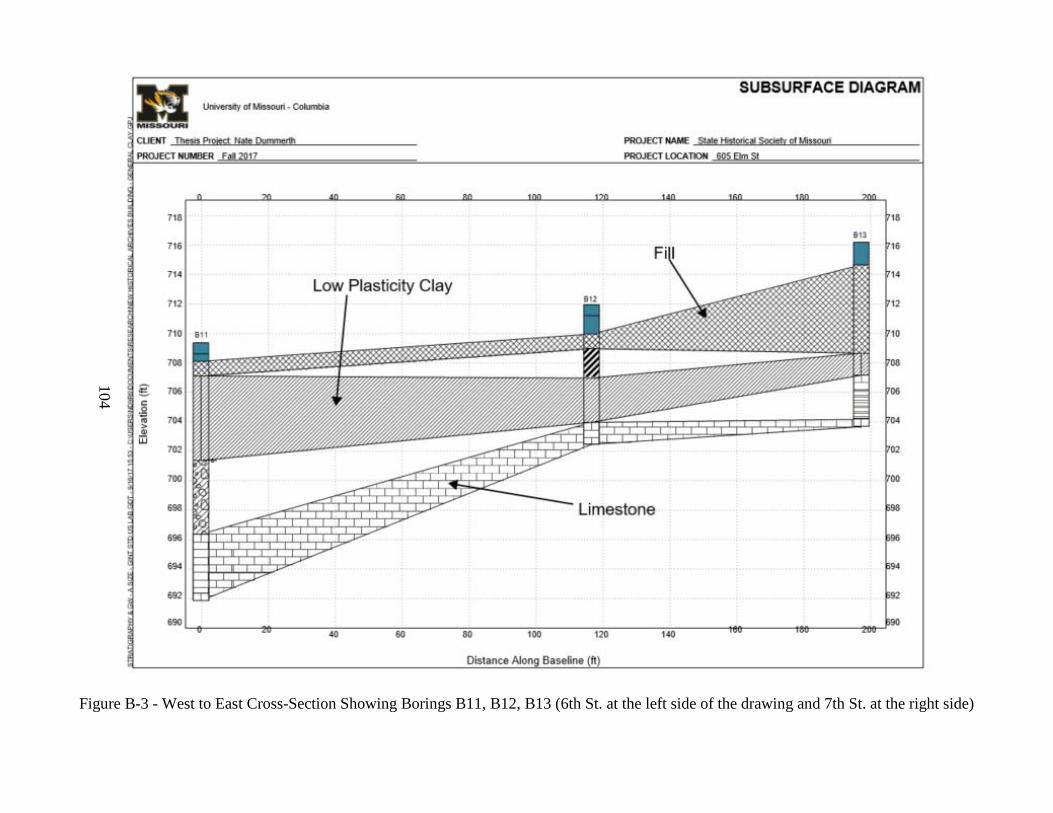
104
Figure B-3 - West to East Cross-Section Showing Borings B11, B12, B13 (6th St. at the left side of the drawing and 7th St. at the right side)

105
Figure B-4 – Diagonal Southwest to Northeast Cross-Section Showing Borings B4, B3, B15, B13 (Corner of Elm St. and 6th St. at the left side of the drawing)

106
Figure B-5 - South to North Cross-Section Showing Borings B4, B11, B9, B8 (Elm St. at the left side of the drawing and Locust St. at the right side)

107
Figure B-6 - South to North Cross-Section Showing Borings B5, B16, B13 (Elm St. at the left side of the drawing)

108
Figure B-7 - Diagonal Northwest to Southeast Cross-Section Showing Borings B11, B3, B15, B5 (Corner of Elm St. and 7th St. at the right side of the drawing)
109
Appendix C: Sample Calculations
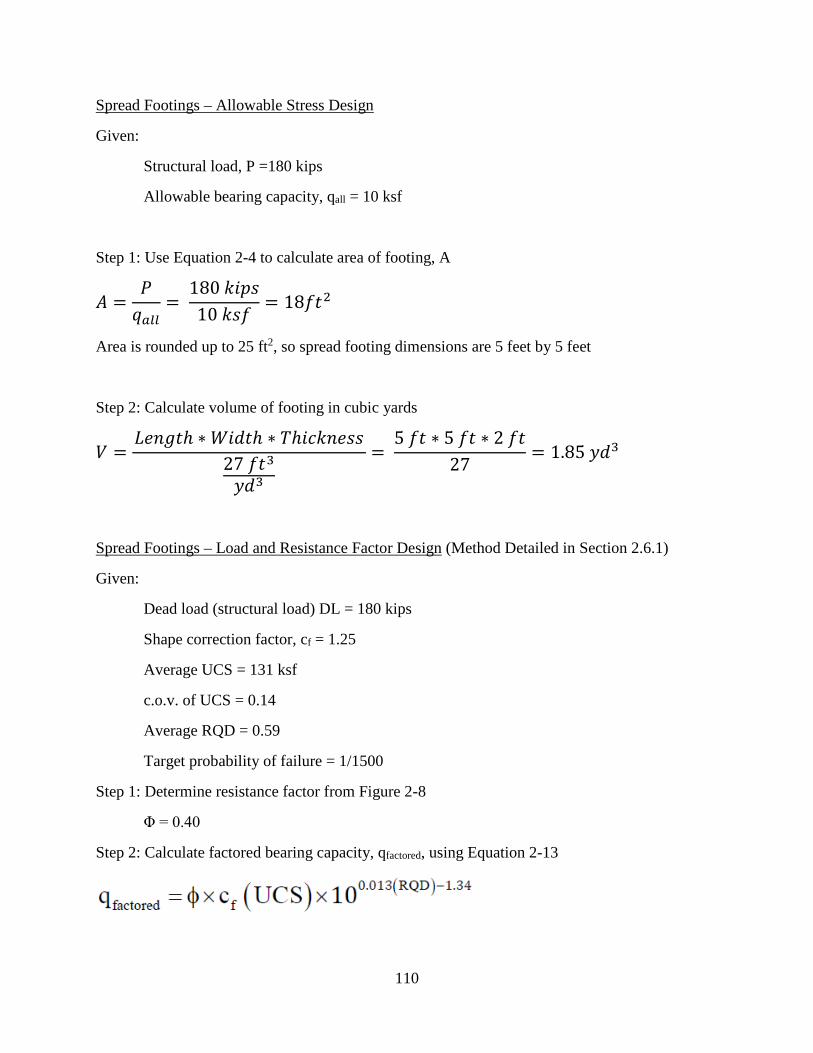
110
Spread Footings – Allowable Stress Design
Given:
Structural load, P =180 kips
Allowable bearing capacity, qall = 10 ksf
Step 1: Use Equation 2-4 to calculate area of footing, A
𝐴𝐴 =𝑃𝑃𝑞𝑞𝑎𝑎𝑢𝑢𝑢𝑢
= 180 𝑘𝑘𝑘𝑘𝑘𝑘𝑠𝑠10 𝑘𝑘𝑠𝑠𝑓𝑓 = 18𝑓𝑓𝑓𝑓2
Area is rounded up to 25 ft2, so spread footing dimensions are 5 feet by 5 feet
Step 2: Calculate volume of footing in cubic yards
𝑉𝑉 =𝜋𝜋𝐿𝐿𝐿𝐿𝐿𝐿𝑓𝑓ℎ ∗ 𝑊𝑊𝑘𝑘𝑑𝑑𝑓𝑓ℎ ∗ 𝑇𝑇ℎ𝑘𝑘𝑐𝑐𝑘𝑘𝐿𝐿𝐿𝐿𝑠𝑠𝑠𝑠
27 𝑓𝑓𝑓𝑓3𝑦𝑦𝑑𝑑3
= 5 𝑓𝑓𝑓𝑓 ∗ 5 𝑓𝑓𝑓𝑓 ∗ 2 𝑓𝑓𝑓𝑓
27 = 1.85 𝑦𝑦𝑑𝑑3
Spread Footings – Load and Resistance Factor Design (Method Detailed in Section 2.6.1)
Given:
Dead load (structural load) DL = 180 kips
Shape correction factor, cf = 1.25
Average UCS = 131 ksf
c.o.v. of UCS = 0.14
Average RQD = 0.59
Target probability of failure = 1/1500
Step 1: Determine resistance factor from Figure 2-8
Φ = 0.40
Step 2: Calculate factored bearing capacity, qfactored, using Equation 2-13

111
𝑞𝑞𝑓𝑓𝑎𝑎𝑐𝑐𝑢𝑢𝑎𝑎𝑔𝑔𝑎𝑎𝑓𝑓 = 0.4 ∗ 1.25 ∗ 0.14 ∗ 10(0.013∗0.59)−1.34 = 18 𝑘𝑘𝑠𝑠𝑓𝑓
Step 3: Calculate required area, A, of footing
𝐴𝐴 = 1.4 ∗ 𝐷𝐷𝜋𝜋𝑞𝑞𝑓𝑓𝑎𝑎𝑐𝑐𝑢𝑢𝑎𝑎𝑔𝑔𝑎𝑎𝑓𝑓
=1.4 ∗ 180 𝑘𝑘𝑘𝑘𝑘𝑘𝑠𝑠
18 𝑘𝑘𝑠𝑠𝑓𝑓 = 14 𝑓𝑓𝑓𝑓2
Area is rounded up to 16 ft2, so spread footing dimensions are 4 feet by 4 feet
Drilled Shafts – Load and Resistance Factor Design (Method Detailed in Section 2.6.2)
Given:
Dead load (structural load) DL = 470 kips
s = 0.004
m = 1.68
Average UCS, 𝑞𝑞�u = 1270 ksf
c.o.v. = 0.637
Target probability of failure = 1/1500
Step 1: Determine resistance factor from Figure 2-13
φ = 0.14
Step 2: Calculate nominal tip resistance, qp using Equation 2-15
𝑞𝑞𝑝𝑝 = 496 𝑘𝑘𝑠𝑠𝑓𝑓 ≤ 400 𝑘𝑘𝑠𝑠𝑓𝑓
Here, the nominal tip resistance exceeds the limiting design value, so 400 ksf is used.
Step 3: Calculate factored tip resistance, qfactored
𝑞𝑞𝑓𝑓𝑎𝑎𝑐𝑐𝑢𝑢𝑎𝑎𝑔𝑔𝑎𝑎𝑓𝑓 = 𝑞𝑞𝑝𝑝 ∗ 𝜑𝜑 = 400 𝑘𝑘𝑠𝑠𝑓𝑓 ∗ 0.14 = 56 𝑘𝑘𝑠𝑠𝑓𝑓
Step 4: Calculate required shaft area, A.

112
𝐴𝐴 = 1.4 ∗ 𝐷𝐷𝜋𝜋𝑞𝑞𝑓𝑓𝑎𝑎𝑐𝑐𝑢𝑢𝑎𝑎𝑔𝑔𝑎𝑎𝑓𝑓
=1.4 ∗ 470 𝑘𝑘𝑘𝑘𝑘𝑘𝑠𝑠
56 𝑘𝑘𝑠𝑠𝑓𝑓 = 11.8 𝑓𝑓𝑓𝑓2
Driven Piles– Allowable Stress Design (Method Detailed in Section 2.5.2)
Given:
Structural load, P = 470 kips
Allowable end bearing pressure = 40 ksf
Step 1: Calculate end area, Ap, of HP 14x73 pile using Equation 2-5
𝐴𝐴𝑝𝑝 = 𝐹𝐹𝐹𝐹𝐹𝐹𝐿𝐿𝐿𝐿𝐿𝐿 𝑊𝑊𝑘𝑘𝑑𝑑𝑓𝑓ℎ ∗ 𝑈𝑈𝐿𝐿𝑐𝑐𝑓𝑓𝑘𝑘𝑜𝑜𝐿𝐿 𝐷𝐷𝐿𝐿𝑘𝑘𝑓𝑓ℎ = 1.13 𝑓𝑓𝑓𝑓 ∗ 1.22 𝑓𝑓𝑓𝑓 = 1.38 𝑓𝑓𝑓𝑓2
Step 2: Calculate allowable pile capacity, Qall, using Equation 2-7
𝑄𝑄𝑎𝑎𝑢𝑢𝑢𝑢 = 𝑞𝑞𝑎𝑎𝑢𝑢𝑢𝑢 ∗ 𝐴𝐴𝑝𝑝 = 40 𝑘𝑘𝑠𝑠𝑓𝑓 ∗ 1.38 𝑓𝑓𝑓𝑓2 = 55.2 𝑘𝑘𝑘𝑘𝑘𝑘𝑠𝑠
Step 3: Determine # of piles needed in pile group
# 𝑃𝑃𝑘𝑘𝐹𝐹𝐿𝐿𝑠𝑠 = 𝑃𝑃𝑄𝑄𝑎𝑎𝑢𝑢𝑢𝑢
=470 𝑘𝑘𝑘𝑘𝑘𝑘𝑠𝑠55.2 𝑘𝑘𝑘𝑘𝑘𝑘𝑠𝑠 = 8.5 𝑘𝑘𝑘𝑘𝐹𝐹𝐿𝐿𝑠𝑠
Round up, so # of piles=9
Driven Piles– Load and Resistance Factor Design (Method Detailed in Section 2.6.3)
Given:
Dead load (structural load) DL = 470 kips
Average RQD = 0.59
Average UCS, 𝑞𝑞�u = 1270 ksf
Resistance factor, φ = 0.65
Target probability of failure = 1/1500
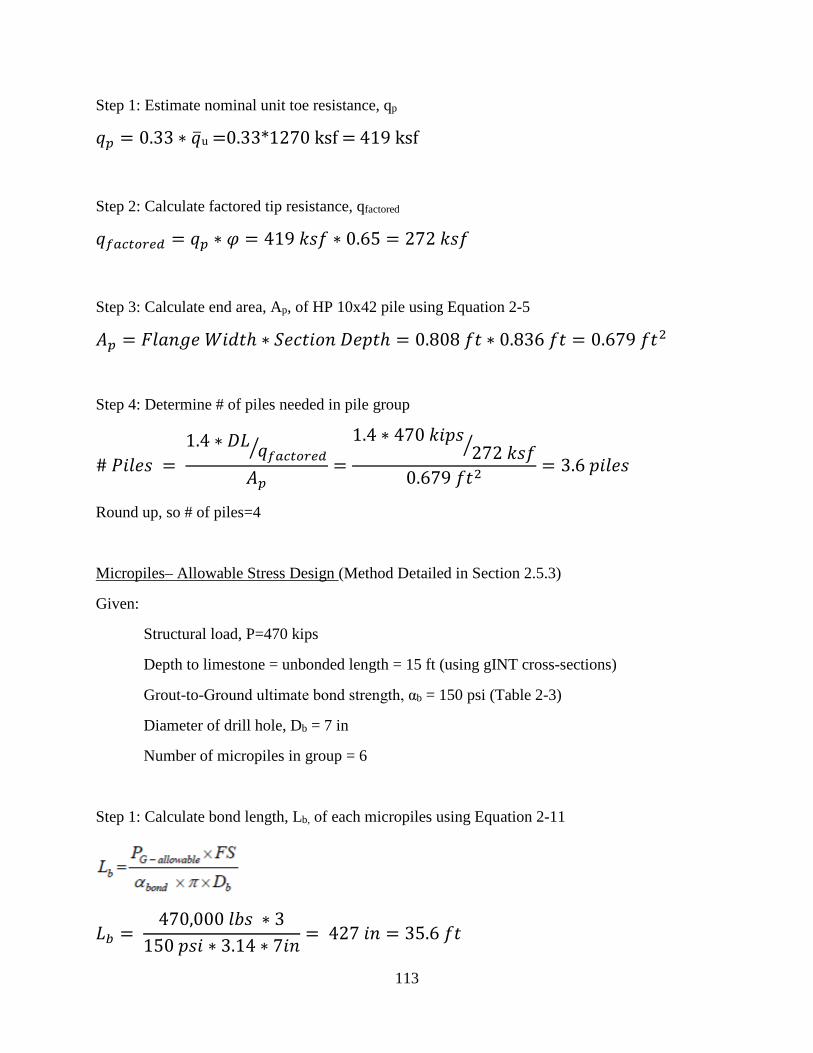
113
Step 1: Estimate nominal unit toe resistance, qp
𝑞𝑞𝑝𝑝 = 0.33 ∗ 𝑞𝑞�u =0.33*1270 ksf = 419 ksf
Step 2: Calculate factored tip resistance, qfactored
𝑞𝑞𝑓𝑓𝑎𝑎𝑐𝑐𝑢𝑢𝑎𝑎𝑔𝑔𝑎𝑎𝑓𝑓 = 𝑞𝑞𝑝𝑝 ∗ 𝜑𝜑 = 419 𝑘𝑘𝑠𝑠𝑓𝑓 ∗ 0.65 = 272 𝑘𝑘𝑠𝑠𝑓𝑓
Step 3: Calculate end area, Ap, of HP 10x42 pile using Equation 2-5
𝐴𝐴𝑝𝑝 = 𝐹𝐹𝐹𝐹𝐹𝐹𝐿𝐿𝐿𝐿𝐿𝐿 𝑊𝑊𝑘𝑘𝑑𝑑𝑓𝑓ℎ ∗ 𝑈𝑈𝐿𝐿𝑐𝑐𝑓𝑓𝑘𝑘𝑜𝑜𝐿𝐿 𝐷𝐷𝐿𝐿𝑘𝑘𝑓𝑓ℎ = 0.808 𝑓𝑓𝑓𝑓 ∗ 0.836 𝑓𝑓𝑓𝑓 = 0.679 𝑓𝑓𝑓𝑓2
Step 4: Determine # of piles needed in pile group
# 𝑃𝑃𝑘𝑘𝐹𝐹𝐿𝐿𝑠𝑠 = 1.4 ∗ 𝐷𝐷𝜋𝜋 𝑞𝑞𝑓𝑓𝑎𝑎𝑐𝑐𝑢𝑢𝑎𝑎𝑔𝑔𝑎𝑎𝑓𝑓�
𝐴𝐴𝑝𝑝=
1.4 ∗ 470 𝑘𝑘𝑘𝑘𝑘𝑘𝑠𝑠272 𝑘𝑘𝑠𝑠𝑓𝑓�
0.679 𝑓𝑓𝑓𝑓2 = 3.6 𝑘𝑘𝑘𝑘𝐹𝐹𝐿𝐿𝑠𝑠
Round up, so # of piles=4
Micropiles– Allowable Stress Design (Method Detailed in Section 2.5.3)
Given:
Structural load, P=470 kips
Depth to limestone = unbonded length = 15 ft (using gINT cross-sections)
Grout-to-Ground ultimate bond strength, αb = 150 psi (Table 2-3)
Diameter of drill hole, Db = 7 in
Number of micropiles in group = 6
Step 1: Calculate bond length, Lb, of each micropiles using Equation 2-11
𝜋𝜋𝑎𝑎 = 470,000 𝐹𝐹𝑏𝑏𝑠𝑠 ∗ 3
150 𝑘𝑘𝑠𝑠𝑘𝑘 ∗ 3.14 ∗ 7𝑘𝑘𝐿𝐿 = 427 𝑘𝑘𝐿𝐿 = 35.6 𝑓𝑓𝑓𝑓

114
Step 2: Calculate total length, L of micropile group
𝜋𝜋 = 𝜋𝜋𝑎𝑎 + (# 𝑜𝑜𝑓𝑓 𝑚𝑚𝑘𝑘𝑐𝑐𝑓𝑓𝑜𝑜𝑘𝑘𝑘𝑘𝐹𝐹𝐿𝐿𝑠𝑠 ∗ 𝑢𝑢𝐿𝐿𝑏𝑏𝑜𝑜𝐿𝐿𝑑𝑑𝐿𝐿𝑑𝑑 𝐹𝐹𝐿𝐿𝐿𝐿𝐿𝐿𝑓𝑓ℎ)
= 35.6 𝑓𝑓𝑓𝑓 + (6 ∗ 15𝑓𝑓𝑓𝑓)
= 125.6 𝑓𝑓𝑓𝑓
Micropiles– Load and Resistance Factor Design (Method Detailed in Section 2.6.4)
Given:
Structural load, P=470 kips
Depth to limestone = unbonded length = 15 ft (using gINT cross-sections)
Grout-to-Ground ultimate bond strength, αb = 150 psi (Table 2-3)
Diameter of drill hole, Db = 7 in
Number of micropiles in group = 6
Resistance factor, φqs = 0.55
Target probability of failure = 1/1500
Step 1: Calculate bond length, Lb, of each micropiles using Equation 2-20
𝜋𝜋𝑎𝑎 = 1.4∗𝐷𝐷𝐷𝐷𝜑𝜑𝑞𝑞𝑞𝑞𝛼𝛼𝑏𝑏𝜋𝜋𝑓𝑓𝑏𝑏
𝜋𝜋𝑎𝑎 = 1.4∗470,000 𝑢𝑢𝑎𝑎𝑠𝑠0.55∗150𝑝𝑝𝑠𝑠𝑐𝑐∗3.14∗7𝑐𝑐𝑐𝑐
= 363 𝑘𝑘𝐿𝐿 = 30.2 𝑓𝑓𝑓𝑓
Step 2: Calculate total length, L of micropile group
𝜋𝜋 = 𝜋𝜋𝑎𝑎 + (# 𝑜𝑜𝑓𝑓 𝑚𝑚𝑘𝑘𝑐𝑐𝑓𝑓𝑜𝑜𝑘𝑘𝑘𝑘𝐹𝐹𝐿𝐿𝑠𝑠 ∗ 𝑢𝑢𝐿𝐿𝑏𝑏𝑜𝑜𝐿𝐿𝑑𝑑𝐿𝐿𝑑𝑑 𝐹𝐹𝐿𝐿𝐿𝐿𝐿𝐿𝑓𝑓ℎ)
= 30.2 𝑓𝑓𝑓𝑓 + (6 ∗ 15𝑓𝑓𝑓𝑓)
= 120.2 𝑓𝑓𝑓𝑓