Reliability at work
100
2008 Annual Report A lasting effect on our world ...
Transcript of Reliability at work

2008 Annual Report
A lasting effect on our world ...
Reliability at work

Bucyrus International, Inc. is a globalleader in the mining industry, manufacturingmachinery for surface and undergroundmining operations. We are working alongsideour corporate partners to set new standards of global stewardship and are employing technologies and strategies to work responsiblyand profitably in a new era of resource recovery. With thoughtful focus on practices thatimprove productivity and conserve energy,Bucyrus is instrumental in delivering theresources that power communities the world over.It is a responsibility we hold as core to our values, ultimately creating alasting, positive effect on our world.
Bucyrus International, Inc. shares of common stock are traded
on the NASDAQ Stock Market under the symbol BUCY. As of
February 24, 2009, there were 27 stockholders of record.
A copy of the Bucyrus International, Inc. 2008 Annual Report on
Form 10-K as filed with the Securities and Exchange Commission
is available at no charge on our web site, www.bucyrus.com, or by
contacting our investor relations contact.
INDEPENDENT REGISTERED PUBLIC ACCOUNTING FIRM
Deloitte & Touche LLP
555 East Wells Street
Milwaukee, Wisconsin USA 53202
TRANSFER AGENT AND REGISTRAR
Wells Fargo Shareowner Services
161 North Concord Exchange
South St. Paul, Minnesota USA 55075
INVESTOR RELATIONS CONTACT
Kent B. Henschen
Director, Corporate Communications
1100 Milwaukee Avenue
South Milwaukee, Wisconsin USA 53172
T: 414.768.4626 F: 414.768.5211
INVESTOR INFORMATION
ANNUAL MEETING
Thursday, April 23, 2009 at 10 a.m. CDT
Heritage Building on the campus of Bucyrus International, Inc.
1100 Milwaukee Avenue
South Milwaukee, Wisconsin USA 53172
RRD9557_Cov:RRD9557 3/12/09 5:38 PM Page 2

1

2
TABLE OF CONTENTS
Stockholders’ Letter 4
Board of Directors 6
Financial Highlights 7
History in the Making 8
Groundbreaking Technology 10
Reliability at Work 12
Bucyrus and Clean Coal 16
Communities in Common 18
2008 Accomplishments 19
Corporate Highlights 20
Financial Statements 21
Investor Information Inside Back Cover

3
Founded in 1880, Bucyrus is known worldwide for its design and manufacture of large excavationmachinery used in mining. In 2008, we expandedboth our product offerings and facilities to meet thegrowing demand of customers across the spectrumof global mining operations. Our extensive productline includes draglines, electric mining shovels,rotary blasthole drills, longwall systems, room & pillar machinery and belt systems. Aftermarket products and services include replacement parts,
maintenance, technical advice, structural and mechanicalengineering, repairs, rebuilds, refurbishments andupgrades. We also offer complete equipment managementunder long-term MARC® programs. Sales are generateddirectly through internal as well as independent salesrepresentatives. Headquartered in South Milwaukee,Wisconsin, U.S.A., Bucyrus has a network of globalsubsidiaries and regional offices strategically basedamid the world’s primary mining areas.
Bucyrus Headquarters
Manufacturing Facility
Sales/Service Facility
Bucyrus is committed to improving environmental and safety performance through minimizing air and
water emissions and reducing waste. We will control and eliminate, where possible, any source of hazards,
hazardous materials and emissions involved in manufacturing and support processes.

4
Dear Fellow Stockholders,
You will notice that we have prominently displayed our connectionwith the environment in this year’s annual report. While manybelieve the mining industry is not in harmony with our environment,nothing could be further from the truth. As global climate changecontinues to be a prominent subject of debate, it is important thatour stockholders understand that Bucyrus and our industry arestrongly committed to environmental stewardship.
Coal is the most plentiful, reliable and cost-effective source ofenergy on Earth. An estimated two-thirds of our revenue is derivedby supplying machines, parts and service to the worldwide coalindustry. Approximately $18 billion of our over $27 billioninstalled base of machinery is employed in coal mining. Seventy-seven countries around the world have coal reserves that can beused to generate electricity or to export it to other countries forpower generation. Considering that nearly half of all electricalpower generation in the world is derived from coal, it is easy torecognize the strategic importance of this fuel source.
As a result of the broad use of coal as a power source, clean coaltechnologies are the key to harmonizing the cost-effective use ofour abundant worldwide coal resources and a cleaner environment.Although the technology to gasify and liquefy coal has been inexistence for decades, it is important that a global policy beestablished to provide for the capture and sequestration of carbondioxide, a bi-product of burning or gasifying coal. Carbon dioxidesequestration has been used successfully in the revitalization ofdepleted oil reserves around the world. It is equally important thatwe also capture hydrogen, another bi-product of coal gasification,which can be used as another fuel source. Refining methods forthe capture of carbon dioxide and hydrogen will lead us to not onlymore effectively utilize existing oil reserves, but also to develop
new sources of energy like hydrogen. We need to advance thecommercialization of these processes with the attendant benefit ofa cleaner environment.
By placing more emphasis on the development and implementationof these clean coal technologies, our world will be assured of aplentiful supply of cost-effective and environmentally friendlyelectricity for decades to come.
THE YEAR IN REVIEWOur company enjoyed yet another record year in 2008. As we continued our strong revenue and earnings growth, we were also gratified by the many accolades that we received this year from independent observers. In May, we were recognized byIndustryWeek magazine as among the top 50 best public manufacturing companies. In September, we were listed byFortune magazine as 4th in its list of the 100 fastest growingcompanies and, in October, Robert W. Baird & Co. announcedBucyrus as the winner of its Management Excellence Award. All of these accolades, coupled with an upgrade in our credit ratingby Standard & Poor’s and Moody’s, two featured appearances onCNBC’s “Mad Money,” an economic summit held at our SouthMilwaukee manufacturing facility by then presidential hopefulSenator John McCain, and the “Bucyrus Day” proclamation by thegovernor of Wisconsin on the occasion of the commemoration of ourexpanded and renovated South Milwaukee campus, all made for avery memorable year.
FINANCIAL PERFORMANCEOur record 2008 financial performance was highlighted by an overallrevenue increase of 55% while our EBITDA increased by 93% from2007. Our year-end backlog was $2.5 billion or nearly 75% more

than at the end of 2007. We made great strides integrating ournew underground segment this year and now both surface andunderground segments are achieving superior financial performance.We are focused on continuing that trend in 2009.
MARKET OVERVIEWThere is no question that 2008 was a tale of two distinctly differenteconomic markets. The collapse of the international economy in thefourth quarter posed new challenges for virtually every companyaround the globe. Although the year was no less challenging in manyrespects for us, there are distinct differences between Bucyrus andother companies that supply machinery to the commodities markets.
In general, the commodities markets tend to be countercyclical.When the overall economy is faltering, commodities tend to do welland vice versa. Additionally, when there is a change in commoditiespricing, we are usually one of the last companies to be affectedone way or another. Typically, we tend to lag behind an upsurge ora downturn in the commodities markets by up to two years.
A good example of this tendency could be seen in our 2008financial performance. Despite a significant drop in commoditiesprices during the later half of the year, we nearly doubled ourbacklog between year-end 2007 and year-end 2008 with significantnew bookings occurring in the third and fourth quarters of theyear. Certainly these were the two quarters when most companies,including prominent machinery suppliers to the mining industry,were having a number of orders either cancelled or delayed.
We are also somewhat unique from other machinery suppliers inthat, historically, we rarely have experienced customer cancellationsor delays in our machinery or parts orders. First, what we do is veryspecial and it tends to be specialized for a specific mine siteapplication. Secondly, we often require progress payments for ourequipment based on the capital intensive nature of our machines andthese payments act as a natural deterrent to cancellations or delays.Finally, in developing and emerging countries, we usually requirethat machine orders be covered by letters of credit guaranteeing thepayment of the customer’s order. These factors add up to provide uswith a relative level of predictability as it relates to our stated backlog.
2009 AND BEYONDReviewing the macroeconomic trends, we are hopeful that the recentcommodities markets corrections will be relatively short lived. Webelieve that China and other developing countries will continue to havethe most important long-term effect on the commodities markets. Thecontinuing urbanization and industrialization of China, althoughslowed by the recent downturn in the international economy, weanticipate will ultimately continue longer term. Perhaps moreimportantly, there does not appear to be any slowdown within China
in establishing much needed internal infrastructure such as powerplants, roads and rail construction to accommodate future urbanizationand industrialization. As a result, we also expect commodities demandcould return to prior levels in the not-too-distant future, whichshould have a positive effect on pricing and capital expenditures bycommodity producers. Our balance sheet is in good shape and webelieve we are positioned well for recovery in the commodities markets.
BUCYRUS AND THE ENVIRONMENTSo what are we specifically doing to create a cleaner environmentfor our future? As a direct result of our $200 million refurbishmentof our facility in South Milwaukee, we have substantially increasedour energy efficiencies through the application of modern insulatingmaterials as well as the application of new energy efficient officeequipment, appliances and lighting. In addition, by recycling andemploying new conservation methods and more modern equipment,we have effectively reduced our water consumption by more than25%. At our Milwaukee and South Milwaukee facilities we haveincreased our annual recycling efforts to the following levels:
• 23.5 million pounds of scrap steel• 69,000 gallons of oil and coolant• 982 tons of wood• 1,500 lamps of recycled glass• 43,000 gallons per day of captured and recycled water
These are only a few specific examples of the green initiatives thatBucyrus pursues on a daily basis at all of our locations around theworld. At Bucyrus and in the worldwide mining industry, we arededicated to being good stewards of the environment. It is ourintention to be an integral leader in creating, sustaining andenhancing a safe and environmentally friendly industry. We trustthat this is important to you, our stockholders, as well.
TIMOTHY W. SULLIVANPresident and Chief Executive Officer
Reliability at work
5

6
BOARD OF DIRECTORS AND EXECUTIVE MANAGEMENT
EXECUTIVE MANAGEMENTTTiimmootthhyy WW.. SSuulllliivvaann - President and Chief Executive OfficerCCrraaiigg RR.. MMaacckkuuss - Chief Financial Officer and SecretaryJJoohhnn FF.. BBoossbboouuss - Treasurer
KKeennnneetthh WW.. KKrruueeggeerr - Chief Operating OfficerLLuuiiss ddee LLeeoonn - Chief Operating OfficerWWiilllliiaamm SS.. TTaattee - Executive Vice President
NNoottee::
RRoobbeerrtt WW.. KKoorrtthhaallss Bucyrus director 2004 – mid-2008. RRoonnaalldd AA.. CCrruuttcchheerr Bucyrus director 2004 – mid-2008.
TThheeooddoorree CC.. RRooggeerrss is an officer and director of AmericanIndustrial Partners and has been a director of Bucyrus since1997. Mr. Rogers has served as our chairman of the board since 2004.
PPaauull WW.. JJoonneess is chairman of the Compensation Committee, the chairman, president and chief executive officer of A.O. SmithCorp. and has been a director of Bucyrus since July 2006.
GGeennee EE.. LLii tt tt llee is the chairman of the Audit Committee, adirector and member of the Audit Committee of HuntingtonBancshares Inc. and has been a director of Bucyrus since 2004.
RRoobbeerrtt KK.. OOrrttbbeerrgg is executive vice president and chief operating officer of Rockwell Collins Commercial Systems.Mr. Ortberg has been a director of Bucyrus since July 2008.
EEddwwaarrdd GG.. NNeellssoonn is the chairman of the Nominating &Corporate Governance Committee, president and chairman of the board of Nelson Capital Corp. and has been a director of Bucyrus since 2004.
RRoobbeerrtt LL.. PPuurrdduumm is a director and partner of AmericanIndustrial Partners and has been a director of Bucyrus since 1997.
RRoobbeerrtt CC.. SScchhaarrpp serves as chairman of Shell Canada’s MiningAdvisory Council, is director of Foundation Coal Holdings, Inc.and has been a director of Bucyrus since July 2005.
TTiimmootthhyy WW.. SSuulllliivvaann is the president and chief executive officerand has been a director of Bucyrus since 2000.
BOARD OF DIRECTORSBACK ROW: (left to right)Edward G. Nelson, Robert L. Purdum, Gene E. Little,Robert C. Scharp, Paul W. Jones,Robert K. Ortberg SEATED: (left to right)Theodore C. Rogers, Timothy W. Sullivan

7
(Dollars in thousands, except per share data) 2008 2007 2006
Sales $2,505,838 $1,613,391 $738,050 Net earnings $233,315 $136,134 $70,344
Net earnings per share
Basic $3.14 $1.94 $1.12
Diluted $3.10 $1.93 $1.12Total assets $2,552,651 $2,068,212 $600,712 Total debt $571,046 $536,069 $82,597
Stockholders’ investment $949,508 $810,850 $295,996
Common shares outstanding 74,862,066 74,827,474 63,154,334
Closing common stock price $18.52 $49.70 $25.88
FINANCIAL HIGHLIGHTS
0
$500
$1,000
$1,500
$2,000
$2,500
$3,000
$3,500
$4,0002008 MACHINE SALES BY COMMODITY
Coal 65%
Note: Bucyrus acquired DBT GmbH in May 2007.
Copper15%
Oil Sands 7%
Gold 3%
Iron Ore9%
Other 1%
$657$797
$974
$1,719
$3,567
BOOKINGS(US$ in millions)
0
$500
$1,000
$1,500
$2,000
$2,500
$3,0002008 TOTAL SALES BY PRODUCT
Machines54%
Aftermarket46% $454
2004 2005 2006 2007 2008
$575$738
$1,613
$2,505
SALES(US$ in millions)
0
$500
$1,000
$1,500
$2,000
$2,500
$3,000TOTAL BACKLOG(US$ in millions)
NorthAmerica
37%
Europe & Russia22%
South America
19%
Australia /Asia Pacific
12%
Africa5%
China3%
Other2%
$436
$659
$895
$1,441
$2,502
2008 TOTAL SALES BY REGION
2004 2005 2006 2007 2008
2004 2005 2006 2007 2008

From humble beginnings to a globally known innovator, Bucyrus continues
to expand its capabilities, including our facility in Houston, Pennsylvania.
8
The ingenuity and determination that shaped Bucyrus’
rich history has transformed our world headquarters
into an extraordinary, modernized manufacturing
campus in South Milwaukee, Wisconsin.

9
As demand for high-quality equipment that reduces costs and increases efficiency and safety increased,
we essentially completed a multi-million dollar, multi-phase upgrade of the facilities at our headquarters in
South Milwaukee, Wisconsin. There, the Bucyrus Museum reveals our lasting legacy as a
leader in the mining industry. Visitors now have a unique opportunity to venture through
new and renovated facilities where Panama Canal shovels were once built and where
the world’s largest excavators of their kind are manufactured today.
Our modernized facilities also include hundreds of thousands of square footage for fabricating and
manufacturing, a raw materials laydown storage area, additional assembly area space, warehouse space,
machining areas, additional outside storage and a leasing facility for large weldments. We have expanded
our operations in Indiana, Texas, Wyoming, Australia, China, India and South Africa. All will
strengthen our position in the mining world during this historic period of industrial growth
and global change.
History in the making as Bucyrusachieves tremendous sales in 2008. In our128th year, we continue expanding ourproducts and facilities to reinforce our positionas a global leader and innovator.

Groundbreaking technology drivesour company, both in our daily work lives andin the equipment we manufacture: the mostproductive, safe and reliable mining machinesavailable today.
Innovation. High productivity. Continuous improvement. These are the
drivers behind Bucyrus Edge Technologies, delivering operational
improvements that boost our customers’ bottom line. Bucyrus continues
to deliver leading-edge technology and solutions to improve mine
productivity and lower our customers’ cost per ton. We also seek improved
machine performance, higher reliability and expanded services that maximize
the productivity of our machines.
10
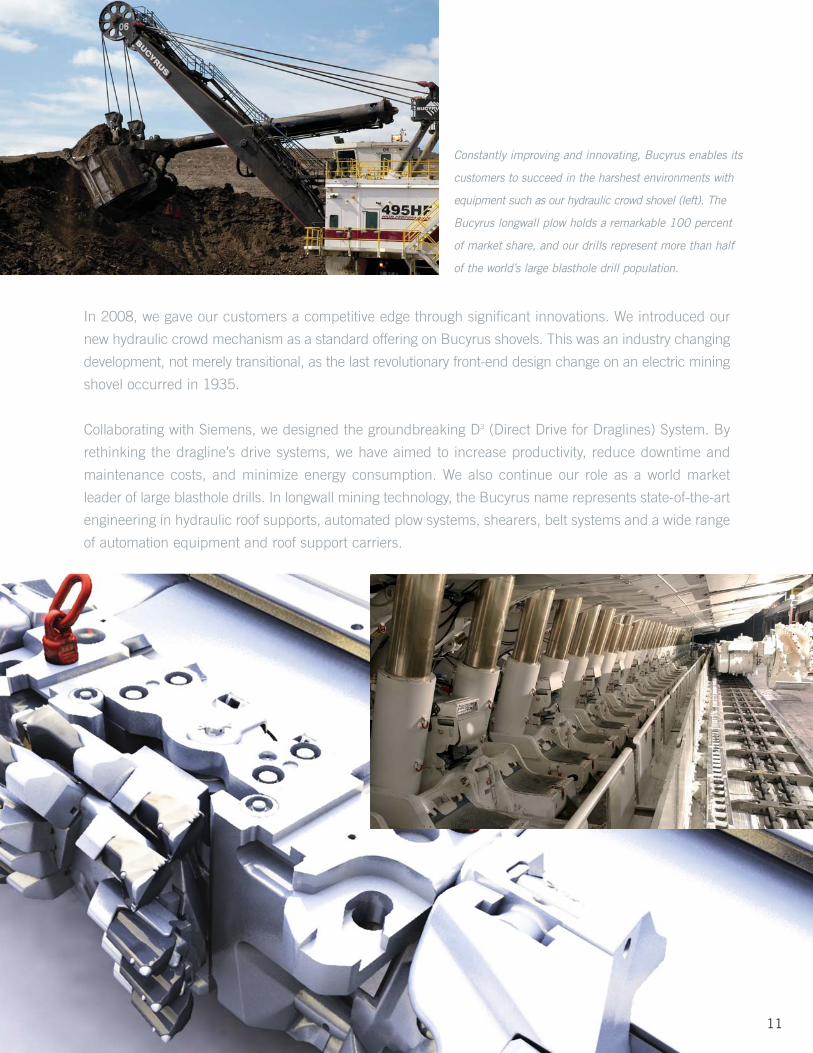
In 2008, we gave our customers a competitive edge through significant innovations. We introduced our
new hydraulic crowd mechanism as a standard offering on Bucyrus shovels. This was an industry changing
development, not merely transitional, as the last revolutionary front-end design change on an electric mining
shovel occurred in 1935.
Collaborating with Siemens, we designed the groundbreaking D3 (Direct Drive for Draglines) System. By
rethinking the dragline’s drive systems, we have aimed to increase productivity, reduce downtime and
maintenance costs, and minimize energy consumption. We also continue our role as a world market
leader of large blasthole drills. In longwall mining technology, the Bucyrus name represents state-of-the-art
engineering in hydraulic roof supports, automated plow systems, shearers, belt systems and a wide range
of automation equipment and roof support carriers.
11
Constantly improving and innovating, Bucyrus enables its
customers to succeed in the harshest environments with
equipment such as our hydraulic crowd shovel (left). The
Bucyrus longwall plow holds a remarkable 100 percent
of market share, and our drills represent more than half
of the world’s large blasthole drill population.
12
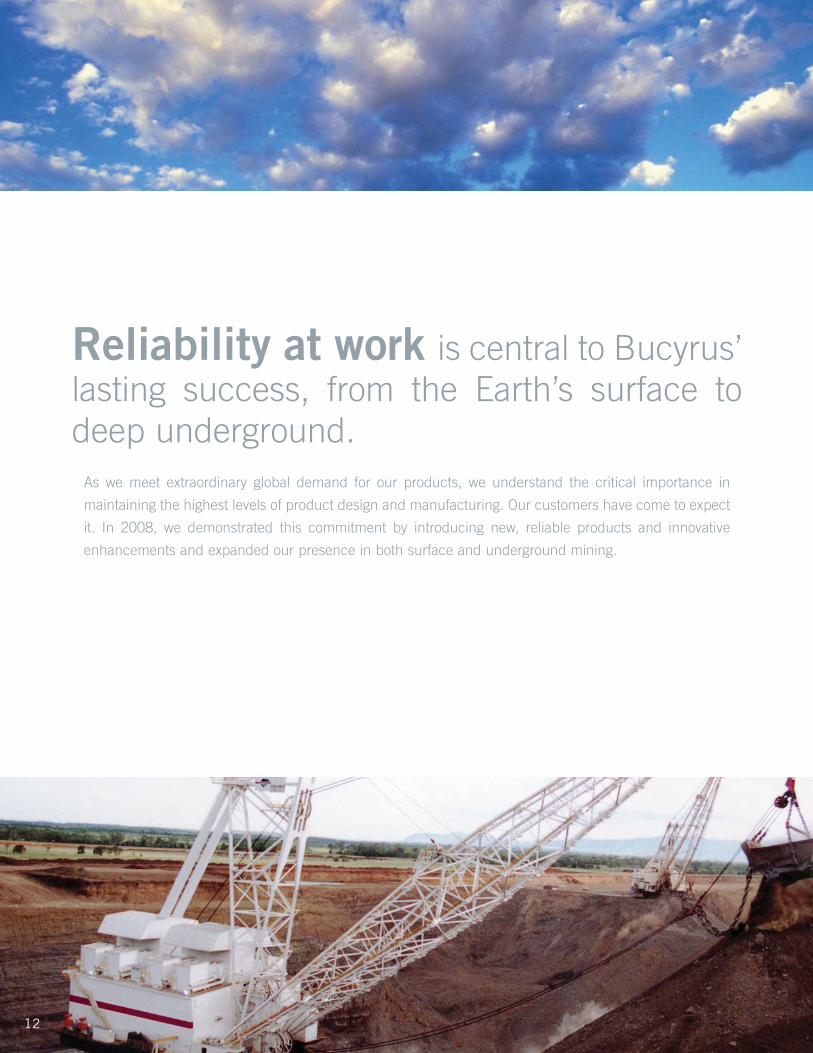
Reliability at work is central to Bucyrus’lasting success, from the Earth’s surface todeep underground.
As we meet extraordinary global demand for our products, we understand the critical importance in
maintaining the highest levels of product design and manufacturing. Our customers have come to expect
it. In 2008, we demonstrated this commitment by introducing new, reliable products and innovative
enhancements and expanded our presence in both surface and underground mining.

Among today’s mining equipment manufacturers, Bucyrus excels in product performance and efficiency.
Bucyrus draglines operate at the industry’s lowest cost per ton, while impressive digging forces and rapid
cycle times make our shovels an industry leader in mineral and overburden removal. Our HydraCrowd™
represents the first new electric loading shovel crowd technology developed in the past 70 years, and
offers substantial maintenance savings.
Already an established leader in large blasthole drills, Bucyrus continues to improve on technology and
design to offer an extremely reliable, productive and cost effective means of drilling in mining operations.
From surface mining shovels well-known for reliability and
operator safety, to underground longwall shearers uniquely
designed for high production rates, Bucyrus products handle
the world’s toughest commodity removal applications.
13

Bucyrus roof support shields are used worldwide under
the most extreme underground mining conditions.
They are rigorously tested at our modern
in-house facilities to ensure reliability
and a long service life.
14

15
Underground, Bucyrus’ design expertise is put to work with longwall equipment,
an extensive line of room and pillar products and belt systems used in some
of the harshest subterranean environments on Earth. Investment in research
and development of these products remains a top priority. It allows us to
fuel innovation in the industry while spurring success for Bucyrus, our customers
and our investors.
With expertly engineered Bucyrus OEM parts, and an in-depth understanding
of equipment applications, we assure that our customers receive high-quality
products supported by exemplary aftermarket services. These include
mechanical and electrical upgrades, parts programs, customer service and
consulting services, all aimed at ensuring the reliability, productivity and safety
of our machines.

Clean Coal is a necessity in our worldtoday and in the future. Bucyrus supports thegrowth of clean coal technology, while activelysupporting resource reclamation and responsibleenvironmental stewardship.
16

17
As the demand for coal-based energy rises and environmental concerns increase, clean coal
technologies have become more important. Coal liquefaction, coal gasification and carbon capture and
storage will drastically reduce emissions and other pollutants created during the energy creation process.
These technologies will create more cost-effective, efficient and clean-burning fuel.
In 2008, coal markets accounted for 65 percent of Bucyrus’ machine sales, and that trend is predicted
to increase. Bucyrus continues to seek opportunities that lie with all mineral resources (e.g., copper, oil
sands, iron ore), wisely holding our doors open for every possible growth advantage.
Bucyrus supports clean coal technologies, which offer greater energy
independence and security, economic competitiveness and can help
satisfy demands for reduced emissions and cleaner air.

18
With strong corporate growth comes a continuedresponsibility to support the communities inwhich we live and operate.
From mentoring programs to community-based health services, Bucyrus demonstrates a solid commitment
to social development. We are involved in cultural, educational and social initiatives, such as United Way,
that support our employees, customers and other stakeholders and their communities. Bucyrus is also
dedicated to providing a safe and environmentally sound working environment for our employees,
customers, visitors and neighbors. By seeking growth opportunities for our business, we contribute
significantly to job creation and other economic development efforts which benefit our stockholders and
customers as well as local and global economies.

1919
2008 ACCOMPLISHMENTSBucyrus strives to create a lasting beneficial effect on the world in which we live. 2008 was a very positiveyear for us. Below are the accomplishments for which we are particularly proud:
JJaannuuaarryy
• Bucyrus launches new global corporate website, with interactive toolsand information that visitors can access efficiently.
FFeebbrruuaarryy
• President & CEO Tim Sullivan is interviewed by CNBC’s Matt Nesto in areport titled “Industrial Revolution.”
• Bucyrus announces the completion of the expansion of its belt systemsoperations in Pearisburg, Virginia.
MMaarrcchh
• Bucyrus signs global alliance agreement with Vale, a leading supplier of iron ore, copper, coal andother minerals to the world’s global commodity markets.
AApprriill
• Arizona senator and then presidential candidate John McCain visitsBucyrus headquarters to take part in an economic summit with twopanels of Milwaukee business leaders.
MMaayy
• Bucyrus is recognized by IndustryWeek magazine as oneof the “Top 50 Best Public Manufacturing Companies.”
JJuunnee
• President & CEO Tim Sullivan, makes his first appearance on Jim Cramer’s CNBC show “Mad Money,” giving his outlook of Bucyrus’ operations and the coal market.
JJuullyy
• Bucyrus hosts a Commemoration Ceremony to rededicate its renovatedglobal headquarters in South Milwaukee. Bucyrus was presented witha gubernatorial proclamation that designated July 25th as BucyrusInternational, Inc. Day in the State of Wisconsin.
AAuugguusstt
• Bucyrus and United Steelworkers of America, Local No. 8-00002-02, in Pulaski, Virginia reach a contract agreement to August 22, 2011.
SSeepptteemmbbeerr
• Bucyrus is listed in Fortune magazine as #4 in their 100 Fastest-GrowingCompanies list.
• Bucyrus unveils its new HydraCrowd™ shovel at the largest mining industrytradeshow, MINExpo, in Las Vegas, Nevada.
OOccttoobbeerr
• Robert W. Baird announces Bucyrus as the winner of its Management Excellence Award.
NNoovveemmbbeerr
• Bucyrus announces the signing of a new machine contract with BHP Billiton Mitsubishi Alliance,Australia, for the supply of a new 8750 walking dragline.
• Bucyrus is added to Standard & Poor’s MidCap 400 GICS Construction & Farm Machinery & HeavyTrucks Sub-Industry index.
DDeecceemmbbeerr
• Bucyrus announces the acquisition of OKD, Bastro a.s., an engineering services and manufacturing supportcompany based in the Czech Republic.
• Bucyrus and members of the United Steelworkers of America, Local 1343 employed at the SouthMilwaukee and Milwaukee facilities extend a contract agreement to April 30, 2013.

2020
COMMON STOCK TRADING PRICES(US$ per share)
2008 High LowFirst Quarter $57.00 $33.66Second Quarter $79.50 $49.33Third Quarter $75.99 $36.53Fourth Quarter $44.50 $13.66
2007First Quarter $29.22 $22.32Second Quarter $36.60 $25.20Third Quarter $39.89 $28.35Fourth Quarter $52.18 $35.20
2006First Quarter $24.70 $17.30Second Quarter $30.36 $18.87Third Quarter $26.71 $19.28Fourth Quarter $26.06 $19.94
COMMON STOCKHOLDERS’ INVESTMENT(US$ in thousands)
PERFORMANCE INFORMATION
STOCK CLOSING PRICES
CORPORATE HIGHLIGHTS
$167,068$137,867
$220,900$295,996
$810,850
$949,508
2005 2006 2007 2008
$6.00
$13.55$17.57
$25.88
$49.70
$18.52
7/23/04(IPO)
12/31/04 12/30/05 12/29/06 12/31/07 12/31/08
S&P 500 Stock Index DJUSHR Bucyrus International, Inc.
20047/23/04
The accompanying graph compares our cumulative
total stockholder return with the cumulative total
return of the Standard & Poor’s 500 Stock Index
and the Dow Jones U.S. Commercial Vehicles
and Truck Index (“DJUSHR”), which was formerly
known as The Dow Jones Heavy Machinery Index.
The graph assumes $100 was invested on
July 23, 2004, the first trading day following
the completion of our initial public offering, and
assumes the reinvestment of dividends.

21
Bucyrus International, Inc. Financial Statements

22
This page intentionally blank.

23
Bucyrus International, Inc. Consolidated Statements of Earnings Years Ended December 31, 2008 2007 2006 (Dollars in thousands,
except per share amounts) Sales $2,505,838 $1,613,391 $738,050 Cost of products sold 1,823,335
________ 1,205,066
________ 551,275
________
Gross profit 682,503 408,325 186,775 Selling, general and administrative expenses 243,932 185,639 73,138 Research and development expenses 36,550 20,358 10,661 Amortization of intangible assets 19,390
________ 29,181
________ 1,792
________
Operating earnings 382,631 173,147 101,184 Interest income (6,206) — —
Interest expense 34,768 24,195 3,693 Other income — — (818) Other expense 3,071
________ 2,394
________ 1,035
________ Earnings before income taxes 350,998 146,558 97,274 Income tax expense 117,683
________ 10,424
________ 26,930
________ Net earnings $233,315
$136,134
$70,344
Net earnings per share data
Basic: Net earnings per share $3.14 $1.94 $1.12 Weighted average shares 74,350,939 70,014,440 62,529,160
Diluted: Net earnings per share $3.10 $1.93 $1.12 Weighted average shares 75,205,020 70,715,340 63,079,522
See notes to consolidated financial statements.

24
Bucyrus International, Inc. Consolidated Statements of Comprehensive Income Years Ended December 31, 2008 2007 2006 (Dollars in thousands) Net earnings $233,315
$136,134
$70,344
Other comprehensive income:
Currency translation adjustments (43,351) 16,811 1,215 Change in minimum pension liability, net of
income tax expense of $1,202
—
—
4,626 Change in pension and postretirement
unrecognized costs, net of income tax (benefit) expense of ($15,759) and $5,811, respectively
(27,846)
12,034
—
Derivative fair value changes, net of income tax benefit of $13,305 and $5,073, respectively
(23,186)
(7,518)
—
Other comprehensive (loss) income (94,383)
21,327
5,841
Comprehensive income $138,932
$157,461
$76,185
See notes to consolidated financial statements.
25
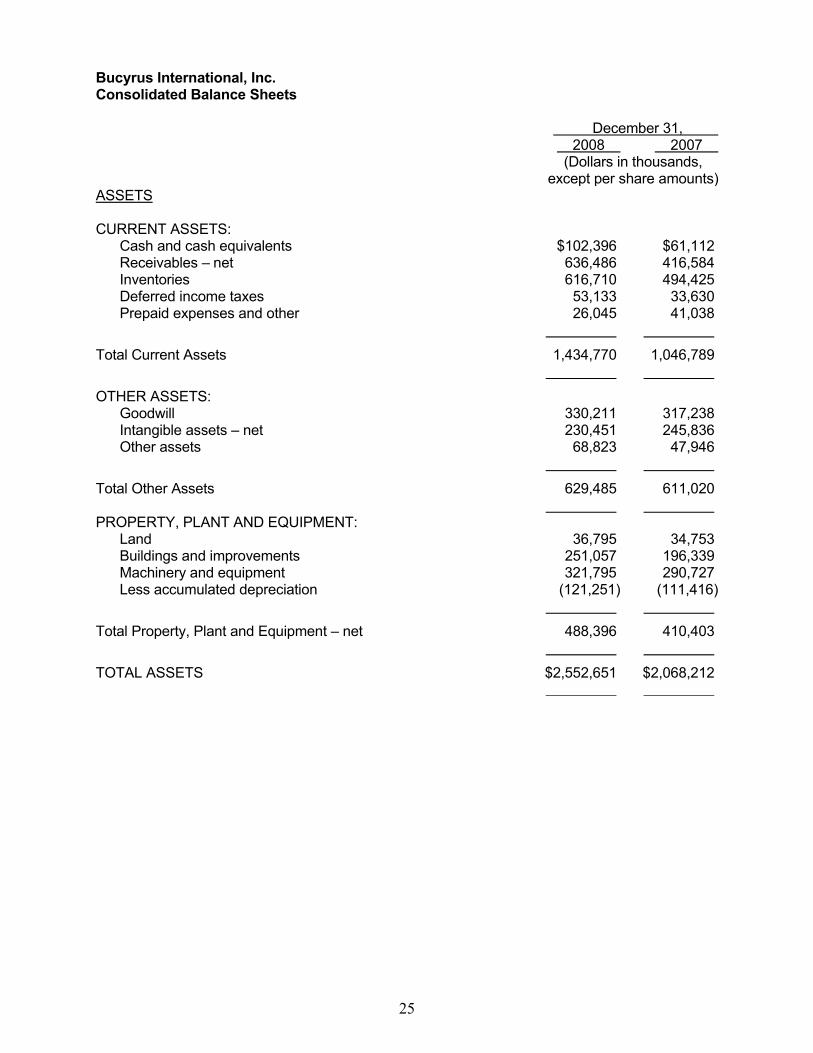
Bucyrus International, Inc. Consolidated Balance Sheets December 31, 2008 2007 (Dollars in thousands,
except per share amounts) ASSETS CURRENT ASSETS:
Cash and cash equivalents $102,396 $61,112 Receivables – net 636,486 416,584 Inventories 616,710 494,425 Deferred income taxes 53,133 33,630 Prepaid expenses and other 26,045
41,038
Total Current Assets 1,434,770
1,046,789
OTHER ASSETS:
Goodwill 330,211 317,238 Intangible assets – net 230,451 245,836 Other assets 68,823
47,946
Total Other Assets 629,485
611,020
PROPERTY, PLANT AND EQUIPMENT:
Land 36,795 34,753 Buildings and improvements 251,057 196,339 Machinery and equipment 321,795 290,727 Less accumulated depreciation (121,251)
(111,416)
Total Property, Plant and Equipment – net 488,396
410,403
TOTAL ASSETS $2,552,651
$2,068,212
26
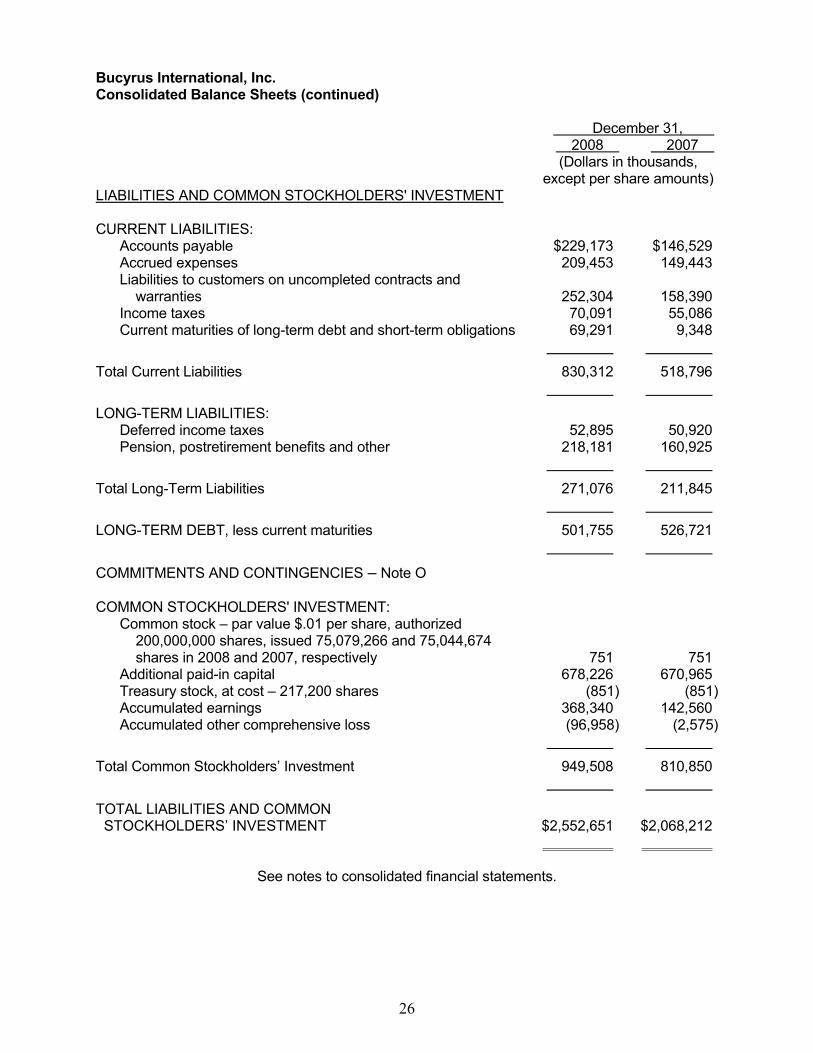
Bucyrus International, Inc. Consolidated Balance Sheets (continued)
December 31, 2008 2007 (Dollars in thousands,
except per share amounts) LIABILITIES AND COMMON STOCKHOLDERS' INVESTMENT CURRENT LIABILITIES:
Accounts payable $229,173 $146,529 Accrued expenses 209,453 149,443 Liabilities to customers on uncompleted contracts and
warranties
252,304
158,390 Income taxes 70,091 55,086 Current maturities of long-term debt and short-term obligations 69,291
9,348
Total Current Liabilities 830,312
518,796
LONG-TERM LIABILITIES:
Deferred income taxes 52,895 50,920 Pension, postretirement benefits and other 218,181
160,925
Total Long-Term Liabilities 271,076
211,845
LONG-TERM DEBT, less current maturities 501,755
526,721
COMMITMENTS AND CONTINGENCIES – Note O
COMMON STOCKHOLDERS' INVESTMENT:
Common stock – par value $.01 per share, authorized 200,000,000 shares, issued 75,079,266 and 75,044,674 shares in 2008 and 2007, respectively
751
751 Additional paid-in capital 678,226 670,965 Treasury stock, at cost – 217,200 shares (851) (851) Accumulated earnings 368,340 142,560 Accumulated other comprehensive loss (96,958)
(2,575)
Total Common Stockholders’ Investment 949,508
810,850
TOTAL LIABILITIES AND COMMON STOCKHOLDERS’ INVESTMENT
$2,552,651
$2,068,212
See notes to consolidated financial statements.
27
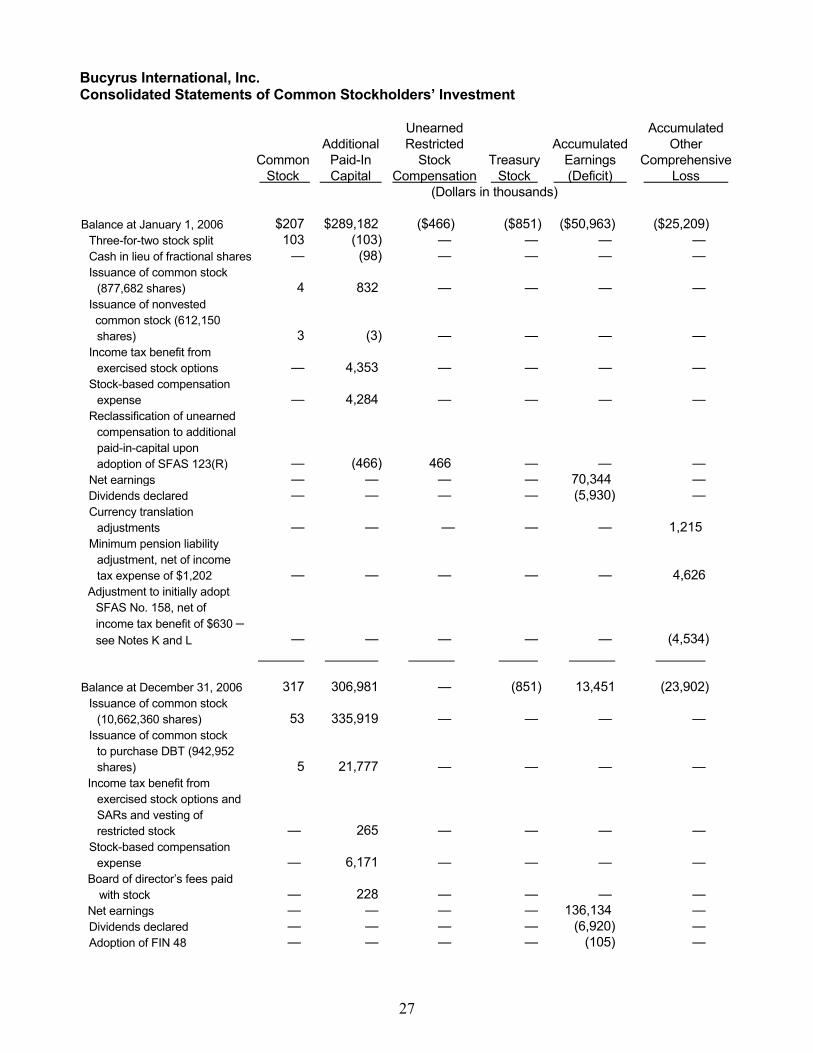
Bucyrus International, Inc. Consolidated Statements of Common Stockholders’ Investment
Common
Stock
Additional
Paid-In
Capital
Unearned
Restricted
Stock
Compensation
Treasury
Stock
Accumulated
Earnings
(Deficit)
Accumulated
Other
Comprehensive
Loss
(Dollars in thousands)
Balance at January 1, 2006 $207 $289,182 ($466) ($851) ($50,963) ($25,209)
Three-for-two stock split 103 (103) — — — —
Cash in lieu of fractional shares — (98) — — — —
Issuance of common stock
(877,682 shares)
4
832
—
—
—
—
Issuance of nonvested
common stock (612,150
shares)
3
(3)
—
—
—
—
Income tax benefit from
exercised stock options
—
4,353
—
—
—
—
Stock-based compensation
expense
—
4,284
—
—
—
—
Reclassification of unearned
compensation to additional
paid-in-capital upon
adoption of SFAS 123(R)
—
(466)
466
—
—
—
Net earnings — — — — 70,344 —
Dividends declared — — — — (5,930) —
Currency translation
adjustments
—
—
—
—
—
1,215
Minimum pension liability
adjustment, net of income
tax expense of $1,202
—
—
—
—
—
4,626
Adjustment to initially adopt
SFAS No. 158, net of
income tax benefit of $630 –
see Notes K and L
—
—
—
—
—
(4,534)
Balance at December 31, 2006
317
306,981
—
(851)
13,451
(23,902)
Issuance of common stock
(10,662,360 shares)
53
335,919
—
—
—
—
Issuance of common stock
to purchase DBT (942,952
shares)
5
21,777
—
—
—
—
Income tax benefit from
exercised stock options and
SARs and vesting of
restricted stock
—
265
—
—
—
—
Stock-based compensation
expense
—
6,171
—
—
—
—
Board of director’s fees paid
with stock
—
228
—
—
—
—
Net earnings — — — — 136,134 —
Dividends declared — — — — (6,920) —
Adoption of FIN 48 — — — — (105) —

28
Bucyrus International, Inc. Consolidated Statements of Common Stockholders’ Investment (continued)
Common
Stock
Additional
Paid-In
Capital
Unearned
Restricted
Stock
Compensation
Treasury
Stock
Accumulated
Earnings
(Deficit)
Accumulated
Other
Comprehensive
Loss
Currency translation
adjustments
—
—
—
—
—
$16,811
Change in pension and
postretirement cost, net of
income taxes of $5,811
—
—
—
—
—
12,034
Change in fair value of
derivative instruments, net of
income tax benefit of $5,073
—
—
—
—
—
(7,518)
Balance at December 31, 2007
$375
$671,341
—
($851)
$142,560
(2,575)
Issuance of common stock
under employee plans, net of
stock redeemed for taxes
(75,951 shares)
—
(1,298)
—
—
—
—
Two-for-one stock split 376 (376) — — — —
Income tax benefit from
exercised SARs and vesting
of restricted stock
—
1,322
—
—
—
—
Stock-based compensation
expense
—
7,056
—
—
—
—
Board of director’s fees paid
with stock
—
181
—
—
—
—
Net earnings — — — — 233,315 —
Dividends declared — — — — (7,535) —
Currency translation
adjustments
—
—
—
—
—
(43,351)
Change in pension and
postretirement cost, net of
income tax benefit of $15,759
—
—
—
—
—
(27,846)
Change in fair value of
derivative instruments, net of
income tax benefit of
$13,305
—
—
—
—
—
(23,186)
Balance at December 31, 2008
$751
$678,226
—
($851)
$368,340
($96,958)
See notes to consolidated financial statements.

29
Bucyrus International, Inc. Consolidated Statements of Cash Flows
Years Ended December 31, 2008 2007 2006
(Dollars in thousands) CASH FLOWS FROM OPERATING ACTIVITIES: Net earnings $233,315 $136,134 $70,344 Adjustments to reconcile net earnings to net cash
provided by operating activities:
Depreciation 36,860 25,438 12,892 Amortization 22,461 31,575 2,827 Stock compensation expense 7,056 6,171 4,284 Stock issued in payment of director’s fees 181 228 81 Deferred income taxes (3,069) (65,548) 275 Loss on disposal of property, plant and
equipment
159
532
140 Receipt of government grants for training
expenses
—
—
800
Changes in assets and liabilities, excluding effects of acquisitions:
Receivables (235,736) (19,519) (6,443) Inventories (147,629) (35,696) (42,433) Other current assets 14,119 (26,948) (8,840) Other assets (662) (42,267) (414) Current liabilities other than income taxes and
current maturities of long-term debt and short-term obligations
207,447
(62,210)
13,848 Income taxes 14,246 50,157 (1,171) Long-term liabilities other than deferred
income taxes
6,107
95,542
4,740
Net cash provided by operating activities 154,855
93,589
50,930
CASH FLOWS FROM INVESTING ACTIVITIES: Purchases of property, plant and equipment (112,013) (96,268) (71,306) Proceeds from sale of property, plant and equipment 5,581 1,923 517 Purchases of investments (5,978) — — Proceeds from sale of investments 6,486 — — Acquisition of DBT GmbH (1,276) (707,610) —
Other acquisitions (22,782) — — DBT GmbH acquisition closing adjustments for
liabilities assumed
—
26,549
—
Other 1,745
(58)
186
Net cash used in investing activities (128,237)
(775,464)
(70,603)

30
Bucyrus International, Inc. Consolidated Statements of Cash Flows (continued)
Years Ended December 31, 2008 2007 2006 (Dollars in thousands) CASH FLOWS FROM FINANCING ACTIVITIES: Net borrowings from (repayments of) revolving credit facilities
$40,027
($63,996)
$15,299
Proceeds from term loan facility — 825,000 —
Repayment of term loan facility (5,981) (326,267) —
Proceeds from other bank borrowings and long-term debt
9,445
3,481
150
Payments of other bank borrowings and long-term debt
(3,443)
(24,657)
(1,166)
Receipt of government grants for facilities expansion — — 2,000 Payment of financing expenses (528) (15,678) (268) Net proceeds from issuance of common stock — 336,289 756 Payments under capital lease agreements (3,188) — — Tax benefit related to share-based payment awards 1,322 265 4,353 Dividends paid (7,435) (6,868) (5,892) Payment in lieu of fractional shares – stock split — — (98) Other —
34
—
Net cash provided by financing activities 30,219
727,603
15,134
Effect of exchange rate changes on cash (15,553)
5,809
1,663
Net increase (decrease) in cash and cash equivalents
41,284
51,537
(2,876)
Cash and cash equivalents at beginning of year 61,112
9,575
12,451
Cash and cash equivalents at end of year $102,396
$61,112
$9,575
SUPPLEMENTAL DISCLOSURE OF CASH FLOW INFORMATION:
Cash paid during the year for: Interest $28,304 $23,818 $4,297 Income taxes - net of refunds $90,582 $39,305 $26,735
SUPPLEMENTAL DISCLOSURE OF NON-CASH INVESTING ACTIVITY:
Capital expenditures included in accounts payable
$7,416
$621
$3,047

31
Bucyrus International, Inc. Consolidated Statements of Cash Flows (continued)
SUPPLEMENTAL SCHEDULE OF NON-CASH INVESTING AND FINANCING ACTIVITIES:
On May 4, 2007, the Company purchased certain assets and assumed certain liabilities of
DBT GmbH and in 2008 two minor acquisitions were completed. In conjunction with these acquisitions, liabilities were assumed as follows:
2008 2007 (Dollars in thousands) Fair value of assets acquired $45,870 $1,303,989 Cash paid (22,782) (694,822) Fair value of Company common stock issued — (21,782) Acquisition expenses paid or accrued (640)
_______ (14,601)
_______ Liabilities assumed $22,448 $572,784
See notes to consolidated condensed financial statements.

32
Bucyrus International, Inc. Notes to Consolidated Financial Statements NOTE A – SUMMARY OF ACCOUNTING POLICIES Nature of Operations Bucyrus International, Inc. (the ―Company‖) is a Delaware corporation and a leading designer, manufacturer and marketer of high productivity mining equipment. The Company operates in two business segments: surface mining and underground mining. Major markets for the surface mining industry are copper, coal, oil sands and iron ore. The major market for the underground mining industry is coal. Most of the Company’s surface mining customers are large multinational corporations with operations in the various major surface mining markets throughout the world. Most of the Company’s underground mining customers are multinational coal mining corporations but tend to be smaller in size than its surface mining customers. The Company has more customers overall in its underground mining segment than in its surface mining segment. In addition to the manufacture of original equipment, an important part of the Company’s business consists of aftermarket sales, such as supplying parts, maintenance and repair services and technical advice, as well as refurbishing and relocating older, installed original equipment. The Company has manufacturing facilities in Australia, China, Germany, Poland and the United States and service and sales centers in Australia, Brazil, Canada, Chile, China, the Czech Republic, England, India, Mexico, Peru, Russia, South Africa and the United States. Use of Estimates The preparation of the consolidated financial statements in conformity with accounting principles generally accepted in the United States requires management to make estimates and assumptions that affect the reported amounts of assets and liabilities, disclosure of contingent assets and liabilities and the reported amounts of revenues and expenses. Actual results could differ from those estimates. Principles of Consolidation The consolidated financial statements include the accounts of all subsidiaries. All significant intercompany transactions, profits and accounts have been eliminated. Cash Equivalents All highly liquid investments with maturities of three months or less when purchased are considered to be cash equivalents. The carrying value of these investments approximates fair value. Inventories Inventories are stated at lower of cost (first-in, first-out method) or net realizable value. The cost of finished goods and work in progress includes the cost of raw materials, other direct costs and production overheads. Net realizable value is the estimate of the selling price in the ordinary course of business, less the cost of completion and selling. Provision is made to reduce the cost to net realizable value for obsolete and slow-moving inventories. Advances from customers are netted against inventories to the extent of related accumulated costs. Advances in excess of related costs and earnings on uncompleted contracts are classified as a liability to customers. Advances netted against inventory costs were $0.1 million and $3.3 million at December 31, 2008 and 2007, respectively.
33
Goodwill and Intangible Assets Goodwill and intangible assets are accounted for in accordance with Statement of Financial Accounting Standards (―SFAS‖) No. 142, "Goodwill and Other Intangible Assets" ("SFAS 142") (see Note E). Intangible assets consist primarily of technology, customer relationships, engineering drawings, trademarks, trade names and backlog. Property, Plant and Equipment Depreciation is provided over the estimated useful lives of respective assets using the straight-line method for financial reporting and accelerated methods for income tax purposes. Estimated useful lives used for financial reporting purposes range from 10 to 40 years for buildings and improvements and three to 17 years for machinery and equipment. Impairment of Long-Lived Assets The Company continually evaluates whether events and circumstances have occurred that indicate the remaining estimated useful lives of property, plant and equipment and intangible assets with finite lives may warrant revision or that the remaining balance of each may not be recoverable. The Company accounts for any impairment of long-lived assets in accordance with SFAS No. 144, ―Accounting for the Impairment or Disposal of Long-Lived Assets.‖ Financial Instruments Based on Company estimates, the carrying amounts of cash equivalents, receivables, accounts payable and accrued liabilities approximated fair value at December 31, 2008 and 2007. The fair value of the Company’s term loan was approximately $413.1 million at December 31, 2008. The carrying value of the term loan approximated fair value at December 31, 2007. Foreign Currency Translation The assets and liabilities of the Company’s foreign subsidiaries are translated into United States dollars using year-end exchange rates. Sales and expenses are translated at average rates during the year. Adjustments resulting from this translation are deferred and reflected as a separate component of Common Stockholders’ Investment. Gains and losses from foreign currency transactions are included in selling, general and administrative expenses in the Consolidated Statements of Earnings. Transaction losses totaled $3.5 million, $2.5 million and $1.0 million for the years ended December 31, 2008, 2007 and 2006, respectively. Transaction gains and losses on intercompany advances to foreign subsidiaries for which settlement is not planned or anticipated in the foreseeable future are deferred and reflected as a component of Common Stockholders’ Investment. Derivative Financial Instruments The Company enters into foreign currency forward contracts to reduce the exchange rate risk of specific foreign currency denominated transactions and manage and preserve the economic value of cash flows in non-functional currencies. The Company has designated substantially all of these contracts as either cash flow hedges or fair value hedges in accordance with SFAS No. 133, ―Accounting for Derivative Instruments and Hedging Activities‖ (―SFAS 133‖). The Company does not use derivative financial instruments for trading or other speculative purposes.
34
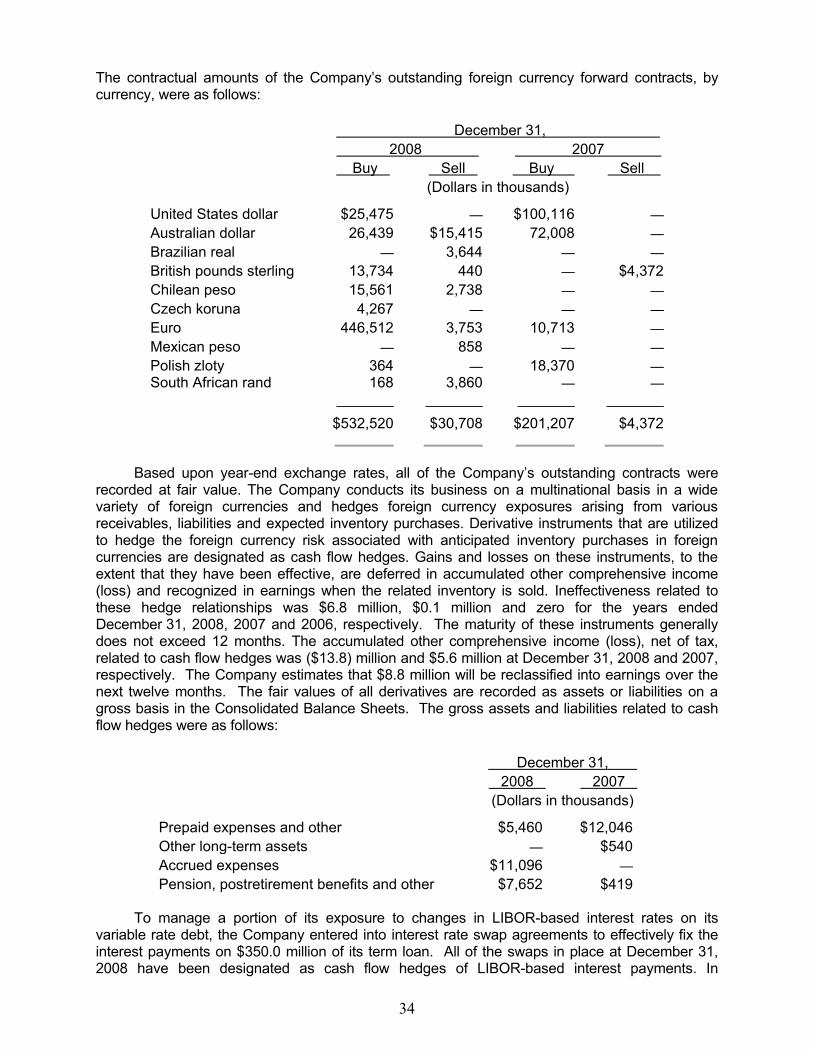
The contractual amounts of the Company’s outstanding foreign currency forward contracts, by currency, were as follows:
December 31,
2008 2007
Buy Sell Buy Sell
(Dollars in thousands)
United States dollar $25,475 — $100,116 —
Australian dollar 26,439 $15,415 72,008 —
Brazilian real — 3,644 — —
British pounds sterling 13,734 440 — $4,372
Chilean peso 15,561 2,738 — —
Czech koruna 4,267 — — —
Euro 446,512 3,753 10,713 —
Mexican peso — 858 — —
Polish zloty 364 — 18,370 — South African rand
168 _______
3,860 _______
—
_______ —
_______
$532,520
$30,708
$201,207
$4,372
Based upon year-end exchange rates, all of the Company’s outstanding contracts were recorded at fair value. The Company conducts its business on a multinational basis in a wide variety of foreign currencies and hedges foreign currency exposures arising from various receivables, liabilities and expected inventory purchases. Derivative instruments that are utilized to hedge the foreign currency risk associated with anticipated inventory purchases in foreign currencies are designated as cash flow hedges. Gains and losses on these instruments, to the extent that they have been effective, are deferred in accumulated other comprehensive income (loss) and recognized in earnings when the related inventory is sold. Ineffectiveness related to these hedge relationships was $6.8 million, $0.1 million and zero for the years ended December 31, 2008, 2007 and 2006, respectively. The maturity of these instruments generally does not exceed 12 months. The accumulated other comprehensive income (loss), net of tax, related to cash flow hedges was ($13.8) million and $5.6 million at December 31, 2008 and 2007, respectively. The Company estimates that $8.8 million will be reclassified into earnings over the next twelve months. The fair values of all derivatives are recorded as assets or liabilities on a gross basis in the Consolidated Balance Sheets. The gross assets and liabilities related to cash flow hedges were as follows:
December 31,
2008 2007
(Dollars in thousands)
Prepaid expenses and other $5,460 $12,046
Other long-term assets — $540
Accrued expenses $11,096 —
Pension, postretirement benefits and other $7,652 $419 To manage a portion of its exposure to changes in LIBOR-based interest rates on its variable rate debt, the Company entered into interest rate swap agreements to effectively fix the interest payments on $350.0 million of its term loan. All of the swaps in place at December 31, 2008 have been designated as cash flow hedges of LIBOR-based interest payments. In

35
accordance with SFAS 133, the effective portion of the change in fair value of the derivatives is recorded in accumulated other comprehensive income (loss), while any ineffective portion is recorded as an adjustment to interest expense. The differential paid or received on the interest rate swap is recognized as an adjustment to interest expense. Interest rate swaps in place at December 31, 2008 were as follows (dollars in thousands):
Interest
Amount Rate (1) Maturity Date
$150,000 4.8800% May 4, 2010 (2)
$50,000 5.0940% May 4, 2010
$50,000 2.1750% January 30, 2012
$50,000 2.4000% January 28, 2013
$50,000 2.5975% January 28, 2014
(1) Excludes applicable spread of 1.50%. (2) This swap, together with a $150 million interest rate swap entered into in 2007, which
was terminated in 2008, effectively fixes the interest rate at 4.88%.
The Company is exposed to loss if a counterparty defaults. As of December 31, 2008, the Company has no knowledge of any of counterparty default. The Company recognized $1.9 million, zero and zero of interest expense for the years ended December 31, 2008, 2007 and 2006, respectively, related to the ineffective portion of its interest rate swaps. The accumulated other comprehensive loss related to interest rate swaps was $7.1 million and $3.3 million at December 31, 2008 and 2007, respectively. The Company estimates that $2.5 million will be reclassified into earnings over the next 12 months which will adjust the interest rate on $150 million of the term loan to 4.88%. The gross assets and liabilities related to interest rate swaps were as follows:
December 31,
2008 2007
(Dollars in thousands)
Accrued expenses $13,191 $5,310 The Company also has cross-currency foreign currency-denominated debt obligations that are designated as hedges of the foreign currency exposure associated with its net investments in non-United States operations. The currency effects of the debt obligations are reflected in other comprehensive income (loss) where they offset translation gains and losses recorded on the Company’s net investments in Germany. The Company recognized a gain of $9.6 million and a loss of $4.6 million in other comprehensive income (loss) related to net investment hedges in 2008 and 2007, respectively. The Company also uses natural hedges to mitigate risks associated with foreign currency exposures. For example, oftentimes the Company has non-functional currency denominated receivables from customers for which the exposure is partially mitigated by a corresponding non-functional currency payable to a vendor.
36
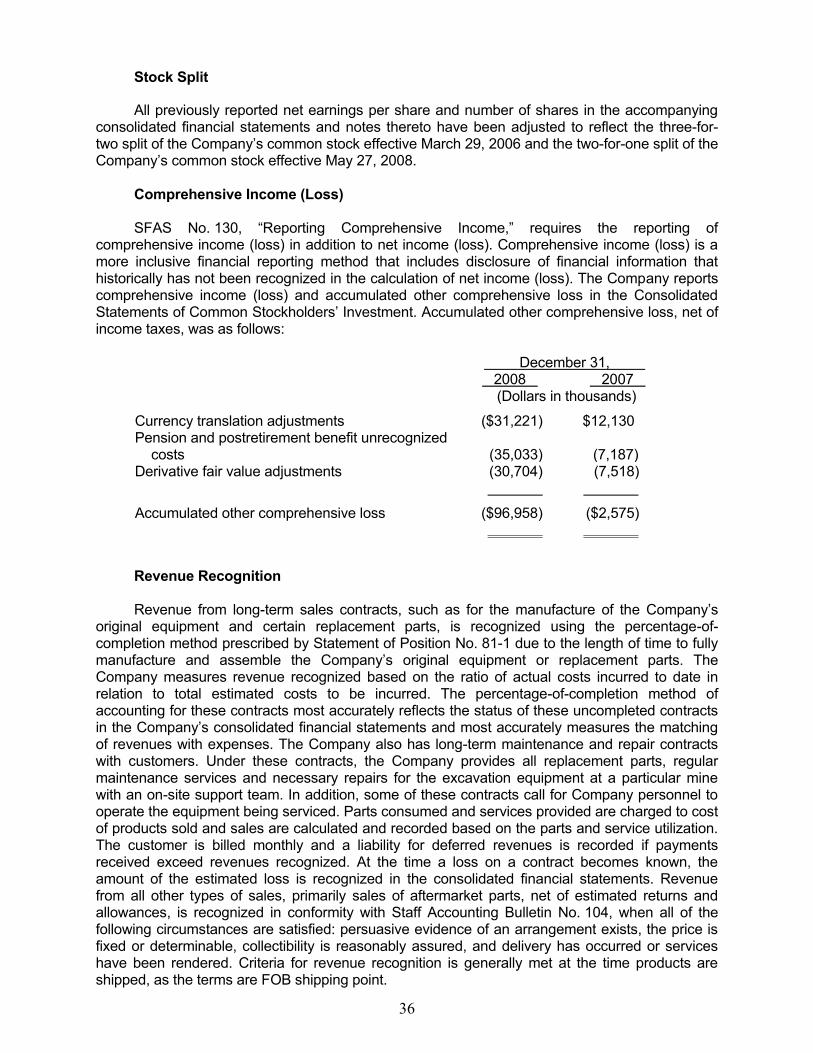
Stock Split All previously reported net earnings per share and number of shares in the accompanying consolidated financial statements and notes thereto have been adjusted to reflect the three-for-two split of the Company’s common stock effective March 29, 2006 and the two-for-one split of the Company’s common stock effective May 27, 2008. Comprehensive Income (Loss) SFAS No. 130, ―Reporting Comprehensive Income,‖ requires the reporting of comprehensive income (loss) in addition to net income (loss). Comprehensive income (loss) is a more inclusive financial reporting method that includes disclosure of financial information that historically has not been recognized in the calculation of net income (loss). The Company reports comprehensive income (loss) and accumulated other comprehensive loss in the Consolidated Statements of Common Stockholders’ Investment. Accumulated other comprehensive loss, net of income taxes, was as follows:
December 31, 2008 2007 (Dollars in thousands) Currency translation adjustments ($31,221) $12,130 Pension and postretirement benefit unrecognized
costs
(35,033)
(7,187) Derivative fair value adjustments (30,704)
(7,518)
Accumulated other comprehensive loss ($96,958)
($2,575)
Revenue Recognition Revenue from long-term sales contracts, such as for the manufacture of the Company’s original equipment and certain replacement parts, is recognized using the percentage-of-completion method prescribed by Statement of Position No. 81-1 due to the length of time to fully manufacture and assemble the Company’s original equipment or replacement parts. The Company measures revenue recognized based on the ratio of actual costs incurred to date in relation to total estimated costs to be incurred. The percentage-of-completion method of accounting for these contracts most accurately reflects the status of these uncompleted contracts in the Company’s consolidated financial statements and most accurately measures the matching of revenues with expenses. The Company also has long-term maintenance and repair contracts with customers. Under these contracts, the Company provides all replacement parts, regular maintenance services and necessary repairs for the excavation equipment at a particular mine with an on-site support team. In addition, some of these contracts call for Company personnel to operate the equipment being serviced. Parts consumed and services provided are charged to cost of products sold and sales are calculated and recorded based on the parts and service utilization. The customer is billed monthly and a liability for deferred revenues is recorded if payments received exceed revenues recognized. At the time a loss on a contract becomes known, the amount of the estimated loss is recognized in the consolidated financial statements. Revenue from all other types of sales, primarily sales of aftermarket parts, net of estimated returns and allowances, is recognized in conformity with Staff Accounting Bulletin No. 104, when all of the following circumstances are satisfied: persuasive evidence of an arrangement exists, the price is fixed or determinable, collectibility is reasonably assured, and delivery has occurred or services have been rendered. Criteria for revenue recognition is generally met at the time products are shipped, as the terms are FOB shipping point.
37
Included in the current portion of liabilities to customers on uncompleted contracts and warranties are advances in excess of related costs and earnings on uncompleted contracts of $202.2 million and $86.8 million at December 31, 2008 and 2007, respectively. Warranty Sales of the Company’s products generally carry typical manufacturers’ warranties, the majority of which cover products for one year, based on terms that are generally accepted in the marketplace. The Company records provisions for estimated warranty and other related costs as revenue is recognized based on historical warranty loss experience and periodically adjusts these provisions to reflect actual experience. Shipping and Handling Fees and Costs Revenue received from shipping and handling fees is reflected in sales. Shipping fee revenue was insignificant for all periods presented. Shipping and handling costs are included in cost of products sold. Income Taxes Deferred taxes are provided to reflect temporary differences between the financial and tax basis of assets and liabilities using presently enacted tax rates and laws. A valuation allowance is recognized if it is more likely than not that some or all of the deferred tax assets will not be realized. Stock–Based Compensation The Company accounts for stock-based compensation in accordance with SFAS No. 123 (revised 2004), ―Share-Based Payment‖ (―SFAS 123R‖), using the modified prospective application method.
Recent Accounting Pronouncements
On January 1, 2008, the Company adopted SFAS No. 157, ―Fair Value Measurements‖ (―SFAS 157‖), which establishes a framework for measuring fair value and expands disclosure about such fair value measurements. SFAS 157 defines fair value as the price that would be received to sell an asset or paid to transfer a liability in an orderly transaction between market participants at the measurement date. SFAS 157 classifies the inputs used to measure the fair value into the following hierarchy:
Level 1 Unadjusted quoted prices in active markets for identical assets or liabilities Level 2 Unadjusted quoted prices in active markets for similar assets or liabilities, or
Unadjusted quoted prices for identical or similar assets or liabilities in markets that are not active, or
Inputs other than quoted prices that are observable for the assets or liabilities Level 3 Unobservable inputs for the assets or liabilities

38
The Company has determined that its financial assets and liabilities are level 2 in the fair value hierarchy. The Company’s financial assets and liabilities that were accounted for at fair value at December 31, 2008 were as follows (dollars in thousands):
Assets: Foreign currency exchange contracts (1)
$5,541
Total assets at fair value
$5,541
Liabilities:
Foreign currency exchange contracts (1) $23,823 Interest rate swaps (2)
13,191
Total liabilities at fair value
$37,014
(1) Based on observable market transactions of forward currency prices. (2) Based on observable market transactions of forward LIBOR or EURIBOR rates.
In December 2007, the Financial Accounting Standards Board (―FASB‖) issued SFAS No. 141 (revised 2007), ―Business Combinations‖ (―SFAS 141(R)‖), which provides revised guidance on how acquirers recognize and measure the consideration transferred, assets acquired, liabilities assumed, noncontrolling interests, and goodwill acquired at their fair values as of that date. SFAS 141(R) is effective, on a prospective basis, for fiscal years beginning after December 15, 2008. The Company is currently evaluating the impact that the adoption of SFAS 141(R) will have on its consolidated financial statements. In March 2008, the FASB issued SFAS No. 161, ―Disclosures about Derivative Instruments and Hedging Activities – an amendment of FASB Statement No. 133‖ (―SFAS 161‖). SFAS 161 requires enhanced disclosures about an entity’s derivatives and hedging activity and how they effect an entity’s financial position. SFAS 161 is effective for fiscal years and interim periods beginning after November 15, 2008. The Company is currently evaluating the impact that the adoption of SFAS 161 will have on its consolidated financial statements. NOTE B – ACQUISITIONS DBT Acquisition On May 4, 2007, the Company completed its acquisition of DBT GmbH (―DBT‖) from RAG Coal International AG. Through the Company’s acquisition subsidiary, DBT Holdings GmbH, the Company acquired DBT for $730.8 million, which consisted of $694.8 million in cash, 942,952 shares of the Company’s common stock (as adjusted for the two-for-one stock split) with an initial market value of $21.8 million, calculated using the average per share closing price of the Company’s common stock from December 13, 2006 through December 20, 2006 (the reasonable period before and after the date the terms of the acquisition were agreed to and announced), and $14.2 million for expenses related to the acquisition The net assets acquired and results of operations since the date of acquisition are included in the Company’s consolidated financial statements.
The acquisition of DBT enabled the Company to expand its product portfolio to include underground mining equipment and aftermarket support for that equipment, which enhanced its capability to serve a larger segment of the global mining equipment market. The acquisition also increased the Company’s strategic presence in markets that it expects will experience

39
substantial mining growth over the next several years. These factors contributed to a purchase price resulting in the recognition of goodwill. This goodwill is not deductible for income tax purposes. The acquisition of DBT was accounted for under the purchase method of accounting in accordance with SFAS No. 141, ―Business Combinations‖ (―SFAS 141‖). Under purchase accounting, the total purchase price was allocated to the tangible and intangible assets and liabilities assumed based on their respective fair values as of the date of the DBT acquisition. Specifically, deferred tax liabilities were recognized based on the difference between the assigned values and the tax bases of the recognized assets acquired. The principles of purchase accounting require extensive use of accounting estimates and judgments to allocate the purchase price to the identifiable tangible and intangible assets acquired and liabilities assumed based on their respective fair values. The purchase price was determined as follows (dollars in thousands):
Cash $694,822 Issuance of common shares 21,782 Liabilities assumed 454,383 Deferred tax impact of purchase accounting
122,698
Acquisition expenses 14,177
Total purchase price $1,307,862
Major categories of liabilities assumed included liabilities to customers on uncompleted
contracts of $92.3 million, pension liabilities of $114.0 million, warranty liabilities of $74.8 million and trade accounts payable of $55.9 million.
The allocation of the purchase price was as follows (dollars in thousands):
Current assets $550,453 Property, plant and equipment 209,000 Intangible assets (including goodwill of $272,949) 519,949 Other long-term assets 28,460
Total purchase price allocation $1,307,862
Pro Forma Results of Operations The following unaudited pro forma results of operations assumes that the Company acquired DBT on January 1, 2006 and 2007 and includes the effects of the Company’s debt refinancing in 2007 and equity offering (see Note H). The unaudited pro forma results include adjustments to reflect additional interest expense, depreciation expense and amortization of intangibles, as well as the effects of adjustments made to the carrying value of certain assets.

40
Years Ended December 31, 2007 2006
(Dollar in thousands, except per share amounts)
Sales $1,973,904 $1,933,948
Net earnings $146,864 $113,687
Net earnings per share: Basic $1.98 $1.53 Diluted $1.96 $1.52
The unaudited pro forma financial information presented above is not necessarily indicative of either the results of operations that would have occurred had the acquisition of DBT been effective on January 1, 2006 and 2007 or of the Company’s future results of operations. Also, the unaudited pro forma financial information does not reflect the costs that the Company incurred to integrate DBT. These costs have not been material to date and the Company does not expect them to be material in the future. Finished parts and work in process inventories were adjusted to their estimated fair market value as required by SFAS 141. Finished parts were valued at their estimated selling prices, less the sum of (a) costs of disposal and (b) a reasonable profit allowance for the Company’s selling effort, and work in process was valued at estimated selling prices of finished goods less the sum of (a) costs to complete, (b) costs of disposal and (c) a reasonable profit allowance for the completing and selling effort of the Company based on profit for similar finished goods. As this inventory adjustment was directly attributed to the transaction and did not have a continuing impact, it is not reflected in the unaudited pro forma results of operations presented above. However, this inventory adjustment resulted in a charge to cost of products sold in the periods subsequent to the consummation of the acquisition of DBT during which the related inventories were sold. The actual charge for the year ended December 31, 2008 and December 31, 2007 was $12.1 million and $23.3 million, respectively. This inventory adjustment has been fully amortized as of December 31, 2008. Other Acquisitions In 2008, the Company completed two acquisitions. Based on the fair value of assets acquired and expected revenues, the Company concluded that they are not material in the aggregate. Consequently, the disclosures required by SFAS 141 are not required for these acquisitions. NOTE C – RECEIVABLES Receivables at December 31, 2008 and 2007 included $209.7 million and $161.6 million, respectively, of revenues from long-term contracts which were not billable at these dates. Billings on long-term contracts are made in accordance with the terms as defined in the individual contracts. The unbilled receivables are for contracts that were near completion as of the balance sheet dates and collection of amounts due was scheduled to be within the next 12 months of such dates. Current receivables were reduced by an allowance for losses of $8.4 million and $8.1 million at December 31, 2008 and 2007, respectively.

41
NOTE D – INVENTORIES Inventories consisted of the following:
December 31, 2008 2007
(Dollars in thousands)
Raw materials and parts $103,586 $113,244 Work in process 242,224 132,998 Finished products (primarily replacement parts) 270,900
248,183
$616,710
$494,425
NOTE E – GOODWILL AND INTANGIBLE ASSETS
In accordance with SFAS 142, goodwill is not subject to amortization, but instead is subject to an evaluation for impairment at least annually by applying a two-step fair-value-based test. Additionally, intangible assets with indefinite lives are not amortized, but are subject to an evaluation for impairment at least annually. Intangible assets with finite lives continue to be amortized over a period of five to 20 years. The Company’s annual impairment testing date is December 31. No impairment resulted from the Company’s annual impairment testing during 2008, 2007 or 2006. Intangible assets consisted of the following:
December 31, 2008 December 31, 2007 Weighted
Average Life
Gross Carrying Amount
Accumulated Amortization
Weighted Average Life
Gross Carrying Amount
Accumulated Amortization
(Years) (Dollars in thousands) (Years) (Dollars in thousands)
Amortized intangible assets:
Technology 10-12 $115,580 ($15,972) 12 $115,000 ($6,389) Customer
relationships
20
115,400
(9,333)
20
112,000
(3,733) Engineering
drawings
20
25,500
(14,369)
20
25,500
(13,094) Backlog 1 8,000 (8,000) 1 8,000 (5,333) Trademarks 0.7 12,000 (12,000) 0.7 12,000 (12,000) Other 5 - 20 5,855
(4,646)
5 - 20 5,855
(4,406)
$282,335
($64,320)
$278,355
($44,955)
Unamortized intangible assets:
Trademarks/Trade names
$12,436
$12,436

42
Changes in the carrying amount of goodwill were as follows:
Surface Mining
Underground Mining
(Dollars in thousands) Balance at January 1, 2007 $47,306 —
Goodwill acquired during the year — $269,932 Balance at December 31, 2007
47,306
269,932
Goodwill acquired during the year —
12,973
Balance at December 31, 2008 $47,306
$282,905
Amortization expense for finite-lived intangible assets was $19.4 million, $29.2 million and $1.8 million for the years ended December 31, 2008, 2007 and 2006, respectively. The estimated future amortization expense of finite-lived intangible assets is as follows (dollars in thousands):
Year Amount 2009 $16,829 2010 16,829 2011 16,829 2012 16,829 2013 16,829 Future
133,870
$218,015
NOTE F – ACCRUED EXPENSES Accrued expenses consisted of the following:
December 31, 2008 2007
(Dollars in thousands) Wages and salaries $61,880 $55,186 Other 147,573
94,257
$209,453
$149,443

43
NOTE G – LONG-TERM DEBT AND FINANCING ARRANGEMENTS Long-term debt consisted of the following:
December 31, 2008 2007
(Dollars in thousands) Revolving credit facility $55,157 $15,130 Term loan facility 497,658 509,184 Other 18,231
11,755
571,046 536,069 Less current maturities of long-term debt and short-term obligations
(69,291)
(9,348)
$501,755
$526,721
The Company’s credit facilities include a secured revolving credit facility of $357.5 million, an unsecured German revolving credit facility of €65.0 million, each of which mature on May 4, 2012, and a term loan facility of $400.0 million plus €75.0 million with a maturity date of May 4, 2014. The entire secured revolving credit facility may be used for letters of credit. The Company classified the entire revolving credit facility balance as current maturities of long-term debt and short-term obligations because it intends to repay the outstanding balance early in 2009. Borrowings under the secured revolving credit facility bear interest, payable no less frequently than quarterly, at (1) LIBOR plus between 1.25% and 1.75% (based on the Company’s total leverage ratio) for United States dollar denominated LIBOR loans, (2) a base rate determined by reference to the greater of the United States prime lending rate and the federal funds rate plus between 0.25% and 0.75% (based on the Company’s total leverage ratio) for United States dollar denominated base rate loans and (3) EURIBOR plus between 1.25% and 1.75% (based on the Company’s total leverage ratio) for euro denominated loans. The interest rates under the secured revolving credit facility are subject to change based on the Company’s total leverage ratio. The unsecured German revolving credit facility bears interest, payable no less frequently than quarterly, at EURIBOR plus 1.75%. Under each revolving credit facility, the Company has agreed to pay a commitment fee based on the unused portion of such facilities, payable quarterly, at rates ranging from 0.25% to 0.50% depending on the total leverage ratio, and when applicable, customary letter of credit fees. Borrowings under the term loan facility bear interest, payable no less frequently than quarterly, at (a) LIBOR plus 1.50% for United States dollar denominated LIBOR loans, (2) the base rate plus 0.50% for United States dollar denominated base rate loans and (3) EURIBOR plus 1.75% for euro denominated loans. At December 31, 2008, the Company had borrowings under its secured revolving credit facility of $55.2 million at a weighted average interest rate of 3.5%. The amount potentially available for borrowings under its secured revolving credit facility at December 31, 2008 was $176.5 million, after taking into account $125.8 million of issued letters of credit. The amount potentially available for borrowings under its unsecured German credit facility at December 31, 2008 was $58.4 million (€41.8 million), after taking into account $32.4 million (€23.2 million), of issued letters of credit. At December 31, 2008, the Company had borrowings under its term loan facility of $497.7 million ($395.0 million plus €74.1 million) at a weighted average interest rate of 5.2%. To manage a portion of its exposure to changes in LIBOR-based interest rates, the Company entered into five interest rate swap agreements that effectively fix the interest

44
payments on $350.0 million of outstanding borrowings under its term loan facility at a weighted average interest rate of 3.8%, plus the applicable spread. The Company’s obligations under its credit facilities are guaranteed, on a joint and several basis, by certain of its domestic subsidiaries. In addition, the Company’s obligations under its secured revolving credit facility and its term loan facility are secured by a security interest in substantially all of its consolidated tangible and intangible domestic assets (subject to certain exceptions), as well as 100% of the outstanding capital stock of its domestic subsidiaries and 65% of the voting stock and 100% of the non-voting stock of certain of its first-tier foreign subsidiaries. The Company’s credit facilities contain operating and financial covenants that, among other things, could limit the Company’s ability to obtain additional sources of capital. The financial covenants require the Company to maintain a total leverage ratio, calculated on a trailing four-quarters basis, of not more than 4.0 to 1.0 through the end of the quarter ending December 31, 2008 and not more than 3.5 to 1.0 for each measurement period thereafter. The total leverage ratio is calculated as the ratio of consolidated indebtedness (which is net of cash) to consolidated operating profit (which excludes, among other things, certain non-cash charges, as discussed more fully in the credit facilities). At December 31, 2008, the Company was in compliance with all covenants and other requirements under its credit facilities. For the year ended December 31, 2008, the average revolving credit facility borrowings under the Company’s credit agreements were $17.9 million at a weighted average interest rate of 3.9% and the maximum borrowing outstanding was $101.0 million. For the year ended December 31, 2007, the average borrowings under the revolving portion of the Company’s credit agreement 2007 were $48.3 million at a weighted average interest rate of 6.6% and the maximum borrowing outstanding was $114.5 million. At December 31, 2008 and 2007, there were $218.3 million and $176.1 million, respectively, of standby letters of credit outstanding under all of the Company’s bank facilities.
Maturities of long-term debt and short-term obligations for each of the next five years are as follows (dollars in thousands):
Year Amount 2009 $69,291 2010 $6,408 2011 $6,302 2012 $5,910 2013 $5,467
NOTE H – COMMON STOCKHOLDERS' INVESTMENT On April 24, 2008, the Company’s stockholders approved an amendment to the Company’s Amended and Restated Certificate of Incorporation to eliminate all references to Class B common stock and rename the Company’s Class A common stock as ―common stock‖. On April 30, 2008, the Company’s stockholders approved an amendment to the Company’s Amended and Restated Certificate of Incorporation increasing the number of authorized shares of common stock from 75 million to 200 million. Also on April 30, 2008, the Company announced a two-for-one split of its common stock in the form of a 100% stock dividend. The stock dividend was paid on May 27, 2008 to stockholders of record on May 13, 2008 and the Company’s common stock began trading on a split-adjusted basis on May 28, 2008. All previously reported net earnings per share and number of shares in the

45
accompanying consolidated financial statements and notes thereto have been adjusted to reflect this stock split. At December 31, 2008, the Company’s issued and outstanding shares consist only of common stock. Holders of common stock are entitled to one vote per share on all matters to be voted on by the Company’s common stockholders. On August 2, 2007, the Company’s Board of Directors declared a dividend of one preferred share purchase right (a ―Right‖) for each outstanding share of the Company’s common stock. The dividend was payable upon the close of business on September 3, 2007 to the stockholders of record upon the close of business on August 16, 2007. In connection with the May 2008 two-for-one split of the Company’s common stock, the Company’s Board of Directors resolved, in accordance with the terms of the Rights Agreement, that each share of the Company’s common stock will trade with one-half Right (rather than one full Right). Each Right entitles the registered holder to purchase one one-hundredth of a share of Series A Junior Participating Preferred Stock at a price of $200.00 per one one-hundredth of a share, subject to adjustment. The Rights are not exercisable unless certain change in control events occur, such as a person or group acquiring or obtaining the right to acquire beneficial ownership of 15% or more of the Company’s outstanding common stock. The Rights will expire on August 2, 2017 unless the Rights are earlier redeemed or exchanged by the Company in accordance with the terms of the Rights Agreement. On May 15, 2007, the Company sold 10,612,200 shares of its common stock in an underwritten public offering at a price to the public of $33.18 per share, from which it received net proceeds of $336.1 million. The Company used the net proceeds from this equity offering to repay a portion of its new term loan facility used to initially finance the acquisition of DBT. NOTE I – STOCK-BASED COMPENSATION
At December 31, 2008, the Company had 4,183,391 shares of its common stock available for awards under the Bucyrus International, Inc. Omnibus Incentive Plan 2007 (―2007 Plan‖) (formerly the Bucyrus International, Inc. 2004 Equity Incentive Plan). The 2007 Plan expires on the tenth anniversary of its effective date, unless terminated earlier by the Company’s Board of Directors. The 2007 Plan provides for the grant of equity based awards, including restricted (or nonvested) stock, restricted stock units, stock options, stock appreciation rights (―SARs‖), and other equity based awards to the Company’s directors, officers, and other employees, advisors and consultants and those of the Company’s subsidiaries who are selected by the Compensation Committee of the Company’s Board of Directors for participation in the 2007 Plan. Also as of December 31, 2008, the Company had 492,000 shares of its common stock available for future grants under the 1998 Management Stock Option Plan. The Compensation Committee of the Company’s Board of Directors determines all of the terms and conditions of awards under the plan, including whether the vesting or payment of an award will be subject to the attainment of performance goals. The Company recognizes compensation expense for nonvested shares, SAR’s and stock options over the requisite service period for vesting of the award. Total stock-based compensation expense included in the Company’s Consolidated Statements of Earnings was $7.1 million, $6.2 million and $4.3 million for the years ended December 31, 2008, 2007 and 2006, respectively. Nonvested Shares – The Company granted nonvested shares to certain employees in 2008, 2007 and 2006. The nonvested shares granted in 2008 fully cliff vest on December 31, 2011 and the nonvested shares granted in 2007 fully cliff vest on December 31, 2010. The nonvested shares granted in 2006 fully cliff vest on December 31, 2009, although the vesting period may be accelerated based on the attainment of certain defined annual financial goals of

46
the Company. The Company did attain these goals for the years ended December 31, 2008, 2007 and 2006 and 25% of the shares fully vested in each of those years. Compensation expense related to nonvested shares was $2.8 million, $2.7 million and $2.1 million for the years ended December 31, 2008, 2007 and 2006, respectively. Nonvested share activity was as follows: 2008 2007 2006
Number of
Shares
Weighted Average
Grant Date Fair Value
Number
of Shares
Weighted Average
Grant Date Fair Value
Number
of Shares
Weighted Average
Grant Date Fair Value
Nonvested at January 1
391,262
$21.46
396,300
$20.20
68,400
$10.00
Granted 58,100 $50.66 90,050 $27.45 437,100 $21.37 Forfeited (12,100) $29.25 (1,200) $34.19 (97,800) $19.50 Vested (230,574)
_______ $19.32 (93,888)
_______ $21.72 (11,400)
_______ $10.00
Nonvested at December 31
206,688
$31.59
391,262
$21.46
396,300
$20.20
At December 31, 2008, there was $4.7 million of unrecognized compensation expense related to nonvested share grants. This cost is expected to be recognized over a weighted-average period of 1.9 years. The grant date fair value was based on the fair market value of the Company’s common stock on the date of grant. At December 31, 2008, the Company expects approximately 188,000 shares to vest and these shares had an aggregate intrinsic value of $3.5 million and a weighted-average remaining contractual term of 1.8 years. The total fair value of shares vested during 2008, 2007 and 2006 was $8.4 million, $4.4 million and $0.3 million, respectively. Premium Nonvested Shares – In 2006, the Company granted premium nonvested shares to certain employees. These shares partially vest if specific performance levels are attained by the Company. Any premium nonvested shares credited to employees will fully cliff vest on December 31, 2009, provided the employee remains employed by the Company until such date. The Company did attain the specific performance levels for the years ended December 31, 2008, 2007 and 2006, which has resulted in the partial vesting of 75% of the premium nonvested shares. Compensation expense related to premium nonvested shares was $0.5 million, $0.6 million and $0.5 million for the years ended December 31, 2008, 2007 and 2006, respectively.

47
Premium nonvested share activity was as follows: 2008 2007 2006
Number of
Shares
Weighted Average
Grant Date Fair Value
Number
of Shares
Weighted Average
Grant Date Fair Value
Number
of Shares
Weighted Average
Grant Date Fair Value
Nonvested at January 1
187,774
$21.72
175,050
$21.54
—
—
Granted — — 12,724 $24.23 218,550 $21.37
Forfeited (9,276) $23.89 — — (43,500) $20.68
Vested —
______ — —
______ — —
______ —
Nonvested at December 31
178,498
$21.61
187,774
$21.72
175,050
$21.54
At December 31, 2008, there was $0.5 million of unrecognized compensation expense related to premium nonvested share grants. This cost is expected to be recognized in 2009. The grant date fair value was based on the fair market value of the Company’s common stock on the date of grant. At December 31, 2008, the Company expected 178,498 shares to vest and these shares had an aggregate intrinsic value of $3.3 million and a weighted-average remaining contractual life of one year. SARs – The Company granted SARs to certain employees in 2008, 2007 and 2006. The SARs vest incrementally and can be settled in shares only. Compensation expense related to SAR’s granted to certain employees in 2008, 2007 and 2006 was $3.8 million, $2.9 million and $1.7 million for the years ended December 31, 2008, 2007 and 2006, respectively. SAR activity was as follows: 2008 2007 2006
Number of
Shares
Weighted Average
Grant Date Fair Value
Number
of Shares
Weighted Average
Grant Date Fair Value
Number
of Shares
Weighted Average
Grant Date Fair Value
Outstanding at
January 1
1,004,950
$11.59
700,200
$10.68 —
— Granted 277,150 $23.51 316,300 $13.68 874,200 $10.60 Forfeited (40,680) $14.64 (4,800) $16.79 (174,000) $10.26 Exercised (33,880)
________ $12.35 (6,750)
________ $11.93 —
________
—
Outstanding at December 31
1,207,540
$14.20
1,004,950
$11.59
700,200
$10.68
Vested and exercisable at December 31
407,565
$11.72
68,360
$10.65
—
—

48
At December 31, 2008, there was $7.8 million of unrecognized compensation expense related to SARs that are vested or expect to vest. This cost is expected to be recognized over a weighted-average period of 2.3 years. The grant date fair value of the SARs was calculated using the Black-Sholes pricing model. The assumptions used in this model were as follows:
2008 2007 2006 Risk-free interest rate 3.49% 4.66% 4.37% Expected volatility 42.00% 42.00% 43.25% Expected life 6.5 years 7 years 7 years Dividend yield .19% .41% .43%
The risk-free interest rate was based on the United States Government Treasury strips rate on the date of grant and with a maturity equal to the expected life of the SARs. The expected stock price volatility was based on the historical activity of the Company’s common stock. The expected life was calculated using the simplified method for ―plain-vanilla‖ issuances. The expected dividend yield was based on the annual dividends that have been paid on the Company’s common stock. At December 31, 2008, the Company expected approximately 1,122,000 of the outstanding SARs to vest and these SARs had no intrinsic value and a weighted-average remaining contractual life of 7.8 years
Stock Options – There was no compensation expense related to stock options for the years ended December 31, 2008, 2007 and 2006. Stock option activity was as follows: 2008 2007 2006
Options
Weighted Average
Grant Date Fair Value
Options
Weighted Average
Grant Date Fair Value
Options
Weighted Average
Grant Date Fair Value
Options outstanding at January 1
—
—
19,200
$8.33
893,172
$1.87
Options granted — — — — — —
Options forfeited — — — — — —
Options exercised — ______
— (19,200) _______
$8.33 (873,972) _______
$1.73
Options outstanding at December 31
—
—
—
—
19,200
$8.33
Options exercisable at December 31
—
—
—
—
19,200
$8.33
Net cash proceeds from the exercise of stock options was $0.1 million and $0.8 million for the years ended December 31, 2007 and 2006, respectively. The income tax benefit realized from these exercises was $0.1 million and $4.4 million for the years ended December 31, 2007 and 2006, respectively.
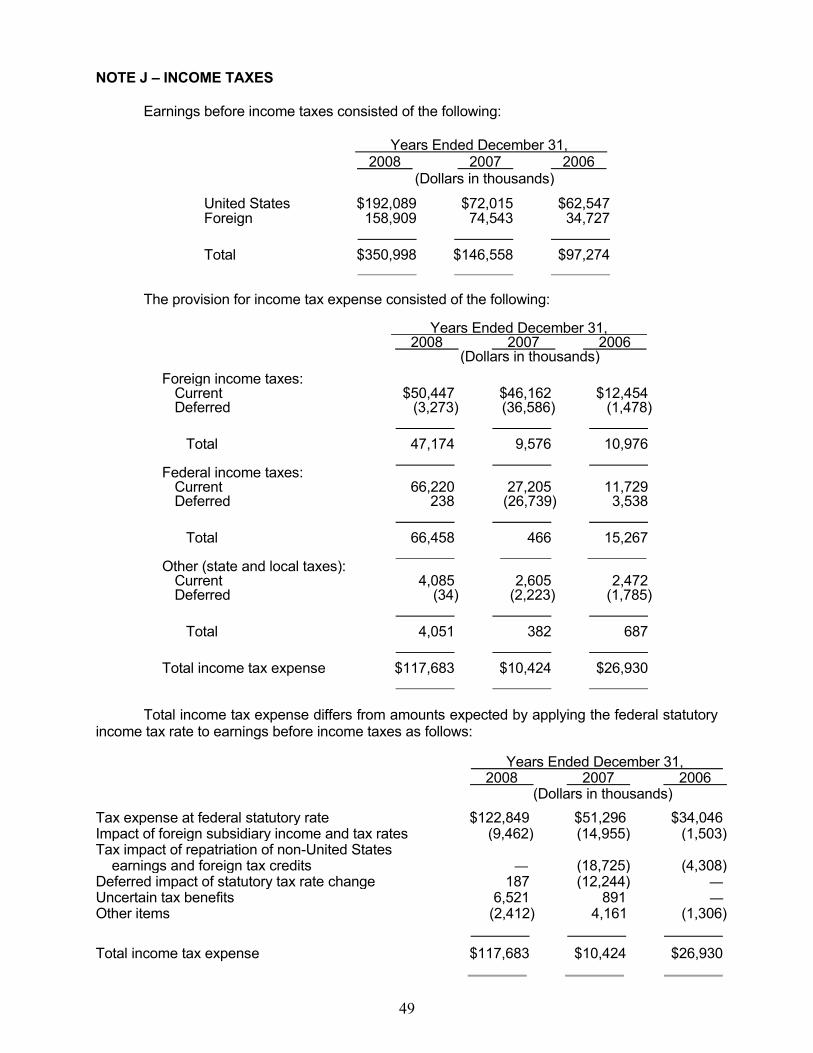
49
NOTE J – INCOME TAXES Earnings before income taxes consisted of the following:
Years Ended December 31, 2008 2007 2006
(Dollars in thousands)
United States $192,089 $72,015 $62,547 Foreign 158,909
74,543
34,727
Total $350,998
$146,558
$97,274
The provision for income tax expense consisted of the following:
Years Ended December 31, 2008 2007 2006
(Dollars in thousands)
Foreign income taxes: Current $50,447 $46,162 $12,454 Deferred (3,273)
(36,586)
(1,478)
Total 47,174
9,576
10,976
Federal income taxes:
Current 66,220 27,205 11,729 Deferred 238
(26,739)
3,538
Total 66,458
466
15,267
Other (state and local taxes):
Current 4,085 2,605 2,472 Deferred (34)
(2,223)
(1,785)
Total 4,051
382
687
Total income tax expense $117,683
$10,424
$26,930
Total income tax expense differs from amounts expected by applying the federal statutory income tax rate to earnings before income taxes as follows:
Years Ended December 31, 2008 2007 2006
(Dollars in thousands) Tax expense at federal statutory rate $122,849 $51,296 $34,046 Impact of foreign subsidiary income and tax rates (9,462) (14,955) (1,503) Tax impact of repatriation of non-United States
earnings and foreign tax credits
—
(18,725)
(4,308) Deferred impact of statutory tax rate change 187 (12,244) — Uncertain tax benefits 6,521 891 —
Other items (2,412)
4,161
(1,306)
Total income tax expense
$117,683
$10,424
$26,930

50
Significant components of deferred tax assets and deferred tax liabilities were as follows:
December 31, 2008 2007
(Dollars in thousands) Deferred tax assets:
Postretirement benefits $6,991 $6,637 Pension benefits 27,791 27,600 Accrued and other liabilities 19,482 14,291 Tax loss carry forward 11,340 15,895 Foreign tax credit carry forward 18,108 26,029 Unrealized losses on foreign currency and
derivative financial instruments
20,075
—
Other items 5,658
4,503
109,445 94,955
Less valuation allowance (7,163)
(9,959)
Total deferred tax assets 102,282
84,996
Deferred tax liabilities: Excess of book basis over tax basis of property,
plant and equipment and intangible assets
(104,359)
(110,497) Unrealized gains on foreign currency and derivative
financial instruments
—
(5,073) Contract related expenses (7,439)
(6,618)
Total deferred tax liabilities (111,798)
(122,188)
Net deferred tax liability ($9,516)
($37,192)
The classification of the net deferred tax liability was as follows:
December 31, 2008 2007
(Dollars in thousands) Current deferred tax assets $53,133 $33,630 Long-term deferred tax assets 13,227 3,498 Current deferred tax liabilities (22,981) (23,400) Long-term deferred tax liabilities (52,895)
(50,920)
Net deferred tax liability ($9,516)
($37,192)
The long-term deferred tax asset is included in other assets and the current deferred tax liability is included in income taxes in the Consolidated Balance Sheets.

51
A valuation allowance must be used to reduce the net deferred tax assets to an amount that is more likely than not to be realized. Currently, the Company has valuation allowances established for United States state net operating loss (―NOL‖) carryforwards and United Kingdom deferred tax assets. A summary of the valuation allowance was as follows:
Balance at Beginning of Year
Additions -Allowance
Established
Deductions - Allowance
Reversal
Balance at End of Year
(Dollars in thousands)
Year ended December 31, 2006 $3,711 — $944 $2,767 Year ended December 31, 2007 $2,767 $7,550 $358 $9,959 Year ended December 31, 2008 $9,959 — $2,796 $7,163 At December 31, 2008, the Company had $40.0 million of state NOL carryforwards, which expire in the years 2009 through 2019, available to offset future state taxable income in various states. Cumulative undistributed earnings of foreign subsidiaries that are considered to be permanently reinvested and on which United States income taxes have not been provided by the Company amounted to approximately $269.0 million at December 31, 2008. It is not practicable to estimate the amount of additional tax which would be payable upon repatriation of such earnings; however, due to foreign tax credit limitations, higher effective United States income tax rates and foreign withholding taxes, additional taxes could be incurred. The Company adopted FASB Interpretation No. 48, ―Accounting for Uncertainty in Income Taxes‖ (―FIN 48‖), on January 1, 2007. As a result of the implementation of FIN 48, the Company recognized a net decrease to accumulated earnings of $0.1 million.
Changes in unrecognized tax benefits were as follows:
2008 2007 (Dollars in thousands) Balance at January 1 $1,574 $721 Gross increases related to prior period tax positions 10,970 — Gross increases related to current period tax positions 5,368 643 Gross increases related to prior period of acquired companies 203 46 Foreign currency translation (138)
164
Balance at December 31 $17,977
$1,574
On January 1, 2007, subsequent to the adoption of FIN 48, the Company had a reserve of $0.7 million for unrecognized tax benefits, $0.3 million of which would impact its effective tax rate if recognized. At December 31, 2008, the Company had $18.0 million of unrecognized tax benefits, $4.9 million of which would impact its effective tax rate if recognized. At December 31, 2007, the Company had $1.6 million of unrecognized tax benefits, $1.1 million of which would impact its effective tax rate if recognized. The Company reasonably estimates that the gross amount of unrecognized tax benefits for prior period tax positions will decrease by approximately $2.6 million in the next 12 months due to the close of an open tax year. The estimated decrease in the reserve relates primarily to uncertain tax positions concerning intercompany transactions. However, the Company cannot reasonably estimate the change in the reserve for unrecognized tax benefits due to tax positions expected to be taken during 2009.

52
The Company recognizes interest and/or penalties related to income tax matters as a component of income tax expense. During the years ended December 31, 2008 and December 31, 2007, the Company recognized expense for interest and penalties of approximately $2.8 million and $0.1 million, respectively. The Company has provided for approximately $3.1 million and $0.4 million of accrued interest and penalties related to unrecognized tax benefits at December 31, 2008 and 2007, respectively. The Company or one of its subsidiaries files income tax returns in the United States federal jurisdiction and in various state and foreign jurisdictions. Open tax years related to United States state jurisdictions remain subject to examination but are not considered material. The Company is subject to income tax examinations by tax authorities in the major jurisdictions as follows:
Tax Jurisdiction Years Open to Audit United States Federal 1990, 1991, 1992,
2005, 2006, 2007, 2008
Australia 2004 through 2008 Brazil 2004 through 2008 Canada 1998 through 2008 Chile 2006 through 2008 Germany 2004 through 2008 South Africa 2006 through 2008
NOTE K – PENSION AND RETIREMENT PLANS
The Company has several pension and retirement plans covering certain of its employees in the United States and Europe. All plans have a measurement date of December 31. The Bucyrus International, Inc. Supplemental Executive Retirement Plan (―SERP‖) provides an allocation to the Company’s senior management equal to the amount that cannot be allocated to such employees under the Company’s cash balance pension plan due to the Internal Revenue Service-imposed annual compensation limits. Benefits are to be paid under the SERP upon the employee’s separation from service in a lump sum or in five or 10 annual installments, as the participating employee elects. The Company adopted SFAS No. 158, ―Employers’ Accounting for Defined Benefit Pension and Other Postretirement Plans - an amendment of FASB Statements No. 87, 88, 106, and 132(R)‖ (―SFAS 158‖), on December 31, 2006. SFAS 158 requires companies to recognize the funded status of a defined benefit postretirement plan (other than a multiemployer plan) as an asset or liability in its balance sheet and to recognize changes in that funded status in the year in which the changes occur through comprehensive income. SFAS 158 also requires an employer to measure the funded status of a plan as of the date of its year-end balance sheet.

53
The Company’s defined benefit pension and retirement plans' funded status and amounts recognized in the consolidated financial statements at December 31, 2008 and 2007 was as follows:
United States Plans Non-United States Plans 2008 2007 2008 2007 (Dollars in thousands)
Change in projected benefit obligation: Projected benefit obligation at January 1 $95,277 $96,808 $113,213 — Acquired projected benefit obligation — — — $117,182 Service cost 5,105 2,595 523 764 Interest cost 5,774 5,415 6,082 3,507 Plan amendments 1,308 158 — —
Actuarial loss (gain) 6,757 (3,224) (4,787) (12,882) Benefits paid (6,658) (6,475) (4,994) (3,544) Currency translation —
—
(4,958)
8,186
Projected benefit obligation at December 31 107,563
95,277
105,079
113,213
Change in plan assets: Fair value of plan assets at January 1 77,975 70,584 — — Actual return on plan assets (26,750) 3,472 — — Employer contributions 14,201 10,394 4,994 3,544 Benefits paid (6,658)
(6,475)
(4,994)
(3,544)
Fair value of plan assets at December 31 58,768
77,975
—
—
Unfunded status at December 31 ($48,795)
($17,302)
($105,079)
($113,213)
Amounts recognized in the consolidated balance sheets at December 31:
Accrued expenses — — ($6,810) ($6,759) Pension, postretirement benefits and other ($48,795)
($17,302)
(98,269)
(106,454)
($48,795)
($17,302)
($105,079)
($113,213)
Amounts recognized in accumulated other
comprehensive loss at December 31:
Net loss (gain), net of income tax (benefit) expense of ($22,982), ($8,482), $4,079 and $4,303, respectively
$39,219
$14,473
($8,667)
($9,144) Prior service cost, net of income tax benefit
of $1,698, $1,387, $0 and $0, respectively
2,898
2,365
—
—
Net amount recognized $42,117
$16,838
($8,667)
($9,144)
United States Plans Non-United States Plans 2008 2007 2008 2007 (Dollars in thousands) Weighted-average assumptions used to determine benefit obligations at December 31:
Discount rate 6.20% 6.25% 6.20% 5.5% Rate of compensation increase 4% 4% 2% 1.75%

54
The accumulated benefit obligation for all defined benefit pension plans was $210.0 million and $205.6 million at December 31, 2008 and 2007, respectively. Pension plans with an accumulated benefit obligation in excess of plan assets were as follows:
United States Plans Non-United States Plans December 31, December 31, 2008 2007 2008 2007 (Dollars in thousands) Projected benefit obligation $107,563 $95,277 $105,079 $113,213 Accumulated benefit obligation $105,758 $93,615 $104,217 $111,978 Fair value of plan assets $58,768 $77,975 — —
The components of net periodic benefit cost and other amounts recognized in other comprehensive income (loss) were as follows: United States Plans Non-United States Plans 2008 2007 2006 2008 2007 (Dollars in thousands) Net periodic benefit cost:
Service cost $5,104 $2,595 $2,531 $523 $764 Interest cost 5,774 5,415 5,220 6,082 3,507 Expected return on plan assets (6,887) (6,169) (5,198) — — Amortization of prior service cost 464 452 452 — — Amortization of net actuarial loss
(gain)
1,148
1,253
1,700
(160)
—
Net periodic benefit cost 5,603
3,546
4,705
6,445
4,271
Other changes in plan assets and benefit obligations recognized in other comprehensive income (loss):
Net loss (gain) 24,745 (1,122) 15,595 477 (9,144) Net prior service cost 534
(186)
2,551
—
—
Total recognized in other
comprehensive income (loss)
25,279
(1,308)
18,146
477
(9,144)
Total recognized in net periodic
benefit cost and other comprehensive income (loss)
$30,882
$2,238
$22,851
$6,922
($4,873)
Weighted-average assumptions used to determine net periodic benefit cost for the year:
Discount rate 6.25% 5.75% 5.50% 5.50% 4.5% Expected return on plan assets
8.50% 8.50% 8.50% — —
Rate of compensation increase
4% 4% 4% 2% 1.75%

55
In selecting the expected long-term rate of return on assets, the Company considered the average rate of earnings expected on the classes of funds invested or to be invested to provide for the benefits of these plans. This included considering the trusts' targeted asset allocation for the year and the expected returns likely to be earned over the next 20 years. The assumptions used for the return of each asset class are conservative when compared to long-term historical returns. The Company's pension plans' weighted-average actual and targeted asset allocations by asset category at December 31, 2008 and 2007 were as follows:
United States Plans December 31, 2008 December 31, 2007
Actual Target Actual Target
Asset category: Equity securities 61% 65% 64% 65% Debt securities 39%
35%
36%
35%
Total 100%
100%
100%
100%
The desired investment objective is a long-term real rate of return on assets that is approximately 6% greater than the assumed rate of inflation measured by the Consumer Price Index, currently assumed to be approximately 2.5%. The target rate of return for the plans has been based upon an analysis of historical returns supplemented with an economic and structural review of each asset class. The Benefit Plan Committee of the Company realizes that market performance varies and that a 6% real rate of return may not be meaningful during some periods. The Benefit Plan Committee also realizes that historical performance is no guarantee of future performance. To achieve these goals, the minimum and maximum allocation ranges for fixed securities and equity securities are as follows:
United States Plans Minimum Maximum
Equity 61% 69% Fixed 31% 39% Cash equivalents 0% 4%
Investment in international oriented equity funds is limited to a maximum of 18.25% of the equity range. The Company expects to contribute $9.7 million to its domestic pension plans and $6.8 million to its non-United States pension plans in 2009. Upon completion of an analysis of the funded status of the Company’s domestic pension plans, additional contributions may be made in 2009.

56
Estimated future benefit payments from the Company’s pension plans are as follows:
United States Plans
Non-United States Plans
(Dollars in thousands) 2009 $7,431 $6,810 2010 $9,200 $6,932 2011 $8,140 $7,159 2012 $9,244 $7,341 2013 $10,162 $7,484 2014-2018 $58,724 $38,428
The estimated net loss and prior service cost for the United States defined benefit pension plans that will be amortized from accumulated other comprehensive loss into net periodic benefit cost in 2009 are $4.2 million and $0.6 million, respectively. The estimated net gain for the non-United States defined benefit pension plans that will be amortized from accumulated other comprehensive loss into net periodic benefit cost in 2009 is $0.5 million The Company has 401(k) Savings Plans available to substantially all United States employees. Matching employer contributions are made in accordance with plan provisions subject to certain limitations. Matching employer contributions made were $3.9 million, $3.1 million and $1.5 million in 2008, 2007 and 2006, respectively. NOTE L – POSTRETIREMENT BENEFITS OTHER THAN PENSIONS The Company provides certain health care benefits to age 65 and life insurance benefits for certain eligible retired United States employees. Substantially all current employees may become eligible for those benefits if they reach early retirement age while working for the Company. The measurement date is December 31. The Company’s postretirement benefits other than pensions funded status and amounts recognized in the consolidated financial statements at December 31, 2008 and 2007 was as follows:
2008 2007 (Dollars in thousands)
Change in benefit obligation: Benefit obligation at January 1 $17,367 $18,674 Service cost 783 1,049 Interest cost 978 966 Plan participants' contributions 95 129 Plan amendments 82 —
Net actuarial gain (loss) 319 (2,747) Benefits paid (468)
(704)
Benefit obligation at December 31 19,156
17,367
Change in plan assets:
Fair value of plan assets at January 1 — —
Employer contributions 373 575 Plan participants' contributions 95 129 Benefits paid (468)
(704)

57
2008 2007 (Dollars in thousands)
Fair value of plan assets at December 31 —
—
Unfunded status at December 31 ($19,156)
($17,367)
Amounts recognized in the consolidated balance sheets at December 31:
Current benefit liability ($1,360) ($1,360) Long-term benefit liability (17,796)
(16,007)
Net amount recognized ($19,156)
($17,367)
2008 2007
(Dollars in thousands) Amounts recognized in accumulated other comprehensive
loss at December 31:
Net loss, net of income tax benefit of $254 and $106, respectively
$433 $233
Prior service credit, net of income tax expense of $311 and $433, respectively
(531)
(740)
Net amount recognized ($98)
($507)
Weighted-average assumptions used to determine benefit
obligations at December 31: Discount rate
6.10%
6.25% The components of net periodic benefit cost and other amounts recognized in other comprehensive income (loss) were as follows:
Years Ended December 31, 2008 2007 2006
(Dollars in thousands)
Net periodic benefit cost: Service cost $783 $1,049 $1,020 Interest cost 978 965 978 Amortization of prior service cost (249) (249) (249) Amortization of net actuarial loss —
12
175
Net periodic benefit cost
1,512
1,777
1,924
Other changes in benefit obligations
recognized in other comprehensive income (loss):
Net loss (gain) 200 (1,739) 1,972 Net prior service cost 209
157
(897)

58
Years Ended December 31, 2008 2007 2006
(Dollars in thousands) Total recognized in other comprehensive
income (loss)
409
(1,582)
1,075
Total recognized in net periodic benefit cost and other comprehensive income (loss)
$1,921
$195
$2,999
Weighted average assumptions used to
determine net periodic benefit cost: Discount rate
6.25%
5.75%
5.50% Assumed health care cost trend rates:
Health care cost trend rate assumed for next year
7%
5%
6%
Rate to which the cost trend rate is assumed to decline
5%
5%
5%
Year that the rate reaches the ultimate trend rate
2017
2008
2008
Assumed health care cost trend rates have a significant effect on the amounts reported for the Company’s health care plan. A one percentage point change in the assumed health care cost trend rates would have the following effects: One Percentage Point
Increase One Percentage Point Decrease
(Dollars in thousands) Effect on total of service and interest cost $164 ($143) Effect on postretirement benefit obligation $1,542 ($1,367)
The Company expects to contribute approximately $1.4 million for the payment of benefits from its postretirement benefit plan in 2009. Estimated future benefit payments from the Company’s postretirement benefit plan are as follows (dollars in thousands):
Year Amount 2009 $1,360 2010 $1,249 2011 $1,458 2012 $1,591 2013 $1,773 2014-2018 $11,181
The estimated prior service cost that will be amortized from accumulated other comprehensive income (loss) into net periodic benefit cost over the next fiscal year is $0.2 million. NOTE M – CALCULATION OF NET EARNINGS PER SHARE OF COMMON STOCK Basic net earnings per share of common stock was computed by dividing net earnings by the weighted average number of shares of common stock outstanding. Diluted net earnings per share of common stock was computed by dividing net earnings by the weighted average number of shares of common stock outstanding after giving effect to dilutive securities. The reconciliation

59
of the numerators and the denominators of the basic and diluted net earnings per share of common stock calculations for the years ended December 31, 2008, 2007 and 2006 was as follows:
Years Ended December 31, 2008 2007 2006 (Dollars in thousands) Net earnings $233,315
$136,134
$ 70,344
Weighted average shares outstanding
74,350,939
70,014,440
62,529,160
Basic net earnings per share
$3.14
$1.94
$1.12
Weighted average shares outstanding
74,350,939
70,014,440
62,529,160
Effect of dilutive stock options, nonvested shares, stock appreciation rights and performance shares (1)
854,081
700,900
550,362
Weighted average shares outstanding – diluted
75,205,020
70,715,340
63,079,522
Diluted net earnings per share
$3.10
$1.93
$1.12
(1) Nonvested shares and stock appreciation rights with grant date fair values and exercise
prices higher than the Company’s average stock price were excluded from the computation of diluted net earnings per share.
NOTE N – SEGMENT AND GEOGRAPHICAL INFORMATION The Company has two reportable segments, surface mining and underground mining, which are based on the internal organization used by management for making operating decisions, measuring and evaluating financial performance, allocating resources, and based on the similarity of customers served, distinctive products and services, common use of facilities and economic results attained. Prior to the acquisition of DBT in 2007, all of the Company’s operations were in surface mining and were classified as one operating segment. As a result, disclosures of segment information for 2006 are not presented since the Company’s underground mining segment did not exist prior to the acquisition of DBT on May 4, 2007.
The accounting policies of the Company’s segments are the same as those described in Note A. The operating earnings of each segment do not include interest income, interest expense, other income and expense and a provision for income taxes. Corporate expenses consist primarily of costs related to employees who provide services across both of the Company’s segments. There are no significant intersegment sales. Identifiable assets are those used in the operations of each segment.

60
Segment information for the years ended December 31, 2008 and 2007 was as follows:
Year Ended December 31, 2008
Sales
Operating Earnings
Depreciation and
Amortization Capital
Expenditures Total
Assets (Dollars in thousands) Surface mining $1,282,519 $252,713 $20,505 $90,406 $1,139,029 Underground mining 1,223,319
158,778
35,745
28,402
1,413,622
Total operations 2,505,838 411,491 56,250 118,808 2,552,651 Corporate __
(28,860)
__
__
__
Consolidated total $2,505,838
382,631
56,250 $118,808
$2,552,651
Interest income
(6,206) __
Interest expense 34,768 __
Other expense 3,071
3,071
Earnings before income taxes $350,998
$59,321
Year Ended December 31, 2007
Sales
Operating Earnings
Depreciation and
Amortization Capital
Expenditures Total
Assets (Dollars in thousands) Surface mining $927,101 $165,238 $16,829 $81,169 $781,123 Underground mining 686,290
18,269
37,790
15,712
1,287,089
Total operations 1,613,391 183,507 54,619 96,881 2,068,212 Corporate __
(10,360)
__
__
__
Consolidated total $1,613,391
173,147
54,619 $96,881
$2,068,212
Interest income
(3,523) __
Interest expense 27,718 __
Other expense (2,394)
2,394
Earnings before income taxes $146,558
$57,013

61
Sales information for the years ended December 31, 2008, 2007 and 2006 was as follows:
Years Ended December 31, 2008 2007 2006
(Dollars in thousands) Surface Mining:
Original equipment $622,904 $398,662 $255,739 Aftermarket parts and
service 659,615 _________
528,439
_________
482,311
________ 1,282,519
_________ 927,101
_________ 738,050
________ Underground Mining: Original equipment 737,554 448,252 __
Aftermarket parts and service
485,765
_________
238,038
_________
__
________ 1,223,319
_________ 686,290
_________
__
_________
Total:
Original equipment 1,360,458 846,914 255,739 Aftermarket parts and
service
1,145,380 _________
766,477 _________
482,311 _______
$2,505,838
$1,613,391
$738,050
Financial information by geographical area for the years ended December 31, 2008, 2007
and 2006 is set forth in the following table. In the case of sales to external customers, the sales amounts presented represent the sales originating in the respective geographic area.
Sales to External Customers
Long – Lived Assets
(Dollars in thousands) 2008 United States $1,206,094 $299,867 Africa 109,981 2,762 Australia 286,419 39,891 Chile 142,602 4,324 Canada 102,529 11,058 Germany 536,773 95,226 Other foreign 121,440
35,268
$2,505,838
$488,396

62
Sales to
External Customers Long – Lived Assets
(Dollars in thousands) 2007 United States $760,027 $226,476 Africa 69,381 4,207 Australia 300,743 48,847 Chile 108,522 4,262 Canada 55,807 7,431 Germany 226,079 94,171 Other foreign 92,832
25,009
$1,613,391
$410,403
2006 United States $379,794 $112,651 Africa 36,527 950 Australia 118,896 443 Chile 96,344 3,570 Canada 50,158 5,984 Other foreign 56,331
1,551
$738,050
$125,149
The Company does not consider itself to be dependent upon any single customer or group of customers; however, on an annual basis a single customer may account for a large percentage of its sales, particularly original equipment sales. In 2008 and 2007, no one customer accounted for more than 10% of the Company’s consolidated sales. In 2006, one customer accounted for approximately 13% of the Company’s consolidated sales. NOTE O – COMMITMENTS, CONTINGENCIES, CREDIT RISKS AND CONCENTRATIONS Environmental The Company's operations and properties are subject to a broad range of federal, state, local and foreign laws and regulations relating to environmental matters, including laws and regulations governing discharges into the air and water, the handling and disposal of solid and hazardous substances and wastes, and the remediation of contamination associated with releases of hazardous substances at the Company's facilities and at off-site disposal locations. These laws are complex, change frequently and have tended to become more stringent over time. Future events, such as required compliance with more stringent laws or regulations, more vigorous enforcement policies of regulatory agencies or stricter or different interpretations of existing laws, could require additional expenditures by the Company, which may be material. Environmental problems have not interfered in any material respect with the Company's manufacturing operations to date. The Company believes that its compliance with statutory requirements respecting environmental quality will not have a materially adverse effect on its financial position, results of operations or cash flows, although no assurance to that effect can be given. The Company has an ongoing program to address potential environmental problems.

63
Certain environmental laws, such as the Federal Comprehensive Environmental Response, Compensation and Liability Act (―CERCLA‖), provide for strict, joint and several liability for investigation and remediation of spills and other releases of hazardous substances. Such laws may apply to conditions at properties currently or formerly owned or operated by an entity or its predecessors, as well as to conditions at properties at which wastes or other contamination attributable to an entity or its predecessors come to be located. The Company has previously been named as a potentially responsible party under CERCLA and analogous state laws at other sites throughout the United States. The Company believes it has determined its remediation liabilities with respect to the sites discussed above and does not believe that any such remaining liabilities, if any, either individually or in the aggregate, will have a material adverse effect on its financial position, results of operations or cash flows, although no assurance to that effect can be given. The Company may incur additional liabilities with respect to these sites in the future, the costs of which could be material, and may incur remediation liability in the future with respect to sites formerly or currently owned or operated by the Company or with respect to off-site disposal locations, the costs of which could be material. Over the past three years, expenditures for ongoing compliance, remediation, monitoring and cleanup have been immaterial. While no assurance can be given, the Company believes that expenditures for compliance and remediation will not have a material adverse effect on its financial position, results of operations or cash flows, although no assurance to that effect can be given. Product Warranty
The Company recognizes the cost associated with its warranty policies on its products as revenue is recognized. The amount recognized is based on historical experience. The following is a reconciliation of the changes in accrued warranty costs for the years ended December 31, 2008 and 2007 was as follows:
2008 2007 (Dollars in thousands)
Balance at January 1 $70,909 $5,788 Acquired balance 675 74,803 Provision 6,756 9,001 Charges (20,211) (22,943) Currency translation (4,543)
______ 4,260
______ Balance at December 31 $53,586
$70,909
Product Liability
The Company is subject to numerous product liability claims, many of which relate to products no longer manufactured by the Company or its subsidiaries, and other claims arising in the ordinary course of business in federal and state courts. Such claims are generally related to property damage and to personal injury. The Company’s products are operated by its employees and its customers’ employees and independent contractors at various work sites in the United States and abroad. In the United States, workers’ claims against employers related to workplace injuries are generally limited by state workers’ compensation statutes, but such limitations do not apply to equipment suppliers. The Company has insurance covering most of these claims and has various limits of liability depending on the insurance policy year in question. At the time a liability associated with a claim becomes probable and can be reasonably estimated, the Company accrues for the liability by a charge to earnings. For all other cases, an estimate of the

64
costs associated with the matters cannot be made due to the inherent uncertainties in the litigation process; however, the Company believes that the final resolution of these claims and other similar claims which are likely to arise in the future will not individually or in the aggregate have a material effect on its financial position, results of operations or cash flows, although no assurance to that effect can be given.
Asbestos Liability
The Company has been named as a co-defendant in numerous personal injury liability cases alleging damages due to exposure to asbestos and other substances. The Company has insurance covering most of these cases and has various limits of liability depending on the insurance policy year in question. At the time a liability associated with a case becomes probable and can be reasonably estimated, the Company accrues for the liability by a charge to earnings. For all other cases, an estimate of the costs associated with the matters cannot be made due to the inherent uncertainties in the litigation process; however, the Company does not believe that these costs will have a material effect on its financial position, results of operations or cash flows, although no assurance to that effect can be given. The reconciliation of claims pending at December 31, 2008 and 2007 was as follows:
2008 2007 Number of claims pending at January 1 299 290 New claims filed 30 29 Claims dismissed, settled or resolved (20)
(20)
Number of claims pending at December 31 309
299
The average claim settlement amount was immaterial in both years. Other Litigation
The Company is involved in various other litigation arising in the normal course of business. The Company does not believe that its recovery or liability, if any, under any such pending litigation will have a material effect on the its financial position, results of operations or cash flows, although no assurance to that effect can be given.
Commitments
The Company has obligations under various operating leases and rental and service agreements. The expense relating to these agreements was $26.1 million in 2008, $17.0 million in 2007 and $10.1 million in 2006. Future minimum annual payments under non-cancelable agreements are as follows (dollars in thousands):
Year Amount 2009 $13,648 2010 8,675 2011 6,425 2012 3,653 2013 2,928 After 2013 13,380
$48,709

65
In addition, at December 31, 2008, the Company had contractual obligations of $9.6 million with respect to the third phase of its multi-phase expansion and additional renovations at its South Milwaukee, Wisconsin facility. Credit Risks A significant portion of the Company's sales are to customers whose activities are related to the coal, copper, oil sands and iron ore mining industries, including some who are located in foreign countries. The Company generally extends credit to these customers and, therefore, collection of receivables may be affected by the mining industry economy and the economic conditions in the countries where the customers are located. However, the Company closely monitors extension of credit and has not experienced significant credit losses. Also, most foreign sales are made to large, well-established companies. The Company generally requires letters of credit on foreign sales to smaller companies.
Concentrations The Company currently purchases alternating current drives and other electrical parts, an important component of its equipment, from Siemens Energy & Automation, Inc. ("Siemens"). The loss of Siemens, the Company's only critical sole source supplier, could cause a delay in manufacturing and a possible loss of sales, which could have a material adverse effect on the Company's financial position, results of operations or cash flows. NOTE P – QUARTERLY RESULTS (UNAUDITED) Certain unaudited quarterly financial results for the years ended December 31, 2008 and 2007 were as follows:
Quarters Ended at End of March June September December (Dollars in thousands, except per share amounts)
Sales: 2008 $516,981 $621,008 $646,002 $721,847 2007 $190,361 $374,801 $500,278 $547,951
Gross profit: 2008 $141,585 $174,096 $182,331 $184,491 2007 $52,078 $96,297 $123,628 $136,322
Net earnings: 2008 $41,081 $62,317 $64,167 $65,750 2007 (1) $17,863 $27,762 $28,602 $61,907
Basic net earnings per common share:
2008 $.55 $.84 $.86 $.88 2007 $.29 $.40 $.39 $.83

66
Quarters Ended at End of
March June September December (Dollars in thousands, except per share amounts)
Weighted average shares outstanding-basic (in thousands):
2008 74,340 74,343 74,340 74,386 2007 62,661 68,749 74,229 74,244
Diluted net earnings per common share:
2008 $.55 $.83 $.85 $.88 2007 $.28 $.40 $.38 $.82
Weighted average shares outstanding-diluted (in thousands):
2008 72,205 75,272 75,266 75,065 2007 63,216 69,407 74,971 75,307
Dividends per common share: 2008 $.025 $.025 $.025 $.025 2007 $.025 $.025 $.025 $.025
(1) Net earnings for the quarter ended December 31, 2007 included a $12.2 million deferred
tax benefit resulting from a reduction in the German statutory tax rate and an $18.7 million foreign tax credit benefit resulting from repatriation of non-United States earnings.
67
REPORT OF INDEPENDENT REGISTERED PUBLIC ACCOUNTING FIRM To the Board of Directors and Stockholders of Bucyrus International, Inc.: We have audited the accompanying consolidated balance sheets of Bucyrus International, Inc. and subsidiaries (the "Company") as of December 31, 2008 and 2007, and the related consolidated statements of earnings, comprehensive income, common stockholders’ investment, and cash flows for each of the three years in the period ended December 31, 2008. We also have audited the Company's internal control over financial reporting as of December 31, 2008, based on criteria established in Internal Control — Integrated Framework issued by the Committee of Sponsoring Organizations of the Treadway Commission. The Company's management is responsible for these financial statements, for maintaining effective internal control over financial reporting, and for its assessment of the effectiveness of internal control over financial reporting, included in the accompanying Management’s Report on Internal Control over Financial Reporting. Our responsibility is to express an opinion on these financial statements and an opinion on the Company's internal control over financial reporting based on our audits. We conducted our audits in accordance with the standards of the Public Company Accounting Oversight Board (United States). Those standards require that we plan and perform the audit to obtain reasonable assurance about whether the financial statements are free of material misstatement and whether effective internal control over financial reporting was maintained in all material respects. Our audits of the financial statements included examining, on a test basis, evidence supporting the amounts and disclosures in the financial statements, assessing the accounting principles used and significant estimates made by management, and evaluating the overall financial statement presentation. Our audit of internal control over financial reporting included obtaining an understanding of internal control over financial reporting, assessing the risk that a material weakness exists, and testing and evaluating the design and operating effectiveness of internal control based on the assessed risk. Our audits also included performing such other procedures as we considered necessary in the circumstances. We believe that our audits provide a reasonable basis for our opinions. A company's internal control over financial reporting is a process designed by, or under the supervision of, the company's principal executive and principal financial officers, or persons performing similar functions, and effected by the company's board of directors, management, and other personnel to provide reasonable assurance regarding the reliability of financial reporting and the preparation of financial statements for external purposes in accordance with generally accepted accounting principles. A company's internal control over financial reporting includes those policies and procedures that (1) pertain to the maintenance of records that, in reasonable detail, accurately and fairly reflect the transactions and dispositions of the assets of the company; (2) provide reasonable assurance that transactions are recorded as necessary to permit preparation of financial statements in accordance with generally accepted accounting principles, and that receipts and expenditures of the company are being made only in accordance with authorizations of management and directors of the company; and (3) provide reasonable assurance regarding prevention or timely detection of unauthorized acquisition, use, or disposition of the company's assets that could have a material effect on the financial statements. Because of the inherent limitations of internal control over financial reporting, including the possibility of collusion or improper management override of controls, material misstatements due to error or fraud may not be prevented or detected on a timely basis. Also, projections of any evaluation of the effectiveness of the internal control over financial reporting to future

68
periods are subject to the risk that the controls may become inadequate because of changes in conditions, or that the degree of compliance with the policies or procedures may deteriorate. As described in Note J to the consolidated financial statements, on January 1, 2007, the Company adopted FASB Interpretation No. 48 ―Accounting for Uncertainty in Income Taxes – an Interpretation of FASB Statement No. 109.‖ In our opinion, the consolidated financial statements referred to above present fairly, in all material respects, the financial position of Bucyrus International, Inc. and subsidiaries as of December 31, 2008 and 2007, and the results of their operations and their cash flows for each of the three years in the period ended December 31, 2008, in conformity with accounting principles generally accepted in the United States of America. Also, in our opinion, the Company maintained, in all material respects, effective internal control over financial reporting as of December 31, 2008, based on the criteria established in Internal Control — Integrated Framework issued by the Committee of Sponsoring Organizations of the Treadway Commission. /s/ Deloitte & Touche LLP Milwaukee, Wisconsin March 2, 2009

69
MANAGEMENT’S REPORT ON INTERNAL CONTROL OVER FINANCIAL REPORTING To the Board of Directors and Stockholders of Bucyrus International, Inc.:
The management of Bucyrus International, Inc. and subsidiaries (the ―Company‖) is responsible for establishing and maintaining adequate internal control over financial reporting, as such term is defined in Rule 13a-15(f) of the Securities and Exchange Act of 1934. The Company’s internal control over financial reporting is designed to provide reasonable assurance regarding the reliability of financial reporting and the preparation of published financial statements in accordance with generally accepted accounting principles.
The Company’s management, with the participation of the Company’s Chief Executive Officer and Chief Financial Officer and Secretary, assessed the effectiveness of the Company’s internal control over financial reporting based on the criteria established in ―Internal Control-Integrated Framework‖ issued by the Committee of Sponsoring Organizations of the Treadway Commission. Based on this assessment, the Company’s management has concluded that, as of December 31, 2008, the Company’s internal control over financial reporting was effective based on those criteria.
Because of its inherent limitations, internal control over financial reporting may not prevent
or detect misstatements. Also, projections of any evaluation of the effectiveness to future periods are subject to the risk that the controls may become inadequate because of changes in conditions, or that the degree of compliance with the policies or procedures may deteriorate.
The Company’s independent registered public accounting firm has issued an audit report on the effectiveness of the Company’s internal control over financial reporting as of December 31, 2008, which is included herein. /s/ Timothy W. Sullivan President and Chief Executive Officer March 2, 2009 /s/ Craig R. Mackus Chief Financial Officer and Secretary March 2, 2009

70
This page intentionally blank.

71
Bucyrus International, Inc. Management Discussion & Analysis
and Other Financial Information

72
SELECTED CONSOLIDATED FINANCIAL DATA (1)
2008 2007 2006 2005 2004 (Dollars in thousands, except per share amounts) Statement of Earnings Data:
Sales $2,505,838 $1,613,391 $738,050 $575,042 $454,186 Net earnings $233,315 $136,134 $70,344 $53,559 $6,084 Net earnings per share of common stock (2) :
Basic $3.14 $1.94 $1.12 $0.88 $0.13 Diluted $3.10 $1.93 $1.12 $0.86 $0.13
Cash dividends declared per common
share
$.10
$.10
$.0942
$.0765
$.0192 Balance Sheet Data:
Total assets $2,552,651 $2,068,212 $600,712 $491,967 $392,809 Long-term liabilities, including long-term debt
$772,831
$738,566
$134,450
$115,799
$148,852
(1) The financial data presented above includes the results of operations for our
underground mining segment subsequent to May 4, 2007, the date we acquired DBT
GmbH.
(2) Previously reported net earnings per share have been adjusted to reflect the three-for-
two and two-for-one split of our common stock in 2006 and 2008, respectively.

73
MANAGEMENT'S DISCUSSION AND ANALYSIS
OF FINANCIAL CONDITION AND RESULTS OF OPERATIONS
Overview The following discussion and analysis and information contained elsewhere in this report contain statements that constitute ―forward-looking statements‖ within the meaning of the Private Securities Litigation Reform Act of 1995. These forward-looking statements may be identified by the use of predictive, future tense or forward looking terminology, such as ―believes,‖ ―anticipates,‖ ―expects,‖ ―estimates,‖ ―intends,‖ ―may,‖ ―will‖ or similar terms. We caution that any such forward-looking statements are not guarantees of our future performance and involve significant risks and uncertainties, and that actual results may differ materially from those contained in the forward-looking statements as a result of various factors, which are more fully described in our 2008 Form 10-K filed with the Securities and Exchange Commission. Business We are a leading designer and manufacturer of high productivity mining equipment for the extraction of coal, copper, oil sands, iron ore and other minerals in major mining centers throughout the world. In addition to the manufacture of original equipment, we also provide the aftermarket replacement parts and service for this equipment. We operate in two business segments: surface mining and underground mining. All of our products and services are marketed under the Bucyrus name. We have manufacturing facilities in Australia, China, Germany, Poland and the United States and service and sales centers in Australia, Brazil, Canada, Chile, China, the Czech Republic, England, India, Mexico, Peru, Russia, South Africa and the United States. The largest markets for our original equipment and aftermarket parts and service have historically been in Australia, Canada, China, Germany, India, South Africa, South America and the United States. In the future, we expect that the United States, Australia, Brazil, Canada, China, India and Russia will be increasingly important markets for our surface mining equipment and that the United States, China, Russia, Eastern Europe and India will be increasingly important markets for our underground mining equipment. The market for our original equipment is closely correlated with customer expectations of sustained strength in prices of mined commodities. Growth in demand for these commodities is a function of, among other things, economic activity, population increases and continuing improvements in standards of living in many areas of the world. Market prices for coal, copper, iron ore and oil generally were strong for the first three quarters of 2008. However, the global economic downturn that worsened in the latter part of 2008 has reduced the demand for commodities, resulting in lower commodity prices and the creation of significant uncertainty in the near term market. As of December 31, 2008, we cannot accurately predict when commodity demand will rebound. This, along with the current conditions in the global financial markets and uncertain availability of credit, is currently impacting and capital spending by our customers in all global regions of both of our segments and may continue to do so in 2009. Our aftermarket parts and service sales tend to be more consistent than our original equipment sales. Our original equipment is typically kept in continuous operation from four to 40 years by our customers, requiring regular maintenance and repair throughout its productive life. The size of our installed base of surface and underground mining original equipment at December 31, 2008 was approximately $17.6 billion and $10 billion, respectively, based on estimated replacement value, compared to $15.2 billion and $10 billion for surface and underground mining, respectively, at December 31, 2007. Our ability to provide on-time delivery of reliable parts and prompt service are important drivers of our aftermarket sales.

74
A substantial portion of our sales and operating earnings is attributable to our operations located outside the United States. We generally sell our surface mining original equipment, including that sold directly to foreign customers, and most of our aftermarket parts in United States dollars. Our underground mining original equipment is generally sold in either United States dollars or euros. A portion of our aftermarket parts sales are also denominated in the local currencies of Australia, Brazil, Canada, South Africa and the United Kingdom. Aftermarket services are paid for primarily in local currency, which is naturally hedged by our payment of local labor in local currency. In our surface mining segment, quoting activity for our original equipment was high in 2008 compared to historical levels, although there was a decline in the fourth quarter of 2008 as the global economic recession had an adverse impact on mining activity across all global regions. However, as of the end of 2008, quoting activity for our surface mining original equipment continues to remain strong with existing mines in the oil sands region of Western Canada. As of December 31, 2008, we expect reduced quoting activity for our surface mining original equipment in 2009 compared to 2008. We do not expect an increase in original equipment sales in 2009 over 2008 levels. New orders and quoting activity for our surface mining aftermarket parts and services continued to remain at high levels throughout 2008 even though our customers’ production demand slowed in the fourth quarter as commodity prices declined. Quoting activity in the fourth quarter of 2008 was consistent with earlier 2008 quoting activity but, due to changing market conditions, the time between quote and placement of order has increased. Some of our customers, mostly smaller facilities, are implementing cost reduction actions that might affect equipment utilization; however, we believe our larger facility customers are still operating at levels sufficient enough to continue our current order and quoting levels in 2009. We expect our 2009 surface mining aftermarket parts and service sales to approximate 2008 levels. In our underground mining segment, quoting activity for our original equipment increased significantly from previous years but declined in the fourth quarter of 2008. This decline reflects the postponement of capital expenditures until at least after the first quarter of 2009 due to global economic conditions and the slowdown of steel manufacturing. As of December 31, 2008, we expect reduced quoting activity for our underground mining original equipment in 2009 compared to 2008 due to lack of available financing for expansion of future projects and customers postponing mine expansions and the opening of new mines. We do not expect an increase in our underground mining original equipment sales in 2009 over 2008 levels. New orders and quoting activity for our underground mining aftermarket parts and services were very strong in 2008, driven by strong demand for high productivity longwall mining parts worldwide in connection with start-ups of new longwalls and major expansions of existing longwalls. As of December 31, 2008, we expect a decline in quoting activity for our underground mining aftermarket parts and services in 2009 compared to 2008 as the global demand for metallurgical coal eases and the global credit crisis continues, causing start-ups of some new mines and major expansions to be postponed. Demand for thermal coal, which is used to generate electricity, is expected to remain relatively stable in 2009 in comparison to metallurgical coal, which is required to produce steel. As spot coal prices continue to decline, especially for metallurgical coal, we also expect to see a decline in longwall and room and pillar aftermarket orders and quotes, particularly in the United States/Mexico region where a significant portion of our customers sell their coal on the spot market. However, we expect this decline to be slightly offset by the more stable demand for electricity and by the potential that our customers will spend more money maintaining older machines as capital expenditures for some original equipment are postponed. We expect our 2009 underground mining aftermarket parts and service sales to approximate 2008 levels.

75
In response to recent order strength for our surface mining equipment, we have substantially completed a multi-phase capacity expansion of our surface mining manufacturing facilities in South Milwaukee, Wisconsin. The aggregate cost of phase one and two of our expansion program was $56.6 million and the cost of phase three is expected to be approximately $74.0 million. Assuming that we are able to retain the necessary skilled labor, our expanded facilities enable us to manufacture at least 24 electric mining shovels annually as well as almost double our annual manufactured parts capacity from 2006 levels. This expansion also provides us with added flexibility to increase dragline production should demand for electric mining shovels decline or demand for draglines increase. In addition, this expansion provides for improved efficiency and workflow. In the first quarter of 2008, our board of directors approved an additional $45.0 million for additional renovations of our South Milwaukee facility, which we expect to be completed in 2010. We have completed the expansion of our Kilgore, Texas surface mining service center and our underground mining service facility in Russia and are in the process of expanding our surface mining service center in Gillette, Wyoming. The expansion in Wyoming will be completed in 2009. During the fourth quarter of 2008, we closed two acquisitions. In December, we acquired OKD, Bastro a.s., an engineering services and manufacturing support company located in the Czech Republic, to support our long-term strategic initiatives in Europe. In October, we acquired Appalachian Mine Sales, Inc., a belt conveyor manufacturer with a presence in the Appalachia coals fields region, to strengthen our belt systems business. In recent years, we have increased our surface mining gross margin by achieving productivity gains in our manufacturing operations, which have led to improved original equipment and aftermarket margins, and through significant growth in our higher margin aftermarket parts and services business. We increased our underground mining gross margin from 2007 to 2008 due to growth in our higher margin aftermarket parts and services business and production efficiencies in our manufacturing operations. Installed Base Our total original equipment installed base of approximately $27.6 billion (calculated by estimated replacement value) at December 31, 2008, which includes approximately $17.6 billion of surface mining original equipment and approximately $10 billion of underground mining original equipment, provides the foundation for our future aftermarket sales. Over the life of certain machines, customer purchases of aftermarket parts can exceed the original purchase price of the machine. Additionally, we generally realize higher gross margins on sales of our aftermarket parts than on sales of our original equipment. Moreover, because these machines tend to operate continuously in all market conditions, with expected lives ranging from four to 40 years, and have predictable parts and maintenance needs, our aftermarket business has historically been more stable and predictable than the market for our original equipment, which is closely correlated with expectations of sustained strength in commodity markets. Backlog and New Orders Our backlog level, which represents unfilled orders for our products and services, allows us to more accurately forecast our upcoming sales and plan our production accordingly. Our backlog also provides us with a relative predictive level of expected 2009 sales and cash flows. Due to the high cost of some of our original equipment, our backlog is subject to volatility, particularly over relatively short periods. A portion of our backlog is related to multi-year contracts that will generate revenue in future years. Our backlog at December 31, 2008 and December 31, 2007, as well as the portion of our backlog which was expected to be recognized within 12 months of these dates, was as follows:

76
December 31, 2008 2007 % Change (Dollars in thousands) Surface Mining: Total $1,367,242 $804,781 69.9% Next 12 months $906,884 $579,448 56.5% Underground Mining: Total $1,135,212 $636,473 78.4% Next 12 months $806,074 $551,923 46.0% Total Total $2,502,454 $1,441,254 73.6% Next 12 months $1,712,958 $1,131,371 51.4%
The increase in our 2008 surface mining backlog was largely due to strong original equipment new orders, primarily electric mining shovels, and strong aftermarket new orders in the Chile, Australia, Canada and India markets. The increase in our 2008 underground mining backlog was predominantly due to strong original equipment new orders, primarily longwall mining equipment, and strong aftermarket new orders in the United States, Eastern Europe, Russia, Australia and South Africa markets New orders were as follows:
Years Ended December 31,
2008 2007 % Change
(Dollars in thousands)
Surface Mining:
Original equipment $948,334 $353,389 168.4% Aftermarket parts and
service
896,646 _________
483,744
_________
85.4%
1,844,980
_________ 837,133
_________ 120.4%
Underground Mining:
Original equipment 1,148,357 634,223 81.1% Aftermarket parts and
service
573,701 _________
247,804
_________
131.5%
1,722,058
_________ 882,027
_________ 95.2%
Total:
Original equipment 2,096,691 987,612 112.3% Aftermarket parts and
service
1,470,347 _________
731,548
_________
101.0%
$3,567,038
$1,719,160
107.5%

77
In our surface mining segment, the increase in 2008 original equipment new orders was primarily in electric mining shovels and the increase in aftermarket parts and service new orders was primarily in the Chile, Australia, Canada and India markets. Included in our surface mining aftermarket parts and service new orders for 2008 and 2007 was $281.5 million and $21.8 million, respectively, related to multi-year contracts that will generate revenue in future years. In our underground mining segment, the increase in 2008 original equipment new orders was primarily in longwall mining equipment and the increase in aftermarket parts and service new orders was primarily in the United States, Eastern Europe, Russia, Australia and South Africa markets. Underground mining new orders for 2007 were for the period of May 4 through December 31. Giving effect to our acquisition of DBT as if it would have occurred on January 1, 2007 instead of on May 4, 2007, pro forma new orders related to our underground mining segment for 2007 would have been $792.9 million and $353.3 million for original equipment and aftermarket parts and service, respectively.
Results of Operations 2008 Compared to 2007 Our 2007 results of operations for our underground mining segment were for the period of May 4, 2007, the date we acquired DBT, through December 31, 2007. As a result of this shortened reporting period for 2007, comparisons of our underground mining segment results for 2007 may not be particularly meaningful compared to 2008 and such comparisons may not be indicative of future results.
Years Ended December 31, 2008 2007
Amount % of
Sales Amount % of
Sales (Dollars in thousands) Sales $2,505,838 — $1,613,391 — Gross profit $682,503 27.2% $408,325 25.3% Selling, general and administrative expenses
$243,932
9.7%
$185,639
11.5% Operating earnings $382,631 15.3% $173,147 10.7% Net earnings $233,315 9.3% $136,134 8.4%
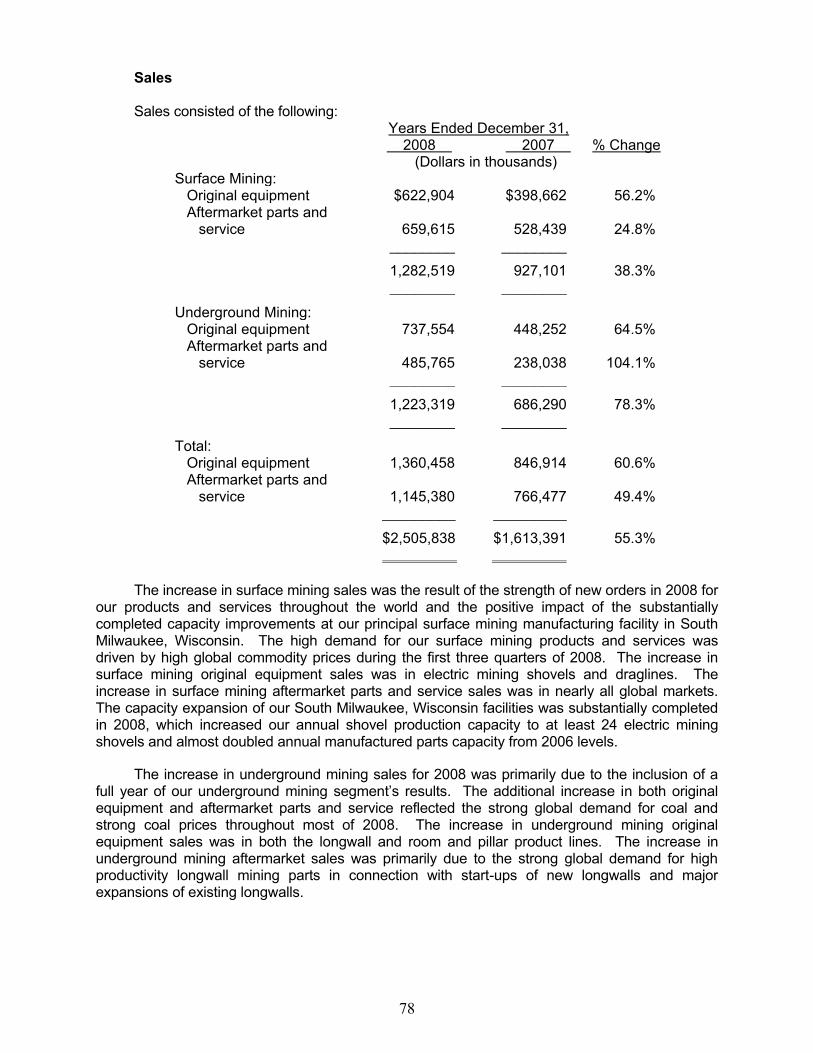
78
Sales Sales consisted of the following:
Years Ended December 31, 2008 2007 % Change
(Dollars in thousands) Surface Mining:
Original equipment $622,904 $398,662 56.2% Aftermarket parts and
service
659,615 ________
528,439
________ 24.8%
1,282,519
________ 927,101
________ 38.3%
Underground Mining:
Original equipment 737,554 448,252 64.5% Aftermarket parts and
service
485,765 ________
238,038
________ 104.1%
1,223,319
________ 686,290
________ 78.3%
Total:
Original equipment 1,360,458 846,914 60.6% Aftermarket parts and
service 1,145,380 _________
766,477 _________
49.4%
$2,505,838
$1,613,391
55.3%
The increase in surface mining sales was the result of the strength of new orders in 2008 for our products and services throughout the world and the positive impact of the substantially completed capacity improvements at our principal surface mining manufacturing facility in South Milwaukee, Wisconsin. The high demand for our surface mining products and services was driven by high global commodity prices during the first three quarters of 2008. The increase in surface mining original equipment sales was in electric mining shovels and draglines. The increase in surface mining aftermarket parts and service sales was in nearly all global markets. The capacity expansion of our South Milwaukee, Wisconsin facilities was substantially completed in 2008, which increased our annual shovel production capacity to at least 24 electric mining shovels and almost doubled annual manufactured parts capacity from 2006 levels.
The increase in underground mining sales for 2008 was primarily due to the inclusion of a full year of our underground mining segment’s results. The additional increase in both original equipment and aftermarket parts and service reflected the strong global demand for coal and strong coal prices throughout most of 2008. The increase in underground mining original equipment sales was in both the longwall and room and pillar product lines. The increase in underground mining aftermarket sales was primarily due to the strong global demand for high productivity longwall mining parts in connection with start-ups of new longwalls and major expansions of existing longwalls.

79
Gross Profit Gross profit for 2008 was $682.5 million, or 27.2% of sales, compared with $408.3 million, or 25.3% of sales, for 2007. Gross profit was reduced by purchase accounting adjustments (primarily to inventory) as a result of the acquisition of DBT in 2007 as follows:
Years Ended December 31,
2008 2007 (Dollars in thousands) Decrease due to purchase accounting adjustments
$10,777
$22,250
Gross margin reduction
0.4% 1.4%
The purchase accounting adjustment related to inventory has been fully amortized as of December 31, 2008. The increase in gross profit was primarily due to the inclusion of a full year of our underground mining segment’s results and increased surface mining sales. The availability of raw materials and raw material cost increases have not had a significant effect on gross margin or operating performance. Original equipment sales, which generally have lower gross margins than aftermarket sales, were 49% of our total surface mining sales for 2008 compared with 43% for 2007, and were 60% of our total underground mining sales for 2008 compared with 65% for 2007. Selling, General and Administrative Expenses Selling, general and administrative expenses for 2008 were $243.9 million, or 9.7% of sales, compared with $185.6 million, or 11.5% of sales, for 2007. The aggregate dollar increase was primarily due to the acquisition of DBT in May 2007. The upgrade of the SAP computer software in our underground mining segment was completed in 2008. The cost of this upgrade was $2.6 million and $0.4 million for 2008 and 2007, respectively. Expenses for 2007 include certain one-time costs related to the integration of DBT, which increased selling, general and administrative expenses as a percent of sales. We expect selling, general and administrative expenses to approximate 10% or less of sales in 2009. Research and Development Expenses
Research and development expenses for 2008 were $36.6 million, or 1.5% of sales, compared with $20.4 million, or 1.3% of sales, for 2007. The aggregate dollar increase was primarily due to the acquisition of DBT in May 2007, as well as electric mining shovel and longwall product developments and increased headcount to support higher electric mining shovel and dragline order levels. Amortization of Intangible Assets Amortization of intangible assets acquired in the DBT acquisition was $17.9 million for 2008, compared to $12.0 million for 2007. Amortization of intangible assets acquired in the DBT acquisition is expected to be approximately $3.8 million per quarter through April 2019.
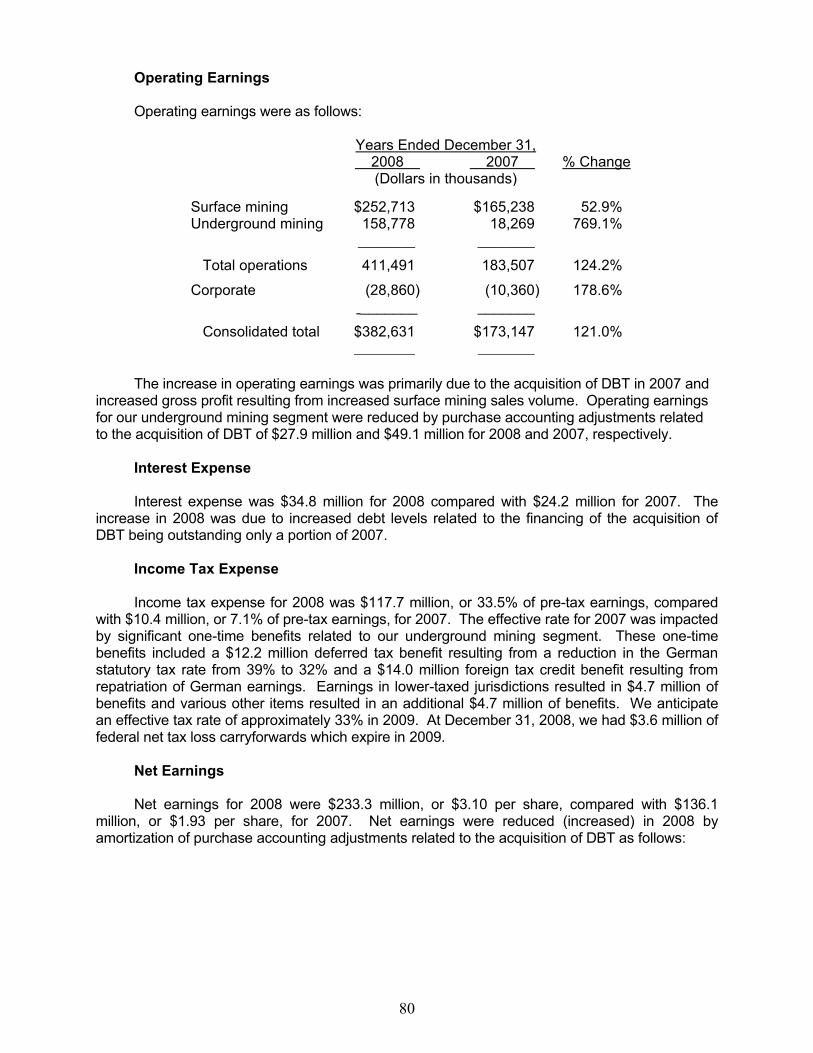
80
Operating Earnings Operating earnings were as follows:
Years Ended December 31, 2008 2007 % Change
(Dollars in thousands)
Surface mining $252,713 $165,238 52.9% Underground mining 158,778
_______ 18,269
_______ 769.1%
Total operations 411,491 183,507 124.2%
Corporate (28,860)
_______ (10,360)
_______ 178.6%
Consolidated total $382,631
$173,147
121.0%
The increase in operating earnings was primarily due to the acquisition of DBT in 2007 and
increased gross profit resulting from increased surface mining sales volume. Operating earnings for our underground mining segment were reduced by purchase accounting adjustments related to the acquisition of DBT of $27.9 million and $49.1 million for 2008 and 2007, respectively.
Interest Expense
Interest expense was $34.8 million for 2008 compared with $24.2 million for 2007. The increase in 2008 was due to increased debt levels related to the financing of the acquisition of DBT being outstanding only a portion of 2007.
Income Tax Expense Income tax expense for 2008 was $117.7 million, or 33.5% of pre-tax earnings, compared with $10.4 million, or 7.1% of pre-tax earnings, for 2007. The effective rate for 2007 was impacted by significant one-time benefits related to our underground mining segment. These one-time benefits included a $12.2 million deferred tax benefit resulting from a reduction in the German statutory tax rate from 39% to 32% and a $14.0 million foreign tax credit benefit resulting from repatriation of German earnings. Earnings in lower-taxed jurisdictions resulted in $4.7 million of benefits and various other items resulted in an additional $4.7 million of benefits. We anticipate an effective tax rate of approximately 33% in 2009. At December 31, 2008, we had $3.6 million of federal net tax loss carryforwards which expire in 2009.
Net Earnings
Net earnings for 2008 were $233.3 million, or $3.10 per share, compared with $136.1 million, or $1.93 per share, for 2007. Net earnings were reduced (increased) in 2008 by amortization of purchase accounting adjustments related to the acquisition of DBT as follows:

81
Years Ended
December 31, 2008 2007 (Dollars in thousands)
Inventory fair value adjustment charged to cost of product sold
$12,088
$23,350
Amortization of intangible assets 17,850 27,456
Depreciation of fixed assets (1,992) ______
(1,746) ______
Operating earnings 27,946 49,060
Income tax benefit (1) 9,158 ______
28,432 ______
Total $18,788
$20,628
__________________
(1) 2007 includes a $12.2 million tax benefit resulting from a reduction in the German
statutory tax rate.
Giving effect to our acquisition of DBT as if it would have occurred on January 1, 2007
instead of on May 4, 2007, pro forma net earnings and net earnings per share for 2007 would have been $146.9 million and $1.96, respectively. Pro forma net earnings excludes the adjustment of inventory to estimated fair value as this adjustment was directly attributed to the DBT transaction and did not have a continuing impact. The actual after tax charge to net earnings for this adjustment was $8.0 million and $9.5 million for 2008 and 2007, respectively. 2007 Compared to 2006 The results of operations of our underground mining segment were for the period of May 4, 2007, the date we acquired DBT, through December 31, 2007. As a result of this shortened reporting period for 2007, comparisons of our underground mining segment results for 2007 may not be particularly meaningful compared to 2006 and may not be indicative of future results.
Years Ended December 31, 2007 2006
Amount % of
Sales Amount % of
Sales (Dollars in thousands) Sales $1,613,391 — $738,050 — Gross profit $408,325 25.3% $186,775 25.3% Selling, general and administrative expenses
$185,639
11.5%
$73,138
9.9% Operating earnings $173,147 10.7% $101,184 13.7% Net earnings $136,134 8.4% $70,344 9.5%

82
Sales Sales consisted of the following:
Years Ended December 31, 2007 2006 % Change
(Dollars in thousands) Surface:
Original equipment $398,662 $255,739 55.9% Aftermarket parts and
service
528,439 _________
482,311
_________ 9.6%
927,101
_________ 738,050
_________ 25.6%
Underground:
Original equipment 448,252 N/A N/A Aftermarket parts and
service
238,038 _________
N/A
N/A
686,290
_________ N/A
N/A
Total:
Original equipment 846,914 255,739 231.2% Aftermarket parts and
service 766,477 _________
482,311 _________
58.9%
$1,613,391
$738,050
118.6%
The overall increase in our surface mining sales in 2007 reflected the ongoing global demand for our products and services, which was driven by the ongoing strength in markets for commodities that are mined by our machines, including coal, copper, iron ore and oil sands. Capacity constraints had an impact on our surface mining sales in 2007, as the ongoing expansion of our South Milwaukee facilities was not substantially completed until 2008. The level of our underground mining sales was consistent with our expectations for 2007 at the time of the DBT acquisition. Giving effect to our acquisition of DBT as if it would have occurred on January 1, 2007 instead of May 4, 2007, pro forma sales would have been $2.0 billion.
Gross Profit Gross profit for 2007 was $408.3 million, or 25.3% of sales, compared with $186.8 million, or 25.3% of sales, for 2006. Gross profit for 2007 was reduced by $22.2 million of amortization of purchase accounting adjustments (primarily to inventory and fixed assets) as a result of the acquisition of DBT, which had the effect of reducing gross margin for 2007 by 1.4 basis points. As of December 31, 2007, there was approximately $12.1 million of inventory adjustments relating to the DBT acquisition yet to be expensed over approximately the next 1.5 quarters. The increase in gross profit in 2007 was primarily due to the acquisition of DBT and increased surface mining sales, as well as improved gross margins on both surface mining original equipment and aftermarket parts and services. Original equipment sales, which have lower gross margins than aftermarket sales, were 43% of our total surface mining sales for 2007

83
compared with 35% for 2006. The cost of training new employees in South Milwaukee and the related effects continued to negatively impact gross margin. Selling, General and Administrative Expenses Selling, general and administrative expenses for 2007 were $185.6 million, or 11.5% of sales, compared with $73.1 million, or 9.9% of sales, for 2006. The increase in selling, general and administrative expenses was primarily due to the acquisition and integration of DBT. We were also in the process of upgrading the SAP computer software in our underground mining segment in 2007.
Research and Development Expenses Research and development expenses for 2007 were $20.4 million, or 1.3% of sales, compared with $10.7 million, or 1.4% of sales, for 2006. The increases were due to the acquisition of DBT, as well as the continuing development of our surface mining electrical and machine upgrade systems. Amortization of Intangible Assets In the third quarter of 2007, we finalized our decision to operate under one brand name (Bucyrus) for both our surface and underground mining segments beginning on January 1, 2008. As a result, amortization of intangible assets for 2007 included $12.0 million of amortization related to trademarks acquired in the DBT acquisition. Operating Earnings Operating earnings were as follows:
Years Ended December 31, 2007 2006 % Change
(Dollars in thousands)
Surface mining $165,238 $101,184 63.3% Underground mining 18,269
_______ N/A _______
N/A
Total operations 183,507 101,184 81.4%
Corporate (10,360)
_______ N/A _______
N/A
Consolidated total $173,147
$101,184
71.1%
Operating earnings for our underground mining segment were reduced by purchase
accounting adjustments related to the acquisition of DBT of $49.1 million for 2007. The increase in operating earnings for 2007 was primarily due to the acquisition of DBT and increased gross profit resulting from increased sales volume related to our surface mining business. Interest Expense
Interest expense was $24.2 million for 2007 compared with $3.7 million for 2006. The increase in interest expense in 2007 was due to increased debt levels related to the financing of the acquisition of DBT.

84
Income Tax Expense Income tax expense for 2007 was $10.4 million, or 7.1% of pre-tax earnings, compared with $26.9 million, or 27.7% of pre-tax earnings, for 2006. The effective rate for 2007 was impacted by significant one-time benefits related to our underground mining segment. These include a $12.2 million deferred tax benefit resulting from a reduction in the German statutory tax rate from 39% to 32% and a $14.0 million foreign tax credit benefit resulting from repatriation of German earnings. Earnings in lower taxed jurisdictions resulted in $4.7 million of benefits and various other items resulted in an additional $4.7 million of benefits. At December 31, 2007, we had $7.1 million of federal net tax loss carryforwards which expire in 2009.
Net Earnings
Net earnings for 2007 were $136.1 million, or $1.93 per share, compared with $70.3 million, or $1.12 per share, for 2006. Net earnings were reduced (increased) in 2007 by amortization of purchase accounting adjustments related to the acquisition of DBT as follows:
Year Ended December 31, 2007
(Dollars in thousands) Inventory fair value adjustment
charged to cost of product sold
$23,350 Amortization of intangible
assets 27,456
Depreciation of fixed assets (1,746) ___ ___
Operating earnings 49,060
Income tax benefit (1) (28,432) ___ ___
Total $20,628
__________________
(1) Includes a $12.2 million tax benefit resulting from a reduction in
the German statutory tax rate.
Giving effect to our acquisition of DBT as if it would have occurred on January 1, 2007 instead of on May 4, 2007, pro forma net earnings and net earnings per share would have been $146.9 million and $1.96, respectively.
Foreign Currency Fluctuations The following table summarizes the approximate effect of changes in foreign currency exchange rates on our sales, gross profit and operating earnings for 2008, 2007 and 2006, in each case compared to the prior year:
2008 2007 2006 (Dollars in thousands)
Increase in sales $5,017 $17,243 $577 Increase in gross profit $2,845 $2,805 $321 Increase in operating earnings $1,410 $1,784 $304

85
The volatility of the euro, Australian dollar and South African rand caused most of the change in 2008. EBITDA EBITDA was as follows:
Years Ended December 31,
2008 2007 % Change (Dollars in thousands) EBITDA $438,881 $227,766 92.7% EBITDA as a percent of sales 17.5% 14.1%
EBITDA is defined as net earnings before interest income, interest expense, income tax expense, depreciation and amortization. EBITDA includes the impact of non-cash stock compensation expense, severance expenses, loss on disposals of fixed assets and the inventory fair value purchase accounting adjustment charged to cost of products sold as set forth below. EBITDA is a measurement not recognized in accordance with accounting principles generally accepted in the United States of America (―GAAP‖) and should not be viewed as an alternative to GAAP measures of performance. EBITDA is presented because (i) we use EBITDA to measure our liquidity and financial performance, and (ii) we believe EBITDA is frequently used by securities analysts, investors and other interested parties in evaluating the performance and enterprise value of companies in general, and in evaluating the liquidity of companies with significant debt service obligations and their ability to service their indebtedness. The following table reconciles Net Earnings as reported in our Consolidated Statements of Earnings to EBITDA and reconciles EBITDA to Net Cash Provided by Operating Activities as reported in our Consolidated Statements of Cash Flows:
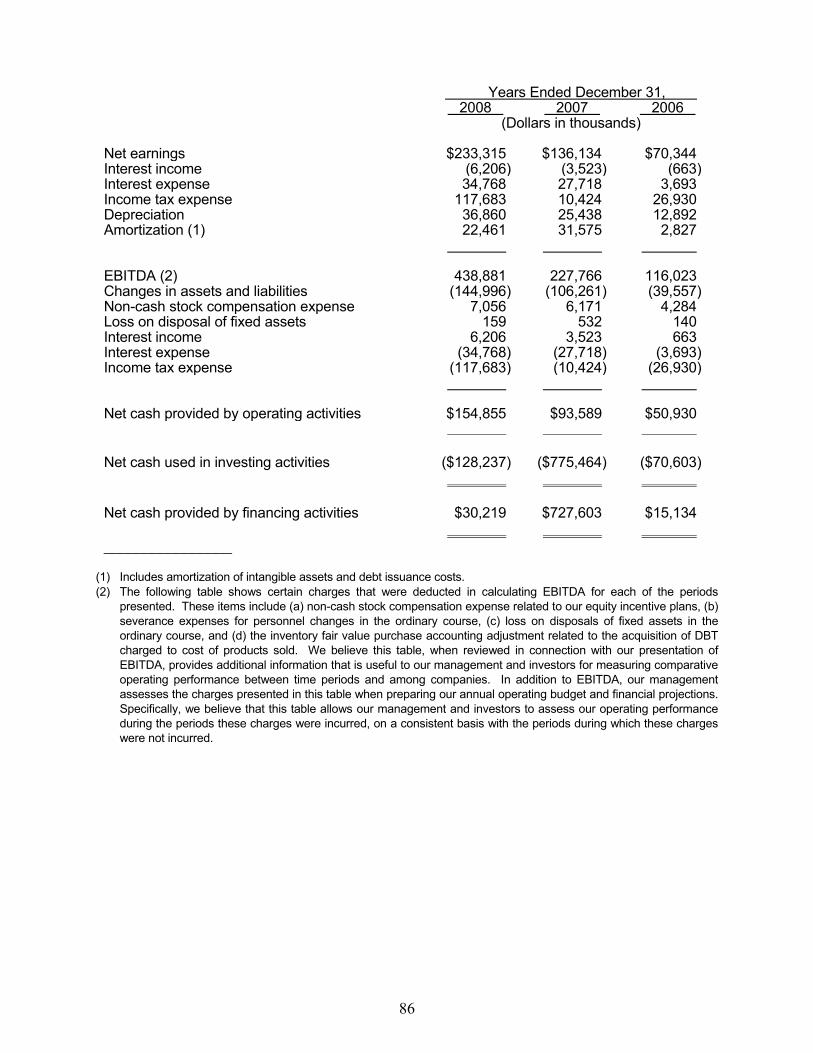
86
Years Ended December 31, 2008 2007 2006
(Dollars in thousands) Net earnings $233,315 $136,134 $70,344 Interest income (6,206) (3,523) (663) Interest expense 34,768 27,718 3,693 Income tax expense 117,683 10,424 26,930 Depreciation 36,860 25,438 12,892 Amortization (1) 22,461
31,575
2,827
EBITDA (2) 438,881 227,766 116,023 Changes in assets and liabilities (144,996) (106,261) (39,557) Non-cash stock compensation expense 7,056 6,171 4,284 Loss on disposal of fixed assets 159 532 140 Interest income 6,206 3,523 663 Interest expense (34,768) (27,718) (3,693) Income tax expense (117,683) (10,424) (26,930) Net cash provided by operating activities $154,855 $93,589 $50,930
Net cash used in investing activities ($128,237)
($775,464)
($70,603)
Net cash provided by financing activities $30,219 $727,603 $15,134 ________________
(1) Includes amortization of intangible assets and debt issuance costs.
(2) The following table shows certain charges that were deducted in calculating EBITDA for each of the periods
presented. These items include (a) non-cash stock compensation expense related to our equity incentive plans, (b)
severance expenses for personnel changes in the ordinary course, (c) loss on disposals of fixed assets in the
ordinary course, and (d) the inventory fair value purchase accounting adjustment related to the acquisition of DBT
charged to cost of products sold. We believe this table, when reviewed in connection with our presentation of
EBITDA, provides additional information that is useful to our management and investors for measuring comparative
operating performance between time periods and among companies. In addition to EBITDA, our management
assesses the charges presented in this table when preparing our annual operating budget and financial projections.
Specifically, we believe that this table allows our management and investors to assess our operating performance
during the periods these charges were incurred, on a consistent basis with the periods during which these charges
were not incurred.

87
Years Ended December 31, 2008 2007 2006 (Dollars in thousands) Non-cash stock compensation expense $7,056 $6,171 $4,284 Severance (income) expense (450) 3,220 1,443 Loss on disposal of fixed assets 159 532 140 Inventory fair value adjustment charged to cost of
products sold
12,088
23,350
—
$18,853
$33,273
$5,867
Liquidity and Capital Resources
Description of Credit Facilities
Our credit facilities include a secured revolving credit facility of $357.5 million, an unsecured German revolving credit facility of €65.0 million, each of which mature on May 4, 2012, and a term loan facility consisting of $400.0 million plus €75.0 million with a maturity date of May 4, 2014. The entire secured revolving credit facility may be used for letters of credit. Borrowings under our secured revolving credit facility bear interest, payable no less frequently than quarterly, at (1) LIBOR plus between 1.25% and 1.75% (based on our total leverage ratio) for United States dollar denominated LIBOR loans, (2) a base rate determined by reference to the greater of the United States prime lending rate and the federal funds rate plus between 0.25% and 0.75% (based on our total leverage ratio) for United States dollar denominated base rate loans and (3) EURIBOR plus between 1.25% and 1.75% (based on our total leverage ratio) for euro denominated loans. The interest rates under our secured revolving credit facility are subject to change based on the total leverage ratio. The unsecured German revolving credit facility bears interest, payable no less frequently than quarterly, at EURIBOR plus 1.75%. Under each revolving credit facility, we have agreed to pay a commitment fee based on the unused portion of such facilities, payable quarterly, at rates ranging from 0.25% to 0.50% depending on the total leverage ratio, and when applicable, customary letter of credit fees. Borrowings under our term loan facility bear interest, payable no less frequently than quarterly, at (a) LIBOR plus 1.50% for United States dollar denominated LIBOR loans, (2) the base rate plus 0.50% for United States dollar denominated base rate loans and (3) EURIBOR plus 1.75% for euro denominated loans. At December 31, 2008, we had borrowings under our secured revolving credit facility of $55.2 million at a weighted average interest rate of 3.5%. The amount potentially available for borrowings under our secured revolving credit facility at December 31, 2008 was $176.5 million, after taking into account $125.8 million of issued letters of credit. The amount potentially available for borrowings under our unsecured German credit facility at December 31, 2008 was $58.4 million (€41.8 million), after taking into account $32.4 million (€23.2 million) of issued letters of credit. At December 31, 2008, we had borrowings under our term loan facility of $497.7 million ($395.0 million plus €74.1 million) at a weighted average interest rate of 5.2%. To manage a portion of our exposure to changes in LIBOR-based interest rates, we have entered into five interest rate swap agreements that effectively fix the interest payments on $350.0 million of our outstanding borrowings under our term loan facility at an interest rate of 3.8%, plus the applicable spread.

88
Our credit facilities contain operating and financial covenants that, among other things, could limit our ability to obtain additional sources of capital. Our financial covenants require that we maintain a total leverage ratio, calculated on a trailing four-quarter basis, of not more than 4.0 to 1.0 through the end of the quarter ending December 31, 2008 and not more than 3.5 to 1.0 for each measurement period thereafter. The total leverage ratio is calculated as the ratio of consolidated indebtedness (which is net of cash) to consolidated operating profit (which excludes, among other things, certain non-cash charges, as discussed more fully in the credit facilities). At December 31, 2008, our total leverage ratio was 1.02 to 1.0 and we were in compliance with all covenants and other requirements in our credit facilities.
Cash and Cash Requirements Our cash balance increased to $102.4 million at December 31, 2008 from $62.8 million at September 30, 2008 and $61.1 million at December 31, 2007. The increase was primarily the result of the collection of receivables on original equipment orders. Our customers generally are contractually obligated to make progress payments under purchase contracts for machine orders and certain large parts orders. As a result, we do not anticipate significant outside financing requirements to fund production of our original equipment and do not believe that original equipment sales will have a material adverse effect on our liquidity, although the issuance of letters of credit reduces the amount available for borrowings under our revolving credit facilities. If additional borrowings are necessary during 2009, we believe we have sufficient capacity under our existing revolving credit facilities. Capital expenditures for 2008 were $118.8 million compared with $96.9 million for 2007. Included in capital expenditures for 2008 and 2007 were $45.5 million and $42.4 million, respectively, related to our surface mining expansion program and the additional renovations of our South Milwaukee, Wisconsin facilities. We expect our capital expenditures in 2009 to be between $60.0 million and $70.0 million, which includes approximately $2.5 million to complete the expansion of our facility in Wyoming, approximately $8.0 million for the completion of phase three of our South Milwaukee, Wisconsin expansion and approximately $3.5 million for the additional renovations of our South Milwaukee, Wisconsin facilities. Capital expenditures will be evaluated as economic conditions change and will be revised as necessary. We believe cash flows from operating activities and funds available under our revolving credit facilities will be sufficient to fund our expected capital expenditures during 2009. At December 31, 2008, there were $218.3 million of standby letters of credit outstanding under all of our bank facilities. At December 31, 2008, our long-term liabilities consisted primarily of warranty and product liability accruals, pension and postretirement benefit accruals and deferred income taxes. For 2009, we expect to contribute $16.5 million to our pension plans and $1.4 million for the payment of benefits from our postretirement plan. Upon completion of an analysis of the funded status of our domestic pension plans, additional contributions may be made in 2009. At December 31, 2008, our unfunded pension and postretirement benefit liability was $173.0 million compared to $147.9 million at December 31, 2007. The increased liability reflects the decline in interest rates and the market value of the securities held by the plans. Payments of warranty and product liability claims are not subject to a definitive estimate by year. We do not expect to pay any material product liability claims in 2009. In addition to the obligations noted above, we currently anticipate estimated cash funding requirements for interest, dividends and income taxes of approximately $33 million, $7 million and $130 million to $140 million, respectively, during 2009.
89
During 2009, we anticipate continued positive cash flows from operations and expect our cash balances to increase throughout the year. We believe that cash flows from operations and our existing revolving credit facilities will be sufficient to fund our cash requirements in 2009. We also believe that cash flows from operations will be sufficient to repay any borrowings under our revolving credit facilities, as necessary, and all scheduled term loan payments.
Receivables We recognize revenues on most original equipment orders using the percentage-of-completion method. Accordingly, accounts receivable are generated when revenue is recognized, which can be before the funds are collected or in some cases, before our customer is billed. At December 31, 2008, we had $636.5 million of accounts receivable compared to $416.6 million of accounts receivable at December 31, 2007. Receivables at December 31, 2008 and December 31, 2007 included $209.7 million and $161.6 million, respectively, of revenues from long-term contracts which were not billable at these dates. Billed receivables have increased at December 31, 2008 due to higher original equipment billings in the fourth quarter of 2008. We expect that the collection of receivables will increase in early 2009 based on scheduled payments from customers. However, poor conditions in global financial markets or global or regional recessionary economic conditions could cause us difficulty in collecting outstanding accounts receivable.
Liabilities to Customers on Uncompleted Contracts and Warranties Customers generally make down payments at the time of the order for a new machine as well as progress payments throughout the manufacturing process. In accordance with AICPA Statement of Position No. 81-1, ―Accounting for Performance of Construction-Type and Certain Production-Type Contracts‖, these payments are recorded as Liabilities to Customers on Uncompleted Contracts and Warranties. Current Dividend Policy We pay a cash dividend on our common stock in the amount of $.025 per share per quarter, subject to future authorization by our Board of Directors. Total cash dividend payments in 2008 were $7.4 million.

90
Contractual Obligations
Our contractual obligations at December 31, 2008 were as follows:
Total
2009
2010- 2011
2012- 2013
Thereafter
(Dollars in thousands) Debt $571,046 $69,291 $12,710 $11,377 $477,668 Purchase obligations (1) 17,989 13,060 4,929 — —
Operating leases and rental and service agreements
48,709
13,648
15,100
6,581
13,380
Expansion and renovation projects (2) 9,600 9,600 — — —
Interest on long-term debt (3) 137,999 28,181 51,431 49,921 8,466 Pension and postretirement
obligations (4)
17,900
17,900
—
—
—
Total (5) $803,243
$151,680
$84,170
$67,879
$499,514
_____________________
(1) Obligations related to purchase orders entered into in the ordinary course of business are excluded from the above
table. Any amounts for which we are liable for goods or services received under purchase orders are reflected in
the Consolidated Balance Sheets as accounts payable.
(2) The third phase of our multi-phase expansion program at our South Milwaukee facility was substantially complete at
December 31, 2008. We expect that the aggregate cost of phase three will be approximately $74 million. The
additional renovations to our South Milwaukee facility are expected to be completed in 2010. We expect that the
aggregate cost of the renovations will be approximately $45 million. We are financing the expansion and renovation
programs through working capital and funds available under our existing revolving credit facility.
(3) Represents interest on our term loan. We do not expect any usage of our revolving credit facility in 2009. As a
result, we have excluded our revolving credit facility from this table.
(4) Obligations for our pension plans cannot be reasonably estimated beyond 2009. In addition, upon completion of an
analysis of the funded status of our domestic pension plans, additional contributions may be made in 2009. For
further information on our pension and postretirement plans, see Notes K and L of the Notes to the Consolidated
Financial Statements.
(5) Due to the uncertainty in predicting the timing of tax payments, if any, related to our unrecognized tax benefits, $18
million has been excluded from this table.
Critical Accounting Policies and Estimates The preparation of our consolidated financial statements in conformity with accounting principles generally accepted in the United States requires us to make estimates and assumptions about future events that affect the amounts reported in our financial statements and accompanying footnotes. Future events and their effects cannot be determined with absolute certainty. Therefore, the determination of estimates requires the exercise of judgment. Actual results could differ from those estimates, and such differences may be material to the financial statements. The process of determining significant estimates is fact specific and takes into account factors such as historical experience, current and expected economic conditions, product mix, and in some cases, actuarial techniques. We evaluate these significant factors as facts and circumstances dictate. Historically, actual results have not differed significantly from those determined using estimates. The following are the accounting policies that most frequently require us to make estimates and judgments and are critical to understanding our financial position, results of operations and cash flows:

91
Revenue Recognition - Revenue from long-term sales contracts, such as for the manufacture of our original equipment and certain aftermarket orders, is recognized using the percentage-of-completion method prescribed by Statement of Position No. 81-1 due to the length of time to fully manufacture and assemble our original equipment or replacement parts. We measure revenue recognized based on the ratio of estimated costs incurred to date in relation to total costs to be incurred. The percentage-of-completion method of accounting for these contracts most accurately reflects the status of these uncompleted contracts in our financial statements and most accurately measures the matching of revenues with expenses. We also have long-term maintenance and repair contracts with customers. Under these contracts, we provide all replacement parts, regular maintenance services and necessary repairs for the excavation equipment at a particular mine with an on-site support team. In addition, some of these contracts call for our personnel to operate the equipment being serviced. Parts consumed and services provided are charged to cost of products sold and sales are calculated and recorded based on the parts and services utilization. The customer is billed monthly and a liability for deferred revenues is recorded if payments received exceed revenues recognized. At the time a loss on a contract becomes known, the amount of the estimated loss is recognized in our consolidated financial statements. Revenue from all other types of sales, primarily sales of aftermarket parts, net of estimated returns and allowances, is recognized in conformity with Staff Accounting Bulletin No. 104, when all of the following circumstances are satisfied: persuasive evidence of an arrangement exists, the price is fixed or determinable, collectibility is reasonably assured and delivery has occurred or services have been rendered. Criteria for revenue recognition is generally met at the time products are shipped, as the terms are FOB shipping point. The complexity of the cost estimation process and all issues related to assumptions, risks and uncertainties inherent with the use of estimated costs in the percentage of completion method of accounting affect the amounts reported in our financial statements. A number of internal and external factors affect our cost of sales estimates, including engineering design changes, estimated future material prices and customer specification changes. If we had used different assumptions in the application of this and other accounting policies, it is likely that materially different amounts would be reported in our financial statements. Bid and proposal costs are expensed as incurred. A 1% change in the gross margin on our original equipment in progress at December 31, 2008 would have the effect of changing our gross profit by approximately $14.2 million. Warranty - Sales of our products generally carry typical manufacturers' warranties, the majority of which cover products for one year, based on terms that are generally accepted in the marketplaces that we serve. We record provisions for estimated warranty and other related costs as revenue is recognized based on historical warranty loss experience and periodically adjust these provisions to reflect actual experience. Estimates used to determine the product warranty accruals are significantly impacted by the historical percentage of warranty claims costs to net sales. Over the last two years, this percentage has varied by approximately 0.7 percentage points compared to the warranty costs to sales percentage during 2008. Holding other assumptions constant, if this estimated percentage were to increase or decrease 0.7 percentage points, our warranty expense for 2008 would have increased or decreased by approximately $17.5 million. Pension and Other Postretirement Benefits - In September 2006, the Financial Accounting Standards Board (―FASB‖) issued Statement of Financial Accounting Standards (―SFAS‖) No. 158, ―Employers’ Accounting for Defined Benefit Pension and Other Postretirement Plans – an amendment of FASB Statements No. 87, 88, 106, and 132(R)‖ (―SFAS 158‖). SFAS. 158 requires an employer to recognize the over funded or under funded status of a defined benefit postretirement plan (other than a multiemployer plan) as an asset or liability in its balance sheet and to recognize changes in that funded status in the year in which the changes occur through comprehensive income. SFAS 158 also requires an employer to measure the funded status of a

92
plan as of the date of its year-end balance sheet. We adopted the provisions of SFAS 158 as of December 31, 2006 as required. We have several defined benefit pension plans that are separately funded. We also provide certain health care benefits to employees until age 65 and life insurance benefits for certain eligible retired United States employees. Several statistical and judgmental factors which attempt to anticipate future events are used in calculating the expense and liability related to these plans. These factors include assumptions about the discount rate, expected return on plan assets, rate of future compensation increases and health care cost trend rates, as we determine within certain guidelines. In addition, our actuarial consultants also use subjective factors such as withdrawal and mortality rates to estimate these factors. The actuarial assumptions we use may differ materially from actual results due to changing market and economic conditions, higher or lower withdrawal rates, longer or shorter life spans of participants and changes in actual costs of health care. These differences may result in a significant impact to the amount of pension and other postretirement benefit expenses recorded by us. In determining net periodic cost for pension benefits and for postretirement benefits other than pensions for 2008, we used a 6.25% and 5.5% discount rate for our United States plans and non-United States plans, respectively, and an expected long-term rate of return on plan assets of 8.5% for our United States plans. The discount rate for our United States plans in 2008 was increased from 5.75% in 2007 and the expected long-term rate of return on plan assets was the same as in 2007. In selecting an assumed discount rate, we reviewed various corporate bond yields. The 8.5% expected long-term rate of return on plan assets is based on the average rate of earnings expected on the classes of funds invested or to be invested to provide for the benefits of these plans. This includes considering the trusts' targeted asset allocation for the year and the expected returns likely to be earned over the next 20 years. The assumptions used for the return of each asset class are conservative when compared to long-term historical returns The table below shows the effect that a 1% increase or decrease in the discount rate and expected rate of return on plan assets would have on our pension and postretirement benefits obligations and costs: 2008 Benefit Cost
(Income) Expense
January 1, 2008 Benefit Obligation
Increase (Decrease)
One
Percentage-
Point Increase
One
Percentage-
Point Decrease
One
Percentage-
Point Increase
One
Percentage-
Point Decrease
(Dollars in thousands)
United States Plans
Pension benefits:
Assumed discount rate ($747) $878 ($7,729) $9,060
Expected long-term rate of
return on plan assets
($810)
$810
N/A
N/A
Postretirement benefits:
Assumed discount rate ($67) $30 ($1,301) $1,504 Non-United States Plans
Pension benefits:
Assumed discount rate ($1,190) $366 ($11,969) $14,657
Expected long-term rate of
return on plan assets
N/A
N/A
N/A
N/A

93
Accounting for Uncertainty in Income Taxes - In June 2006, the FASB issued FASB Interpretation No. 48, ―Accounting for Uncertainty in Income Taxes‖ (―FIN 48‖). FIN 48 is an interpretation of SFAS No. 109, ―Accounting for Income Taxes,‖ and seeks to reduce the diversity in practice associated with certain aspects of measurement and recognition in accounting for income taxes and was effective as of the beginning of our 2007 fiscal year. We adopted FIN 48 on January 1, 2007. As a result of the implementation of FIN 48, we recognized a net charge to accumulated earnings of $0.1 million. On January 1, 2007, subsequent to the adoption of FIN 48, we had a reserve of $0.7 million for unrecognized tax benefits, $0.3 million of which would impact our effective tax rate if recognized. At December 31, 2008, we had $18.0 million of unrecognized tax benefits, $4.9 million of which would impact our effective tax rate if recognized. We estimate that the gross amount of unrecognized income tax benefits will decrease by approximately $2.6 million in the next 12 months due to the close of an open tax year; however, we cannot estimate the change in the reserve due to tax positions expected to be taken during 2009.
Impairment of Tangible and Intangible Assets - Assets subject to amortization: In accordance with SFAS No. 144, ―Accounting for the Impairment or Disposal of Long-Lived Assets,‖ we review long-lived assets and all amortizable intangible assets for impairment whenever events or changes in circumstances indicate that the carrying amount of such assets may not be recoverable. Recoverability of these assets is determined by comparing the forecasted undiscounted net cash flows of the operation to which the assets relate to their carrying amount. The operations are generally distinguished by the business segment and geographic region in which they operate. If the operation is determined to be unable to recover the carrying amount of its assets, then intangible assets are written down first, followed by the other long-lived assets of the operation, to fair value. Fair value is based on discounted cash flows or appraised values, depending upon the nature of the assets.
Goodwill-Assets not subject to amortization: We apply the provisions of SFAS No. 142
―Goodwill and Other Intangible Assets,‖ to goodwill and intangible assets with indefinite lives which are not amortized but are reviewed annually for impairment or more frequently if impairment indicators arise. Our annual goodwill impairment review date is December 31. We performed our annual goodwill impairment review as of December 31, 2008, 2007 and 2006 and noted no impairment of goodwill. In making this assessment, we rely on a number of factors including operating results, business plans, economic projections, anticipated future cash flows, and transactions and marketplace data. There are inherent uncertainties related to these factors and our judgment in applying them to the analysis of goodwill impairment. Changes in economic and operating conditions could result in goodwill impairment in future periods. We also compared the aggregate fair value of our reporting units to our market capitalization.

94
The following are new accounting pronouncements that we will be adopting on January 1, 2009:
Business Combinations - In December 2007, the FASB issued SFAS No. 141 (R),
―Business Combinations‖ (―SFAS 141(R)‖), which replaces SFAS 141 and provides greater consistency in the accounting and financial reporting of business combinations. SFAS 141(R) requires the acquiring entity in a business combination to recognize all assets acquired and liabilities assumed in the transaction and any non-controlling interest in the acquiree at the acquisition date and be measured at the fair value as of that date. This includes the measurement of the acquirer’s shares issued in consideration for a business combination, the recognition of contingent consideration, the accounting for pre-acquisition gain and loss contingencies, the recognition of capitalized in-process research and development, the accounting for acquisition related restructuring cost accruals, the treatment of acquisition related transaction costs and the recognition of changes in the acquirer’s income tax valuation allowance and deferred taxes. SFAS 141(R) is effective for us as of January 1, 2009. We are currently evaluating the impact that the adoption of SFAS 141(R) will have on our financial statements. Disclosures about Derivative Instruments and Hedging Activities - In March 2008, the FASB issued SFAS No. 161 (―SFAS 161‖), ―Disclosures about Derivative Instruments and Hedging Activities – an amendment of FASB Statement No.133.‖ SFAS 161 enhances disclosures regarding derivatives and hedging activities, including how an entity uses derivative instruments, how derivative instruments and related hedged items are accounted for under SFAS 133 and how derivative instruments and related hedged items affect an entity’s financial position, financial performance and cash flows. SFAS 161 is effective for us as of January 1, 2009. We are currently evaluating the impact that the adoption of SFAS 161 will have on our financial statements. Off Balance Sheet Arrangements We do not have any off balance sheet financing arrangements that we believe have or are reasonably likely to have a current or future material effect on our financial position.
QUANTITATIVE AND QUALITATIVE DISCLOSURES ABOUT MARKET RISK
Our market risk is impacted by changes in interest rates and foreign currency exchange rates. Interest Rates - Our interest rate exposure relates primarily to floating rate debt obligations in the United States. We manage borrowings under our credit agreement through the selection of LIBOR based borrowings, EURIBOR based borrowings, or prime-rate based borrowings. To manage a portion of our exposure to changes in LIBOR-based interest rates on its variable rate debt, we entered into five interest rate swap agreements that effectively fix the interest payments on $350.0 million of our outstanding borrowings under our term loan facility. As of December 31, 2008, a sensitivity analysis was performed for our floating rate debt obligations. Based on this sensitivity analysis, we have determined that a 10% change in the weighted average interest rate as of December 31, 2008 would have the effect of changing our interest expense on an annual basis by approximately $1.0 million.
Foreign Currency – We sell most of our surface mining original equipment, including those sold directly to foreign customers, in United States dollars, and we sell most of our underground mining original equipment in either United States dollars or euros. We sell most of our underground mining aftermarket parts in either United States dollars or euros, also with limited aftermarket parts sales denominated in the local currencies of various foreign markets. We sell most of our surface mining aftermarket parts in United States dollars, with limited aftermarket
95
parts sales denominated, in the local currencies of Australia, Brazil, Canada, South Africa and the United Kingdom. Both surface mining and underground mining aftermarket services are paid primarily in local currency, with a natural partial currency hedge through payment for local labor in local currency. The value, in United States dollars, of our investments in our foreign subsidiaries and of dividends paid to us by those subsidiaries will be affected by changes in exchange rates. We enter into currency hedges to help mitigate currency exchange risks. Currency controls, devaluations, trade restrictions and other disruptions in the currency convertibility and in the market for currency exchange could limit our ability to timely convert sales earned abroad into United States dollars, which could adversely affect our ability to service our United States dollar indebtedness, fund our United States dollar costs and finance capital expenditures and pay dividends on our common stock. Based on our derivative instruments outstanding at December 31, 2008, a 10% change in foreign currency exchange rates would not have a material effect on our financial position, results of operations or cash flows.

96
This page intentionally blank.

Bucyrus International, Inc. is a globalleader in the mining industry, manufacturingmachinery for surface and undergroundmining operations. We are working alongsideour corporate partners to set new standards of global stewardship and are employing technologies and strategies to work responsiblyand profitably in a new era of resource recovery. With thoughtful focus on practices thatimprove productivity and conserve energy,Bucyrus is instrumental in delivering theresources that power communities the world over.It is a responsibility we hold as core to our values, ultimately creating alasting, positive effect on our world.
Bucyrus International, Inc. shares of common stock are traded
on the NASDAQ Stock Market under the symbol BUCY. As of
February 24, 2009, there were 27 stockholders of record.
A copy of the Bucyrus International, Inc. 2008 Annual Report on
Form 10-K as filed with the Securities and Exchange Commission
is available at no charge on our web site, www.bucyrus.com, or by
contacting our investor relations contact.
INDEPENDENT REGISTERED PUBLIC ACCOUNTING FIRM
Deloitte & Touche LLP
555 East Wells Street
Milwaukee, Wisconsin USA 53202
TRANSFER AGENT AND REGISTRAR
Wells Fargo Shareowner Services
161 North Concord Exchange
South St. Paul, Minnesota USA 55075
INVESTOR RELATIONS CONTACT
Kent B. Henschen
Director, Corporate Communications
1100 Milwaukee Avenue
South Milwaukee, Wisconsin USA 53172
T: 414.768.4626 F: 414.768.5211
INVESTOR INFORMATION
ANNUAL MEETING
Thursday, April 23, 2009 at 10 a.m. CDT
Heritage Building on the campus of Bucyrus International, Inc.
1100 Milwaukee Avenue
South Milwaukee, Wisconsin USA 53172
RRD9557_Cov:RRD9557 3/12/09 5:38 PM Page 2
2008 Annual Report
A lasting effect on our world ...
Reliability at work
Cert no. SCS-COC-00648
RRD9557_Cov:RRD9557 3/10/09 10:32 AM Page 1