
Relative Permeability of Fractured Rock - Stanford … Abstract Nitrogen-water relative permeability...
37
SGP-TR-178 Relative Permeability of Fractured Rock Anson L. Villaluz June 2005 Financial support was provided through the Stanford Geothermal Program under Department of Energy Grant No. DE-FG36-02ID14418, and by the Department of Petroleum Engineering, Stanford University Stanford Geothermal Program Interdisciplinary Research in Engineering and Earth Sciences STANFORD UNIVERSITY Stanford, California
Transcript of Relative Permeability of Fractured Rock - Stanford … Abstract Nitrogen-water relative permeability...
SGP-TR-178
Relative Permeability of Fractured Rock
Anson L. Villaluz
June 2005
Financial support was provided through the Stanford Geothermal Program under
Department of Energy Grant No. DE-FG36-02ID14418, and by the Department of Petroleum Engineering,
Stanford University
Stanford Geothermal Program Interdisciplinary Research in Engineering and Earth Sciences STANFORD UNIVERSITY Stanford, California


v
Abstract
Nitrogen-water relative permeability of a fractured geothermal rock was compared to that of porous media in this study. Relative permeability values were measured from a series of steady state experiments.
It was verified that the relative permeability of porous media such as Berea sandstone follows the Corey model. On the other hand, nitrogen-water relative permeability points of fractured geothermal rock were found to be higher than that predicted by the Corey Model but lower than that of the X-Curve model.
The resistivity method was used to measure saturation while performing flow experiments on the geothermal rock.


vii
Acknowledgments
This research was conducted with financial support through the Stanford Geothermal Program under Department of Energy Grant No. DE-FG36-02ID14418.
First and foremost, I would like to thank my advisor, Dr. Roland Horne, for providing direction and for relentlessly motivating me throughout the research work. My sincerest gratitude goes to Dr. Kewen Li, for his invaluable help in the laboratory and for his insightful suggestions.
I also like to thank my colleagues in the geothermal group, Allan, Aysegul, Egill, Rob, and Chunmei (from Supri-D) for their company, for their help and for their friendship. Many thanks also to my office mates, Gianluca and Jones for being there with me during countless sleepless nights in the office.
Contributions of the following are also much appreciated: Dr. Tom Tang and Dr. Louis Castanier for sharing their expertise in core holder and experimental designs. Ms. Laura Garner, for making sure materials and equipment are always there on time. Last but not the least; I would like to thank Dr. Manika Prasad, Dr. Gary Mavko and Ms. Margaret Muir of the Geophysics Department for their generosity in lending me the RCL Meter for resistance measurements.
I dedicate this work to my parents and sisters who are always there for me.


ix
Contents
Abstract ............................................................................................................................... v
Acknowledgments............................................................................................................. vii
Contents ............................................................................................................................. ix
List of Tables ..................................................................................................................... xi
List of Figures .................................................................................................................. xiii
1. Introduction .................................................................................................................. 1
2. Theoretical Background................................................................................................ 3
2.1. Darcy's Law ........................................................................................................... 3 2.2. Klinkenberg Effect ................................................................................................ 3 2.3. Relative Permeability Models ............................................................................... 4 2.4. Saturation and Archie's Law.................................................................................. 5
3. Experimental Methodology.......................................................................................... 6
3.1. Experimental Apparatus ........................................................................................ 7 3.1.1. Berea Sandstone.............................................................................................. 7 3.1.2. Geothermal Rock ............................................................................................ 7
3.2. Absolute Permeability ........................................................................................... 9 3.2.1. Berea Sandstone.............................................................................................. 9 3.2.2. Geothermal Rock ............................................................................................ 9
3.3. Klinkenberg Effect ................................................................................................ 9 3.4. Resistivity Experiments....................................................................................... 10
3.4.1. Berea Sandstone............................................................................................ 10 3.4.2. Geothermal Rock .......................................................................................... 10
3.5. Nitrogen-Water Relative Permeability ................................................................ 11 3.5.1. Berea Sandstone............................................................................................ 11 3.5.2. Geothermal Rock .......................................................................................... 12
4. Experimental Results and Discussion ........................................................................ 13
4.1. Absoulte Permeability ......................................................................................... 13 4.1.1. Berea Sandstone............................................................................................ 13 4.1.2. Geothermal Rock .......................................................................................... 13
4.2. Klinkenberg Effect .............................................................................................. 13 4.3. Nitrogen-Water Relative Permeability ................................................................ 14
4.3.1. Berea Sandstone............................................................................................ 14 4.3.2. Geothermal Rock .......................................................................................... 17
4.4. Resistivity ............................................................................................................ 19

x
4.4.1. Berea Sandstone............................................................................................ 19 4.4.2. Geothermal Rock .......................................................................................... 20
5. Conclusion.................................................................................................................. 23
References......................................................................................................................... 25

xi
List of Tables
Table 4-1: Absolute permeability results for Berea sandstone ......................................... 13
Table 4-2: Absolute permeability results for geothermal rock ......................................... 13
Table 4-3: Calculated slip factor at 550 psi confining pressure ....................................... 14
Table 4-4: Tabulated results for nitrogen-water relative permeability in Berea sandstone
........................................................................................................................................... 15
Table 4-5: Tabulated results for nitrogen-water relative permeability in geothermal rock
........................................................................................................................................... 17
Table 4-6: End point residual saturations after drainage and imbibition.......................... 17


xiii
List of Figures
Figure 3-1: Experimental setup for nitrogen-water relative permeability in fractured rock
............................................................................................................................................. 8
Figure 3-2: Photo of the geothermal core with shrink tubing and end plates..................... 8
Figure 3-3: Photo of the experimental system.................................................................... 9
Figure 3-4: Apparatus for determining resistivity-saturation correlation......................... 10
Figure 3-5: Photograph of resistivity-saturation correlation experiment apparatus ......... 11
Figure 3-6: Experimental setup for nitrogen-water relative permeability in Berea
sandstone........................................................................................................................... 11
Figure 4-1: Results of geothermal rock Klinkenberg effect using nitrogen gas............... 14
Figure 4-2: Nitrogen-water drainage relative permeability in a porous media ................ 15
Figure 4-3: Nitrogen-water imbibition relative permeability in a porous media.............. 17
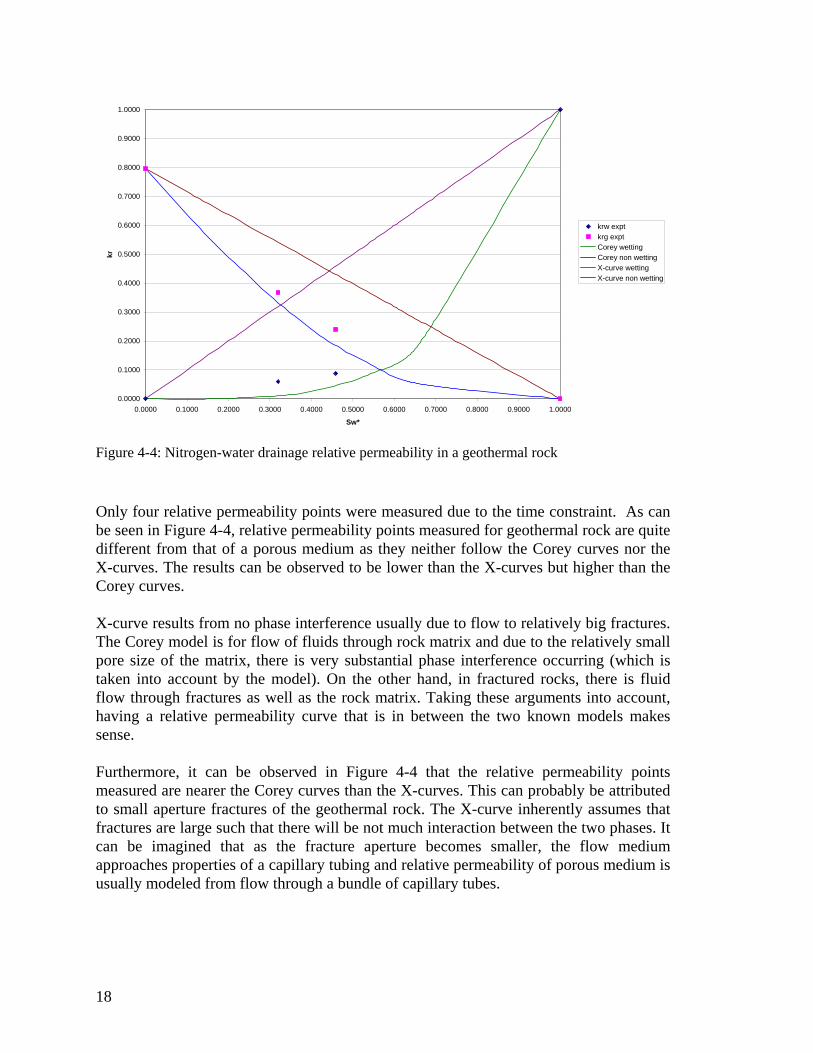
Figure 4-4: Nitrogen-water drainage relative permeability in a geothermal rock ............ 18
Figure 4-5: Resistivity studies results during drainage and natural evaporation of Berea
sandstone........................................................................................................................... 19
Figure 4-6: Resistivity index vs saturation at 100 Hz AC frequency ............................... 20
Figure 4-7: Resistivity index vs saturation at 1 kHz AC frequency ................................. 20
Figure 4-8: Resistivity index vs saturation at 10 kHz AC frequency ............................... 21
Figure 4-9: Resistivity index vs saturation at 100 kHz AC frequency ............................. 21

1
Chapter 1
1. Introduction
Steam-water relative permeability and capillary pressure are important data for geothermal reservoir engineering. The Stanford Geothermal Program (SGP) has succeeded in making fundamental measurements of steam-water flow in porous media and made significant contributions to the industry. One of the important problems left to undertake is the measurement of steam-water relative permeability and capillary pressure in fractured, low permeability geothermal rock, as most of the previous study was conducted in high permeability sandstone as a well-controlled test material. We have concluded from earlier experimental data (Satik, 1998; Horne et al., 2000; Mahiya, 1999; O'Connor, 2001; Li and Horne, 2000) that steam-water relative permeability of porous medium follows the Corey model and steam-water capillary pressure follow the Brooks-Corey model. We can measure the end-point steam-water relative permeability and saturation in the geothermal rock with permeability smaller than 1 md using the resistivity method (Archie’s equation) and/or the direct weighing method developed by Li et al. (2001). Then the whole curve of steam-water relative permeability can be obtained using the Corey model and the capillary pressure curve can be obtained using the Brooks-Corey model. We confirmed the applicability of this approach first with nitrogen-water experiments, which are easier to conduct than the steam-water flows. Now, we want to investigate relative permeability in real fractured rocks. This work was begun by Habana (2002), who ran into experimental difficulties and was not able to complete the measurements. A lot of work has been done to study flow behavior in nonfractured porous media; some experiments have also studied flow behavior in synthetic fabricated fractures. This study used a core sample from The Geysers geothermal field. Understanding liquid-gas flow properties in real fractured rock will enable us to do production forecasts through numerical simulations more accurately. This will lead to better information for decision making regarding reservoir management and development.

3
Chapter 2
2. Theoretical Background
2.1. Darcy’s Law
For incompressible fluids, Darcy’s Law is described by Equation 2-1 as:
LPAkq abs ∆
=µ
(2-1)
For compressible flow, usually characterized by gas flow, Darcy’s Law can be modified to Equation 2-2:
o
mg
pp
LPAk
q ∆=
µ (2-2)
For flow of more than one phase, relative permeability can be used to take into account phase interactions within Darcy’s Law, for an incompressible phase, this can described by Equation 2-3 as:
LPAkkq rabs ∆
=µ (2-3)
where: q is the volumetric flowrate absk is the absolute permeability A is the cross sectional area of flow µ is the fluid viscosity P∆ is the pressure drop across the core sample L is the length of the core sample gk is the permeability given by a compressible fluid mp is the average of inlet and outlet pressures op is the outlet pressure rk is the relative permeability of the particular phase 2.2. Klinkenberg Effect
Slippage is usually observed for gas flows, wherein the permeability calculated from flow studies using compressible fluids is greater than the absolute permeability of the flow medium. This is also known as the Klinkenberg effect. The slip factor shown in Equation 2-4 can be introduced to correct for the difference.

4
⎟⎟⎠
⎞⎜⎜⎝
⎛−
=
m
gabs
pb
kk
1 (2-4)
Where b is the slip factor and the other variables are as described in Section 2.1. Extrapolating the curve to the ordinate axis gives the absolute permeability and Equation 2-4 can be used to calculate the slip factor. The slip factor can then be used to correct for the slip effect. 2.3. Relative Permeability Models
We have concluded from earlier experimental data (Satik, 1998; Horne et al., 2000; Mahiya, 1999; O'Connor, 2001; Li and Horne, 2000) that steam-water relative permeability follows the Corey model and steam-water capillary pressure follow the Brooks-Corey model for porous medium. Meanwhile, the X-curves are typically assumed for flow in fractured medium.
The Corey, Brooks-Corey, and X-curves are modeled by the equations below:
Corey Model:
4*Skrl = (2-5)
( ) ( )2*2* 11 SSkrg −−= (2-6) ( )
( )lrgr
lr
SSSSS
−−
=* (2-7)
Brooks-Corey Model:
( ) 32* += λSkrl (2-8)
( ) ( ) ⎟⎠⎞⎜
⎝⎛ −−=
+12*2* 11 λSSkrg (2-9)
X-curves:
*Skrl = (2-10) ( )*1 Skrg −= (2-11)
Where rlk is the relative permeability of the liquid, rgk is the relative permeability of the gas, lrS is the irreducible water saturation, grS is the water saturation at irreducible nitrogen gas saturation and λ is the pore size distribution index.
5
2.4. Saturation and Archie’s Law
Electrical resistance measurements were obtained to validate relationship of resistivity index with saturation via Archie’s Equation. This relationship can be represented by Equation 2-12:
nwbSI −= (2-12)
where ot RRI = is the resistivity index, tR is the resistivity at a certain saturation, oR is the resistivity at 100% water saturation, b is some function of tortuosity, and n is the saturation exponent.


7
Chapter 3
3. Experimental Methodology
In this chapter, details regarding the experimental design which enabled measurements of parameters necessary for determining relative permeability are discussed. Two types of experiments were particularly designed for, one is the steady-state relative permeability measurement of Berea sandstone and another is the steady-state relative permeability measurement of a geothermal rock. Some preliminary experiments were also done before the relative permeability measurements were performed, and these are also described in this chapter.
3.1. Experimental apparatus
3.1.1. Berea Sandstone
Parameters necessary to establish relative permeability curves are pressure, flowrate and saturation. Pressure transducers were used to measure pressure drop and outlet pressure, a 200 cc/min Matheson Flow Meter was used to determine flowrate, two balances were used to measure and cross validate saturation data. An RCL meter (AC) was also used to measure resistance along the core during experiments.
The main component of the system was a 2 inches diameter Berea sandstone core that is 4 inches in length. It has an absolute permeability of about 680 md and a porosity of 22.7%.
An aluminum core holder was used to provide boundary for fluid flow (with confining pressure) and mechanical support. Rubber sleeve with heat shrink tubing atop was used to separate the core from the confining pressure. 100 psi confining pressure was applied and pressure drop across the core ranged from 1.5 – 5 psig during the steady state relative permeability experiments.
3.1.2. Geothermal Rock
The main challenges in dealing with geothermal rock were its low permeability and its low porosity values. Because of these, experiments must be done at high pressures. A 500 psi pressure transducer was used to measure pressure drop, while a 25 psi pressure transducer measures the outlet pressure, an RCL meter (AC) and one balance (for output) were used to measure and cross validate saturation. Gas flow rates were measured using the volume displacement method with an inverted graduated cylinder, water, and a stopwatch.

8
Figure 3-1 is a schematic of the apparatus that allows real-time measurement of the required parameters. The main component of the system was a 2.72 inches geothermal rock that is 1.86 inches in length, the core was obtained from a depth of 2440.5 m at The Geysers geothermal field, a picture of the core assembly can be seen in Figure 3-2. It has an absolute permeability of around 0.7 md at a confining pressure of 550 psi and a porosity of 1.7%.
Figure 3-1: Experimental setup for nitrogen-water relative permeability in fractured rock
Figure 3-2: Photo of the geothermal core with shrink tubing and end plates

9
The aluminum core holder used for Berea sandstone would not stand the high pressure, therefore, a stainless steel core holder was used. Heat shrink tubing was used to separate the core from the confining pressure. Figure 3-3 is a picture of the experimental system.
Figure 3-3: Photo of the experimental system.
3.2. Absolute Permeability
3.2.1. Berea Sandstone
Permeability was determined by brine (1% NaCl) injection, three brine injection experiments were conducted. Flowrate was maintained constant for each experiment at 5 ml/min. Steady state was deemed achieved when the pressure drop was relatively constant. Outlet pressure was maintained at atmospheric pressure.
3.2.2. Geothermal Rock
Permeability was determined by brine (1% NaCl) injection, two brine injection experiments were conducted. Flowrate was maintained constant for each experiment at 0.3 ml/min, and another run at 0.4 ml/min. The data acquisition system was automated for taking pressure drop measurements.
3.3. Klinkenberg Effect
Slip effect was studied in the geothermal rock by measuring gas permeability at room temperature. Flow measurements were conducted at a series of different mean pressures and different confining pressures ranging from 400 to 800 psig. Three nitrogen
10
experiments were completed for the geothermal rock after drying the core at 110oC while pulling a vacuum.
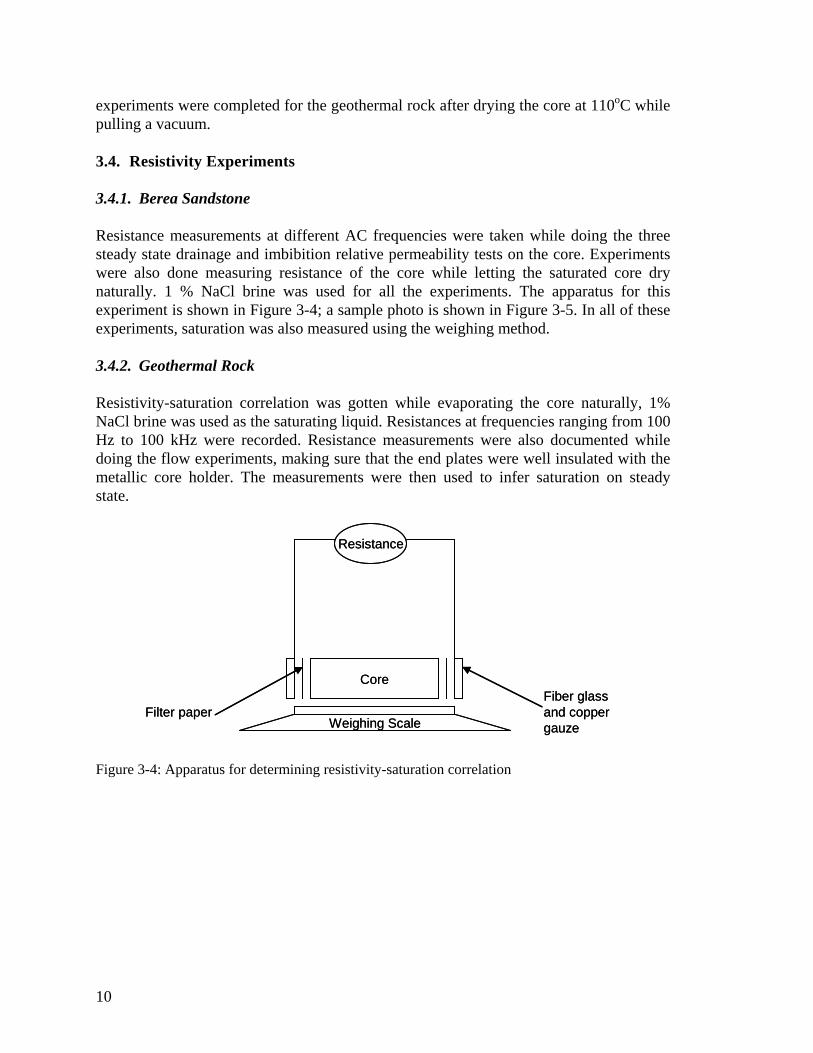
3.4. Resistivity Experiments
3.4.1. Berea Sandstone
Resistance measurements at different AC frequencies were taken while doing the three steady state drainage and imbibition relative permeability tests on the core. Experiments were also done measuring resistance of the core while letting the saturated core dry naturally. 1 % NaCl brine was used for all the experiments. The apparatus for this experiment is shown in Figure 3-4; a sample photo is shown in Figure 3-5. In all of these experiments, saturation was also measured using the weighing method.
3.4.2. Geothermal Rock
Resistivity-saturation correlation was gotten while evaporating the core naturally, 1% NaCl brine was used as the saturating liquid. Resistances at frequencies ranging from 100 Hz to 100 kHz were recorded. Resistance measurements were also documented while doing the flow experiments, making sure that the end plates were well insulated with the metallic core holder. The measurements were then used to infer saturation on steady state.
Weighing Scale
Core
Resistance
Filter paperFiber glass and copper gauzeWeighing Scale
Core
Resistance
Filter paperFiber glass and copper gauze
Figure 3-4: Apparatus for determining resistivity-saturation correlation
11
Figure 3-5: Photograph of resistivity-saturation correlation experiment apparatus
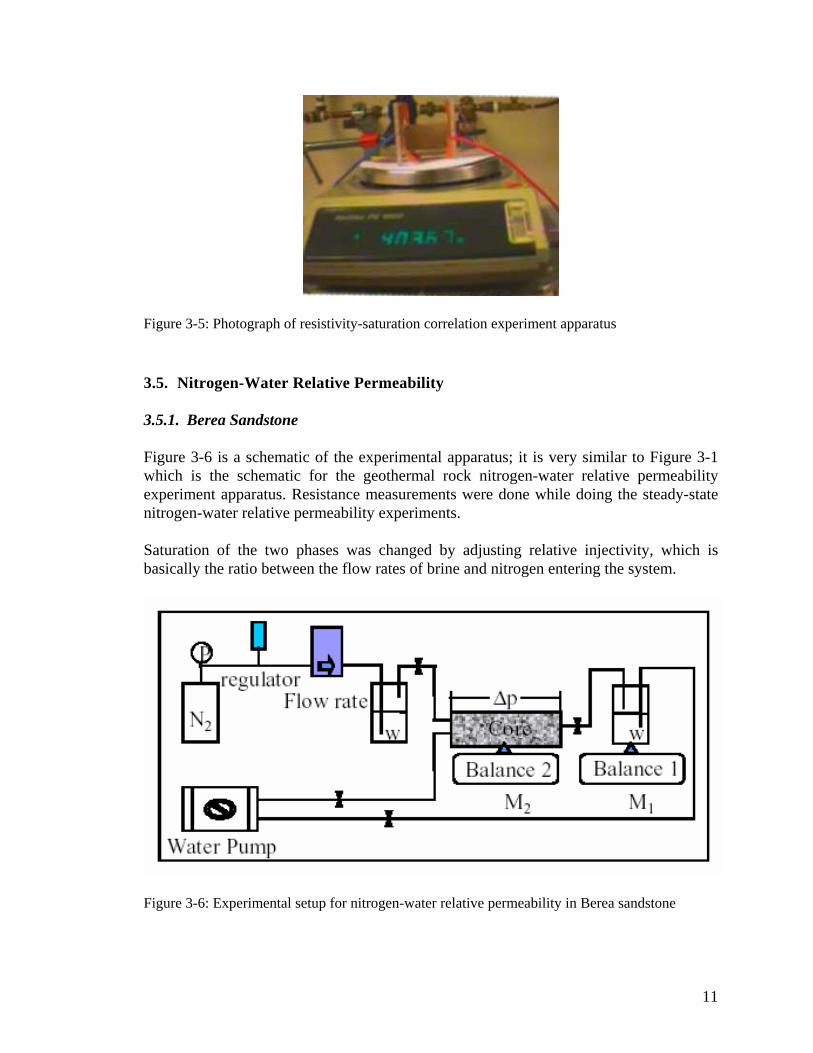
3.5. Nitrogen-Water Relative Permeability
3.5.1. Berea Sandstone
Figure 3-6 is a schematic of the experimental apparatus; it is very similar to Figure 3-1 which is the schematic for the geothermal rock nitrogen-water relative permeability experiment apparatus. Resistance measurements were done while doing the steady-state nitrogen-water relative permeability experiments.
Saturation of the two phases was changed by adjusting relative injectivity, which is basically the ratio between the flow rates of brine and nitrogen entering the system.
Figure 3-6: Experimental setup for nitrogen-water relative permeability in Berea sandstone
12
3.5.2. Geothermal Rock
The schematic of the experimental apparatus is shown in Figure 3-1. The steady-state method was used to determine nitrogen water relative permeability. The unsteady-state method was tried first but due to small pore volume of the core, volume measurements at the outlet needed better instrumentation. The FFRD (fractional flow rate detector) method could not measure the volumetric rates accurately. The core was first dried at 110oC under vacuum and further evacuated using a vacuum pump. The core was then saturated with 1% NaCl brine and water saturated nitrogen is injected to determine relative permeability using the steady state method.

13
Chapter 4
4. Experimental Results and Discussion
4.1. Absolute Permeability
4.1.1. Water Injection in Berea Sandstone
Table 4-1 summarizes the results from three experiment runs performed. The Berea sandstone used has an average absolute permeability of about 684 md.
Table 4-1: Absolute permeability results for Berea sandstone
Flow rate (ml/min) permeability (md)5 6815 6815 690
4.1.2. Water Injection in Geothermal Rock
Table 4-2 summarizes the results from two experiment runs performed under a confining pressure of 550 psi. The flow experiment took around 50 hrs to reach a stable pressure. Two more water injection experiments were done before those presented in Table 4-2, the permeability values gotten for these were considerably lower possibly due to trapped gas. The core was then evacuated to solve the problem.
Table 4-2: Absolute permeability results for geothermal rock
Flow rate (ml/min) permeability (md)0.3 0.68440.4 0.696
The absolute permeability values obtained by Habana (2002) were also less than 1 md. This past work showed that permeability of the core used was around 0.2 to 0.3 md. The permeability of the core used in this research is higher probably due to the presence of more visible fractures.
4.2. Klinkenberg Effect
Figure 4-1 shows the results of three nitrogen experiments performed on the geothermal rock. Absolute permeability can be determined taking into account slip effect by extrapolating permeability data to the ordinate axis. Absolute permeability at 550 psi of confining pressure was determined to be around 0.7 md. This value verifies the absolute
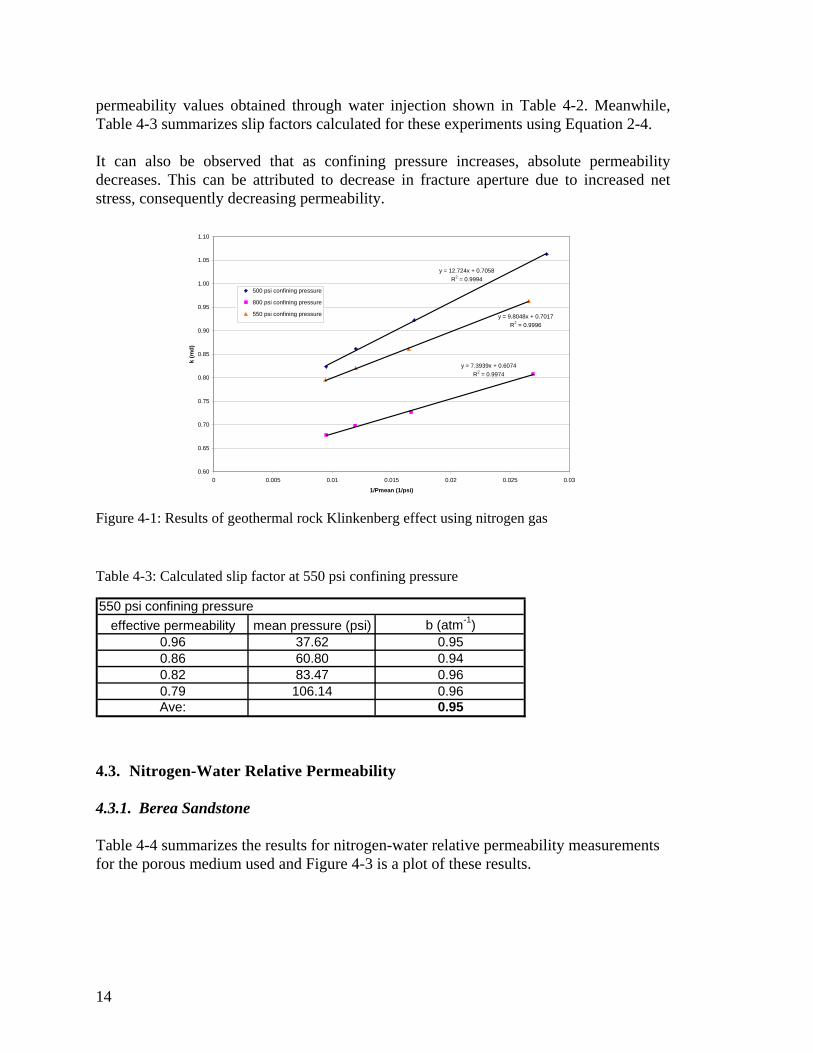
14
permeability values obtained through water injection shown in Table 4-2. Meanwhile, Table 4-3 summarizes slip factors calculated for these experiments using Equation 2-4.
It can also be observed that as confining pressure increases, absolute permeability decreases. This can be attributed to decrease in fracture aperture due to increased net stress, consequently decreasing permeability.
y = 12.724x + 0.7058R2 = 0.9994
y = 9.8048x + 0.7017R2 = 0.9996
y = 7.3939x + 0.6074R2 = 0.9974
0.60
0.65
0.70
0.75
0.80
0.85
0.90
0.95
1.00
1.05
1.10
0 0.005 0.01 0.015 0.02 0.025 0.03
1/Pmean (1/psi)
k (m
d)
500 psi confining pressure
800 psi confining pressure
550 psi confining pressure
Figure 4-1: Results of geothermal rock Klinkenberg effect using nitrogen gas
Table 4-3: Calculated slip factor at 550 psi confining pressure
550 psi confining pressureeffective permeability mean pressure (psi) b (atm-1)
0.96 37.62 0.950.86 60.80 0.940.82 83.47 0.960.79 106.14 0.96Ave: 0.95
4.3. Nitrogen-Water Relative Permeability
4.3.1. Berea Sandstone
Table 4-4 summarizes the results for nitrogen-water relative permeability measurements for the porous medium used and Figure 4-3 is a plot of these results.

15
0
0.1
0.2
0.3
0.4
0.5
0.6
0.7
0.8
0.9
1
0.00% 10.00% 20.00% 30.00% 40.00% 50.00% 60.00% 70.00% 80.00% 90.00% 100.00%
Water Saturation
Rel
ativ
e Pe
rmea
bilit
ykrw drainage
krg drainage
krw drainage 2
krg drainage 2
krw drainage 1
krg drainage 1
Corey Wetting
Corey Non-wetting
Figure 4-2: Nitrogen-water drainage relative permeability in a porous media The general trend of the results seen in Figure 4-2 is acceptable. Relative permeability of a particular phase increases as saturation of that particular phase increases and vice versa. Plotted against a semiempirical model, the results can be observed to generally follow the Corey series model (Brooks-Corey model with λ=2, where λ is the pore size distribution index). Past researchers also had similar results and it is generally accepted that nitrogen-water relative permeability in porous media follows the Corey model. On the other hand, Figure 4-3 presents the results during the imbibition process. The results generally follow the trend expected. Resistivity tests were done while doing these experiments and results from these measurements will be discussed in a later section.

16
Table 4-4: Tabulated results for nitrogen-water relative permeability in Berea sandstone
DrainageSw krw kg
100.00% 1.0000 0.000087.61% 0.4351 0.044183.69% 0.3040 0.065877.60% 0.1747 0.097769.99% 0.1164 0.143061.08% 0.0359 0.203551.73% 0.0079 0.252428.35% 0.0000 0.5019
Drainage 1Sw kw kg
100.00% 1.0000 0.000089.80% 0.5304 0.037286.48% 0.4337 0.053573.99% 0.2256 0.165071.78% 0.1969 0.173367.41% 0.1223 0.186063.01% 0.0636 0.178227.68% 0.0000 0.4136
Drainage 2 Sw krw kg
100.00% 1.0000 0.000086.30% 0.4146 0.038468.25% 0.1279 0.063865.43% 0.0970 0.076861.95% 0.0702 0.108658.69% 0.0477 0.154957.60% 0.0392 0.174753.03% 0.0173 0.192727.81% 0.0000 0.5201

17
0
0.1
0.2
0.3
0.4
0.5
0.6
0.7
0.8
0.9
1
0.00% 10.00% 20.00% 30.00% 40.00% 50.00% 60.00% 70.00% 80.00% 90.00% 100.00%
Water Saturation
kr
krw imbibitionkrg imbibitionkrw imbibition 2krg imbibition 2
Figure 4-3: Nitrogen-water imbibition relative permeability in a porous medium
4.3.2. Geothermal Rock
Table 4-5 summarizes the results for nitrogen-water relative permeability measurements for the geothermal rock and Figure 4-4 is a plot of these results. Meanwhile, Table 4-6 tabulates the end point saturations after drainage and imbibition, saturations were determined using the weighing method.
Table 4-5: Tabulated results for nitrogen-water relative permeability in geothermal rock
Sw Sw* krw krg100.00% 1.0000 1.0000 0.0000
80.31% 0.4591 0.0884 0.241175.23% 0.3196 0.0590 0.368063.60% 0.0000 0.0000 0.7959
Table 4-6: End point residual saturations after drainage and imbibition
Sw SgDrainage end point 63.60% 36.40%Imbibition end point 80.79% 19.21%
18
0.0000
0.1000
0.2000
0.3000
0.4000
0.5000
0.6000
0.7000
0.8000
0.9000
1.0000
0.0000 0.1000 0.2000 0.3000 0.4000 0.5000 0.6000 0.7000 0.8000 0.9000 1.0000
Sw*
kr
krw exptkrg exptCorey wettingCorey non wettingX-curve wettingX-curve non wetting
Figure 4-4: Nitrogen-water drainage relative permeability in a geothermal rock
Only four relative permeability points were measured due to the time constraint. As can be seen in Figure 4-4, relative permeability points measured for geothermal rock are quite different from that of a porous medium as they neither follow the Corey curves nor the X-curves. The results can be observed to be lower than the X-curves but higher than the Corey curves.
X-curve results from no phase interference usually due to flow to relatively big fractures. The Corey model is for flow of fluids through rock matrix and due to the relatively small pore size of the matrix, there is very substantial phase interference occurring (which is taken into account by the model). On the other hand, in fractured rocks, there is fluid flow through fractures as well as the rock matrix. Taking these arguments into account, having a relative permeability curve that is in between the two known models makes sense.
Furthermore, it can be observed in Figure 4-4 that the relative permeability points measured are nearer the Corey curves than the X-curves. This can probably be attributed to small aperture fractures of the geothermal rock. The X-curve inherently assumes that fractures are large such that there will be not much interaction between the two phases. It can be imagined that as the fracture aperture becomes smaller, the flow medium approaches properties of a capillary tubing and relative permeability of porous medium is usually modeled from flow through a bundle of capillary tubes.

19
4.4. Resistivity
4.4.1. Berea Sandstone
Figure 4-4 is a plot of results obtained from the resistivity studies performed while evaporating the core naturally as well as while flow experiments were being performed. 100 Hz of AC current was used for this experiment as results derived from this frequency fits Archie’s correlation best during the preliminary natural evaporation experiment.
It can be observed from Figure 4-5 that all drainage, natural evaporation, and imbibition processes resulted in good Archie’s correlation between saturation and resistivity at 100 Hz AC frequency. It is noteworthy that the cementation factor determined is higher (about 5.4) than that of the usual Berea sandstone’s (about 2). This can possibly be attributed to the firing of the Berea sandstone used in the experiment. During the firing process, clays (which are conductive materials) are calcined, therefore, decreasing the overall conductivity of the material and increasing its resistance.
Another interesting observation from Figure 4-5 is that resistivity index seemed to be a function of flow history. For the imbibition process, indices were lower than that of the drainage process.
y = 0.4313x-5.3457
R2 = 0.9717
y = 0.9446x-5.1206
R2 = 0.9934
y = 1.1471x-5.578
R2 = 0.9883
0.1
1
10
100
10.00% 100.00%
Water saturation
Res
istiv
ity In
dex
Drainage Resistivity
Imbibition Resistivity
Natural Evaporation
Figure 4-5: Resistivity studies results during drainage and natural evaporation of Berea sandstone

20
4.4.2. Geothermal Rock
A correlation between resistivity index and saturation was determined for the geothermal rock. This correlation was used to measure saturation during the relative permeability experiments. Several AC frequencies were used and it was found out that 10 kHz of frequency is ideal for geothermal rock. Results of tests using different frequencies are presented in Figures 4-6 to 4-9.
y = 0.6x-12.311
R2 = 0.8657
0.1
1
10
100
1000
0.1 1
Saturation
Res
istiv
ity In
dex
Figure 4-6: Resistivity index vs saturation at 100 Hz AC frequency
y = 0.7132x-10.927
R2 = 0.9224
0.10
1.00
10.00
100.00
1000.00
0.1 1
Saturation
Res
istiv
ity In
dex
Figure 4-7: Resistivity index vs saturation at 1 kHz AC frequency

21
y = 0.9383x-9.0669
R2 = 0.9939
0.10
1.00
10.00
100.00
0.1 1
Saturation
Res
istiv
ity In
dex
Figure 4-8: Resistivity index vs saturation at 10 kHz AC frequency
1.00
10.00
0.1 1
Saturation
Res
istiv
ity In
dex
Figure 4-9: Resistivity index vs saturation at 100 kHz AC frequency
The experiment was done by allowing the saturated geothermal rock to evaporate naturally while taking measurements of weight and resistivity as time progressed. This experiment lasted until the resistance went outside the sensitivity of the RCL meter used. The lowest saturation value was around 60%. This result coincides with the end-point drainage saturation of 63.6%.
Lastly, through comparison of Figures 4-6 to 4-9, it can be observed that 10 kHz of AC frequency yields the best Archie’s correlation between saturation and resistivity index. This was the correlation used to determine saturation from resistance data.
y = 0.9383x - 9.0669 R2 = 0.9939

22

23
Chapter 5
5. Conclusions
1. The geothermal rock used has an endpoint drainage water saturation of 63.6%, natural evaporation led to an endpoint saturation of around 60%. On the other hand, the rock used has an endpoint imbibition water saturation of 80.8%.
2. The unsteady-state method seems to be inapplicable for relative permeability measurements in geothermal rocks due to presence of only small pore volumes.
3. Fractured geothermal rocks and porous media like Berea sandstone are each described by distinct relative permeability models.
4. While flow in porous media is through the rock matrix, flow in fractured rocks seems to be a combination of flow through fractures and flow through the rock matrix.
5. While relative permeability of porous media like Berea sandstone follows the Corey model, fractured geothermal rocks generally have higher relative permeability values than nonfractured media.
6. Relative permeability of fractured geothermal rocks is somewhere in between the X-curve and the Corey model. Assuming that geothermal rocks follow the X-curve model is too much of an overestimate.
7. The resistivity method could be used for inferring saturation. However, factors such as flow history affect resistance measurements. Better certainty/accuracy could possibly be achieved using the Electrical Resistance Tomography (ERT) method.
8. More relative permeability points must be measured by changing relative injectivity.
9. This study serves as a foundation for the next challenge: steam-water relative permeability.

24

25
References
Horne, R.H., Satik, C., Mahiya, G., Li, K., Ambusso, W., Tovar, R., Wang, C., and Nassori, H.: "Steam-Water Relative Permeability," Proc. of the World Geothermal Congress 2000, Kyushu-Tohoku, Japan, May 28-June 10, 2000.
Li, K. and Horne, R.N. (2000): “Steam-Water Capillary Pressure,” SPE 63224, presented at the 2000 SPE Annual Technical Conference and Exhibition, Dallas, TX, USA, October 1-4, 2000.
Li, K., Nassori, H., and Horne, R.N. (2001): “Experimental Study of Water Injection into Geothermal Reservoirs,” to be presented at the GRC 2001 annual meeting, August 26-29, 2001, San Diego, USA; GRC Trans. V. 25.
Mahiya, G.: “Experimental Measurement of Steam-Water Relative Permeability,” MS report, Stanford University, Stanford, California (1999).
O'Connor, P.A.: “Constant-Pressure Measurement of Steam-Water Relative Permeability,” MS report, Stanford University, Stanford, California (2001).
Satik, C.: “A Measurement of Steam-Water Relative Permeability,” Proceedings of 23rd Workshop on Geothermal Reservoir Engineering, Stanford University, Stanford, California (1998).
Habana, M.D.: "Relative Permeability of Fractured Rock", MS report, Stanford University, Stanford, California, (2002).


![Predicting the Permeability of Fractured Porous Rock · permeability of fractured porous media is still required to study. Lorente et al. [1] studied the characteristics of fractured](https://static.fdocuments.net/doc/165x107/5f7848dc5e4d3a12c462bb61/predicting-the-permeability-of-fractured-porous-rock-permeability-of-fractured-porous.jpg)


