
Relative Measurement Accuracies within …my.eagleview.com/Portals/0/PortalContent/PDF/Relative...
10
100 Town Centre Drive | Rochester, NY 14623 | www.pictometry.com | 888.771.9714 Page 1 of 10 Relative Measurement Accuracies within Pictometry’s Individual Orthogonal and Oblique Frame Imagery© Michael J. Zoltek VP Surveying & Mapping Pictometry International, Corp ASPRS Certified Photogrammetrist (CP) State Licensed Land Surveyor/Photogrammetrist AL, AZ, CA, CT, FL, GA, ID, LA, MS, NC, NM, NV, NY, ND, OR, SC, SD, TN, TX, USVI, WA, WI, WV Geographic Information System Professional (GISP) Nevada State Water Right Surveyor Certified Federal Surveyor (CFedS) NCEES Model Law Surveyor Yandong Wang, PhD, CP Director Photogrammetric Engineering Pictometry International, Corp ASPRS Certified Photogrammetrist (CP) May 01, 2014 A Pictometry International, Corp White Paper
Transcript of Relative Measurement Accuracies within …my.eagleview.com/Portals/0/PortalContent/PDF/Relative...

100 Town Centre Drive | Rochester, NY 14623 | www.pictometry.com | 888.771.9714
Page 1 of 10
Relative Measurement Accuracies within Pictometry’s Individual Orthogonal and Oblique Frame Imagery©
Michael J. Zoltek VP Surveying & Mapping
Pictometry International, Corp
ASPRS Certified Photogrammetrist (CP) State Licensed Land Surveyor/Photogrammetrist
AL, AZ, CA, CT, FL, GA, ID, LA, MS, NC, NM, NV, NY, ND, OR, SC, SD, TN, TX, USVI, WA, WI, WV Geographic Information System Professional (GISP)
Nevada State Water Right Surveyor Certified Federal Surveyor (CFedS)
NCEES Model Law Surveyor
Yandong Wang, PhD, CP Director Photogrammetric Engineering
Pictometry International, Corp ASPRS Certified Photogrammetrist (CP)
May 01, 2014
A
Pictometry International, Corp
White Paper

100 Town Centre Drive | Rochester, NY 14623 | www.pictometry.com | 888.771.9714
Page 2 of 10
Contents
Contents ............................................................ 2
Glossary ............................................................ 2
Introduction ...................................................... 2
Problem Statement .......................................... 2
Conclusion ........................................................ 2
Equipment and Software ................................. 3
Collection procedures ..................................... 3
Standard Product Relative Measurement
Accuracies ........................................................ 6
Background .................................................... 6
Relative Measurement Accuracies in Oblique and Orthogonal Imagery ................................ 6
Summary ......................................................... 10
Relative Measurement Accuracies .............. 10
Glossary DEM Digital Elevation Model FOV Field Of View GPS Global Positioning System GSD Ground Sample Distance (a.k.a. Pixel
size) GSE Ground Surface Error IMU Inertial Measurement Unit SBET Smoothed Best Estimate Trajectory PDOP Positional Dilution of Precision USGS United States Geological Survey
Introduction This paper will outline the procedures used, and the results of, the relative measurement accuracy calculations performed for individually captured orthogonal and oblique imagery frames.
Problem Statement The goal of this paper is to provide a quantitative analysis of the relative measurement accuracies that can be obtained within individually captured orthogonal and oblique imagery frames.
Conclusion It can be conservatively stated that the relative measurement accuracies which can be achieved when carefully measuring well-defined features within Pictometry’s individually captured orthogonal and oblique frame imagery can be expressed in a simplified format as follows:
± (1.4 x GSD + 0.3% of distance measured)

100 Town Centre Drive | Rochester, NY 14623 | www.pictometry.com | 888.771.9714
Page 3 of 10
Equipment and Software Camera System Pictometry’s Pentaview and C6 camera systems are based on architecture designed and patented by Pictometry. The Pentaview camera system is a multi-camera system comprised of five digital camera modules and an acquisition computer (with sensor control hardware and software). The C6 system is comprised of six digital camera modules that includes two overlapping nadir (a.k.a. “ortho”) cameras allowing for an increased capture width and an acquisition computer (with sensor control hardware and software). Key components of the both systems are manufactured and assembled by qualified suppliers under contract to Pictometry. Individual subsystems of the Pentaview system are integrated and tested at Pictometry’s facilities in Rochester, NY. The finished camera systems are calibrated and tested in the laboratory at Pictometry’s facilities in Rochester, NY. Pictometry’s 16-megapixel Pentaview imaging system carries the United States Geological Survey (USGS) Camera Type Certification and comprises five custom designed cameras and an Applanix Position and Orientation System (POS) which includes both a Global Positioning System (GPS) antenna and an Inertial Measurement Unit (IMU). The five cameras are aimed with one looking nadir and four looking in each of the four cardinal oblique directions. Pictometry’s 29-megapixel Pentaview imaging system is constructed on the USGS approved platform and incorporates upgraded 29-megapixel sensors. Pictometry’s C6 imaging system is comprised of six custom designed cameras and an Applanix Position and Orientation System (POS) which includes both a Global Positioning System (GPS) antenna and an Inertial Measurement Unit (IMU). The six cameras are aimed with two cameras each looking 10 degrees from nadir (resulting in a ~33% overlap) and four looking in each of the four cardinal oblique directions. As part of the manufacture, Pictometry’s individual cameras are put through a rigorous calibration process developed by Pictometry and licensed to the USGS. This process is used to solve for the camera’s precise focal length, principal point location, and radial distortion coefficients. These parameters are then incorporated into the camera model. Each camera is also put through a color calibration process designed by Pictometry in order to ensure consistent response.
Collection procedures In advance of capturing the data, an additional aerial boresight calibration is performed on each of the systems involved in the project. An adjustment then is computed to solve for the alignment between the optical axis of the camera and the internal coordinate axes of the Inertial Measurement Unit (IMU). This adjustment is then applied to the imagery captured throughout the project. Each system completes a boresight flight at regular intervals to ensure that the sensors have stayed in alignment. Once the cameras are calibrated and the system is aligned, data capture can begin. Throughout each of the capture missions, GPS/IMU data is logged on the aircraft, the GPS data is recorded at a minimum rate of 2Hz and the IMU data is logged at a minimum rate of 200Hz. Concurrently, one or

100 Town Centre Drive | Rochester, NY 14623 | www.pictometry.com | 888.771.9714
Page 4 of 10
more GPS reference stations are logging data on the ground. These reference stations may be either part of the NGS CORS network, or a base station set up and run by Pictometry or a licensed Surveyor sub-consultant.

100 Town Centre Drive | Rochester, NY 14623 | www.pictometry.com | 888.771.9714
Page 5 of 10
The imagery is nominally captured with a PDOP value of less than 8.0 and no limitation on base line lengths other than being able to calculate a solution to the GPS vector. Due to the small format of Pictometry’s camera, and automatic aerial triangulation techniques available, Pictometry limits its sensor to 6 degrees of pitch and yaw; this limit can be utilized due to the narrow field of view of Pictometry’s cameras which, by design, limits the off-nadir distance of features at the edge of the frame. Applanix POSPac software is utilized to post process the GPS/IMU data utilizing the SmartBase (IN-fusion) or single base station technology. The SmartBase technology uses a centralized filter approach to combine the GPS receiver’s raw observables (psuedorange and phase observables) with the IMU data (tightly coupled solution). The Applanix SmartBase engine processes the raw observables (phase and psuedorange to each tracked satellite) from a minimum of four to a maximum of 50 continuously-working GPS reference stations surrounding the trajectory. The computed ionospheric, tropospheric, satellite clock, and orbital errors at all the reference stations are used to correct for the errors at the location of the remote receiver. The SmartBase Quality Check tool is utilized to perform a network adjustment on all the base-lines and reference stations in the network. Quality checks are also performed on the individual reference station observation files before the Applanix SmartBase is computed. The result of this process is that the integrity of the reference station’s data and coordinates are known before the data is processed. The single base technology is different as only one dedicated base station is used as a reference station and atmospheric delay and other correction data are only retrieved at the dedicated master station. The final smoothed best estimated trajectory (SBET) is computed from the GPS track (including Kalman Filtering). Once the trajectory has been generated, it is applied to the imagery along with the camera model utilizing either the SmartBase or single base station modes. Concurrent with the GPS/INS processing, the imagery in RAW format is “developed” to uncompressed TIFF format. After the development process, the imagery is put through a rigorous QA/QC process whereby images of low quality, due to either improper exposure or sensor artifact, are identified and marked for recapture. Pictometry uses both automated software it has created (proprietary) and human examination when considering whether to reject an image or pass it for production. Pictometry’s Image Processing Department checks for any of dozens of possible defects while assessing the quality of the imagery. The final approved imagery is put through a verification process wherein common points are compared in the images (tie-points). The calculated coordinates for each tie-point are then checked against those from the other tie-points of the same point in different images. Any anomalous points are investigated to ensure the tie-point is valid and the image data is reprocessed if necessary. .

100 Town Centre Drive | Rochester, NY 14623 | www.pictometry.com | 888.771.9714
Page 6 of 10
Standard Product Relative Measurement Accuracies
Background The relative measurement accuracy (between well-identified features) within an individual frame of Pictometry imagery depends on a number of factors. Among these are the accuracy of point location within the image, the accuracy of the digital elevation model (DEM) used for rectification, and the accuracy of the exposure station coordinates and orientation of the sensor at the time of the exposure (Exterior Orientation Parameters). The Position and Orientation System (POS) data provides the Exterior Orientation Parameters of the sensor at the time of exposure in a ground coordinate system. These parameters (commonly referred to as EOs) are primarily derived from the post-processed POS solution, the accuracy of which in turn depends upon the accuracy of the GPS reference station coordinates and the solved vector to the capture system. The absolute horizontal accuracy of individual pixels as measured within individual orthogonal frames is dependent primarily upon the accuracy of the POS solution. While absolute horizontal accuracy comes into play when making distance measurements across image frames, the absolute horizontal accuracy has minimal effect on the overall accuracy of distance measurements within a single image frame – the only impact is the correlation of the image to the digital elevation model. Since Pictometry’s absolute horizontal accuracy is typically less than the point spacing of the digital elevation model utilized, this contribution to error is negligible except in areas of extreme terrain variability. For distance measurements within an individual frame (relative measurements), absolute vertical errors have a larger contribution to measurement errors than do absolute horizontal errors. The primary effect of absolute vertical errors on relative measurements is to alter the effective scale of the image. Since this change of scale, as a percentage, is based on the amount of absolute vertical error divided by the height over ground at which the image was captured, even a larger absolute vertical error, such as is seen with publically available sources (typical GSE ±7m/±20 feet), results in a relatively minor contribution to error when compared to a typical flying altitude of 3,500-feet over ground.
Relative Measurement Accuracies in Oblique and Orthogonal Imagery The relative (measurement within a single frame) accuracy within individual orthogonal imagery frames is generally independent of the accuracy of an acceptable POS solution as the error in X, Y, and Z position only causes the shift of the image and will not propagate a significant error in ground measured distances within individual image frames. For oblique imagery an error in the X, Y, and Z position creates an error in the distance measurement due to the projection of the field of view across a DEM that contains some errors. Therefore the accuracy of DEM plays a very important role in determining the accuracy of distance measurement on Pictometry’s oblique imagery.
100 Town Centre Drive | Rochester, NY 14623 | www.pictometry.com | 888.771.9714
Page 7 of 10
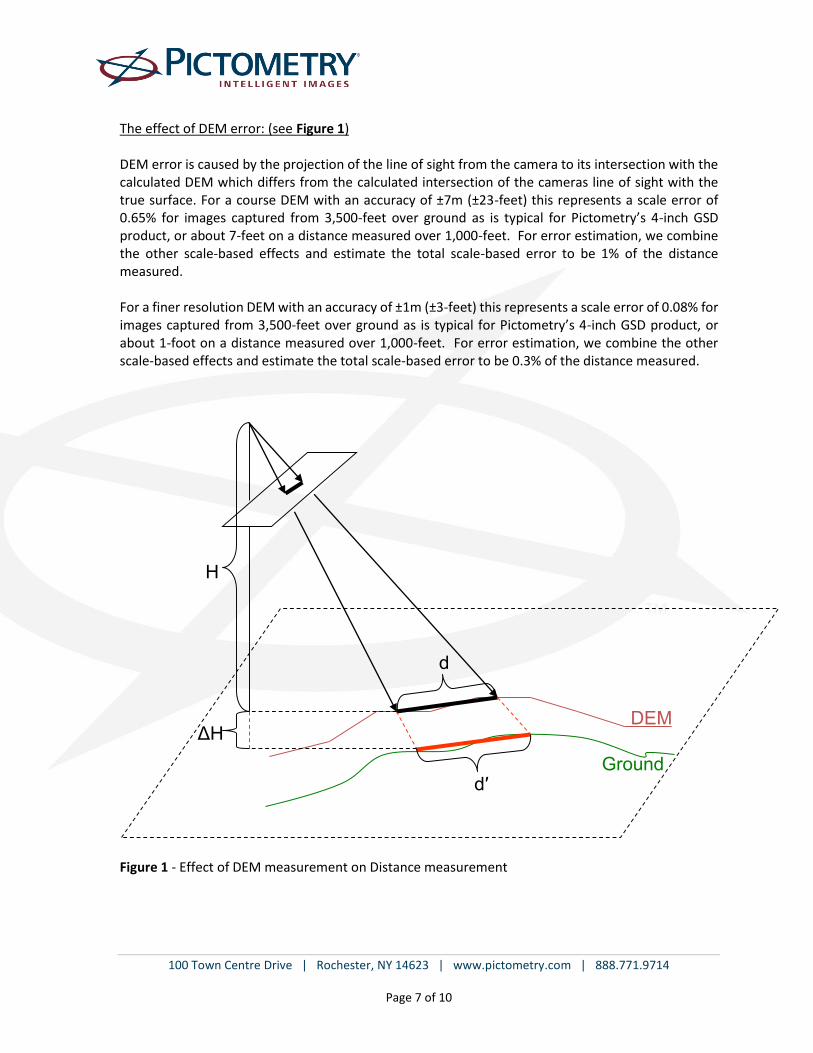
The effect of DEM error: (see Figure 1) DEM error is caused by the projection of the line of sight from the camera to its intersection with the calculated DEM which differs from the calculated intersection of the cameras line of sight with the true surface. For a course DEM with an accuracy of ±7m (±23-feet) this represents a scale error of 0.65% for images captured from 3,500-feet over ground as is typical for Pictometry’s 4-inch GSD product, or about 7-feet on a distance measured over 1,000-feet. For error estimation, we combine the other scale-based effects and estimate the total scale-based error to be 1% of the distance measured. For a finer resolution DEM with an accuracy of ±1m (±3-feet) this represents a scale error of 0.08% for images captured from 3,500-feet over ground as is typical for Pictometry’s 4-inch GSD product, or about 1-foot on a distance measured over 1,000-feet. For error estimation, we combine the other scale-based effects and estimate the total scale-based error to be 0.3% of the distance measured.
Figure 1 - Effect of DEM measurement on Distance measurement
d
d′
H
ΔH DEM
Ground
100 Town Centre Drive | Rochester, NY 14623 | www.pictometry.com | 888.771.9714
Page 8 of 10
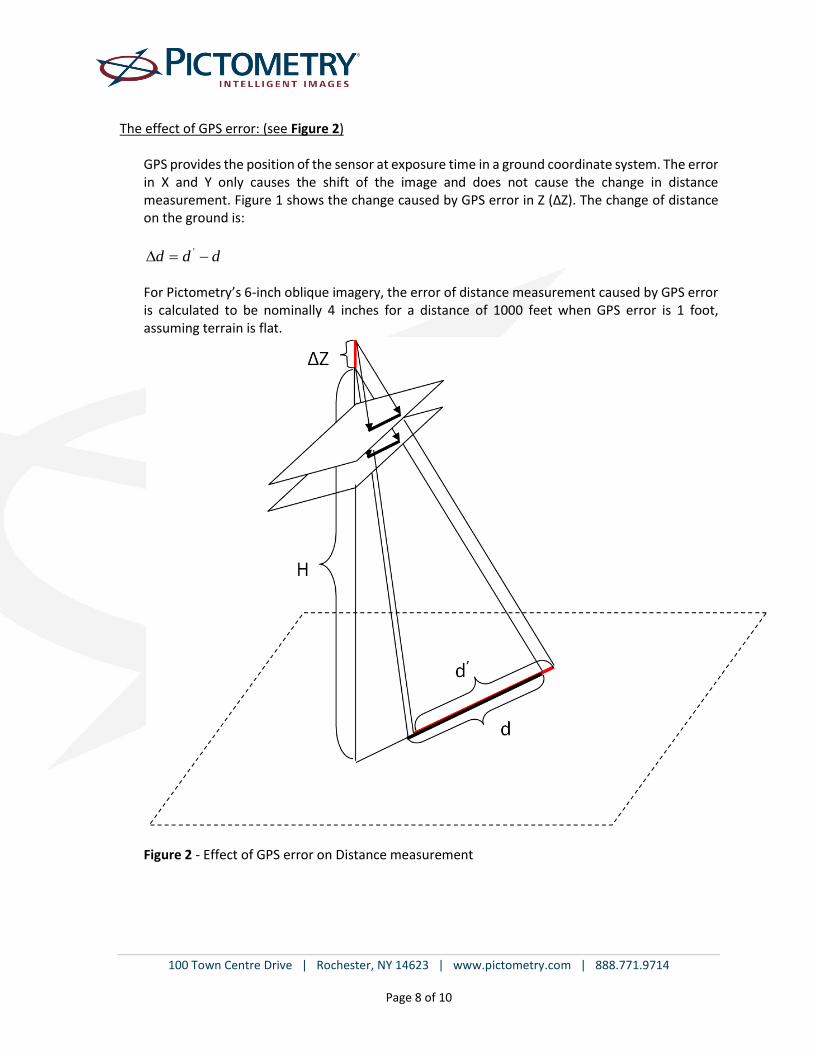
The effect of GPS error: (see Figure 2)
GPS provides the position of the sensor at exposure time in a ground coordinate system. The error in X and Y only causes the shift of the image and does not cause the change in distance measurement. Figure 1 shows the change caused by GPS error in Z (∆Z). The change of distance on the ground is:
ddd ' For Pictometry’s 6-inch oblique imagery, the error of distance measurement caused by GPS error is calculated to be nominally 4 inches for a distance of 1000 feet when GPS error is 1 foot, assuming terrain is flat.
Figure 2 - Effect of GPS error on Distance measurement
100 Town Centre Drive | Rochester, NY 14623 | www.pictometry.com | 888.771.9714
Page 9 of 10
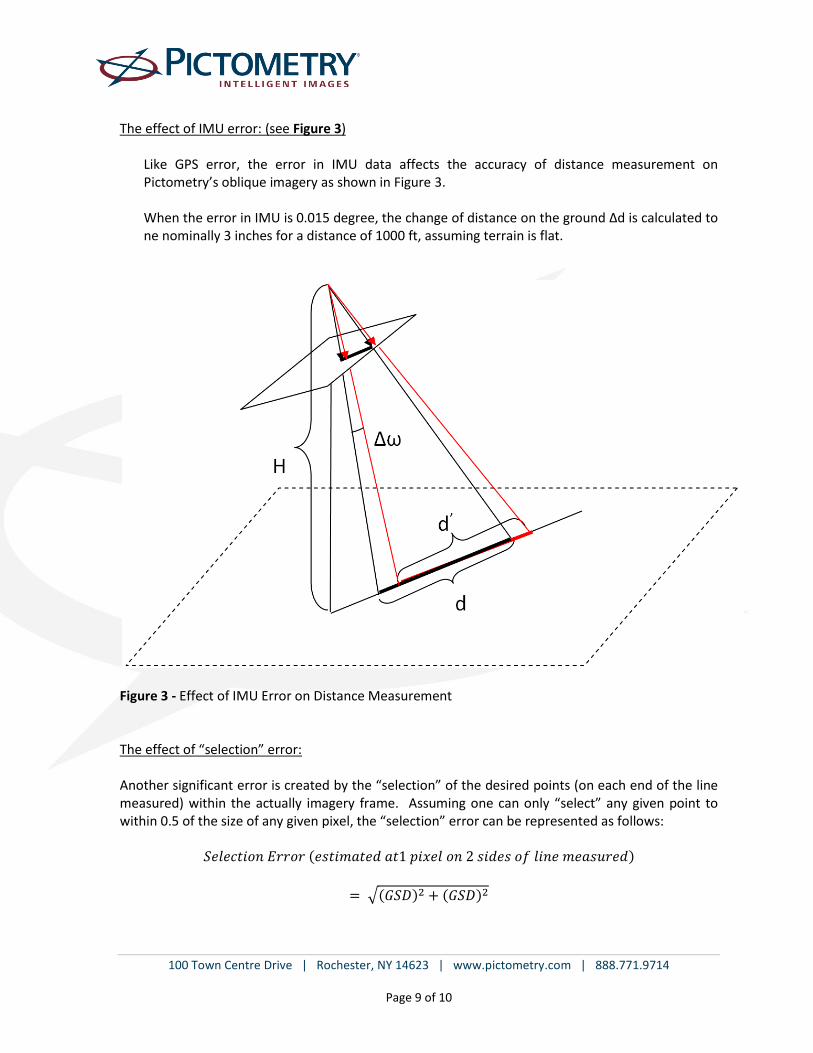
The effect of IMU error: (see Figure 3)
Like GPS error, the error in IMU data affects the accuracy of distance measurement on Pictometry’s oblique imagery as shown in Figure 3. When the error in IMU is 0.015 degree, the change of distance on the ground ∆d is calculated to ne nominally 3 inches for a distance of 1000 ft, assuming terrain is flat.
Figure 3 - Effect of IMU Error on Distance Measurement The effect of “selection” error: Another significant error is created by the “selection” of the desired points (on each end of the line measured) within the actually imagery frame. Assuming one can only “select” any given point to within 0.5 of the size of any given pixel, the “selection” error can be represented as follows:
𝑆𝑒𝑙𝑒𝑐𝑡𝑖𝑜𝑛 𝐸𝑟𝑟𝑜𝑟 (𝑒𝑠𝑡𝑖𝑚𝑎𝑡𝑒𝑑 𝑎𝑡1 𝑝𝑖𝑥𝑒𝑙 𝑜𝑛 2 𝑠𝑖𝑑𝑒𝑠 𝑜𝑓 𝑙𝑖𝑛𝑒 𝑚𝑒𝑎𝑠𝑢𝑟𝑒𝑑)
= √(𝐺𝑆𝐷)2 + (𝐺𝑆𝐷)2

100 Town Centre Drive | Rochester, NY 14623 | www.pictometry.com | 888.771.9714
Page 10 of 10
Summary The effect of GPS and IMU sources of error were found to have minimal contribution to the overall relative distance measurements errors when compared against the calculated DEM and selection errors. The accuracies of linear measurements within individually captured imagery frames can therefore be expressed as two main components; the selection error which is directly related to pixel size (GSD) and scale error which is related to the accuracy of the DEM and the length of the line measured. The selection error is a constant value based directly on the GSD of the imagery and is the most significant source of error in measurement of shorter distances. The scale error is directly related to the quality of the Digital Elevation Model (DEM) utilized and is the most significant source of error in measurements of long distances A standard error analysis formula can therefore be expressed by the following formula:
Distance error = √𝜎(𝑝𝑖𝑐𝑘𝑖𝑛𝑔 𝑒𝑟𝑟𝑜𝑟)2 + 𝜎(𝑠𝑐𝑎𝑙𝑒 𝑒𝑟𝑟𝑜𝑟)2
Relative Measurement Accuracies The relative measurement accuracies which can be achieved, when carefully measuring well-defined features within Pictometry’s individually captured orthogonal and oblique frame imagery, can be expressed in a simplified format as follows:
± (1.4 x GSD + 0.3% of distance measured) This equates to the following relative measurement accuracies for a DEM having an estimated error of ± 3 feet [1m]: 3-inch [7.5 cm] GSD Imagery = ± (0.35 feet [11 cm] + 0.3% of distance measured) 4-inch [10 cm] GSD Imagery = ± (0.47 feet [14 cm] + 0.3% of distance measured) 6-inch [15 cm] GSD Imagery = ± (0.70 feet [21 cm] + 0.3% of distance measured) 9-inch [22.5 cm] GSD Imagery = ± (1.05 feet [32 cm] + 0.3% of distance measured) 12-inch [30 cm] GSD Imagery = ± (1.40 feet [42 cm] + 0.3% of distance measured)


