RELATIONSHIPS BETWEEN INTEREST RATE CHANGES … · CHANGES AND STOCK RETURNS: INTERNATIONAL...
40
RELATIONSHIPS BETWEEN INTEREST RATE CHANGES AND STOCK RETURNS: INTERNATIONAL EVIDENCE USING A QUANTILE-ON-QUANTILE APPROACH Adrián Maizonada Benigno Trabajo de investigación 001/016 Master en Banca y Finanzas Cuantitativas Tutor: Dr. Román Ferrer Lapeña Universidad Complutense de Madrid Universidad del País Vasco Universidad de Valencia Universidad de Castilla-La Mancha www.finanzascuantitativas.com
Transcript of RELATIONSHIPS BETWEEN INTEREST RATE CHANGES … · CHANGES AND STOCK RETURNS: INTERNATIONAL...

RELATIONSHIPS BETWEEN INTEREST RATE
CHANGES AND STOCK RETURNS:
INTERNATIONAL EVIDENCE USING A
QUANTILE-ON-QUANTILE APPROACH
Adrián Maizonada Benigno
Trabajo de investigación 001/016
Master en Banca y Finanzas Cuantitativas
Tutor: Dr. Román Ferrer Lapeña
Universidad Complutense de Madrid
Universidad del País Vasco
Universidad de Valencia
Universidad de Castilla-La Mancha
www.finanzascuantitativas.com
1
Relationships between interest rate changes and stock returns: International
evidence using a quantile-on-quantile approach
Adrián Maizonada Benigno
Supervisor:
Román Ferrer Lapeña
Abstract
This paper empirically examines the linkage between changes in 10-year government
bond yields and stock returns for fourteen developed countries over the period 1999-
2015 using the quantile-on-quantile (QQ) approach. This methodology, recently
introduced by Sim and Zhou (2015), analyzes the effect that the quantiles of interest
rates have on the quantiles of stock market returns and, therefore, provides a suitable
framework for capturing the overall dependence structure between interest rate
fluctuations and stock returns.
The empirical results show a notable heterogeneity across countries in terms of the
stock market-interest rate link. In particular, the weakest relationship between 10-year
sovereign bond yield changes and equity returns is found for Australia, Germany,
Netherlands, the UK and the US. In contrast, the most pronounced interest rate-stock
market link is observed for the euro area peripheral countries most severely affected by
the European sovereign debt crisis, i.e. Greece, Ireland, Italy, Portugal and Spain.
Furthermore, the aforementioned relationship tends to be stronger during periods of
major financial turmoil such as the recent global financial crisis period. On the other
hand, the relationship between interest rate changes and stock market returns also
differs across quantiles. In this context, for most countries, interest rates exert a higher
exposition mainly during periods of extreme bearish conditions in the stock markets.
Likewise, negative interest rate shocks exert a larger influence on stock markets than
the positive ones, suggesting that the relationship between interest rates and equity
markets is asymmetric
Keywords: changes in interest rates, 10-year government bond yields, stock
returns, quantile-on-quantile approach (QQ), quantile regression

2
Contents
1. INTRODUCTION ........................................................................................................... 3
2. LITERATURE REVIEW ............................................................................................... 5
3. METHODOLOGY .......................................................................................................... 7
4. DATA DESCRIPTION ................................................................................................. 10
5. EMPIRICAL RESULTS ............................................................................................... 12
5.1. Estimates of the QQ approach for full sample ...................................................... 12
5.2. Estimates of the QQ approach during the global financial crisis sub-period ...... 15
5.3. Checking the QQ methodology ............................................................................. 16
6. CONCLUDING REMARKS ........................................................................................ 18
7. REFERENCES .............................................................................................................. 19
APPENDIX: .......................................................................................................................... 23

3
1. INTRODUCTION
The relationship between changes in interest rates and stock returns is a topic of
unquestionable relevance in the financial literature given its critical role in several key
areas of finance, such as asset allocation, risk management, risk diversification and
transmission of monetary policy. According to financial theory, interest rates influence
stock prices through several channels. First, movements in interest rates have a direct
effect on the discount rate used in standard equity valuation models, with the
subsequent impact on share prices. Second, interest rate fluctuations affect the cost of
financing of firms, especially those with a heavy debt burden, thus impacting expected
future corporate cash flows and, therefore, stock prices. Third, interest rate variations
can also influence stock prices through portfolio rebalancing strategies. For example, as
yields on fixed-income securities decline, stocks become more attractive compared to
bonds and investors may shift their money from bonds to equities in search of higher
yields, increasing demand for stocks and hence driving up their prices. In this regard,
according to survey evidence by Graham and Harvey (2001), interest rate risk is ranked
by U.S. firm managers as the second most relevant financial risk factor, only behind
credit risk. Furthermore, the stock market performance can also exert a significant
influence on interest rates. For instance, given the forward-looking nature of the stock
market, a sharp fall in stock prices can be interpreted as a signal of pessimism about
future economic prospects, which may eventually lead to a reduction in interest rates in
an effort to stimulate the economy.
The linkage between changes in interest rates and the value of firms and, hence, their
stock prices, has received a great deal of attention in the literature. Much of this
empirical research has focused on the banking industry due to the peculiar nature of the
financial intermediation business, as a large proportion of banks’ income and costs
depends directly on interest rates (Staikouras, 2003). Nevertheless, interest rate
fluctuations may also exert a notable influence on the value of nonfinancial
corporations, primarily because of their effect on the costs of financing and the market
value of financial assets and liabilities held by these companies.
The classical ordinary least squares (OLS hereafter) regression has been the most
commonly used approach to estimate interest rate exposure as the sensitivity of the
value of a firm, proxied by its stock return, to variations in interest rates. This standard
regression model describes the effect of the explanatory variables on the conditional
mean of the response variable. OLS is a very effective method to understand the central
tendency of the variable of interest. However, it loses much of its value when the
analysis tries to go beyond the mean value or toward the extremes of a data set. In
contrast, the quantile regression methodology developed by Koenker and Bassett (1978)
is an extension of the traditional OLS estimation of the conditional mean to a
compilation of models for different conditional quantile functions. This approach
analyzes the effect of the explanatory variables not only at the center but also at the tails
of the distribution of the variable of interest.

4
Nonetheless, there are some complexities in the relationship between interest rates and
stock returns that are difficult to analyze using OLS and quantile regression techniques.
For example, the effect of interest rate shocks on stock returns may be substantially
different when the stock market is bearish or bullish. The impact of large movements in
interest rates could be also different from the impact caused by small interest rate
movements. In addition, stock returns may also react asymmetrically to positive and
negative fluctuations in interest rates. Therefore, the effect of changes in interest rates
on stock returns may be heterogeneous, depending on the market conditions and the
nature and sign of interest rate shocks. The quantile-on-quantile (QQ hereafter)
methodology introduced by Sim and Zhou (2015) emerges as a particularly suitable
framework in this context as it estimates the overall dependence structure between
interest rate fluctuations and stock returns taking into account the conditions in the stock
market as well as the size and sign of interest rate changes.
The primary aim of this paper is to examine the linkage between changes in interest
rates and stock market returns for fourteen developed economies (Australia, Belgium,
France, Germany, Greece, Ireland, Italy, Japan, Netherlands, Norway, Portugal, Spain,
the United Kingdom and the United States of America) using the QQ approach. The QQ
framework combines quantile regression and nonparametric estimation techniques and
allows estimating the effects that the quantiles of interest rate changes have on the
quantiles of stock returns, thus providing a comprehensive characterization of the
overall dependence between both variables. The QQ analysis makes it possible to
uncover complex linkages between interest rates and stock markets that would be
difficult to detect using standard econometric techniques. In this sense, the QQ
approach is a very suitable method as nonlinear econometric techniques are becoming
increasingly important in the study of the relationship between interest rates and stock
prices.
This research contributes to the current literature in the following aspects. First, to the
best of our knowledge, this is the first study that explores the linkage between changes
in interest rates and stock returns through the application of the QQ methodology. The
relationship between interest rates and stock markets can be contingent on the stock
market cycle (bullish or bearish market) and the size and sign of interest rate shocks.
Therefore, this method is able to detect such asymmetries and may provide more
meaningful information to investors, portfolio managers and corporate managers.
Second, no previous study has been found examining the interest rate exposure on
equity markets in such a wide sample of countries.
This paper yields several noteworthy results. Firstly, the connection between interest
rate changes and stock returns varies considerably across quantiles and countries. In
particular, the relationship between interest rate variations and stock returns is weaker in
case of Australia, Germany, Netherlands, the UK and the US, which suggests a low
influence of interest rates on their respective stock markets. However, this relation
between interest rate changes and stock returns become stronger for Greece, Ireland,
Italy, Portugal and Spain, countries with a predominantly negative connection between
5
both variables. Secondly, the interest rate-stock market connection is not stable, as the
effect of interest rate changes on stock returns is consistently more prominent under
periods of strong turbulences in financial markets and, more concretely, during extreme
bearish conditions. In this regard, an asymmetric behavior in the interest rate-equity
market nexus is observed in this study, as decreases in interest rates have a major
impact on the stock market than hikes in interest rates.
The remainder of this paper is structured as follows. Section 2 provides a brief literature
review on the relationship between movements in interest rates and stock returns.
Section 3 introduces the key features of the QQ methodology. Section 4 describes the
data used in the empirical analysis. The main empirical results are reported and
discussed in Section 5. Finally, Section 6 offers some concluding remarks.
2. LITERATURE REVIEW
The relationship between changes in interest rates and stock returns has given rise to an
extensive body of research over the past few decades. The bulk of this literature has
concentrated on the banking industry due to the particularly interest rate sensitive nature
of the financial intermediation business. In fact, a large proportion of income and
expenses of banks is directly dependent on interest rates. Specifically, the typical
maturity mismatch or duration gap between banks’ financial assets and liabilities
resulting from the maturity transformation function of banking firms (i.e. the financing
of long-term loans with short-term deposits) is the most commonly suggested reason for
the high interest rate sensitivity of banks (Ballester et al., 2011; Elyasiani and Mansur,
1998; Staikouras, 2003 and 2006). This positive duration gap (i.e. the average duration
of banks’ assets typically exceeds the average duration of banks’ liabilities) implies that
increases in interest rates have a detrimental effect on the value of banks and vice versa.
This is because when interest rates rise, the market value of banks’ assets declines more
than that of banks’ liabilities and also the costs of banks’ liabilities go up faster than the
yields of banks’ assets. In this regard, Flannery and James (1984) conclude that the
interest rate sensitivity of bank stocks presents a systematic relationship with the
maturity structure of bank’s assets and liabilities; therefore, higher interest rate risk is
linked to financial institutions with greater duration gaps. Therefore, the relationship
between movements in interest rates and bank stock returns is expected to be negative.
However, movements in interest rates may also have a significant effect on the value of
nonfinancial companies through several channels. First, hikes in interest rates increase
debt service payments of firms and can also reduce the demand for products by heavily
indebted consumers, which means lower corporate profits and has a negative impact on
share prices. Second, within the framework of dividend discount models rises in interest
rates increase the cost of capital for firms. This causes an increase of the discount rate
used by investors and reduces the present value of future cash flows, thereby adversely

6
affecting firms’ equity prices. Third, changes in interest rates alter the market value of
financial assets and liabilities held by nonfinancial corporations. Finally, interest rate
fluctuations can favor the implementation of portfolio rebalancing strategies. As yields
on fixed-income securities decline, investors may shift into equities in search of higher
yields, increasing demand for equities and therefore their prices.
All these channels suggest an inverse connection between interest rate changes and
stock returns. Nevertheless, there are also some reasons that justify a positive
connection between these variables. First, interest rates and equity markets may move in
the same direction following changes in macroeconomic factors such as economic
prospects. Second, the existence of flight-to-quality effects from stocks to bonds in an
environment of increased financial market uncertainty, such as that in force during the
recent global financial crisis, may also have contributed to the emergence of a positive
relation between changes in bond yields and equity returns. Flight-to-quality occurs in
times of financial turmoil as investors move capital away from risky assets such as
stocks toward safer investments such as government bonds. This process leads to a
dramatic decrease in the yield on long-term government bonds because of the big
increase in the demand for this type of securities and generates a positive correlation
between changes in yields on sovereign bonds and stock returns.
Early studies in this field provided evidence of a significant negative relationship
between changes in interest rates and stock returns of both financial and nonfinancial
companies (Flannery and James, 1984; Dinenis and Staikouras, 1998; Lynge and
Zumwalt, 1980; Prasad and Rajan, 1995; Sweeney and Warga, 1986). However, some
more recent studies, such as those of Czaja et al. (2009), Korkeamäki (2011) and Reilly
et al. (2007), have shown that this relationship does not remain constant over time. In
particular, the interest rate-stock market link seems to exhibit a downward trend over
the last years, mainly due to the increased availability of improved tools for managing
interest rate risk. More specifically, the spectacular growth in interest rate derivative
markets and the expansion of European corporate bond markets as a result of the euro's
adoption may have played a key role in this respect. In addition, firms’ stock returns
tend to be more closely linked to movements in long-term interest rates than to
movements in short-term rates (Bartram, 2002; Czaja et al., 2009; Ferrer et al., 2010;
Olugbode et al., 2014).
So far, the empirical literature on the linkage between interest rates and stock returns
has developed primarily in the time domain by using a broad range of time series
methods, including linear regression (Korkeamäki, 2011; Reilly et al., 2007; Sweeney
and Warga, 1986), VAR models (Campbell and Ammer, 1993; Laopodis, 2010),
cointegration analysis (Chan et al., 1997; Hatemi-J and Roca, 2008), Granger causality
tests (Alaganar and Bhar, 2003; Shah et al., 2012), GARCH (generalized autoregressive
conditional heteroscedasticity) models (Elyasiani and Mansur, 1998; Verma and
Jackson, 2008) and nonlinear models (Ballester et al., 2011; Bartram, 2002). In
addition, two recent studies of Ferrando et al. (2016) and Jareño et al. (2016) have
examined the interest rate sensitivity of the Spanish and US stock market, respectively,
7
at the industry level applying the quantile regression methodology. These contributions
pay special attention to the effect of interest rate changes on stock returns under
different stock market conditions, i.e. in bullish, bearish or relatively stable stock
markets. However, no previous study has investigated the relationship between
quantiles of interest rate changes and quantiles of stock returns.
3. METHODOLOGY
In this section, the key features of the QQ approach developed by Sim and Zhou (2015)
as well as the model specification used in this study to examine the relationship between
changes in interest rates and stock returns are described.
From a methodological perspective, the OLS regression is indisputably the most
commonly used statistical technique in economic research to quantify relationships
among variables. This method describes how the conditional mean of a dependent
variable varies with the vector of covariates of independent variables under the
assumption of independent and identically distributed error terms. In essence, OLS
regression constitutes a very suitable method to understand the central tendency of the
variable of interest, although it is not efficient when the distribution of the dependent
variable is non-normal, with characteristics such as skewness, kurtosis or
heteroskedasticity.
The quantile regression approach, introduced by Koenker and Bassett (1978), goes one
step further from classical OLS estimation. The quantile regression enables analyzing
the effect of the explanatory variables not only at the center, but also at the different
quantiles (e.g., median and tails) of the distribution of the dependent variable. Thus, the
quantile regression framework allows a more comprehensive characterization of the
relationship between variables.
The QQ methodology can be seen as a generalization of the standard quantile regression
approach that allows the estimation of the effect of the quantiles of a variable on the
quantiles of another variable. The QQ approach is based on the combination of quantile
regression and nonparametric estimation. First, conventional quantile regression is
implemented to measure the effect of an explanatory variable on the different quantiles
of the dependent variable. Second, local linear regression is utilized to estimate the local
effect of a specific quantile of the explanatory variable on the dependent variable. The
local linear regression introduced by Stone (1977) and Cleveland (1979) avoids the
“curse of dimensionality” problem associated with purely nonparametric models, which
appears when the convergence of any estimator to the true value of a smooth function is
very slow if this function is defined in a high-dimensional space. The basic idea behind
this dimension reduction technique is to fit a linear regression locally around a
neighborhood of each data point in the sample, giving greater weight to closer
8
neighbors through a kernel to construct a weighted objective function. Thus, by
combining these two approaches it is possible to model the relationship between
quantiles of the explanatory variable and quantiles of the dependent variable, providing
a greater amount of information than alternative estimation techniques such as OLS or
standard quantile regression.
In the context of the present study, the QQ approach proposed to investigate the effect
of the quantiles of changes in interest rates on the quantiles of stock market returns of a
country has its starting point in the following nonparametric quantile regression model:
𝑅𝑡 = 𝛽𝜃(∆𝐼𝑡) + 𝑢𝑡𝜃 (1)
where 𝑅𝑡 denotes the stock market return of a given country in period t, ∆𝐼𝑡 is the
change in the interest rate in that country in period t, 𝜃 is the 𝜃 th quantile of the
conditional distribution of the stock return and 𝑢𝑡𝜃 is a quantile error term whose
conditional 𝜃th quantile is equal to zero. 𝛽𝜃(·) is an unknown function since we have
no prior information on how interest rate changes and stock returns are linked.
This quantile regression model measures the impact of movements in interest rates on
the distribution of stock market returns of a country whilst allowing the effect of interest
rate fluctuations to vary across different quantiles of stock returns. The main advantage
of this specification is its flexibility as no hypothesis is made about the functional form
of the relationship between bonds and indices. However, a shortcoming of the quantile
regression approach is its inability to capture dependence in its entirety. In this sense,
the quantile regression model does not take into account the possibility that the nature
of interest rate shocks may also influence the way in which interest rates and stock
returns are related. For instance, the effect of large, negative interest rate shocks can be
different from the effect of small, negative interest rate shocks. In addition, stock returns
can also react asymmetrically to negative and positive interest rate shocks.
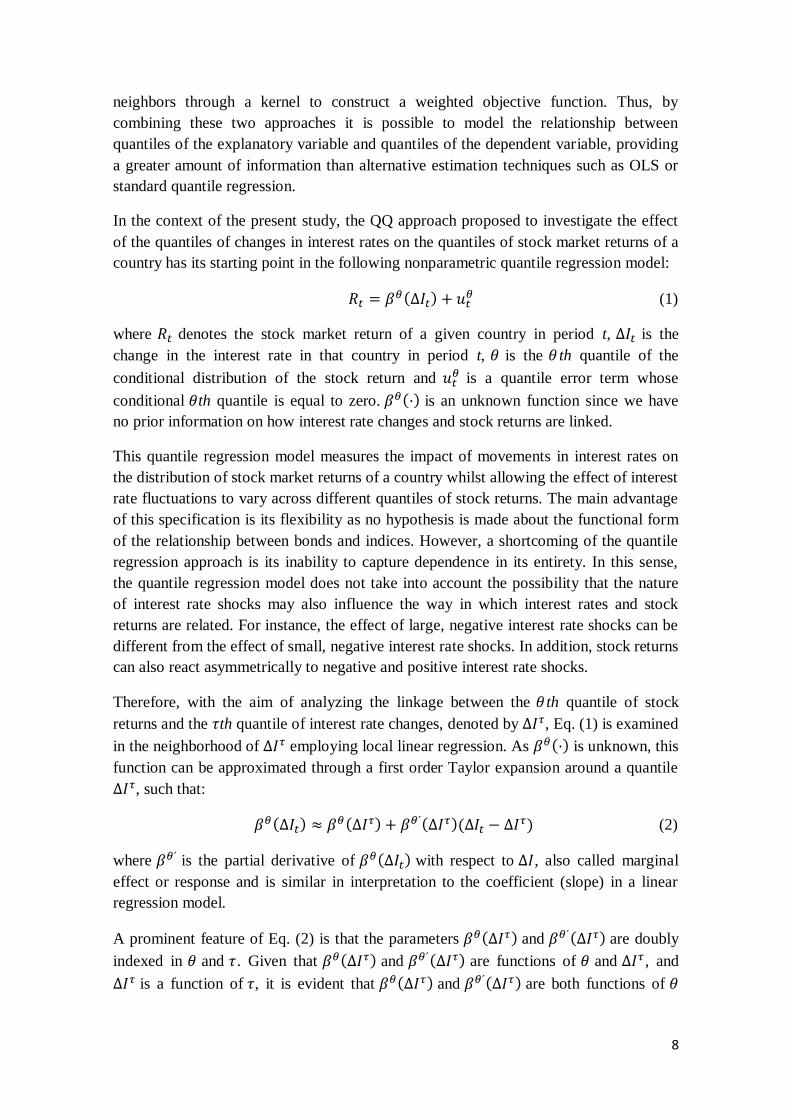
Therefore, with the aim of analyzing the linkage between the 𝜃 th quantile of stock
returns and the 𝜏th quantile of interest rate changes, denoted by ∆𝐼𝜏, Eq. (1) is examined
in the neighborhood of ∆𝐼𝜏 employing local linear regression. As 𝛽𝜃(·) is unknown, this
function can be approximated through a first order Taylor expansion around a quantile
∆𝐼𝜏, such that:
𝛽𝜃(∆𝐼𝑡) ≈ 𝛽𝜃(∆𝐼𝜏) + 𝛽𝜃´(∆𝐼𝜏)(∆𝐼𝑡 − ∆𝐼𝜏) (2)
where 𝛽𝜃´ is the partial derivative of 𝛽𝜃(∆𝐼𝑡) with respect to ∆𝐼, also called marginal
effect or response and is similar in interpretation to the coefficient (slope) in a linear
regression model.
A prominent feature of Eq. (2) is that the parameters 𝛽𝜃(∆𝐼𝜏) and 𝛽𝜃´(∆𝐼𝜏) are doubly
indexed in 𝜃 and 𝜏. Given that 𝛽𝜃(∆𝐼𝜏) and 𝛽𝜃´(∆𝐼𝜏) are functions of 𝜃 and ∆𝐼𝜏 , and
∆𝐼𝜏 is a function of 𝜏, it is evident that 𝛽𝜃(∆𝐼𝜏) and 𝛽𝜃´(∆𝐼𝜏) are both functions of 𝜃

9
and 𝜏 . Moreover, 𝛽𝜃(∆𝐼𝜏) and 𝛽𝜃´(∆𝐼𝜏) can be renamed as 𝛽0(𝜃, 𝜏) and 𝛽1(𝜃, 𝜏) ,
respectively. Consequently, Eq. (2) can be rewritten as:
𝛽𝜃(∆𝐼𝑡) ≈ 𝛽0(𝜃, 𝜏) + 𝛽1(𝜃, 𝜏)(∆𝐼𝑡 − ∆𝐼𝜏) (3)
By replacing Eq. (3) in Eq. (1), the following equation is achieved:
𝑅𝑡 = 𝛽0(𝜃, 𝜏) + 𝛽1(𝜃, 𝜏)(∆𝐼𝑡 − ∆𝐼𝜏) + 𝑢𝑡𝜃 (4)
As can be seen, the part (*) of Eq. (4) is the 𝜃th conditional quantile of the stock return.
However, unlike the standard conditional quantile function, this expression shows the
relationship between the 𝜃th quantile of the stock return and the 𝜏th quantile of interest
rate changes since the parameters 𝛽0 and 𝛽1 are doubly indexed in 𝜃 and 𝜏 . These
parameters may vary across different 𝜃th quantiles of stock returns and 𝜏th quantiles of
interest rate changes. Furthermore, at no time a linear relationship is assumed between
the quantiles of the variables under study. Therefore, Eq. (4) estimates the overall
dependence structure between equity returns and movements in interest rates through
the dependence between their respective distributions.
To estimate Eq. (4), it is required to substitute ∆𝐼𝑡 and ∆𝐼𝜏 by its estimated counterparts
∆�̂�𝑡 and ∆�̂�𝜏, respectively. The local linear regression estimates of the parameters 𝑏0 and
𝑏1 , which are the estimates of 𝛽0 and 𝛽1 , are obtained by solving the following
minimization problem:
min𝑏0,𝑏1∑ 𝜌𝜃[𝑅𝑡
𝑛𝑖=1 − 𝑏0 − 𝑏1(∆�̂�𝑡 − ∆�̂�𝜏)]𝐾(
𝐹𝑛(∆�̂�𝑡)−𝜏
ℎ) (5)
where 𝜌𝜃(𝑢) is the quantile loss function, defined as 𝜌𝜃(𝑢) = 𝑢(𝜃 − 𝐼(𝑢 < 0)) being I
the usual indicator function. 𝐾(·) denotes the kernel function and h is the bandwidth
parameter of the kernel.
The Gaussian kernel, which is one of the most popular kernel functions in economic and
financial applications because of its computational simplicity and efficiency, is used in
this study to weight the observations in the neighborhood of ∆𝐼𝜏. The Gaussian kernel is
symmetric around zero and assigns low weights to observations further away.
Specifically, in our analysis these weights are inversely related to the distance between
the empirical distribution function of ∆�̂�𝑡, denoted by 𝐹𝑛(∆�̂�𝑡)= 1
𝑛∑ 𝐼(∆𝐼�̂�
𝑛𝑘=1 < ∆𝐼�̂�) and
the value of the distribution function that corresponds with the quantile ∆𝐼𝜏, denoted by
𝜏.
The choice of the bandwidth is critical when using nonparametric estimation
techniques. The bandwidth determines the size of the neighborhood around the target
point and, therefore, it controls the smoothness of the resulting estimate. The larger the
(*)
10
bandwidth, the bigger the potential for bias in estimates, while a smaller bandwidth can
lead to estimates with higher variance. Thus, a bandwidth that strikes a balance between
bias and variance must be chosen. Following Sim and Zhou (2015), a bandwidth
parameter ℎ = 0.05 is employed in this study 1.
4. DATA DESCRIPTION
The dataset in this study consists of yields on 10-year government bonds and stock
market indices of fourteen developed countries, which can be classified into four
different groups: (1) Countries in the periphery of the euro area (Greece, Ireland, Italy,
Portugal and Spain); (2) A set of countries belonging to the core of the euro area
(Belgium, France, Germany and the Netherlands); (3) Two non-eurozone members
(Norway and the UK); (4) A number of non-European countries which includes some of
the major economies in the world (Australia, Japan and the US). The sample period
extends from January 1999 to December 2015.
In order to assess whether the interest rate-stock market link has remarkably changed
during some major economic events such as the global financial crisis started in 2008 or
the subsequent European sovereign debt crisis, we also examine the relationship
between changes in interest rates and stock returns during the financial crisis sub-period
(see Section 5.2). In particular, the global financial crisis sub-period covers from
September 2008 to September 2012. The beginning of this period coincides with the
Lehman Brothers collapse in September 20082 and the date of the end coincides with
the statement of Mario Draghi, President of the European Central Bank (ECB hereafter),
in September 2012, announcing the intention of the ECB to make any effort to support
the euro3
. The stock indices considered are the ASX 200 (Australia), BEL 20
(Belgium), CAC 40 (France), DAX 30 (Germany), FTSE ATHEX 20 (Greece), ISEQ
(Ireland), FTSE MIB (Italy), NIKKEI (Japan), AEX (the Netherlands), OSEBX
(Norway), PSI 20 (Portugal), IBEX 35 (Spain), FTSE 100 (the UK) and S&P 500 (the
US).
1 Different values of the bandwidth have been also considered and the results of the estimation remain
qualitatively the same. 2 The bankruptcy of Lehman Brothers on 15 September 2008 was an alarm signal of the transmission of the financial crisis from the US to all over the world and caused a wave of global panic across financial
markets. In fact, Bartram and Bodnar (2009) and Bessler and Kurmann (2014), among others, also
consider this date as a key milestone event in the recent global financial crisis. 3 ECB president Mario Draghi’s declaration in July 2012 that the ECB was ready to do whatever it takes
to preserve the euro marked a key turning point in the European sovereign debt crisis. In September 2012
the OMT program was officially launched, under which the ECB committed to purchasing unlimited
amounts of government bonds of distressed Eurozone countries, provided they agreed to undertake fiscal
and economic reforms. In fact, the mere announcement of the OMT program caused a considerable
reduction in Spanish and Italian yields across the entire yield curve and particularly at the short end.

11
The interest rates used in this study are the yields on 10-year government bonds. This
choice has become increasingly popular in the literature on stock-bond nexus (Ballester
et al., 2011; Elyasiani and Mansur, 1998; Faff et al., 2005; Oertmann et al., 2000) and is
supported by the following arguments. First, 10-year interest rates contain market
expectations about future prospects for the economy and largely determine the cost of
borrowing funds. Thus, long-term rates are likely to have a critical influence on
investment decisions and profitability of firms and, hence, on their stock market
performance. Second, long-term government bonds are sometimes considered as closer
maturity substitutes to stocks, which may presumably increase the extent of linkage
between the two financial assets. Both stock returns and interest rate changes for each
country are calculated as the first logarithmic difference of two consecutive
observations. All data series have been collected from Thomson Financial Datastream.
Along the lines of, among others, Flannery and James (1984), Hirtle (1997), Olugbode
et al. (2014) and Shamsuddin (2014), weekly data series (Wednesday to Wednesday)
are employed (a total of 887 weekly observations)4. Wednesday’s data are used in order
to avoid the weekend effect. Weekly frequency is preferred over daily and monthly
frequencies for several reasons. Firstly, daily data are more contaminated by noise
associated with higher frequency data and anomalies such as day-of-the-week effects or
non-synchronous trading bias for less actively traded stocks than weekly observations
(Arouri, 2012). Secondly, compared to monthly data, the weekly frequency provides a
number of observations large enough to yield more reliable results.
[INSERT TABLE 1 HERE]
Summary descriptive statistics for the variables used in the analysis are reported in
Table 1. The averages of both weekly stock market returns and 10-year government
bond yield changes are close to zero in the great majority of cases and small relative to
their standard deviations, which implies relatively high volatility in both markets. Stock
returns tend to have negative skewness, while 10-year bond rate fluctuations tend to
have positive skewness, indicating that the respective distributions are non-symmetric.
Furthermore, all the series have positive kurtosis coefficients in excess of three,
suggesting the existence of heavy tails compared to a normal distribution. This
leptokurtic behavior confirms a typical result from empirical literature according to
which financial return distributions exhibit fatter tails than the normal distribution. The
Jarque-Bera statistics confirm this result, rejecting the null hypothesis of normality for
stock market returns and changes in 10-year bond interest rates of all countries at the
1% significance level. In order to determine the order of integration of the variables, the
conventional Augmented Dickey-Fuller (ADF) and Phillips-Perron (PP) unit root tests
and the Kwiatkowski-Phillips-Schmidt-Shin (KPSS) stationarity test are conducted. All
4 It is worth noting that data on Greek 10-year government bond yields are available from April 1999.
Therefore, in the special case of Greece, a total of 872 weekly observations are utilized.
12
tests indicate that the series of stock returns as well as those of changes in 10-year
government bond yields are stationary (integrated of order zero) at the 1% level.
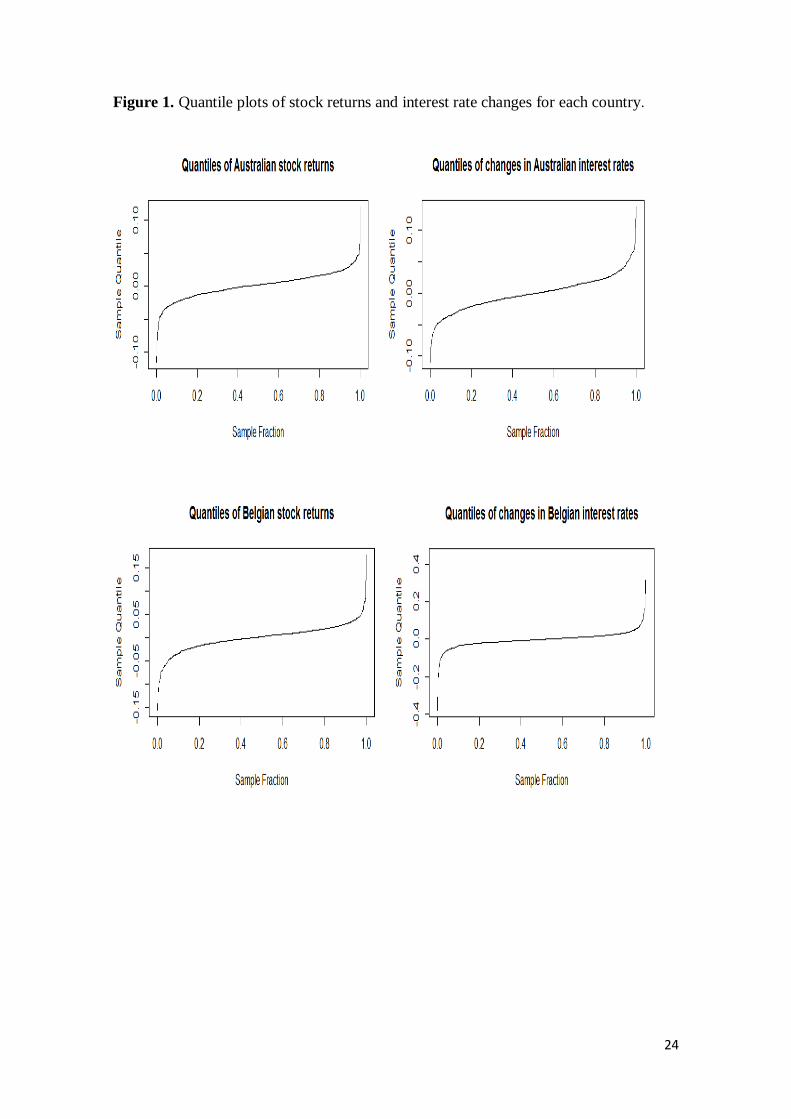
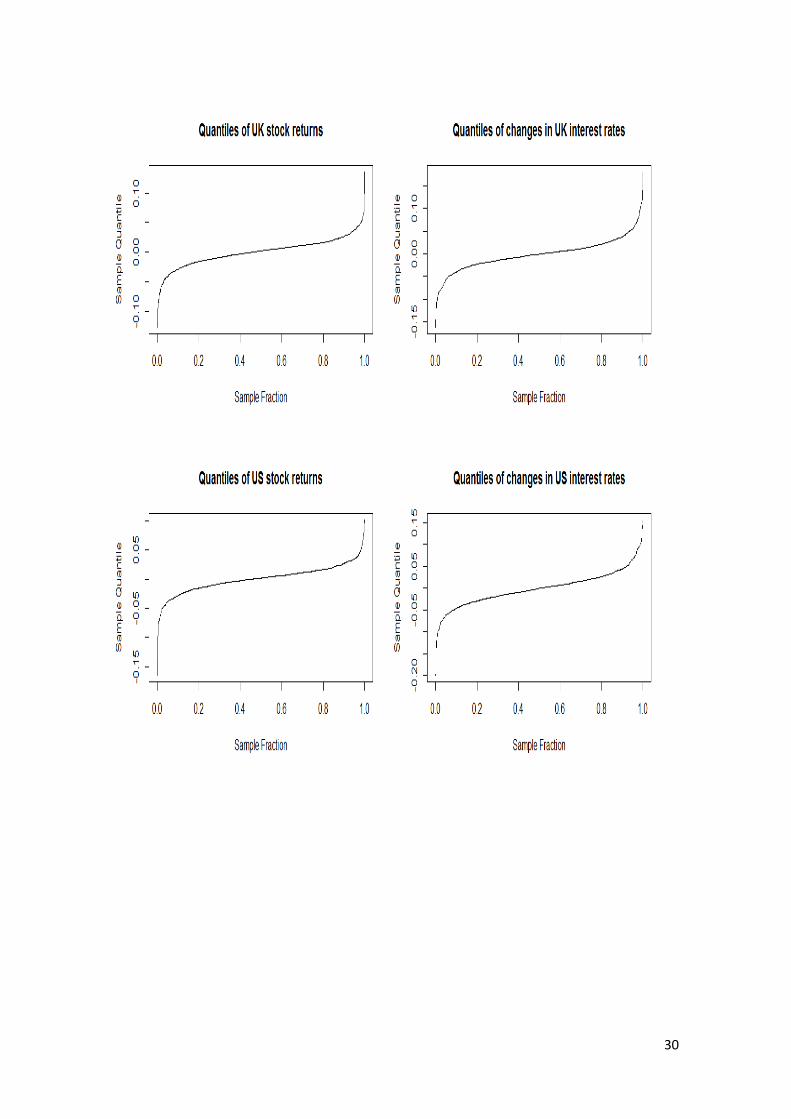
In order to facilitate the interpretation of the quantiles of interest rate changes and stock
returns, Figure 1 in Appendix plots the simple quantile associated to each quantile of
changes in interest rates and stock returns for all countries considered. It can be seen
that stock returns below the 40th percentile are negative for the vast majority of
countries. Hence, the lower quantiles of stock returns are indicative of a bearish stock
market and vice versa. Similarly, changes in interest rates below the 50th percent
represent interest rate falls for most countries.
[INSERT FIGURE 1 HERE]
5. EMPIRICAL RESULTS
5.1. Estimates of the QQ approach for full sample
This section presents the main results of the QQ analysis between changes in 10-year
sovereign bond yields and stock returns for the fourteen countries under consideration
over the whole sample period. Figure 2 (a-n) displays the estimates of the slope
coefficient, 𝛽1(𝜃, 𝜏) , which captures the impact of the 𝜏 th quantile of interest rate
changes on the 𝜃th quantile of stock returns, at different values of 𝜏 and 𝜃, for each
country.
[INSERT FIGURE 2 HERE]
Several interesting results emerge from graphs in Figure 2. First, there is a considerable
heterogeneity across countries in terms of the stock market-interest rate nexus. This
finding is probably due to differences among countries concerning the level of
indebtedness of the economy, the relative weight of the sectors most interest rate
sensitive (i.e. Utilities and Banking) within the stock market of each country, the degree
of development of financial derivative markets and the level of interest rates. Second,
within each country, notable variations in the slope coefficient are observed across
different quantiles of movements in interest rates and stock returns. This finding
suggests that the linkage between interest rate fluctuations and stock returns is not
uniform across quantiles, but this relationship depends on both the sign and size of
interest rate changes, as well as on the specific cycle of the stock market.
There is a large set of countries, including Australia, France, Germany, Netherlands,
Japan, Norway, the UK and the US, where the connection between movements in 10-

13
year government bond yields and stock returns is quite weak. For all these countries, it
is shown that the coefficients measuring the linkage between changes in interest rates
and stock returns take very low values for the vast majority of combinations of quantiles
of both variables. In the Australian case, a relatively pronounced positive relationship
appears only in the area which combines the lowest quantiles of interest rate
fluctuations (0.05-0.10) with the lowest quantiles of equity returns (0.05-0.10). This
result suggests that strong falls in 10-year government bond yields have a significant
detrimental effect on Australian stock returns under extreme bearish conditions in the
Australian equity market. A possible explanation for this finding is that sharp decreases
in interest rates in a bearish market environment are interpreted by the market as a
signal of economic slowdown, which exacerbates the decline in the stock market. For
Netherlands, the only exception to the generally poor interest rate-equity market link is
found in the area combining low quantiles of interest rate changes (0.25-0.30) with the
lowest quantiles of stock returns (0.05-0.15). In particular, a negative relationship is
observed in this region, indicating that moderate decreases in interest rates have a
beneficial impact on the Dutch stock market during strongly bearish conditions. This
finding may be interpreted in the sense that moderate falls in interest rates are well
received by the stock market as they imply a reduction in the cost of financing for firms.
Concerning Germany, the relationship between movements in interest rates and stock
returns is also generally quite weak, although the sign of the connection varies
significantly across quantiles.
It can be seen that France, Japan, Norway, the UK and the US exhibit a similar pattern
of connection between changes in 10-year government bond yields and stock returns,
which is characterized by the low interest rate-stock market link and a predominantly
positive sign for the aforementioned relationship across most quantiles. In the French
case, the strongest positive linkage manifests in the area that combines the intermediate
quantiles of changes in interest rates (0.55-0.60) with the highest quantiles of stock
returns (0.90-0.95). This means that small increases in interest rates during periods of
extreme bullish conditions are interpreted as a sign of economic strength and further
bolster the French equity market. For Japan the connection between interest rates and
stock market is mainly positive, although the most pronounced relationship is negative
and located in the area combining the lowest quantiles of interest rate variations (0.05-
0.10) with the lowest quantiles of stock returns (0.05-0.10). This result indicates that
strong falls in interest rates have a beneficial effect on the Japanese equity market
during periods of extreme bearish conditions. A possible explanation is that extreme
reductions in interest rates are favorably received by the stock market insofar as they
imply a notable decrease in the financing cost for companies. In the case of Norway, the
more pronounced positive relationship is observed in the area that combines lower to
intermediate quantiles of changes in 10-year government bond yields (0.25-0.50) with
the lowest quantile of stock returns (0.05). This result means that moderate falls in
interest rates exert a negative influence on the Norwegian stock market under extreme
bearish conditions, suggesting that declines in interest rates in periods of significantly
falling stock markets may be viewed by the stock market as a symptom of deterioration

14
of the economy, with the subsequent negative effect on the equity market. In addition,
for the UK the more pronounced linkage is found in the area combining the highest
quantiles of interest rate changes (0.80-0.90) and the highest quantile of stock returns
(0.95). This positive relationship implies that extreme increases in interest rates have a
positive influence on the stock market during extreme bullish conditions. This result
may be explained by the fact that sharp rises in interest rates are considered by the stock
market as signal of economic expansion, which accentuates the stock market boom.
Regarding the US case, two remarkable areas of relatively important connection
between 10-year government bond yield fluctuations and stock returns are found. First,
a pronounced positive relationship appears in areas which combine the lowest quantiles
of interest rate changes (0.05-0.15) with the lowest quantiles of stock returns (0.10-
0.30). This finding indicates that large negative interest rate changes have a detrimental
effect on the US stock market in extreme bearish periods. This implies that extreme
drops in interest rates are conceived by the market as an anticipation of the upcoming
decline of the economy, which strengthens the pessimistic expectations of the equity
market. Second, despite the linkage between interest rate variations and stock returns is
mainly positive for the US, a significant negative connection is also found in the area
combining the lowest quantiles of 10-year interest rate variations (0.05-0.15) with the
highest quantiles of stock returns (0.90-0.95). This means that strong falls in interest
rates involving a drastic reduction in the financing cost for firms further boost the stock
market in extreme bullish conditions.
For Belgium, the interest rate-stock market linkage is slightly stronger compared to
previous countries and the sign of this connection varies substantially across quantiles.
However, the most pronounced relationship has negative sign and is observed in the
area that combines higher quantiles of interest rate changes (0.80) with higher quantiles
of stock returns (0.65-0.85). This result indicates that strong increases in interest rates
have a detrimental effect on the Belgian stock market under strong bullish conditions. A
possible explanation for this finding is related to the fact that sharp rises in interest rates
imply an increase in the cost of financing for companies. This is interpreted as a bad
news in a bullish environment, affecting negatively the stock market performance.
On the contrary, a wide range of countries, made up of Portugal, Greece, Ireland, Italy
and Spain, show a stronger connection between changes in 10-year government bond
yields and stock returns compared to that of the previous countries. Moreover, for
almost all these countries the most pronounced interest rate-stock market link has
positive sign, is observed during strong bearish conditions in the equity market and can
be related to the prospects of slowdown or improvement in the economy. For Portugal,
the most significant linkage between 10-year interest rate fluctuations and stock returns
has negative sign and is located in the area combining the highest quantiles of interest
rate variations (0.90-0.95) with the lowest quantiles of stock returns (0.10-0.20),
suggesting that strong rises in interest rates cause a negative impact on the Portuguese
stock market in extreme bearish conditions. A possible explanation may be that sharp
increases in interest rates imply a rise in the costs of financing for corporations, which

15
consequently exerts a negative impact on the stock market during periods of strong falls
in the stock market. For Greece, the most remarkable connection between interest rate
variations and stock returns is positive and takes place in the area that combines the
highest quantiles of interest rate changes (0.90-0.95) with the lowest quantiles of stock
returns (0.05-0.20), which implies that strong increases in interest rates exert a
beneficial impact on the stock market during extreme bearish conditions. This finding
may be explained by the fact that sharp rises in interest rates are viewed by the market
as a clear sign of economic recovery, which enhances the performance of the equity
market. In the Irish case, the most pronounced positive linkage between yield changes
and stock returns appears in the area that combines a high quantile of interest rate
changes (0.75) with lower quantiles of stock returns (0.15-0.35), indicating that notable
rises in interest rates exert a favorable effect on the Irish stock market in periods of
significant decline in the stock market. This means that strong increases in interest rates
are perceived as a sign of economic recovery when the stock market is declining. For
Italy, the most meaningful positive relation between both variables is found in the area
that combines the lowest quantiles of interest rate changes (0.05-0.15) with the lowest
quantiles of stock returns (0.05-0.20), noting that strong falls in interest rates have a
detrimental effect on the Italian stock market under extreme bearish conditions. This
finding may be explained by the fact that sharp decreases in interest rates are considered
by the market as an accentuation of the economic deterioration, which aggravates the
decline of the stock market. Finally, the most significant positive connection between
interest rate variations and stock returns in Spain is found in the area that combines the
lowest quantile of interest rate changes (0.05) with the highest quantiles of stock returns
(0.85-0.95), implying that strong falls in interest rates exert an adverse impact on the
Spanish stock market under extreme bullish conditions. This suggests that sharp
decreases in interest rates are conceived by the market as a potential deterioration of the
economy, thus, affecting negatively the equity market. Another remarkable positive
linkage between both variables is observed in the area that combines the lowest quantile
of interest rate fluctuations (0.05) with low quantiles of stock returns (0.20-0.35). This
result indicates that strong falls in interest rates have a detrimental effect on the Spanish
stock market when it is falling. A possible explanation is that sharp decreases in interest
rates anticipate the deterioration of the economy and potentiate the decline of the equity
market.
5.2. Estimates of the QQ approach during the global financial crisis sub-period
This section reports the estimation results of the QQ approach for the period of the
global financial crisis (September 2008 to September 2012) in order to assess whether
the most significant linkage between changes in 10-year government bond yields and
stock returns may be associated to this sub-period, which is characterized by major
turbulences in international financial markets. Figure 3 plots the estimates of the slope
coefficient, 𝛽1(𝜃, 𝜏), at different values of 𝜏 and 𝜃, corresponding to this sub-period.
16
[INSERT FIGURE 3 HERE]
Several interesting results emerge from graphs in Figure 3. Firstly, the relationship
between movements in 10-year sovereign bond yields and stock returns tends to be
more pronounced for almost all countries during the financial crisis period than during
the overall sample. In particular, the magnitude of coefficient estimates is higher (in
absolute value) across most quantiles of both variables for the vast majority of countries
when considering the global financial crisis sub-period. This finding suggests that the
interdependence between interest rates and stock markets is greater during times of
significant financial turmoil than during relatively stable periods. However, it is worth
noting that the results for the financial crisis period are largely consistent with those of
the full sample period regarding the heterogeneity among countries and the countries
with higher and lower connection between changes in 10-year interest rates and equity
returns. Secondly, the most significant interest rate-stock market link during the
financial crisis period takes positive values for most countries. In fact, Greece, Ireland
and Portugal, that is, the three countries most affected by the European debt crisis since
the end of 2009, are the only exceptions to this result. Interestingly, for these three
countries the strongest linkage takes place in the highest quantiles of interest rate
changes (0.90-0.95) and has negative sign, indicating that strong increases in interest
rates of sovereign debt of these countries in the context of the euro area sovereign debt
crisis had a very harmful effect on their stock markets. In addition, for most countries
the more pronounced relationship during this sub-period is found for the lowest
quantiles of interest rate changes and the lowest quantiles of stock returns. This finding
implies that the more intense interest rate-equity market link tends to be associated with
strong falls in interest rates and extreme bearish conditions in the stock market.
5.3. Checking the QQ methodology
The QQ approach can be seen as a technique that “descomposes” the estimates of the
standard quantile regression model, allowing to obtain specific estimates for the
different quantiles of the explanatory variable. In the framework of the present study,
the quantile regression model is based on regressing the 𝜃𝑡ℎ quantile of stock returns on
10-year sovereign bond yield changes and, hence, the quantile regression parameters are
only indexed by 𝜃. Nonetheless, as pointed out earlier, the QQ method regresses the 𝜃𝑡ℎ
quantile of stock returns on the 𝜏𝑡ℎ quantile of interest rate changes and, therefore, the
QQ parameters will be indexed by both 𝜃 and 𝜏. Thus, the QQ framework contains
more disaggregated information about the stock market-interest rate nexus than the
quantile regression model as this linkage is viewed by the QQ approach as potentially
heterogeneous across different quantiles of interest rates.

17
Given this property of decomposition inherent to the QQ approach, it is possible to use
the QQ estimates to recover the estimates of the standard quantile regression.
Specifically, the quantile regression parameters, which are only indexed by 𝜃, can be
replicated by averaging the estimated QQ parameters along τ. For example, the slope
coefficient of the quantile regression model, which measures the effect of changes in
10-year sovereign bond yields on the distribution of stock returns and is denoted by
𝛾1(𝜃), can be obtained as follows:
𝛾1(𝜃) ≡ �̅̂�1(𝜃) =1
𝑆∑ �̂�1(𝜃, 𝜏)𝜏 (6)
where 𝑆 = 19 is the number of quantiles 𝜏 = [0.05, 0.10, … , 0.95] considered.
In this context, a simple way of checking the validity of the QQ approach is to compare
the estimated quantile regression parameters with the 𝜏-averaged QQ parameters. Figure
4 plots the quantile regression and averaged QQ estimates of the slope coefficient that
measures the effect of changes in yields on 10-year sovereign bonds on stock returns for
all the countries under scrutiny over the entire sample period.
[INSERT FIGURE 4 HERE]
The graphs in Figure 4 (a-n) reveal that the averaged QQ estimates of the slope
coefficient are very similar to the quantile regression estimates regardless of the quantile
considered for the different countries. Thus, this graphical evidence provides a simple
validation of the QQ method by showing that the main results of the quantile regression
estimation can be recovered by summarizing the more thorough information contained
in the QQ estimates. Moreover, Figure 4 largely confirms the findings of the QQ
analysis stated earlier. First, the effect of movements in 10-year sovereign bond yields
on stock returns is consistently positive across quantiles for Australia, France, Germany,
Japan, Netherlands, Norway, the UK and the USA. In contrast, the impact of 10-year
government bond yields interest rate variations on stock returns is predominantly
negative for Belgium, Greece, Ireland, Italy, Portugal and Spain. Second, a substantial
heterogeneity across countries and across quantiles within each country in terms of the
impact of changes in 10-year sovereign bond yields on stock returns is noticed. More
precisely, the highest effect (in absolute value) of changes interest rates on the equity
market is found at the extreme quantiles of the distribution of stock returns for most
countries. This finding indicates that the interdependence between changes in interest
rates and stock markets tends to be stronger under extreme market conditions, either
bearish or bullish, suggesting that interest rates become an important explanatory factor
of the stock market performance in times of significant turmoil in the equity markets.

18
6. CONCLUDING REMARKS
This paper investigates the linkage between changes in 10-year government bond yields
and stock returns for fourteen developed countries over the period 1999-2015 using the
QQ (quantile-on-quantile) approach recently developed by Sim and Zhou (2015). The
QQ analysis enables estimating the way in which the quantiles of interest rate
fluctuations influence the quantiles of stock returns and thus, it provides a more precise
description of the overall dependence structure between both variables than alternative
standard techniques such as OLS or quantile regression.
This paper yields a number of interesting empirical results. First, the relationship
between 10-year sovereign bond yield fluctuations and stock returns is heterogeneous
across countries, possibly because of differences in the degree of indebtedness among
countries, the level of interest rates in each country, the relative weight of most interest
rate sensitive sectors in the stock market of each country and the level of development
of financial derivative markets. In particular, the weakest interest rate-stock market
nexus is observed for Australia, Germany, Netherlands, the UK and the US. On the
contrary, the strongest linkage has negative sign and is found for the euro area
peripheral countries most severely affected by the European sovereign debt crisis, i.e.
Ireland, Spain, Greece, Italy and Portugal. Second, the interest rate-equity market link
also varies substantially across quantiles of interest rate changes and stock returns,
indicating that the connection is not stable, but it depends on both the sign and size of
interest rates fluctuations and the cycle of the stock market. It is also shown that the
relationship between changes in 10-year bond yields and equity returns tends to be
stronger during periods of major financial turmoil such as the recent global financial
crisis period. In particular, for the vast majority of countries analyzed, interest rate
variations are a significant driver of the equity market performance during periods of
extreme market conditions and mainly under strong bearish conditions in the stock
market. In addition, falls in interest rates exert generally a larger influence on the equity
market than rises in interest rates, revealing an asymmetric effect of interest rate
changes on equity markets. These results confirm that the linkage is nonlinear and
asymmetric.
The evidence presented in this study is particularly relevant for policy makers who
should consider that the effect of interest rates depends on both equity and bond market
conditions. These findings are also crucial for investors and portfolio managers in order
to design effective strategies against interest rate risk.
.
19
7. REFERENCES
Alaganar, V. T., and Bhar, R. (2003). ‘An international study of causality-in-variance:
interest rate and financial sector returns’. Journal of Economics and Finance, Vol. 27,
39-55.
Arouri, M.E.H. (2012). ‘Stock returns and oil price changes in Europe: a sector
analysis’, The Manchester School, Vol. 80, No. 2, pp. 237-261.
Ballester, L., Ferrer, R. and González, C. (2011). ‘Linear and nonlinear interest rate
sensitivity of Spanish banks’, Spanish Review of Financial Economics, Vol. 9, No. 2,
pp. 35-48.
Bartram, S.M. (2002). ‘The interest rate exposure of nonfinancial corporations’,
European Finance Review, Vol. 6, No. 1, pp. 101–125.
Bartram, S. M. and Bodnar, G. M. (2009). ‘No place to hide: The global crisis in equity
markets in 2008/09’, Journal of International Money and Finance, Vol. 28, No. 8, pp.
1246-1292.
Bassett, G.W. and Chen, H.L. (2001). ‘Portfolio Style: Return-based attribution using
quantile regression’, Empirical Economics, Vol. 26, No. 1, pp. 293-305.
Bessler, W. and Kurmann, P. (2014). ‘Bank risk factors and changing risk exposures of
banks: Capital market evidence before and during the financial crisis’, Journal of
Financial Stability, Vol. 13, No. C, pp. 151-166.
Bose, A. and Chatterjee, S. (2003): ‘Estimating the ARCH parameters by solving linear
equations’, Journal of Time Series Analysis, Vol. 24 (2), pp. 127-136.
Campbell, J.Y. and Ammer, J. (1993). ‘What moves the stock and bond markets? A
variance decomposition for long-term asset returns’, Journal of Finance, Vol. 48, pp. 3-
37.
Chan, K.C., Norrbin, S.C. and Lai, P. (1997). ‘Are stock and bond prices collinear in the
long run?’, International Review of Economics and Finance, Vol. 6, pp. 193-201.
Chevapatrakul, T. and Paez-Farrell, J. (2014). ‘Monetary Policy Reaction Functions in
Small Open Economies: a Quantile Regression Approach’, The Manchester School,
Vol. 82, No. 2, pp. 237-256.
Cleveland, W. S. (1979). ‘Robust locally weighted regression and smoothing
scatterplots’, Journal of the American Statistical Association, Vol. 74, 829-836.
Czaja, M., Scholz, H. and Wilkens, M. (2009): ‘Interest rate risk of German financial
institutions: the impact of level, slope, and curvature of the term structure’, Review of
Quantitative Finance and Accounting, Vol. 33 (1): pp. 1-26.
20
Dinenis, E. and Staikouras, S.K. (1998). ‘Interest rate changes and common stock
returns of financial institutions: evidence from the UK’, European Journal of Finance,
Vol. 4, pp. 113-127.
Du, D., Ng, P. and Zhao, X. (2013). ‘Measuring currency exposure with quantile
regression’, Review of Quantitative Finance and Accounting, Vol. 41, No. 3, pp. 549-
566.
Elyasiani, E. and Mansur, I. (1998). ‘Sensitivity of the bank stock returns distribution to
changes in the level and volatility of interest rate: A GARCH-M Model’, Journal of
Banking and Finance. Vol. 22, No. 5, pp. 535–563.
Faff, R.W., Hodgson, A., Kremmer, M.L. (2005). ‘An investigation of the impact of
interest rates and interest rate volatility on Australian financial sector stock return
distributions’, Journal of Business Finance & Accounting, Vol. 32, 1001–1032.
Ferrando, L., Ferrer, R. and Jareño, F. (2016). ‘Interest Rate Sensitivity of Spanish
Industries: A Quantile Regression Approach’, The Manchester School, Vol. 84 (1), pp.
1-30.
Ferrer, R., Gonzalez, C. and Soto, G.M. (2010). ‘Linear and nonlinear interest rate
exposure in Spain’, Managerial Finance, Vol. 36, No. 5, pp. 431-451.
Flannery, M.J. and James, C. (1984). ‘The effect of interest rate changes on the
common stock returns of financial institutions’, Journal of Finance, Vol. 39, No. 4,
pp.1141-1153.
Graham, J.R. and Harvey, C.R. (2001). ‘The theory and practice of corporate finance:
evidence from the field’, Journal of Financial Economics, Vol. 60, No. 2, pp. 187-243.
Hatemi-J, A. and Roca, E.D. (2008). ‘Estimating banks' equity duration: a panel
cointegration approach’ Applied Financial Economics, Vol. 18, pp. 1173-1180.
Hirtle, B. J. (1997). ‘Derivatives, Portfolio Composition, and Bank Holding Company
Interest Rate Risk Exposure’, Journal of Financial Services Research, Vol. 12, No. 2-3,
pp. 243–266.
Jareño, F. (2007): ‘Sensibilidad de las acciones españolas ante cambios en los tipos de
interés: un estudio desde distintos enfoques’, Analisis Financiero, Vol. 103: pp. 30-35.
Jareño, F., Ferrer, R. and Miroslavova, S. (2016). ‘US stock market sensitivity to
interest and inflation rates: a quantile regression approach’, Applied Economics, Vol.
48, pp. 2469-2481.
Kasman, S., Vardar, G., Tunç, G. (2011). ‘The impact of interest rate and exchange rate
volatility on banks’ stock returns and volatility: Evidence from Turkey’. Economic
Modelling, Vol. 28, pp. 1328-1334.
Koenker, R. (2005). ‘Quantile regression’. New York: Cambridge University Press.

21
Koenker, R. and Basset, G.J. (1978). ‘Regression quantiles’, Econometrica, Vol. 46,
No. 1, pp. 33-50.
Koenker, R. and Xiao, Z. (2002). ‘Inference on the quantile regression process’,
Econometrica, Vol. 70, No. 4, pp. 1583-1612.
Korkeamäki, T. (2011). ‘Interest rate sensitivity of the European stock markets before
and after the euro introduction’, Journal of International Financial Markets, Institutions
and Money, Vol. 21, No. 5, pp. 811-831.
Laopodis, N.T. (2010). ‘Dynamic linkages between monetary policy and the stock
market’, Review of Quantitative Finance and Accounting, Vol. 35, pp. 271-293.
Lynge, M.J. and Zumwalt, J.K. (1980). ‘An empirical study of the interest rate
sensitivity of commercial bank returns: A multi-index approach’, Journal of Financial
and Quantitative Analysis, Vol. 15, pp. 731-742.
Monsueto S.E., Machado, A., and Golgher, A. (2006): ‘Desigualdades de
remuneraciones en Brasil: regresiones por cuantiles’. Revista de la Cepal, Vol. 90, pp.
171-189.
Oertmann, P., Rendu, C., and Zimmermann, H. (2000). ‘Interest rate risk of European
financial corporations’. European Financial Management, Vol. 6, pp. 459-478.
Olugbode, M., El-Masry, A. and Pointon, J. (2014). ‘Exchange rate and interest rate
exposure of UK industries using first-order autoregressive exponential GARCH-in-
mean (EGARCH-M) approach’, The Manchester School, Vol. 82, No. 4, pp. 409 464.
Prasad, A.M. and Rajan, M. (1995). ‘The role of exchange and interest risk in equity
valuation: a comparative study of international stock markets’, Journal of Economics
and Business, Vol. 47, pp. 457-472.
Reilly, F.K., Wright, D.J. and Johnson, R.R. (2007). ‘Analysis of the interest rate
sensitivity of common stocks’, Journal of Portfolio Management, Vol. 33, No. 3, pp.
85-107.
Shah, A., Rehman, J. U., Kamal, Y. and Abbas, Z, (2012). ‘The interest rates-stock
prices nexus in highly volatile markets: Evidence from Pakistan’, J. Basic Appl. Sci.
Res., Vol. 2 (3), pp. 2589-2598.
Shamsuddin, A. (2014). ‘Are Dow Jones Islamic equity indices exposed to interest rate
risk?’, Economic Modelling, Vol. 39, No. 1, pp. 273-281.
Sim, N. and Zhou, H., (2015). ‘Oil prices, US stock return, and the dependence between
their quantiles’, Journal of Banking and Finance, Vol. 55, 1-8.
Staikouras, S.K. (2003). ‘The interest rate risk exposure of financial intermediaries: A
review of the theory and empirical evidence’, Financial Markets, Institutions and
Instruments, Vol. 12, No. 4, pp. 257-289.
22
Staikouras, S.K. (2006). ‘Financial Intermediaries and Interest rate risk: II’, Financial
Markets, Institutions and Instruments, Vol. 15, No. 5, pp. 225-272.
Stone, C. J. (1977). Consistent nonparametric regression. The Annals of Statistics, Vol.
5, 595-620.
Sweeney, R.J. and Warga, A.D. (1986). ‘The pricing of interest rate risk: evidence from
the stock market’, Journal of Finance, Vol. 41, No. 2, pp. 393-410.
Triana-Machado, J.H. (2009): ‘La heterogeneidad de la distribución salarial desde las
regresiones cuantílicas’. Entramado, Vol. 5 (2): 92-105.
Verma, P., Jackson, D., (2008). ‘Interest rate and bank stock returns asymmetry:
evidence from US banks’, Journal of Economics and Finance, Vol. 32, 105–118.

23
APPENDIX:
Table 1. Descriptive statistics of stock returns and changes in yields on 10-year government bonds of each country.
Variables Mean Median Min. Max. Std. Dev. Skewness Kurtosis JB
statistic
ADF
statistic
PP
statistic
KPSS
statistic
Australian stock returns (ASX 200) 0.00077 0.00201 -0.11530 0.12016 0.02049 -0.47 6.63 519.77*** -9.32*** -30.82*** 0.10
Belgian stock returns (BEL 20) 0.00007 0.00276 -0.15607 0.17912 0.02914 -0.41 7.58 800.36*** -8.98*** -32.34*** 0.17
French stock returns (CAC 40) 0.00011 0.00229 -0.17375 0.13952 0.03449 -0.48 5.75 314.07*** -9.62*** -34.20*** 0.06
German stock returns (DAX 30) 0.00086 0.00433 -0.16804 0.17155 0.03350 -0.66 6.57 535.37*** -9.01*** -32.89*** 0.12
Greek stock returns (FTSE ATHEX 20) -0.00207 0.00152 -0.21500 0.18830 0.04439 -0.21 4.76 118.44*** -9.00*** -30.07*** 0.15
Irish stock returns (ISEQ) 0.00036 0.00282 -0.17576 0.14881 0.03135 -0.62 7.22 714.88*** -8.20*** -31.98*** 0.23
Italian stock returns (FTSE MIB) -0.00057 0.00180 -0.14735 0.11659 0.03278 -0.37 4.94 158.65*** -10.07*** -31.90*** 0.07
Japanese stock returns (NIKKEI) 0.00036 0.00307 -0.21126 0.14794 0.03124 -0.56 6.56 514.17*** -9.01*** -30.01*** 0.18
Dutch stock returns (AEX) -0.00021 0.00263 -0.17538 0.20377 0.03243 -0.52 8.43 1130.50*** -9.33*** -33.55*** 0.12
Norwegian stock returns (OSEBX) 0.00120 0.00448 -0.22650 0.22040 0.03388 -0.92 9.74 1800.50*** -8.50*** -31.94*** 0.07
Portuguese stock returns (PSI 20) -0.00082 0.00119 -0.18923 0.09713 0.02911 -0.59 6.10 407.18*** -8.88*** -31.53*** 0.07
Spanish stock returns (IBEX 35) -0.00002 0.00206 -0.13330 0.12390 0.03208 -0.34 4.63 115.56*** -9.77*** -32.96*** 0.06
UK stock returns (FTSE 100) 0.00007 0.00218 -0.12730 0.13590 0.02459 -0.35 6.49 466.64*** -10.28*** -32.97*** 0.08
US stock returns (S&P 500) 0.00058 0.00189 -0.16451 0.10186 0.02413 -0.60 7.61 837.89*** -9.76*** -32.27*** 0.18
Australian 10-year bond yield changes -0.00063 -0.00097 -0.10957 0.13696 0.02787 0.29 4.92 148.89*** -8.93*** -30.97*** 0.15
Belgian 10-year bond yield changes -0.00162 -0.00198 -0.37954 0.44823 0.04600 1.12 27.06 21573*** -9.38*** -31.64*** 0.21
French 10-year bond yield changes -0.00156 -0.00215 -0.39887 0.47765 0.04539 1.26 30.81 28824*** -10.11*** -29.24*** 0.17
German 10-year bond yield changes -0.00204 -0.00161 -0.62996 0.74073 0.06656 1.34 42.43 57738*** -10.83*** -28.07*** 0.12
Greek 10-year bond yield changes 0.00147 -0.00051 -0.43230 0.35960 0.04782 -0.30 19.63 10064*** -7.76*** -29.44*** 0.23
Irish 10-year bond yield changes -0.00156 -0.00281 -0.24766 0.43718 0.04050 1.51 23.04 15172*** -10.19*** -27.89*** 0.42*
Italian 10-year bond yield changes -0.00104 -0.00161 -0.19856 0.25963 0.03342 0.45 12.54 3390.50*** -10.17*** -32.23*** 0.33
Japanese 10-year bond yield changes -0.00226 -0.00514 -0.19729 0.41030 0.05433 1.69 12.97 4096.60*** -9.80*** -29.42*** 0.17
Dutch 10-year bond yield changes -0.00182 -0.00167 -0.57237 0.57916 0.05255 0.35 40.73 52620*** -9.35*** -29.41*** 0.16
Norwegian 10-year bond yield changes -0.00144 -0.00157 -0.23300 0.17150 0.03326 -0.19 9.07 1367.90*** -9.55*** -30.43*** 0.14
Portuguese 10-year bond yield changes -0.00053 -0.00086 -0.22154 0.22927 0.03929 0.20 8.49 1121.30*** -9.50*** -27.35*** 0.22
Spanish 10-year bond yield changes -0.00091 -0.00050 -0.21040 0.27940 0.03501 0.14 11.78 2849.50*** -10.12*** -31.14*** 0.26
UK 10-year bond yield changes -0.00088 -0.00083 -0.16211 0.18087 0.03525 0.18 5.79 292.10*** -9.06*** -31.70*** 0.10
US 10-year bond yield changes -0.00080 0.00000 -0.19966 0.15670 0.03997 -0.03 5.30 195.02*** -10.22*** -31.13*** 0.04
Notes: This table presents the main descriptive statistics of weekly stock market returns and changes in 10-year government bond yields over the period from January 1999 to December 2015. They include mean, median, minimum (Min.) and maximum (Max.) values, standard deviation (Std. Dev.) and Skewness and Kurtosis measures. JB denotes the statistic of the Jarque-Bera test for normality. The results of the augmented Dickey-Fuller (ADF) and Phillips-Perron (PP) unit root tests and the
Kwiatkowski et al. (KPSS) stationarity test are also reported in the last three columns. As usual, *,
**,
*** indicate statistical significance at the 10%, 5% and 1% levels,
respectively.
24
Figure 1. Quantile plots of stock returns and interest rate changes for each country.

25

26

27

28

29
30

31
Figure 2: Quantile-on-Quantile (QQ) estimates of the slope coefficient, �̂�1(𝜃, 𝜏), for
full sample.
a) Australia b) Belgium
c) France d) Germany

32
e) Greece f) Ireland
g) Italy h) Japan
i) Netherlands j) Norway

33
k) Portugal l) Spain
m) UK n) USA
Note: The graphs show the estimates of the slope coefficient, �̂�1(𝜃, 𝜏), in the z-axis
against the quantiles of stock market returns (𝜃) in the x-axis and the quantiles of
changes in interest rates (𝜏) in the y-axis, for full sample.

34
Figure 3: Quantile-on-Quantile (QQ) estimates of the slope coefficient, �̂�1(𝜃, 𝜏), for the
global financial crisis sub-period.
a) Australia b) Belgium
c) France d) Germany

35
e) Greece f) Ireland
g) Italy h) Japan
i) Netherlands j) Norway:

36
k) Portugal l) Spain
m) UK n) USA
Note: The graphs show the estimates of the slope coefficient, �̂�1(𝜃, 𝜏), in the z-axis
against the quantiles of stock market returns (𝜃) in the x-axis and the quantiles of
changes in interest rates (𝜏) in the y-axis, for crisis sub-period.

37
Figure 4: Comparison of the QR and the averaged QQ estimates.
a) Australia b) Belgium
c) France d) Germany
0
0,05
0,1
0,15
0,2
0,25
0.05 0.20 0.35 0.50 0.65 0.80 0.95
Quantile of stock return (θ)
QR
-0,08
-0,04
0
0,04
0,08
0.05 0.20 0.35 0.50 0.65 0.80 0.95
Quantile of stock return (θ)
QR
0
0,05
0,1
0,15
0,2
0,25
0.05 0.20 0.35 0.50 0.65 0.80 0.95
Quantile of stock return (θ)
QR
0
0,02
0,04
0,06
0,08
0,1
0,12
0.05 0.20 0.35 0.50 0.65 0.80 0.95
Quantile of stock return (θ)
QR

38
e) Greece f) Ireland
g) Italy h) Japan
i) Netherlands j) Norway
-0,8
-0,4
0
0,4
0,8
0.05 0.20 0.35 0.50 0.65 0.80 0.95
Quantile of stock return (θ)
QR
-0,1
-0,05
0
0,05
0,1
0,15
0.05 0.20 0.35 0.50 0.65 0.80 0.95
Quantile of stock return (θ)
QR
-0,3
-0,2
-0,1
0
0,1
0,2
0.05 0.20 0.35 0.50 0.65 0.80 0.95
Quantile of stock return (θ)
QR
0
0,05
0,1
0,15
0,2
0.05 0.20 0.35 0.50 0.65 0.80 0.95
Quantile of stock return (θ)
QR
-0,05
0
0,05
0,1
0,15
0.05 0.20 0.35 0.50 0.65 0.80 0.95
Quantile of stock return (θ)
QR
0
0,1
0,2
0,3
0,4
0.05 0.20 0.35 0.50 0.65 0.80 0.95
Quantile of stock return (θ)
QR

39
k) Portugal l) Spain
m) UK n) USA
Note: The graphs display the estimates of the standard quantile regression parameters,
denoted by QR (continuous black line), and the averaged QQ parameters, denoted by
QQ (dashed black line), at different quantiles of stock market return for all countries
analyzed.
-0,35
-0,3
-0,25
-0,2
-0,15
-0,1
-0,05
0
0.05 0.20 0.35 0.50 0.65 0.80 0.95
Quantile of stock return (θ)
QR
-0,15
-0,1
-0,05
0
0,05
0,1
0.05 0.20 0.35 0.50 0.65 0.80 0.95
Quantile of stock return (θ)
QR
0
0,05
0,1
0,15
0,2
0,25
0,3
0.05 0.20 0.35 0.50 0.65 0.80 0.95
Quantile of stock return (θ)
QR
0
0,05
0,1
0,15
0,2
0,25
0,3
0,35
0.05 0.20 0.35 0.50 0.65 0.80 0.95
Quantile of stock return (θ)
QR