Relationships between bacteria and heterotrophic ... · MARINE ECOLOGY PROGRESS SERIES Mar. Ecol....
14
MARINE ECOLOGY PROGRESS SERIES Mar. Ecol. Prog. Ser. Published September 3 Relationships between bacteria and heterotrophic nanoplankton in marine and fresh waters: an inter-ecosystem comparison Robert W. Sanders1,David A. caron2, Ulrike-G. ~ e r n i n g e r ~ ' Academy of Natural Sciences of Philadelphia, 1900 Benjamin Franklin Parkway, Philadelphia, Pennsylvania 19103-1 195. USA Department of Biology, Woods Hole Oceanographic Institution, Woods Hole, Massachusetts 02543, USA ABSTRACT: Despite differences in the species compositions and absolute abundances of planktonic microorganisms in fresh- and saltwater, there are broad similarities in microbial food webs across systems. Relative abundances of bacteria and nanoplanktonic protozoa (HNAN, primarily hetero- trophic flagellates) are similar in marine and freshwater environments, which suggests analogous trophic relationships. Ranges of microbe abundances in marine and fresh waters overlap, and seasonal changes in abundances within an ecosystem are often as great as differences in abundances between freshwater and marine systems of similar productivities. Densities of bacteria and heterotrophic nanoplankton, therefore, are strongly related to the degree of eutrophication, and not salt per se. Data from the literature is compiled to demonstrate a remarkably consistent numerical relationship (ca 1000 bacteria: l HNAN) between bacterioplankton and HNAN from the euphotic zones of a variety of marine and freshwater systems. Based on the results of a simple food web model involving bacterial growth, bacterial removal by HNAN, predation on HNAN, and the observed relationships between bacterial and HNAN abundances in natural ecosystems, it is possible to demonstrate that bottom-up control (food supply) is more important in regulating bacteiial abundances in oligotrophic environ- ments while top-down control (predation)is more important in eutrophic environments. INTRODUCTION Heterotrophic microbial populations have been the focus of numerous investigations in marine and fresh- water habitats during the past 2 decades. Most studies have concentrated on single environments and short- term investigations. Based on these numerous studies it is clear that bacteria and their consumers are gener- ally important components of energy flow and nutrient cycling in a wide variety of aquatic ecosystems (Azam et al. 1983, Porter et al. 1988, Caron et al. in press). Similarly, heterotrophic nanoplanktonic protists (2 to 20 pm nlicroorganisms, primarily flagellated protozoa) have been implicated as the major grazers of bacteria in most pelagic freshwater and marine communities (Giide 1986, Sanders & Porter 1986, Coffin & Sharp 1987, Wright et al. 1987, Haystrom et al. 1988, Nagata 1988, Sanders et al. 1989, Wikner et al. 1990, Berninger et al. 1991a). As large data sets on microbial abundance and pro- duction have emerged during the past few years analyses have begun to focus on the mechanisms regulating heterotrophic microbial population densi- ties in different environments, and the degree to which that regulation might differ between ecosystems. These attempts to model bacterial abundances and productivities have resulted, at some levels of exami- nation, in remarkable similarities in the microbial processes of a diverse array of aquatic communities. For example, it has been demonstrated that bacterial abundances are positively correlated with chlorophyll concentrations, and bacterial productivities correlated with primary productivities, across a wide range of environments including freshwater and marine com- munities (Bird & Kalff 1984, Cole et al. 1988, White et al. 1991). Cole et al. (1988) estimated that approxi- mately 40 % of the total primary productivity was consumed by bacteria in the euphotic zone of aquatic ecosystems ranging from highly oligotrophic to highly eutrophic. A subsequent analysis (White et al. 1991) with a larger data set has confirmed the relationships reported by Cole et al. (1988). No consistent differ- O Inter-Research 1992
Transcript of Relationships between bacteria and heterotrophic ... · MARINE ECOLOGY PROGRESS SERIES Mar. Ecol....
MARINE ECOLOGY PROGRESS SERIES Mar. Ecol. Prog. Ser. Published September 3
Relationships between bacteria and heterotrophic nanoplankton in marine and fresh waters: an
inter-ecosystem comparison
Robert W. Sanders1, David A. caron2, Ulrike-G. ~ e r n i n g e r ~
' Academy of Natural Sciences of Philadelphia, 1900 Benjamin Franklin Parkway, Philadelphia, Pennsylvania 19103-1 195. USA Department of Biology, Woods Hole Oceanographic Institution, Woods Hole, Massachusetts 02543, USA
ABSTRACT: Despite differences in the species compositions and absolute abundances of planktonic microorganisms in fresh- and saltwater, there are broad similarities in microbial food webs across systems. Relative abundances of bacteria and nanoplanktonic protozoa (HNAN, primarily hetero- trophic flagellates) are similar in marine and freshwater environments, which suggests analogous trophic relationships. Ranges of microbe abundances in marine and fresh waters overlap, and seasonal changes in abundances within an ecosystem are often as great as differences in abundances between freshwater and marine systems of similar productivities. Densities of bacteria and heterotrophic nanoplankton, therefore, are strongly related to the degree of eutrophication, and not salt per se. Data from the literature is compiled to demonstrate a remarkably consistent numerical relationship (ca 1000 bacteria: l HNAN) between bacterioplankton and HNAN from the euphotic zones of a variety of marine and freshwater systems. Based on the results of a simple food web model involving bacterial growth, bacterial removal by HNAN, predation on HNAN, and the observed relationships between bacterial and HNAN abundances in natural ecosystems, i t is possible to demonstrate that bottom-up control (food supply) is more important in regulating bacteiial abundances in oligotrophic environ- ments while top-down control (predation) is more important in eutrophic environments.
INTRODUCTION
Heterotrophic microbial populations have been the focus of numerous investigations in marine and fresh- water habitats during the past 2 decades. Most studies have concentrated on single environments and short- term investigations. Based on these numerous studies it is clear that bacteria and their consumers are gener- ally important components of energy flow and nutrient cycling in a wide variety of aquatic ecosystems (Azam et al. 1983, Porter et al. 1988, Caron et al. in press). Similarly, heterotrophic nanoplanktonic protists (2 to 20 pm nlicroorganisms, primarily flagellated protozoa) have been implicated as the major grazers of bacteria in most pelagic freshwater and marine communities (Giide 1986, Sanders & Porter 1986, Coffin & Sharp 1987, Wright et al. 1987, Haystrom et al. 1988, Nagata 1988, Sanders et al. 1989, Wikner et al. 1990, Berninger et al. 1991a).
As large data sets on microbial abundance and pro- duction have emerged during the past few years
analyses have begun to focus on the mechanisms regulating heterotrophic microbial population densi- ties in different environments, and the degree to which that regulation might differ between ecosystems. These attempts to model bacterial abundances and productivities have resulted, at some levels of exami- nation, in remarkable similarities in the microbial processes of a diverse array of aquatic communities. For example, it has been demonstrated that bacterial abundances are positively correlated with chlorophyll concentrations, and bacterial productivities correlated with primary productivities, across a wide range of environments including freshwater and marine com- munities (Bird & Kalff 1984, Cole et al. 1988, White et al. 1991). Cole et al. (1988) estimated that approxi- mately 40 % of the total primary productivity was consumed by bacteria in the euphotic zone of aquatic ecosystems ranging from highly oligotrophic to highly eutrophic. A subsequent analysis (White et al. 1991) with a larger data set has confirmed the relationships reported by Cole et al. (1988). No consistent differ-
O Inter-Research 1992
2 Mar. Ecol. Prog. Ser. 86: 1-14, 1992
ences were observed between marine and freshwater systems in these studies, although it was suggested that temperature may affect bacterial production more in marine systems than in fresh water (White et al. 1991).
The cross-system correlations of bacterial production and abundance to factors related to substrate supply immediately raise a related question: 'Can bacterial abundance and productivity also be correlated with the density and grazing activity of bacterial consumers in different environments?' The existence of such cor- relations would require that the major consumers of bacteria are similar in all environments and that these bacterial consumers are themselves subject to similar mortalities (i.e. grazing pressures). As stated above, it would appear that nanoplanktonic protists are the major consumers in most (if not all) aquatic ecosys- tems. Other potentially important consumers of bac- teria, however, do exist in freshwater and marine environments. Recent evidence has pointed to poten- tially important roles for cladocera, bacterivorous ciliates, mixotrophic algae, and bacteriophages in the removal of bacteria from aquatic ecosystems (E. Sherr et al. 1986, Sanders & Porter 1988, Bergh et al. 1989, Pace et al. 1990, Proctor & Fuhrman 1990). The extent to which the grazing activities of these other con- sumers might obscure a relationship between bacteria and heterotrophic nanoplankton (HNAN) is unknown.
Consumers of HNAN populations also may differ between environments of different trophic status or between fresh water and seawater. For example, cili- a t e ~ and copepods consume nanoplanktonic flagel- lates in freshwater and marine systems, but cladocera and rotifers are much more common in freshwater and some estuarine systems than in oceanic waters. On the other hand, pelagic tunicates (salps, doliolids and larvacea) and sarcodines (foraminifera, radiolaria and acantharia) may be important consumers of bacteri- vorous flagellates in marine but not freshwater eco- systems. There is no a prior1 reason to believe that the strong correlation that exists between phytoplankton and bacteria will also exist between bacteria and HNAN when data sets from diverse aquatic eco- systems are compared.
Nonetheless, we have summarized data (largely from the literature) that demonstrate a strong positlve correlation between the abundances of bacteria and HNAN, irrespective of salinity, over a range of envi- ronments that vary from highly oligotrophic to hyper- eutrophic. There was a large variability (up to 100- fold) in the abundance of HNAN at any particular bacterial density, presumably due to differences in geographic location, season, depth (within the eu- photic zone) and predator-prey oscillations as well as possible methodological differences between investi-
gations. Over the complete data set, however, absolute densities of bacteria and HNAN increased ca 3 to 4 orders of magnitude. Higher bacterial and HNAN densities were established and maintained in systems of higher productivity than in systems of lower pro- ductivity. Using a simple model with realistic values for bacterial and HNAN growth, respiration and mortality we have been able to recreate the numerical relation- ship observed between the 2 populations in nature. Based on an analysis of the model, a stronger control of bacterial abundance by grazers could be demonstrated in eutrophic ecosystems relative to oligotrophic ecosystems.
METHODS
A large part of the data set used in these analyses was obtained from the recent literature (Table 1). There were several requirements for including a study in our analyses: (1) the data to be compared (e.g. bacterial and HNAN abundances, bacterial productivity and bac- terivory) were collected concurrently within each study; (2) samples were from aerobic water within the euphotic zone; ( 3 ) data were not depth-integrated; (4) data were not from experimentally manipulated samples (e.g. microcosm experiments); and (5) HNAN were differ- entiated from autotrophic nanoplankton. An exception to the first requirement was the use of ranges of chloro- phyll to predict the relative trophy of a system (Fig. 1). Our reasoning for excluding data that did not meet these minimum requirements was that the relationships between microbial populations and processes might be distorted.
Abundances of heterotrophic nanoplankton and bacteria were determined using fluorescent staining methods and epifluorescent microscopy in all cases. Estimates for bacterial production and grazing were obtained by a variety of methods. Other than convert- ing to specific rates (i.e. d-'), no attempt was made to standardize these data for the different assumptions and methods. Least-squares regression analysis on log-transformed data was used to compare abun- dances of flagellates and bacteria in the different envi- ronments. The authors contributed some unpublished data on abundances of heterotrophic nanoplankton and bacteria contingent upon the criteria given above. A large data set that was recently published by one of the present authors (Berninger et al. 1991b) was not included in our analysis, but is compared in the 'Dis- cussion' section.
A simple model was constructed using Stella (High- Performance Systems) in order to explore factors which might affect the relationship between bacterial and HNAN abundances that are observed in natural
Sanders et al.. Marine and freshwater microbial food webs
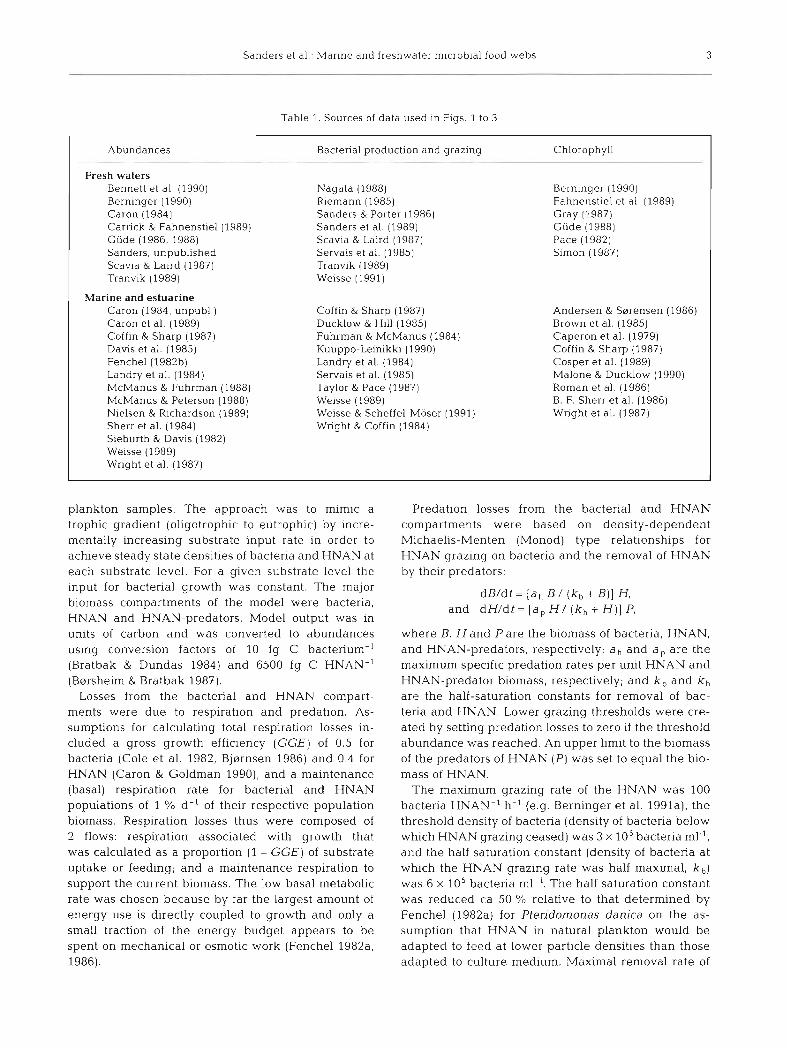
Table 1. Sources of data used in Figs. 1 to 3
Nagata (1988) Rlemann (1985) Sanders & Porter (1986) Sanders et a1 (1989) Scavia & Laird (1987) Servais et al. (1985) Tranvik (1989) Weisse (1991)
Coffin & Sharp (1987) Ducklow & Hill (1985) Fuhrman & McManus (1984) Kuuppo-Leinikki (1990) Landry et al. (1984) Servais et al. (1985) Taylor & Pace (1987) Weisse (1989) Weisse & Scheffel-Moser (1991) Wright & Coffin (1984)
Berninger (1990) Fahnenstiel et a1 (1989) Gray (1987) Gude (1988) Pace (1982) Simon (1987)
Abundances Bacterial production and grazing Chlorophyll -- -- - - p .- .
Fresh waters Bennett et a1 (1990) Berninger (1 990) Caron (1984) Carrick & Fahnenstiel (1989) Gude (1986, 1988) Sanders, unpublished Scavia & Laird (1987) Tranvik (1989)
Marine and estuarine Caron (1984, unpubl.) Andersen & Ssrensen (1986) Caron et al. (1989) Brown et al. (1985) Coffin & Sharp (1987) Caperon et al. (1979) Davis et al. (1985) Coffin & Sharp (1987) Fenchel(1982b) Cosper et al. (1989) Landry et al. (1984) Malone & Ducklow (1990) McManus & Fuhrman (1988) Roman et al. (1986) McManus & Peterson (1988) B. F. Sherr et al. (1986) Nielsen & Richardson (1989) Wnght et al. (1987) Sherr et al. (1984) Sieburth & Davis (1982) Weisse (1989) Wright et al. (1987)
plankton samples. The approach was to mimic a trophic gradient (oligotrophic to eutrophic) by incre- mentally increasing substrate input rate in order to achieve steady state densities of bacteria and HNAN at each substrate level. For a given substrate level the input for bacterial growth was constant. The major biomass compartments of the model were bacteria, HNAN and HNAN-predators. Model output was in units of carbon and was converted to abundances using conversion factors of 10 fg C bacterium-' (Bratbak & Dundas 1984) and 6500 fg C HNAN-' (B~rshe im & Bratbak 1987).
Losses from the bacterial and HNAN compart- ments were due to respiration and predation. As- sumptions for calculating total respiration losses in- cluded a gross growth efficiency (GGE) of 0.5 for bacteria (Cole et al. 1982, Bjarnsen 1986) and 0.4 for HNAN (Caron & Goldman 1990), and a maintenance (basal) respiration rate for bacterial and HNAN populations of 1 % d- ' of their respective population biomass. Respiration losses thus were composed of 2 flows: respiration associated with growth that was calculated as a proportion (1 - GGE) of substrate uptake or feeding; and a maintenance respiration to support the current biomass. The low basal metabolic rate was chosen because by far the largest amount of energy use is directly coupled to growth and only a small fraction of the energy budget appears to be spent on mechanical or osmotic work (Fenchel 1982a, 1986).
Predation losses from the bacterial and HNAN compartments were based on density-dependent Michaelis-Menten (Monod) type relationships for HNAN grazing on bacteria and the removal of HNAN by their predators:
dB/dt= [ a h B / (kh + B)] H, and dH/d t = [ a p H / ( k h + H)] P,
where B, H and P are the biomass of bacteria, HNAN, and HNAN-predators, respectively; ah and a, are the maximum specific predation rates per unit HNAN and HNAN-predator biomass, respectively; and k h and k h are the half-saturation constants for removal of bac- teria and HNAN. Lower grazing thresholds were cre- ated by setting predation losses to zero if the threshold abundance was reached. An upper limit to the biomass of the predators of HNAN (P) was set to equal the bio- mass of HNAN.
The maximum grazing rate of the HNAN was 100 bacteria HNAN-' h-' (e.g. Berninger et al. 1991a), the threshold density of bacteria (density of bacteria below which HNAN grazing ceased) was 3 X 10⁵ bacteria ml-l, and the half saturation constant (density of bacteria at which the HNAN grazing rate was half maximal, k , ) was 6 X 10⁵ bacteria ml-'. The half saturation constant was reduced ca 50 % relative to that determined by Fenchel (1982a) for Pteridornonas danica on the as- sumption that HNAN in natural plankton would be adapted to feed at lower particle densities than those adapted to culture medium. Maximal removal rate of

4 Mar. Ecol. Prog. Ser. 86: 1-14, 1992
Average Photic Zone Abundances
Heterovophic nanoflagellates
l00
50
0
Range of Chlorophyll Concentration
(pg-' )
Fig. 1. Average abundances of HNAN and bacteria in several freshwater and marine ecosystems arranged by increasing chlorophyll concentration. (;h) Marine and estuar-
ine environments
HNAN [0.06 ng HNAN C (ng predator C)-' h-'] was based on the assumption that smaller grazers (i.e. rotifers, ciliates) would have a higher weight-specific ingestion rate of HNAN than that measured for crus- taceans [0.04 ng prey C (ng predator C)-' h-'; Sanders unpubl.]. The threshold density (300 HNAN ml-') was chosen because of the rarity of recorded HNAN abun- dances below 300 HNAN ml-' (Berninger et al. 1991a). The half saturation constant (kh, 600 HNAN ml-l) was arbitrarily chosen. We were able to reproduce stable equihbria of bacteria and HNAN using these conditions.
RESULTS AND DISCUSSION
System trophy and microbial abundances
Previous studies have indicated that bacterial abun- dance increases with trophic state (Azam et al. 1983, Fuhrman et al. 1980) and that abundance and produc- tion of bacteria are positively correlated to chlorophyll a concentration (Bird & Kalff 1984, Cole et al. 1988, White et al. 1991). A rigorous statistical analysis be- tween the abundances and productivity of HNAN and system trophy was not possible because most of the studies that have reported abundances of HNAN did not include concurrent information on chlorophyll concentration or primary production. Moreover, very few estimates of HNAN production have been made. A comparison of the available data on the average abundances of HNAN in the euphotic zone to ranges of chlorophyll in several freshwater and marine eco- systems, however, indicated a positive relationship be- tween these parameters that was independent of salinity (Fig. 1). This trend is similar to the relationship between average abundances of bacteria and chloro- phyll concentrations in these same environments (Fig. 1). As stated previously, a strong correlation be- tween bacterial abundances and chlorophyll concen- trations has been observed with much larger data sets (Cole et al. 1988, White et al. 1991).
A more rigorous analysis of correlation between populations of heterotrophic microorganisms was performed by comparing data sets containing concur- rently collected measurements of bacterial and HNAN abundances (Fig. 2). Abundances of HNAN in this data set typically ranged from ca 10' to 104 ml-' in both marine and freshwater planktonic communities (Fig. 2, Table 2), but occasionally exceeded 10' ml-' in ex-
]o4 105 106 10' 108
Bacteria (cells m1 )
Our purpose in this investigation was to examine the possible relationship between bacteria and their pri- mary consumers across a range of aquatic ecosystems.
Fig. 2. Bacterial abundance vs HNAN abundance for 600 samples from a variety of planktonic ecosystems. Lines
represent ratios of 102,1, 103: 1 and 104: 1 bacteria:HNAN

Sanders et al.: Marine and freshwater microbial food webs 5
Table 2. Minimum and maximum abundances and the coefficients of variation (CV) (when available) of bacteria and heterotrophic nanoplankton observed during different seasons in a variety of planktonic environments
Environment Flagellates Bacteria n Source (X 103 m]-') (X lohml- l )
Min. Max. C V Mm. Max. CV
Freshwater Esthwaite Water, UK 3.8 23.0 48 3 6 12.0 32 7 Berninger (1990) Lake Biwa, Japan 0.8 5.1 Nagata (1988) Lake Constance. Germany 0.5 8.1 90 0.4 11.7 29 17 Giide (1988).
Weisse (1990) Lake Huron, N. America 1.0 5.0 49 - - - 12 Carrick & Fahnenstiel (1989) Lake Klintsjon, Sweden 1.8 3.6 24 2.1 3.0 15 5 Tranvik (1989) Lake Michigan, USA 1.1 9.0 - - - 16 Carrick & Fahnenstiel (1989) Lake Oglethorpe, USA 0.9 15.0 85 2.3 16.8 34 23 Sanders & Porter (1986),
Bennett et al. (1990) Lake Ontario, N. America 0.8 4.6 66 1.7 6.1 47 20 Caron (1984) Lake Skarshutsjon, Sweden 1.8 5.4 45 4.2 7.2 8 5 Tranvik (1989) Pond. Georgia, USA 0.9 7.4 - 7.6 17.0 - Carlough & Meyer (1990) Priest Pot, UK 13.0 180.0 81 5.2 34.0 51 9 Berninger (1990) Upton Lake, NY, USA 0.4 1.3 - 1.8 10.0 - Pace et al. (1990) Wastwater, UK 1.1 13.0 40 1.1 1.8 14 7 Berninger (1990) Windermere, UK 1.8 19.0 66 2.1 5.5 39 8 Berninger (1990)
Marine and estuarine Delaware Estuary, USA 0.4 9.0 70 1.0 8.0 39 85 Coffin & Sharp (1987) Llrnfjord, Denmark 0.2 15.2 - 0.5 15.2 - Andersen & Sorensen (1986) Llmfjord, Denmark 0.1 4.2 77 1.3 3.4 24 84 Fenchel (1982b) Parker Estuary, Mass., USA 0.3 21.9 - 0.9 14.6 - Wright et al. (1987) Chesapeake Plume, USA 0.8 4.4 64 1.1 9.1 48 16 McManus & Fuhrman (1988) Georgia Coast, USA 0.3 3.2 77 2.0 11.0 53 28 Sherr e t al. (1984) Atlantic Shelf, USA 0.4 3.2 58 0.7 2.2 33 13 Caron (1984) Gulf Stream 0.3 1.6 55 0.2 1.5 53 19 Caron (1984) Sargasso Sea 0.2 1.1 45 0.2 0.9 40 4 9 Caron (1984) Red Sea/Gulf of Aden 0.6 1.2 21 0.5 0.9 16 17 Weisse (1989) North Sea ~ 0 . 1 6.6 224 0.1 2.7 125 25 Nielsen & Richardson (1989) Marine snow, N. Atlantic 1.3 182.0 94 0.9 250.0 222 4 1 Caron (1984)
tremely eutrophic waters and on marine snow particles (macroscopic detrital aggregates). Bacterial abun- dances ranged over approximately 3 orders of magni- tude from 105 to 10' rnl-l. Log-transformed abun- dances of HNAN and bacteria were significantly correlated (r2 = 0.50, p < 0.001, n = 600) using the rela- tionship:
Log HNAN abundance = 0.90 Log bacteria abundance - 2.4
The middle line in Fig. 2 represents a bacteria:HNAN ratio of 1000:l which has been reported as a gener- alization for marine plankton (Fenchel 1986). The average ratio calculated at the mean of the regression for the whole data set included in our analysis was 1133 bacteria HNAN-l.
The significance level was unchanged when the regressions for the marine, estuarine and freshwater data sets were considered separately, and there were no significant differences between the slopes of the
log-transformed data from oceanic, estuarine and fresh waters (ANCOVA). More data were available for HNAN and bacterial abundances from marine and estuarine ecosystems than from freshwater eco- systems. Consequently, regressions were based on approximately twice as many data points from oceanic ecosystems. The relationship calculated for all eco- systems in our study was consistent with the regression of freshwater HNAN and picoplankton reported in a previous analysis (slope = 1.12, y-intercept = 3.52, r2 = 0.82; Berninger et al. 1991a). We excluded the data from Berninger et al. (1991a) from the current analysis to avoid biasing the results with this single large data set.
Neither absolute nor average photic zone abun- dances of microorganisms offered a predictable rela- tionship which differentiated between the marine and freshwater data (Figs. 1 & 2, Table 2). Bacterial and HNAN abundances in freshwater and marine samples strongly overlapped over most of the range of the oligotrophic-eutrophic continuum. The lowest abun-

Mar. Ecol. Prog. Ser. 86: 1-14, 1992
dances of microorganisms, however, were observed in samples from pelagic marine systems. Highest abun- dances were observed in marine snow samples which can be regarded as highly eutrophic microzones in aquatic environments (Caron et al. 1982, 1986), and in freshwater ecosystems where allochthonous inputs probably contributed to bacterial productivity.
Bacterial growth versus bacterial removal
There was considerable variability associated with the correlation between HNAN abundance and bacte- rial abundance (Fig. 2). A discussion of this variability will be provided later. Given the number of factors that might affect this relationship, however, it is remark- able that such a strong correlation persists across a wide spectrum of freshwater and marine ecosystems. What conditions might explain why both bacterial and HNAN abundances increase along a trophic gradient? The timing and magnitude of bacterial production and bacterial grazing probably are the key to understand- ing this phenomenon. Production and grazing in phytoplankton-zooplankton communities have been modeled as balancing processes that equilibrate at different levels of abundance along an oligotrophic- eutrophic gradient (Leibold 1989).
A comparison of the available data on bacterial pro- duction and grazing indicated that, on average, there is a strong 1: 1 correspondence between these 2 para- meters (Fig. 3). The overall relationships were similar to those reported by McManus & Fuhrman (1988) and Sanders et al. (1989) using smaller data sets. The best fit (r2 = 0.59) of the least-squares regression for the data set presented here is:
GRZ = 0.84 PROD + 0.17
where GRZ and PROD are specific rates of grazing mortality and bacterial growth respectively.
In a stable community (i.e. where bacterial abun- dance is not changing), equivalent amounts of bac- terial production and grazing are expected if grazing is the primary source of bacterial mortality. Interannual abundances of bacteria are relatively stable in most environments because bacterial cells produced are ultimately removed by grazing. It is not necessary (nor probable), however, for these processes to occur at the same rate at all times. I f changes in bacterial produc- tion (increases or decreases) occur concomitantly with equivalent changes in grazing, then the bacterial density does not change. If the bacterial production and grazing rates do not match, however, bacterial abundances will increase or decrease depending on the relative magnitude of the 2 rates.
10
h
E 1
6 > '5 0 0.1
m"
0.01 0.01 0.1 1 10
Productivity (d-' )
Fig. 3. Relationship of specific community bacterivory (d-') to bacterial productivity (d-l) in (o) freshwater and ( 0 ) marine ecosystems. The line represents a balance (1:l correspon- dence) between production and grazing. Modified from
Sanders e: a!. (1989) with additional data
These situations are represented conceptually in Fig. 4. The double-headed arrow (1) in Fig. 4A depicts the condition in which changes in bacterial production and grazing are matched in magnitude and timing. Regardless of the starting bacterial density, changes in
b
Increasing Bacterial Production
I I
Time
Fig. 4. A conceptual model of (A) bacterial production and grazing losses and (B) the resulting changes in abundances. The 1 : 1 line In (A) represents periods when bacterial produc- tion and death are balanced. The numbers in (A) correspond
to those in (B). See text for discussion
Sanders et al.: Marine and freshwater microbial food webs 7
the bacterial production rate do not affect the abun- dance of bacteria as long as changes in the grazing rate equal changes in the production rate. Bacterial production and grazing, however, frequently do not balance (arrows 2 and 3 in Fig. 4A, scatter in Fig. 3). If an increase in bacterial production is not immediately matched by an equivalent increase in grazing (arrow 2 in Fig. 4A) then bacterial abundance increases until a new, higher equilibrium between production and graz- ing is reached (i.e. when arrow 2 in Fig. 4A reaches the line of 1: 1 correspondence). At that point, bacterial losses again equal bacterial production and the bacter- ial abundance will stabilize at this higher density. On the other hand, if a decrease in bacterial production is not immediately matched by an equivalent decrease in grazing (arrow 3 in Fig. 4A), then the bacterial abun- dance decreases until a new, lower equilibrium be- tween production and grazing is reached (i.e. when arrow 3 reaches the line of 1: 1 correspondence).
Note that the location along the 1: 1 correspondence line of Fig. 4A does not stipulate the density of the bacterial population, but merely a balance between the rates of bacterial production and grazing. It is pos- sible that either low or high stable bacterial densities could be maintained in an environment if bacterial production and grazing are equal. An example would appear to be winter-summer abundances of bacteria in most temperate aquatic environments. Summer abundances of bacteria in surface waters of these environments typically are approximately 1 order of magnitude higher than winter abundances, but both densities are relatively stable over periods of several months (e.g. Berninger et al. 1991b). The probable sequence of events explaining this situation would begin with a substrate- and/or temperature-related increase in bacterial production during the spring prior to an increase in grazing pressure (arrow 2 in Fig. 4A & B). Bacterial density increases until the pro- duction and grazing rates become equal (i.e. reach the
line of 1: 1 correspondence), and then remains stable at this higher density as long as these 2 rates remain ap- proximately equal (Fig. 4B). As temperature and/or substrate supply decrease in the autumn, bacterial pro- duction decreases more rapidly than grazing (arrow 3 in Fig. 4A & B). Bacterial abundance also decreases until the production and grazing rates again become equal (i.e. reach the line of 1: 1 correspondence).
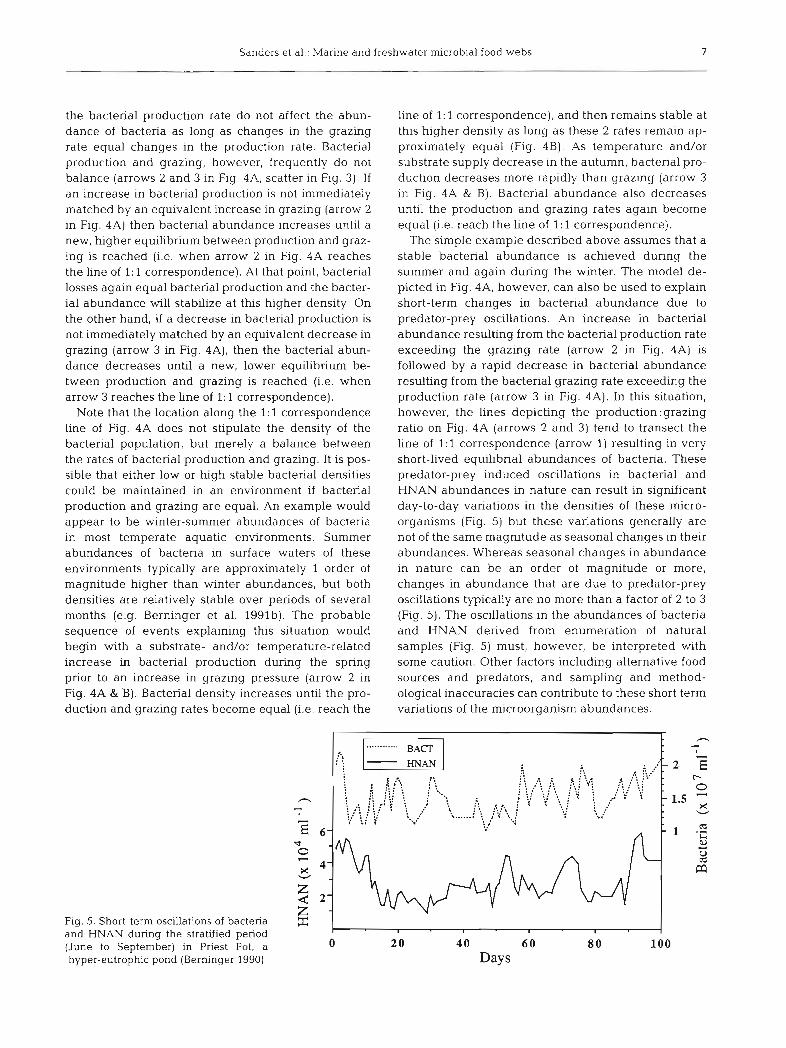
The simple example described above assumes that a stable bacterial abundance is achieved during the summer and again during the winter. The model de- picted in Fig. 4A, however, can also be used to explain short-term changes in bacterial abundance due to predator-prey oscillations. An increase in bacterial abundance resulting from the bacterial production rate exceedmg the grazing rate (arrow 2 in Fig. 4A) is followed by a rapid decrease in bacterial abundance resulting from the bacterial grazing rate exceeding the production rate (arrow 3 in Fig. 4A). In thls situation, however, the lines depicting the production:grazing ratio on Fig. 4A (arrows 2 and 3) tend to transect the line of 1: 1 correspondence (arrow 1) resulting in very short-lived equilibrial abundances of bacteria. These predator-prey induced oscillations in bacterial and HNAN abundances in nature can result in significant day-to-day variations in the densities of these micro- organisms (Fig. 5) but these variations generally are not of the same magnitude as seasonal changes in their abundances. Whereas seasonal changes in abundance in nature can be an order of magnitude or more, changes in abundance that are due to predator-prey oscillations typically are no more than a factor of 2 to 3 (Fig. 5). The oscillations in the abundances of bacteria and HNAN derived from enumeration of natural samples (Fig. 5) must, however, be interpreted with some caution. Other factors including alternative food sources and predators, and sampling and method- ological inaccuracies can contribute to these short term variations of the microorganism abundances.
. ..- -- -- . ...
' : ;. ,..:F -
d
2 3 .. . 1. . . . ; ; ;\ 5 ; :: : r P i : ,Ati i't . . ::: . 3 : : ; ;\!:.!;
- .:: . : *-. .... ; $ i ,l$ Y - 0
h : :: : .. . . . , ; : : + y , .* . . *. ?. ; : . . - :'l :; .,: : :
; 1.5 .;; 8 : . , : , . , h. .' !, ...... ;\;;.' . ;a' .G W .. :: C .. . . ., . \..: 2 6- 1 1 .r!
d 5 C1
2 0 cd
X W - m
F i g 5. Short-term oscillations of bacteria E - and HNAN during the stratified period I I I I
(June to September) in Priest Pot, a 0 20 40 6 0 8 0 100 hyper-eutrophic pond (Berninger 1990) Days
Mar. Ecol. Prog. Ser. 86: 1-14, 1992
Modeling in situ bacterial and HNAN abundances
The simple model presented in Fig. 4 provides a con- ceptual framework for understanding the existence of relatively stable abundances (as well as oscillations) of bacteria in nature. To examine the correlation that exists between abundances of bacteria and their con- sumers, the HNAN, observed across ecosystems and depicted in Fig. 2, we developed a model simulating a substrate-bacteria-HNAN food chain. Our specific goals in this work were (1) to simulate realistic condi- tions that would generate the abundances of bacteria and HNAN that CO-occur in natural aquatic cornrnuni- ties and (2) to examine the relative importance of grazing as a factor controlling bacterial density along an oligotrophic-eutrophic gradient.
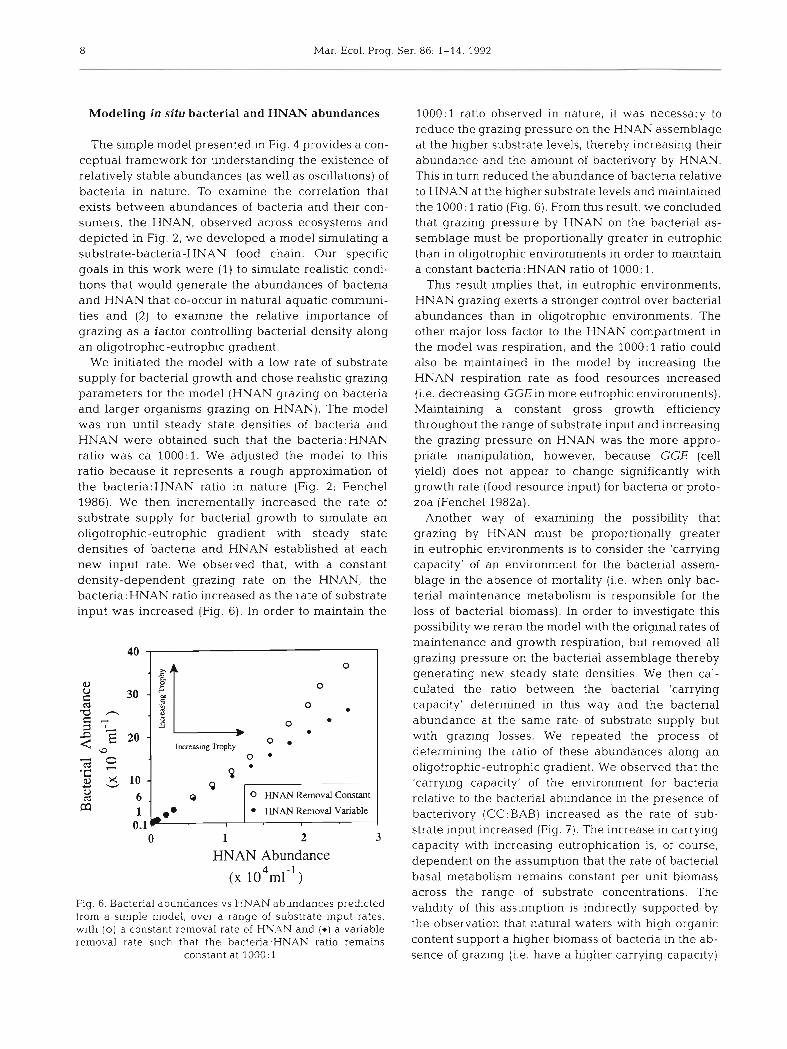
We initiated the model with a low rate of substrate supply for bacterial growth and chose realistic grazing parameters for the model (HNAN grazing on bacteria and larger organisms grazing on HNAN). The model was run until steady state densities of bacteria and HNAN were obtained such that the bacteria:HNAN ratio was ca 1000:l. We adjusted the model to this ratio because it represents a rough approximation of the bacteria:HNAN ratio in nature (Fig. 2; Fenchel 1986). We then incrementally increased the rate of substrate supply for bacterial growth to simulate an oligotrophic-eutrophic gradient with steady state densities of bacteria and HNAN established at each new input rate. We observed that, with a constant density-dependent grazing rate on the HNAN, the bacteria:HNAN ratio increased as the rate of substrate input was increased (Fig. 6). In order to maintain the
0 0 HNAN Removal Constant
HNAN Removal Variable I
0 1 2 3
HNAN Abundance
(X 1 0 ~ ~ 1 - ~ )
Fig. 6. Bacterial abundances vs HNAN abundances predicted from a simple model, over a range of substrate input rates. with ( 0 ) a constant removal rate of HY.4N and (*) a vanable removal rate such that the bacteria:HNAN rat10 remains
constant at 1000: 1
1000:l ratio observed in nature, it was necessary to reduce the grazing pressure on the HNAN assemblage at the higher substrate levels, thereby increasing their abundance and the amount of bacterivory by HNAN. This in turn reduced the abundance of bacteria relative to HNAN at the higher substrate levels and maintained the 1000: 1 ratio (Fig. 6). From this result, we concluded that grazing pressure by HNAN on the bacterial as- semblage must be proportionally greater in eutrophic than in oligotrophic environments in order to maintain a constant bacteria : HNAN ratio of 1000 : 1.
This result implies that, in eutrophic environments, HNAN grazing exerts a stronger control over bacterial abundances than in oligotrophic environments. The other major loss factor to the HNAN compartment in the model was respiration, and the 1000: 1 ratio could also be maintained in the model by increasing the HNAN respiration rate as food resources increased (i.e. decreasing GGEin more eutrophic environments). Maintaining a constant gross growth efficiency throughout the range of substrate input and increasing the grazing pressure on HNAN was the more appro- priate manipulation, however, because GGE (cell yield) does not appear to change significantly with growth rate (food resource input) for bacteria or proto- zoa (Fenchel 1982a).
Another way of examining the possibility that grazing by HNAN must be proportionally greater in eutrophic environments is to consider the 'carrying capacity' of an environment for the bacterial assem- blage in the absence of mortality (i.e. when only bac- terial maintenance metabolism is responsible for the loss of bacterial biomass). In order to investigate this possibility we reran the model with the original rates of maintenance and growth respiration, but removed all grazing pressure on the bacterial assemblage thereby generating new steady state densities. We then cal- culated the ratio between the bacterial 'carrylng capacity' determined in this way and the bacterial abundance at the same rate of substrate supply but with grazing losses. We repeated the process of determining the ratio of these abundances along an oligotrophic-eutrophic gradient. We observed that the 'carrying capacity' of the environment for bacteria relative to the bacterial abundance in the presence of bacterivory (CC:BAB) increased as the rate of sub- strate input increased (Fig. ?). The increase in carrying capacity with increasing eutrophication is, of course, dependent on the assumption that the rate of bacterial basal metabolism remains constant per unit biomass across the range of substrate concentrations. The validity of this assumption is indirectly supported by the observation that natural waters with high organic content support a higher biomass of bacteria in the ab- sence of grazing (i.e. have a higher carrylng capacity)

Sanders et al.. Marine and freshwater microbial food webs
Rate of Substrate Input
200 -
100 -
0
Fig. 7 Ratio of the bacterial carrying capacities of systems in the absence of bacterivory to the steady state bacterial abun- dances with grazing present, predicted from a simple model. (+): predictions over a range of substrate input rates when grazing on HNAN is constant; ( A ) : predictions when grazing on HNAN is varied to keep the bacteria:HNAN ratio constant
at 1000: 1
than waters lower in dissolved organics (Tranvik 1988, Sanders unpubl.). For the model iterations with con- stant density-dependent HNAN grazing, the ratio of CC:BAB increased from 59 to 200 (factor of 3.4) over the range of substrate supply rates of 0.1 to 10 pg C 1-' h-' and then decreased slightly at higher supply rates (Fig. 7). When the grazing pressure on the HNAN assemblage was reduced in order to maintain the 1000:l bacteria:HNAN ratio, the decrease at higher substrate supply rates did not occur, and the ratio of bacterial abundances with and without grazing con- tinued to increase slightly (up to 228) over the entire range of substrate supply rates examined (Fig. 7).
Fenchel (1986) suggested that grazing by hetero- trophic nanoplankton maintained bacteria just below their carrying capacity in oligotrophic ecosystems, but in eutrophic ecosystems the mean number of bacteria were kept well below the carrying capacity by HNAN grazing. The results of our modeling with constant density-dependent HNAN grazing on bacteria (Fig. 6) were consistent with this suggestion that bottom-up control was more important in regulating bacterial abundances in oligotrophic environments and that top- down control was more important in eutrophic envi- ronments (Fenchel 1986). This conclusion is supported by the increase from 1000:l of the bacteria:HNAN ratio in Fig. 6. The conlparison of steady state densities of bacteria in the presence or absence of bacterivory along an oligotrophic-eutrophic gradient (Fig. 7), further indicated strong grazer control of bacterial abundance in eutrophic environments.
0.1 1 10 100
A A- * +++++ 4
++% 4
d
A
The range of the ratios of bacteria:HNAN observed in nature from ecosystems of different productivities (Fig. 8) also indicates that top-down control may be more important in eutrophic than in oligotrophic envi- ronments. Low bacteria:HNAN ratios occurred across all environments but high ratios of bacteria:HNAN occurred only in relatively eutrophic ecosystems. The range of the ratios, therefore, was much greater in eutrophic ecosystems because of occasionally high values in these environments (Fig. 8). Once again this trend appeared to be independent of salinity. The increasing variability in the ratio with increasing eutrophication also is reflected by the coefficients of variation (Fig. 8). If top-down control is more important in eutrophic ecosystems then we would expect that these environments possess the potential for much greater ratios than 1000:l in those instances where grazer control of bacterial abundance becomes tem- porarily uncoupled. Oligotrophic ecosystems, on the other hand, would not be expected to show large increases from the 1000:l ratio because the bacterial population is more strongly controlled by substrate supply (i.e. even in situations when grazing pressure on bacteria is reduced, the bacteria are not capable of rapid increases in abundance because of substrate limitation).
In contrast to our analyses, a modeling approach recently was used to argue that there is little top-down control of bacterial biomass at any level of enrichment (Billen et al. 1990). They found that the bacterial bio- mass was dependent on system richness (i.e. substrate input) when the bacterial mortality constant of their model was a function only of bacterial biomass (Billen et al. 1990). Thus, their model prediction fit the empirical data in both their paper and ours. When a
<I
Fig. 8. Averages and ranges of the ratio of bacteria to HNAN in a variety of planktonic ecosystems. The environments are listed in order of increasing chlorophyll concentration as in Fig. 1. Number of samples (n) and coefficients of variations
(CV) are listed above the ranges
+ HNAN Removal Constant
A HNAN Removal Variable I . . . . . . . 1 .

10 Mar. Ecol. Prog. Ser. 86: 1-14, 1992
predator-dependent bacterial mortality was added to their model, however, bacterial biomass became inde- pendent of system richness. From their work it was concluded that grazing was not of primary importance in the control of bacterial biomass (Billen et al. 1990). Interestingly, our model with predator-dependent mortality predicted, as did the Billen et al. (1990) model without grazing, that bacterial abundance would increase with increasing substrate input. We suggest therefore that differences in the abundance of bacteria between oligotrophic and eutrophic environ- ments should be modeled without discarding grazing as an important controlling factor. The differences be- tween these models are a function of their structures, and are likely due to the choices for constants (half- saturation constant and maximum rate of uptake) and 'closure' by the grazing function (Steele & Henderson 1992). The importance of the mortality closure to food web models is reflected by the differences in the ratios of bacteria:HNAN when we change the constant HNAN mortality to variable mortality (Figs. 6 & 7).
Trophic relationships and the cascade effect
Using realistic starting conditions, we developed a model that reflected published results on bacterial and HNAN abundances across an oligotrophic-eutrophic gradient in natural ecosystems. The trend for greater abundances of bacteria and HNAN in more eutrophic environments (Fig. 1) was predicted (Fig. 6), and the results of the model (Figs. 6 & 7) were consistent with data (Fig. 8) that indicated an increasing importance of bacterivory along a gradient of increasing substrate supply. The sensitivity of the bacteria:HNAN ratio to changes in the HNAN grazing pressure (Figs. 6 & 7) implies an important role for a 'trophic cascade' for controlling the numerical relationship between HNAN and bacteria in the microbial loop. Ratios of bac- teria:HNAN close to 1000: 1 were obtained for high rates of substrate input when predation on HNAN by hlgher organisms was reduced (Fig. 6) . The reduction of grazing by higher organisms on HNAN resulted in higher HNAN densities and consequently a cascade effect increasing the grazing pressure of HNAN on bacteria. The effect of this trophic cascade acted to decrease the steady state bacterial abundance and the bacteria:HNAN ratio to ca 1000: 1.
Based on the discussion in the previous paragraph, we speculate that the high ratios of bacteria:HNAN in eutrophic ecosystems (Fig. 8) are a consequence of intense predation of larger organisms on HNAN. The removal of HNAN biomass by predators results in reduced HNAN grazing on the bacteria. Presumed high rates of substrate supply in eutrophic ecosystems
coupled with reduced removal rates allow rapid bac- terial growth and, occasionally, high bacteria:HNAN ratios. Cascading trophic effects as described above have been reported from freshwater fish-zooplankton- phytoplankton communities (McQueen et al. 1989). There are still few data for microbial communities, but such trophic cascade effects have been implicated in the microbial food webs of Lake Constance (Gude 1988) and the Rhode River (Dolan & Gallegos 1991). Ciliates, rotifers, cladocera and other crustacean zooplankton are all potentially important sources of predation on HNAN.
It should be noted that data contrary to the trophic cascade concept in microbial communities also has been reported (Pace & Funke 1991). Protozoan re- moval by crustacean zooplankton in that study was not followed by a rapid increase in bacterial abundance. One possible explanation for these results that would remain consistent with the results of our work include a switch from HNAN-dominated bacterivory to bac- terivory by other zooplankton at the time of the reduc- tion of protozoan abundance. Alternatively, if a system were oligotrophic, a rapid increase in bacterial abun- dance would not be expected because the bacterial population would be near substrate limitation. lnter- estingly, the ecosystems examined by Pace & Funke (1991) were relatively oligotrophic in which case our model would not predict a strong response of the bacterial assemblage to removal of predators. Clearly, these possible explanations warrant further study.
Caveats
The correlation of bacteria and HNAN abundances that we observed (Fig. 2) has not always been noted in field data (Wright et al. 1987, McManus & Fuhrman 1990). A lack of correlation certainly might result when examining smaller data sets or data sets confined to particular environments. The most important of several confounding influences may be the occurrence of predator-prey oscillations. These oscillations may re- sult in short-term disequilibria between the bacterial and HNAN abundances. Seasonal changes in abun- dances may also contribute to deviations from the cor- relation observed in Fig 2. These factors undoubtedly account for much of the scatter in the data of Fig. 2.
Two other crucial factors that may cause deviations from the correlation in Fig. 2 are trophic coupling of HNAN with higher organisms (i.e. the trophic cascade) and bacterivory by organisms other than HNAN. We have previously demonstrated the potential importance of a trophic cascade on the relationships between bacterial and HNAN abundances (Figs. 6 & 7; Gude 1988, Dolan & Gallegos 1991). Likewise, the importance

Sanders et a1 Marine and fres ;hwater m~crobial food webs 11
of bacterivores other than HNAN, including mix- otrophic flagellates, ciliates, cladocera and rotifers has been noted in a number of studies (Bird & Kalff 1986, Sherr et al. 1986, Sanders et al. 1989, Pace & Funke 1991). The utilization by HNAN of alternative prey, such as photosynthetic picoplankton or nanoplankton (Caron et al. 1991), also may introduce variability in the relationship between HNAN and bacteria.
These considerations may obliterate the correlation noted in Fig. 2 in some environments. For example, in benthic environments ciliates may be important consumers of bacteria. Under such circumstances, a correlation between the abundances of bacteria and bacterivorous flagellates would not be expected. Osmotrophic nutrition of flagellates in enriched ben- thic environments may further obscure any numerical relationship between bacteria and flagellates. Finally, attachment to suspended particles may give bacteria a refuge from grazing and confuse the interpretation of the bacterial and HNAN relationships in the plankton.
Two studies have presented data on the numerical relationship between bacteria and HNAN that do not conform to our model and our summary of field data spanning a range of environments from oligotrophic to eutrophic. Davis et al. (1985) observed a trend of decreasing bacteria:HNAN ratios along an olig- otrophic-eutrophic (offshore-nearshore) gradient in the North Atlantic ocean. A significant decrease in the ratio of bacteria:HNAN with increasing chlorophyll also was found in an outflo\v plume of the Chesapeake Bay (McManus & Fuhrman 1990). These trends are contrary to the results of our model (Figs. 6 & 7), our compilation of bacteria:HNAN ratios (Fig. 8), and to the conclusions of Fenchel (1986). We speculate that the use of a limited data set by Davis et al. (1985), and the limited geographic range of the McManus & Fuhrman (1990) study, may explain why their data differ from our own.
Constraints on microbial abundances and production
Assuming that the data set used in this paper is repre- sentative of planktonic ecosystems, we are able to place some constraints on removal of bacteria by grazers and on the production of bacteria and bacterivorous HNAN. In oligotrophic waters, the ratio of bactena:HNAN typically ranges from 400 to 1000. If HNAN removed all the bacterial production, ingestion rates would need to be 17 to 42 bacteria HNAN-' h-' to balance a bacterial division rate of 1.0 d-l. Because measured bactenvory in oligotrophic systems has been reported to be in the range of 10 to 35 bacteria HNAN-' h-' (Weisse & Scheffel-Moser 1991), bacterivorous nanoplankton could easily maintain the observed ratio of bacteria:
HNAN at bacterial growth rates of 1.0 d-'. Assuming microbial abundances of 5 X 10' ml-' (bacteria) and 500 ml-' (HNAN), and a relatively low grazing rate of 10 bacteria HNAN-' h-', HNAN alone could turn over the total bacterial population in 4 .2 d. Using HNAN abundance and bacterial cell production data from the Sargasso Sea during July 1988 (Fuhrman et al. 1989), flagellates would need to ingest only 10 to 18 bac- teria h-' to balance production. These ingestion rates are well withln the range of ingestion rates measured for heterotrophic nanoplankton.
Limits can also be placed on the production of HNAN. If bacteria were the only food of HNAN in oligotrophic waters, doubling times of I l d would be realistic. For example, during the summer in the Sargasso Sea, bacterial production of 4.8 ng C ml-' d-' is not unusual (Fuhrman et al. 1989). If HNAN con- sumed all bacterial production with a growth gross efficiency of 40 %, then 1.9 ng C ml-' d- ' would be converted to HNAN biomass. Depending on the size of the HNAN (2.5 to 4 pm diameter), this would be equivalent to the production of 500 to 900 HNAN ml-' d-'. If a significant biomass of cyanobacteria was also ingested (e.g. Hagstrom et al. 1988, Caron et al. 1991), then a doubling time of <24 h certainly would be possible. HNAN population growth would be lower of course if bacterial and/or cyanobacterial removal rates were due to other factors such as viral infection or other grazers such as ciliates, mixotrophic algae and appendicularia.
Using the same assumptions for a eutrophic environ- ment (Lake Oglethorpe) where bacterial production may be on the order of 2 X 10⁶ cells ml-' d-' (41 ng C ml-' d- ') and HNAN abundances about 2 X 10³ cells ml-' (Sanders et al. 1989), HNAN would need to ingest > 40 bacteria h-' to balance bacterial production. HNAN ingestion rates as high as this have been measured in situ. Given the same assumptions used above for oligotrophic systems, population growth of HNAN in the absence of predation could range from 4.8 to 7.8 X 10³ HNAN ml-' d-l . HNAN biomass production in this range has been calculated for both coastal marine waters and mesotrophic lakes (Sherr et al. 1984, Nagata 1988, Weisse 1991). This HNAN biomass could easily be removed completely by cladocera in some lakes or by ciliates and/or rotifers (Giide 1988, Sanders & Porter 1990, Weisse et al. 1990, Dolan & Gallegos 1991).
Acknowledgements. This study was supported in part by National Science Foundation Grants BSR-8921640 and BSR- 9007640 (RWS), BSR-8919447 and OCE-8901005 (D.A.C.); and a post-doctoral grant from the Deutscher Akademischer Austauschdienst (U.-G.B.). We thank M. A. Moran and 2 anonymous reviewers for helpful comments. Woods Hole Oceanographic Institution Contribution Number 8102.

Mar. Ecol. Prog. Ser. 86: 1-14, 1992
LITERATURE CITED
Andersen, P., Serensen, H. M. (1986). Population dynamics and trophic coupling in pelagic microorganisms in eutrophic coastal systems. Mar. Ecol. Prog. Ser. 33: 99-109
Azam, F., Fenchel, T., Field, J . G., Meyer-Reil, L. A,, Thingstad, F. (1983). The ecological role of water-column microbes in the sea. Mar. Ecol. Prog. Ser. 10: 257-263
Bennett, S. J., Sanders, R. W., Porter, K, G. (1990). Hetero- trophic, autotrophic and mixotrophic nanoflagellates: seasonal abundances and bacterivory in a eutrophic lake. Limnol. Oceanogr. 35: 1821-1832
Bergh, O., Bersheim, K. Y., Bratbak, G., Heldal, M. (1989). High abundance of viruses found in aquatic environ- ments. Nature, Lond. 340: 467-429
Berninger, U.-G. (1990). The functioning and significance of microbial food webs in freshwater environments. Ph.D thesis, Free University of Berlin
Berninger, U.-G., Caron, D. A., Sanders, R. W., Finlay, B. J . (199la). Heterotrophic flagellates of planktonic cornmuni- ties, their characteristics and methods of study. In: Patterson, D. J., Larsen, J. (eds.) The biology of free-living heterotrophic flagellates. Clarenden Press, Oxford, p. 39-56
Berninger, U.-G., Finlay, B. J., Kuuppo-Leinikki, P (1991b). Protozoan control of bacterial abundances in fresh water. Limnol. Oceanogr. 36: 139-147
BiUen, G., Servais, P., Becquevort, S. (1990). Dynamics of bacterioplankton in oligotrophic and eutrophic aquatic environments: bottom-up or top-down control? Hydro- biologia 207: 37-42
Bird, D. F., Kalff, J. (1984). Empirical relationships between bacterial abundance and chlorophyll concentration in fresh and marine waters. Can. J. Fish. Aquat. Sci. 41: 1015-1023
Bird, D. F., Kalff, J. (1986). Bacterial grazing by planktonic lake algae. Science 231: 493-495
Bjernsen, P. K. (1986). Bacterioplankton growth yield in continuous plankton cultures. Mar. Ecol. Prog. Ser. 30: 191-196
B~rsheim, K. Y., Bratbak, G. (1987). Cell volume to cell carbon conversion factors for a bacterivorous Moms sp. enriched from seawater. Mar. Ecol. Prog. Ser. 36: 171-175
Bratbak, G., Dundas, I. (1984). Bacterial dry matter content and biomass estimations. App. environ. Microbial. 48: 755-757
Brown, 0, B., Evans, R, H., Brown, J. W., Gordon, H R., Smith, R. C., Baker, K. S. (1985). Phytoplankton blooming off the U.S. east coast: a satellite description. Science 229: 163-167
Caperon, J., Schell, D., Hirota, J . , Laws, E. (1979). Ammonium excretion rates in Kaneohe Bay, Hawaii, measured by a I5N isotope dilution technique. Mar. Biol. 54: 33-40
Carlough, L. A., Meyer, J L (1990). Rates of protozoan bacterivory in three habitats of a southeastern blackwater river. J. N. Am. benthol. S o c 9: 45-53
Caron, D. A. (1984). The role of heterotrophic microflagellates in plankton communities. Ph.D thesis, Massachusetts Insti- tute of Technology/Woods Hole Oceanographic Institution WHOI-84-35
Caron, D. A., Davis, P. G, , Madin, L. P., Sieburth, J. McN. (1982). Heterotrophic bacteria and bacterivorous protozoa on oceanic environments. Science 218: 795-797
Caron, D. A., Davis, P. G., Madin, L. P., Sieburth, J McN. (1986). Enrichment of microbial populations in macro- aggregates (marine snow) from surface waters of the North Atlantic. J . mar. Res. 44: 543-565
Caron, D. A , , Goldman, J. C. (1990). Protozoan nutrient regeneration, In: Capriulo, G. M, [ed.) Ecology of marine protozoa. Oxford University Press, New York, p. 283-306
Caron, D. A,, Lim, E. L., Kunze, H., Cosper, E. M , Anderson, D. M. (1989). Trophic interactions between nano- and microzooplankton and the 'Brown Tide' In: Cosper, E. M., Bricelj, V. M., Carpenter, E. J. (eds.) Novel phytoplankton blooms: causes and impacts of recurrent brown tides and other unusual blooms. Springer-Verlag, Berlin, p. 265-294
Caron, D. A,, Lim, E. L., Miceli, G., Waterbury, J . B., Valois, F. W. (1991). Grazing and utilization of chroococcoid cyano- bacteria and heterotrophic bacteria by protozoa in labora- tory cultures and a coastal plankton community. Mar. Ecol. Prog. Ser. 76: 205-217
Caron, D. A,, Sanders, R. W., Stoecker, D. K. (in press) Planktonic protozoa and the microbial loop: new aware- ness and perspective for zooplankton research. In: Tessier, A,, Goulden, C. (eds.) Future directions in zoo- plankton population biology. Princeton University Press, Princeton
Carrick, H. J., Fahnenstiel, G. L. (1989). Biomass, size- structure, and composition of phototrophic and hetero- trophic nanoflagellate communities in lakes Huron and Michigan. Can. J. Fish. Aquat. Sci. 46: 1922-1928
Coffin, R. B., Sharp, J. H. (1987). Microbial trophodynamics in the Delaware estuary. Mar. Ecol. Prog. Ser. 41: 253-266
Cole, J. J., Findlay, S., Pace, M. L. (1988). Bacterial production in fresh and saltwater ecosystems: a cross-system over- view. Mar. Ecol. Prog. Ser. 43: 1-10
Cole, J. J., Likens, G. E., Strayer, D. L. (1982). Photo- synthetically produced dissolved organic carbon: an important carbon source for planktonic bacteria. Limnol. Oceanogr. 27: 1080-1090
Cosper, E. L., Carpenter, E. S., Cottrell, M. (1989), Primary productivity and growth dynamics of the 'brown tide' in Long Island embayments. In: Cosper, E. L., Bricelj, V. M., Carpenter, E. S. (eds.) Novel phytoplankton blooms: causes and impacts of recurrent brown tides and other unusual blooms. Springer-Verlag, Berlin, p. 139-158
Davis, P. G., Caron, D. A., Johnson, P. W., Sieburth, J. McN. (1985). Phototrophic and apochlorotic components of pico- plankton and nanoplankton in the North Atlantic: geo- graphic, vertical, seasonal and die1 distributions. Mar. Ecol. Prog. Ser. 21. 15-26
Dolan, J. R., Gallegos, C. L. (1991). Trophic coupling of ro- tifers, microflagetlates, and bacteria during fall months in the Rhode River estuary. Mar. Ecol. Prog. Ser. 77: 147-156
Ducklow, H. W., Hill, S. M. (1985). Tritiated thymidine incor- poration and the growth of heterotrophic bacteria in warm core rings. Limnol. Oceanogr. 30: 260-272
Fahnenstiel, G. L., Chandler, J . M., Carrick, H. J., Scavia, D. (1989). Photosynthetic characteristics of Lakes Huron and Michigan phytoplankton communities; P-I parameters and end-products. J. Great Lakes Res. 15: 394-407
Fenchel, T (1982a). Ecology of heterotrophic microflagel- lates 11. Bioenergetics and growth. Mar. Ecol. Prog. Ser. 8: 225-231
Fenchel, T. (1982b). Ecology of heterotrophic microflagel- lates. IV. Quantitative occurrence and importance ac bacterial consumers. Mar. Ecol. Prog. Ser. 9: 35-42
Fenchel, T (1986). The ecology of heterotrophic microflagel- lates. In: Marshall, K. C. (ed.) Advances in microbial ecol- ogy. Plenum Press, New York, p. 57-97
Fuhrman, J . A,, Ammerman, .I. A . , Azam, F (1980). Bacterio- plankton in the coastal euphotic zone: distribution, activity and possible relationships with phytoplankton. Mar. Biol. 60: 201 -207
Sanders et al.: Marine and f reshwater microbial food webs 13
Fuhrman, J. A., McManus, G. B. (1984). Do bacteria-sized marine eucaryotes consume significant bacterial produc- tion? Science 224: 1257-1260
Fuhrman, J A , Sleeter, T. D., Carlson, C. A., Proctor, L. M. (1989). Dominance of bacterial biomass In the Sargasso Sea and its ecological implications. Mar. Ecol. Prog. Ser. 57: 207-217
Gray, I. M. (1987). Differences between nearshore and off- shore phytoplankton communities in Lake Ontario. Can. J. Fish. Aquat. Sci. 44: 2155-2163
Gude, H. (1986). Loss processes influencing growth of bac- terial populations In Lake Constance. J . Plankton Res. 8: 795-810
Giide, H. (1988). D~rect and indirect influences of crustacean zooplankton on bacterioplankton in Lake Constance. Hydrobiologia 159: 63-73
Hagstrom, A., Azam. F., Andersson, A.. Wikner, J., Rassoulzadegan, F. (1988). Microbial loop in an olig- otrophic pelagic marine ecosystem: possible roles of cyanobacteria and nanoflagellates in the organic fluxes. Mar. Ecol. Prog. Ser. 49: 171- 178
Kuuppo-Leinikki, P. (1990). Protozoan grazing on planktonic bacteria and its impact on bacterial population. Mar. Ecol. Prog. Ser. 63: 227-238
Landry, M. R., Haas, L. W., Fagerness, V. L. (1984). Dynamics of microbial plankton communities: experiments in Kaneohe Bay, Hawaii. Mar. Ecol. Prog. Ser. 16: 127-133
Leibold, M. A. (1989). Resource edibility and the effects of predators and productivity on the outcome of trophic interactions. Am. Nat. 134: 922-949
Malone, T. C., Ducklow, H. W. (1990). Microbial biomass in the coastal plume of Chesapeake Bay: phytoplankton- bacterioplankton relationships. Lirnnol. Oceanogr. 35: 296-312
McManus, G. B., Fuhrman, J . A. (1988). Control of marine bacterioplankton populations: measurement and signifi- cance of grazing. Hydrobiologia 159: 51-62
McManus, G. B., Fuhrman. J. A. (1990). Mesoscale and seasonal variability of heterotrophic nanoflagellate abun- dance in an estuarine outflow plume. Mar. Ecol. Prog. Ser. 61: 207-213
McManus, G. B., Peterson, W. T. (1988). Bacterioplankton production in the nearshore zone during upwelling off central Chile. Mar. Ecol. Prog. Ser. 43: 11-17
McQueen, D. J.. Johannes, M. R. S., Post, J. R., Stewart, T. J . , Lean, D. R. S. (1989). Bottom-up and top-down impacts on freshwater pelagic community structure. Ecol. Monogr. 59: 289-309
Nagata, T. (1988). The microflagellate-picoplankton food linkage in the water column of Lake Biwa. Lirnnol. Oceanogr. 33: 504-517
Nielson, T. G., Richardson, K. (1989). Food chain structure of the North Sea plankton con~munities: seasonal variations of the role of the microbial loop. Mar. Ecol. Prog. Ser. 56: 75-87
Pace, M. L. (1982). Planktonic ciliates: their distribution. abundance, and relationship to microbial resources in a monomictic lake. Can. J. Fish. Auuat. Sci. 39: 1106-1116
Pace, M. L.. Funke, E. (1991). Regulation of planktonic microbial communities bv nutrients and herbivores. Ecology 72: 904-914
Pace, M. L., McManus, G. B . , Findlay, S. E. G . (1990). Plank- tonic comrnunlty structure determines the fate of bacterial production in a temperate lake. Limnol. Oceanogr. 35: 795-808
Porter, K. G., Paerl, H., Hodson, R., Pace, M.. Priscu, J., Riemann, B., Scavia, D., Stockner, J. (1988). Microbial
interactions in lake food webs. In: Carpenter, S. R. (ed.) Complex interactions in lake communities. Springer- Verlag, New York, p. 209-227
Proctor, L. M,, Fuhrman, J A. (1990). Viral mortality of marine bacteria and cyanobacteria. Nature, Lond. 343: 60-62
Riemann, B. (1985). Potential importance of fish predation and zooplankton grazing on natural populations of fresh- water bacteria. Appl. environ. Microbiol. 50: 187-193
Roman, M. R., Yentsch, C. S., Gauzens, A. L., Phinney, D. A. (1986). Grazer control of the fine-scale distribution of phytoplankton in warm-core Gulf Stream rings. J. mar. Res. 44: 795-813
Sanders, K . W., Porter, K. G. (1986). Use of metabolic in- hibitors to estimate protozooplankton grazlng and bac- terial production in a monomictic eutrophic lake with an anaerobic hypolimnion. Appl. environ. Microbiol. 52: 101-107
Sanders. R. W., Porter, K. G. (1988). The fate of bacteria: microbial trophodynamics in freshwater and marine habitats. EOS 69: 1112
Sanders, R. W., Porter, K. G. (1990). Bacterivorous flagellates as food resources for the freshwater crustacean zoo- plankter Daphnia ambigua. Limnol. Oceanogr. 35: 188-191
Sanders, R. W., Porter, K. G., Bennett, S. J., DeBiase, A. E. (1989). Seasonal patterns of bacterivory by flagellates, ciliates, rotifers, and cladocerans in a freshwater plank- tonic community. L~n~nol . Oceanogr. 34: 673-687
Scavia. D., Laird, G. A. (1987). Bacterioplankton in Lake Michigan: Dynamics, controls, and significance to carbon f l u . Limnol. Oceanogr. 32: 1017-1033
Servais. P., Billen, G., Vives-Rego, J (1985). Rate of bacterial mortality in aquatic environments. Appl, environ. Micro- biol. 49: 1448-1454
Sherr, B. F., Sherr, E. B., Newell, S. Y. (1984). Abundance and productivity of heterotrophic nanoplankton in Georgia coastal waters. J . Plankton Res. 6: 195-202
Sherr. B. F., Sherr, E. B., Andrew, T. L., Fallon, R. D., Newell, S. Y. (1986). Trophic interactions between heterotrophic Protozoa and bacterioplankton in estuarine water ana- lyzed with selective metabolic inhibitors. Mar. Ecol. Prog. Ser. 32: 169-179
Sherr, E. B., Sherr, B. F., Fallon, R. D., Newell, S. Y (1986). Small, aloricate ciliates as a major component of the marine heterotrophic nanoplankton. Limnol. Oceanogr. 31: 177-183
Sieburth, J . M. , Davis, P. G . (1982). The role of heterotrophic nanoplankton in the grazing and nuturing of planktonic bacteria in the Sargasso and Caribbean Seas. Annls. Inst. oceanogr.. Paris 58(S): 285-296
Simon, M. (1987). Biomass and production of small and large free-living and attached bacteria in Lake Constance. Limnol. Oceanogr. 32: 591-607
Steele, J. H., Henderson, E. W. (1992). The role of predation in plankton models. J . Plankton Res. 14: 157-172
Taylor, G. T., Pace, M. L. (1987). Validty of eucaryote inhibitors for assessing production and grazing mortality of marine bacterioplankton. Appl. environ. Microbiol. 53: 119-128
Tranvik, L. J. (1988). Availability of dissolved organic carbon for planktonic bacteria in oligotrophic lakes of differing humic content. Microb. Ecol. 16: 311-322
Tranvik, L. J. (1989). Bacterioplankton growth, grazing mor- tality and quantitative relationship to primary production in a humic and a clearwater lake. J. Plankton Res. 11: 985-1000
Weisse, T (1989). The microbial loop in the Red Sea: dy- namics of pelagic bacteria and heterotrophic nanoflagel- lates. Mar. Ecol. Prog. Ser. 55: 241-250

Mar. Ecol. Prog. Ser. 86: 1-14, 1992
Weisse, T. (1990). Trophic interactions among heterotrophic m~croplankton, nanoplankton, and bacteria in Lake Constance. Hydrobiologia 191. 11 1-1 22
Weisse. T. (1991). The annual cycle of heterotrophic fresh- water nanoflagellates: role of bottom-up versus top-down control. J. Plankton Res. 13: 167-185
Weisse. T., Miiller. H., Pinto-Coelho, R. M.. Schweizer, A., Springmann, D.. Baldringer, G. (1990). Response of the mi- croblal loop to the phytoplankton spring bloom in a large prealpine lake. Limnol. Oceanogr. 35: 781-794
Weisse, T., Scheffel-Moser, U. (1991). Uncoupling the micro-
bial loop: growth and grazing loss rates of bacteria and heterotrophic nanoflagellates in the North Atlantic. Mar. Ecol. Prog. Ser. 71: 195-205
This article was presented by D. K. Stoecker, Cambridge, Maryland, USA
White, P. A.. Kalff, J., Rasmussen, J . B., Gasol, J M (1991). The effect of temperature and algal biomass on bacterial production and specific growth rate in freshwater and marine habitats. Microb. Ecol. 21: 99-1 18
Wikner, J., Rassoulzadegan, F., HagstrBm, A. (1990). Periodic bacterivore activity balances bacterial growth in the marine environment. Limnol. Oceanogr. 35: 313-324
Wright, R. T., Coffin, R. B. (1984). Measuring rnicrozoo- plankton grazing on planktonic marine bacteria by its impact on bacterial production. Microb. Ecol. 10: 137-149
Wright, R. T., Coffin, R.T., Lebo, M.E. (1987). Dynamics of planktonic bacteria and heterotrophic flagellates in the Parker estuary, northern Massachusetts. Contin. Shelf Res. 7: 1383-1397
Manuscript hrst received: February 6, 1992 Revised version accepted: July 29, 1992