RELATIONSHIP BETWEEN WIND AND SOLAR ELECTRICAL ENERGY …
71
RELATIONSHIP BETWEEN WIND AND SOLAR ELECTRICAL ENERGY POTENTIAL IN THE TEXAS HILL COUNTRY: A STUDY AT THE TEXAS STATE FREEMAN RANCH CENTER by Alison M. Owen, B.S. A thesis submitted to the Graduate Council of Texas State University in partial fulfillment of the requirements for the degree of Master of Science in Interdisciplinary Studies with a Major in Interdisciplinary Studies August 2015 Committee Members: Richard Earl, Chair Donald Huebner Douglas Morrish
Transcript of RELATIONSHIP BETWEEN WIND AND SOLAR ELECTRICAL ENERGY …

RELATIONSHIP BETWEEN WIND AND SOLAR ELECTRICAL ENERGY
POTENTIAL IN THE TEXAS HILL COUNTRY:
A STUDY AT THE TEXAS STATE
FREEMAN RANCH
CENTER
by
Alison M. Owen, B.S.
A thesis submitted to the Graduate Council of
Texas State University in partial fulfillment
of the requirements for the degree of
Master of Science in Interdisciplinary Studies
with a Major in Interdisciplinary Studies
August 2015
Committee Members:
Richard Earl, Chair
Donald Huebner
Douglas Morrish

COPYRIGHT
by
Alison M. Owen
2015

FAIR USE AND AUTHOR’S PERMISSION STATEMENT
Fair Use
This work is protected by the Copyright Laws of the United States (Public Law 94-553,
section 107). Consistent with fair use as defined in the Copyright Laws, brief quotations
from this material are allowed with proper acknowledgement. Use of this material for
financial gain without the author’s express written permission is not allowed.
Duplication Permission
As the copyright holder of this work I, Alison M. Owen, authorize duplication of this
work, in whole or in part, for educational or scholarly purposes only.

DEDICATION
This thesis is dedicated to my mother, Kate Owen. Thank you for always
believing in me. Your constant and unconditional love and support has guided me to
where I am today. I owe my success to you. Thank you for igniting within me a desire to
learn and explore.

v
ACKNOWLEDGEMENTS
The author would like to extend sincere appreciation to the Texas State
Engineering Department. Multiple professors of the department provided valuable insight
and understanding to the technical application of this research. Specifically, Dr. Jesus A.
Jimenez who graciously provided the simulation calculator used in this research.
Additionally, this research was influenced by Dr. Richard Earl from the Texas
State University Geography Department. His feedback, encouragement, and patience
were a driving force in the completion of this research. Thank you.

vi
TABLE OF CONTENTS
Page
ACKNOWLEDGEMENTS .................................................................................................v
LIST OF TABLES ........................................................................................................... viii
LIST OF FIGURES ........................................................................................................... ix
ABSTRACT .........................................................................................................................x
CHAPTER
1. INTRODUCTION ...................................................................................................1
Problem Statement .............................................................................................1
Purpose Statement .............................................................................................2
Research Questions ...........................................................................................2
Research Matrix .................................................................................................2
Objectives ..........................................................................................................3
Hypothesis..........................................................................................................3
2. LITERATURE REVIEW ........................................................................................4
Overview ............................................................................................................4
Basics of Wind and Solar Energy Generation ...................................................7
Wind .............................................................................................................7
Solar ...........................................................................................................11
Hybrid Systems that Utilize Wind and Solar ...................................................14
Previous Studies on Hybrid Wind and Solar Systems ...............................15
Examples that worked ....................................................................15
Examples that did not work ...........................................................16
Lack of Data for this and Similar Areas ....................................................18
Methods for Analyzing Wind and Solar Potential ...........................................19
Frequency of Data Collection ................................................................... 19
Weibull Analysis ........................................................................................20
Electrical Demand ......................................................................................22
Peaks in Electrical Demand ...........................................................22
Texas Wind and Solar Resources ..............................................................22
Maps of Wind and Solar Energy Potential for the Area ................22
vii
Wind and Solar Electric Generation ...............................................................26
Gaps in Literature ............................................................................................27
3. METHODS ............................................................................................................29
Background on the Freeman Ranch Center .....................................................29
Renewable Energy Resource Availability
at the Freeman Ranch Center .........................................................30
Energy Usage ............................................................................................ 32
Methods............................................................................................................33
Simulation Calculator ................................................................................34
Model of Wind Production ....................................................................... 35
Model of Solar Production .........................................................................38
4. RESULTS ..............................................................................................................41
Contributions from Individual Energy Sources ...............................................41
Hybrid System Performance ............................................................................44
Annual and Seasonal Demand and Production ................................................44
Cost ..................................................................................................................47
5. DISCUSSION ........................................................................................................50
Limitations .......................................................................................................53
Implications for Future Research .....................................................................54
Summary ..........................................................................................................55
Conclusion .......................................................................................................56
REFERENCES ..................................................................................................................58
viii
LIST OF TABLES
Table Page
1. Average Annual and Seasonal Renewable Resource Availability ................................30
2. Residential Monthly, Annual, and Seasonal Electricity Usage .....................................32
3. Transitional Site Meteorological Station: Geographic and Instrumentation
Characteristics ........................................................................................................34
4. Forest Site Meteorological Station: Geographic and Instrumentation
Characteristics ........................................................................................................34
5. Wind Turbine Parameters ..............................................................................................37
6. Seasonal Production from Solar and Wind Compared to Electricity Demand ..............42
7. Annual Production from Solar and Wind Compared to Energy Demand .....................43
8. Annual and Seasonal Production from Hybrid System .................................................44
9. Seasonal and Total Energy Annual Demand and Production in kWh/Day ...................46
10. Wind and Solar Production versus Cost ......................................................................48
ix
LIST OF FIGURES
Figure Page
1. Average Annual Wind Speed in Texas ..........................................................................24
2. Average Daily Solar Radiation (kWh/m2) in Texas ......................................................25
3. Seasonal Renewable Energy Resource Availability ......................................................31
4. Seasonal Average Electric Production ...........................................................................43

x
ABSTRACT
Fossil fuel use has led to environmental concerns creating a need for renewable
energy sources. The purpose of this study is to analyze metrological data collected at the
Freeman Ranch Center to determine if there is the potential for wind energy to
supplement solar energy, creating more consistent and reliable energy for the residents of
the Texas Hill Country. Hybrid renewable energy systems are an effective way to
overcome some of the challenges associates with specific renewable energy sources. A
simulation calculator was used to simulate weather conditions of the study area along
with potential output of a hybrid wind and solar renewable energy system. A hybrid wind
and solar energy system has the ability to significantly contribute to the electricity needs
but marginally contribute to the total energy needs of the Texas Hill Country residents.
When factoring in cost of the renewable energy theologies it becomes clear that wind
energy is not an economically desirable option. The added benefit of supplementing solar
energy with wind energy is not significant enough to justify the added cost of wind power
at this time for the study area.

1
CHAPTER 1
INTRODUCTION
I. Problem Statement
The burning of fossil fuel has been linked to global warming for many years. The
consequences of global warming are recognized as a significant risk to civilization. The
climate change associated with the burning of fossil fuels is occurring much faster than
historically estimated by scientists (Leggett and Ball 2012). The finite supply and the
environmental costs from fossil fuels have created a need for renewable energy sources.
The solution of utilizing renewable energy sources is the most frequently presented
solution for minimizing the risk and effects of climate change. Studies report that a
complete worldwide transition to renewable energy sources is possible by the year 2050
(Leggett and Ball 2012). Experts believe that wind and solar energy hold the most
potential and will be the primary energy sources in the future (Leggett and Ball 2012).
Wind and solar energy are two of the many options for renewable energy sources
that are readily available today. The Texas Hill Country is described as an area not
suitable for harvesting wind energy, as this area has a low average wind speed (National
Renewable Energy Laboratory 2014). The Texas State University Freeman Ranch Center
in San Marcos, Texas has collected years of wind and solar data that can be used to assess
the viability of generating electricity from wind and solar in the region. This study will
look at the relationship between wind and solar electrical generation to see if wind energy
could be used to supplement solar energy, to provide a more reliable source of renewable
energy.
2
II. Purpose Statement
The purpose of this study was to analyze the available metrological data and
determine the relationship between the levels of available wind and solar energy at the
Texas State University Freeman Ranch Center. The results of this research will show if
there is the potential for wind energy to supplement solar energy and create a more
consistent energy source from these renewable resources at the Freeman Ranch Center
and in the Texas Hill Country.
III. Research Questions
This study intends to answer three specific research questions. The research questions
for this study are as follows:
For a Texas Hill Country Location:
1. How much energy could a residential sized solar system provide?
2. How much energy could a residential sized wind turbine provide?
3. How much could the two systems provide conjunctively in a hybrid system?
IV. Research Matrix
The study area included the Freeman Ranch Center located approximately five miles
west of San Marcos, Texas. Meteorological data from two weather stations at the
Freeman Ranch Center were analyzed to assess the wind and solar energy viability for the
region. The weather stations record measurements every thirty minutes. Data utilized was
wind speed (m/s) and solar radiation (watts/sq_m). Two years of metrological data were
analyzed for each of the weather stations. Data from these stations are from January 1,

3
2008 to December 31, 2009 for the forest site and January 1, 2009 to December 31, 2010
for the transitional site.
V. Objectives
The aim of the described research was to build on the literature of this topic and
provide a better understanding of potential contributions wind energy has specifically in
areas with low average wind speeds. The objectives of this research include:
1. To compare the relationship between wind and solar energy in the Texas Hill
Country;
2. To examine the contribution wind energy can make to solar energy in the study
area;
3. To investigate the implications of the found results.
VI. Hypothesis
It was hypothesized that there is enough wind and solar energy potential at the
Freeman Ranch Center to demonstrate that the Texas Hill Country can benefit from
small hybrid renewable energy systems.

4
CHAPTER 2
LITERATURE REVIEW
I. Overview
The need for renewable energy sources stems from the recognition of the finite
supply of fossil fuels, rising cost of fossil fuels, and the pollution caused by fossil fuels.
Despite these issues, fossil fuels still dominate the energy market, accounting for over
80% of energy production globally (Hedberg 2010). Both the physical environment and
the social environment are greatly impacted by the consumption and production of energy
from fossil fuels. Overwhelming evidence supports the fact that production and use of
fossil fuels is unsustainable and has major environmental costs. (Hedberg 2010). Fossil
fuels are a limited nonrenewable resource and experts predict that within the next few
centuries most will be depleted. In addition to a diminishing supply, fossil fuels face the
problem of damage to the environment. A leading cause of climate change is the
accumulation of carbon dioxide in the atmosphere from the burning of fossil fuels
(Mostafaeipour 2011).
Energy derived from fossil fuel is both limited and non renewable which means
that these energy resources are becoming more scarce and expensive (Rahim et al. 2012).
Despite the increase in scarcity and expense, the global demand for energy will continue
to rise. “It is expected that worldwide primary energy demand will increase by 45%, and
demand for electricity will increase by 80% between 2006 and 2030” (Santos-Alamillos
et al. 2012). In developed countries there is an expected 1% annual energy growth rate
5
and an expected 5% annual energy growth rate for developing countries (Rahim et al.
2012).
One of the major energy risks that civilization faces is peak fossil fuel. Peak fossil
fuel refers to fossil fuel production increasing to a peak and then gradually declining to
where it can no longer meet demand. Demand will only be met at prices that are too high
to meet the wide spread fossil fuel use that is currently observed today (Leggett and Ball
2012). Researchers discuss the “plausible worst case scenario for peak fossil fuel” which
is the earliest predicted peak supported by a substantial amount of peer reviewed
literature (Leggett and Ball 2012). Research done by Leggett and Ball (2012) indicate
that all fuel types except for coal are expected to peak before 2030 with an average of
2028. Rahim et al explain that “when global energy production is primarily and
continuously dominated by fossil fuels, an energy crisis will occur in the future” (Rahim
et al. 2012). They claim that in order to avert an energy crisis renewable energy resources
will need to be developed in every country.
The potential consequences of climate change have been extensively studied. One
of the major goals of researchers is to understand and accurately predict the impending
global climate change patterns. Climate change and global warming is expected to
intensify as fossil fuel use is continued, resulting in more extreme weather events. Flood
and drought are two weather events that are of most concern. It is estimated that in the
event that the peak fossil fuel scenario is experienced, that 500 million people will be
affected by floods and there will be an increase of 15 to 25 percent to the global land
area affected by drought by 2100 (Leggett and Ball 2012).

6
Fortunately there are solutions that are believed to both prevent the risk of peak
fossil fuel and reduce the effects of climate change. Overwhelmingly, researchers support
a transition from fossil fuel to renewable energy, with wind and solar as the primary
sources. The current figures show that wind and solar have the ability to completely
replace fossil fuel use as early as 2024, if the growth trajectory of wind and solar
continues to follow the growth rate of the mobile phone/China Expressway system
(Leggett and Ball 2012).The pervious statistic is derived from comparing the adoption of
renewable energy to the adoption rate of another technology. While this is an important
goal and will be a monumental milestone if achieved, there are irreversible and
unavoidable climatologic consequences that will still occur. The cessation of fossil fuel
related carbon dioxide emissions will not stop global warming, but it will limit future
warming. At this point climate recovery is possible, but it is an extremely long process.
The impending energy crisis requires dynamic action in order to be averted. First
and foremost there needs to be a global reduction in overall energy consumption.
Secondly, there is going to have to be a reduction in the dependence on fossil fuels.
Renewable energy sources are going to have to be explored and implemented. Currently
renewable energy sources such as biomass, hydro, solar, and wind are the most viable
alternative to conventional fossil fuel use (Lovejoy 1996).
Researchers believe that with the established harvest technology and ample
domestic availability with renewable energy, complete or near complete energy security
is possible (Eke et al. 2005). It is accepted that there is great importance on the
development of renewable energy technologies to achieve a more sustainable energy
supply. Renewable energy faces many obstacles that limit the growth and development of

7
these technologies. Currently, renewable energy technologies are not able to supply any
country with enough energy to meet total energy demand (Eke at al. 2005).
There is substantial literature on renewable energy sources and support for
increasing implementation of renewable energy methods. There is a consensus that
renewable energy alternatives are the only answer to ensure a long term energy solution.
Renewable energy leaves future generations with a non-depleting energy source as well
as a healthier environment.
II. Basics of Wind and Solar Energy Generation
a. Wind
Historically, wind machines were used to do work such as pumping water and
grinding grain and other materials. It is only recently that wind energy has been used to
generate electricity on a larger scale. Although the application has evolved, the modern
day wind turbine is similar in principle to its ancestors. Materials such as metal and
fiberglass have replaced the old wooden designs and the modern turbines are much
larger, sleeker, and quieter (Pasqualetti 2004).
In theory, the Earth holds enough wind potential to meet the energy demands of
the world. Almost every country has sites available with wind speeds sufficient for
energy production. Various constraints such as funding, environmental concerns,
landscape of suitable sites, and available technology make the feasibility of worldwide
wind energy development difficult. In addition to these constraints, wind is a variable that
is extremely variable and random (Sesto and Casale 1998).

8
Wind energy has been described as a renewable energy option that offers many
advantages. Wind energy is often the more economical choice compared to the other
renewable energy options, and it is technologically and environmentally more attractive
(Sesto and Casale 1998).
One of the main attributes of wind energy that has lead to its growing popularity
is its minimal environmental impact. Wind energy does not contribute to air pollution,
require supply trains, mining, pumping, drilling, or pipelines, nor does it generate
radioactive waste, and does not use or pollute water (Pasqualetti 2004).
While wind energy is praised as being superior to fossil fuels from an
environmental perspective, it does not come without some concerns and limitations.
Despite the widespread popularity of the wind energy industry, there are some hurdles
that still need to be overcome. Noise from the turbines, risk to wildlife, television
interference, dangers to aircraft, and landscape aesthetic degradation are some of the
factors that influence the public opinion of wind energy development. Additionally, wind
energy from a single region cannot be relied upon to supply base load power, because
wind velocities vary throughout the day and as well as seasonally.
Feasibility of wind energy production depends on the energy needs of a specific
area and the availability of wind. The size of the wind turbine used determines the
necessary wind to produce electricity. While small wind turbines produce less electricity
compared to the larger systems but in some cases, smaller wind turbines require lower
wind speeds to operate. The lower required operating speed can make small wind turbine
systems a good option for energy production in areas with less than desirable average
wind speeds, but low energy demands.

9
When researching wind energy potential it is imperative for the energy needs of
the specific location to be clearly defined. The energy demand of a site is one of the most
important factors when choosing a wind turbine and calculating feasibility of wind
energy production. When determining energy demand, it is important for a consumer to
consider all potential energy needs as well and the possible changes in future energy
demand. Failing to accurately assess energy demand could result in installing systems
that are either too large or too small. Installing a renewable energy system that is not
optimized for the specific needs of the consumer, can lead to wasting money on
unnecessary equipment or investing in a renewable energy resource and not being able to
meet energy demands. There are many factors that influence the performance and success
of wind energy production (Pasqualetti 2004). It is apparent by the continued growth of
the wind energy industry that these concerns, while important, do not seem to be having a
major affect on the growth of the industry. There is extensive research on all of these
concerns, and in most cases there are simple and manageable solutions that can be
implemented. It is important for the wind industry to closely monitor these concerns, as
they have the power to influence public opinion towards wind energy development
(Pasqualetti 2004).
The popularity of wind power is wide spread and increasing due to its growing
profitability and the environmental benefits it provides (Pasqualetti 2004). Additionally,
contrary to fossil fuels, wind is widely available across the globe. The first step to
developing wind energy is identifying locations with the best potential. More than just
finding the wind, it is essential that there is an understanding of the wind characteristics
of the proposed wind energy sites.

10
Previously, not as much consideration went into turbine placement, it was simply
a matter of convenience and necessity. Now that turbines are being used for energy
generation rather than pumping and grinding, much more thought and planning goes into
the placement. There needs to be an understanding of physics, meteorology, and
aerodynamics, to be able to determine the optimal placement of wind turbines, as all play
a role in the efficiency of the units. In addition, there are factors that can potentially limit
the adoption of wind energy, and those are land ownership, zoning, land use planning,
and public opinion (Pasqualetti 2004).
By January 2011, Texas was a leader of the nation in terms of installed wind
capacity, boasting 10,085 MW of installed capacity (Alexander 2011). Texas has
continued to hold the lead and currently leads the nation with over 14,200 MW of
installed capacity (American Wind Energy Association 2015). Texas is a major
frontrunner in the wind energy industry and some describe the growth of the wind energy
industry in Texas as reminiscent of the early 20th
century oil and gas boom (Alexander
2011). As seen in the first Texas oil fields, there is a great demand for wind energy along
with minimal regulation of the development of the industry. History warns that
unregulated rapid growth could lead to a waste of wind energy resources as seen in the
early oil and gas industry. Given that wind is a renewable resource the term “waste” does
not have the same meaning as with oil and gas. When wasted, oil and gas is lost for good
but wind is replenishable. Wasting wind refers to the opportunity cost of not harnessing
the wind for electric power or doing it in an inefficient manner (Alexander 2011).

11
Although Texas is the leader in terms of installed wind capacity for the nation,
most of the wind potential for the state is located in the northern and western regions of
the state, where demand is the least (Pasqualetti 2004).
Even though wind energy is named one of the leading alternatives to fossil fuel
use, there are still problems that limit the development of the resource. The intermittency
of wind poses a challenge to providing a reliable renewable energy source. One of the
ways that this problem is being overcome, is by coupling solar with wind energy systems.
b. Solar
Solar energy is claimed to be one of the most important alternatives for viable
sustainable energy in the future (Hedberg 2010). Given the clean nature of solar and its
wide spread availability, solar is an attractive alternative energy source. The technology
for solar is already advanced and continues to develop. There is an unlimited resource
base available for solar energy. The amount of energy that the Sun emits is astronomical.
In just a single second the Sun radiates more energy than people have used since the
beginning of time (Solangi et al. 2011).
Researchers are optimistic that complete reliance on renewable energy is an
achievable goal. Solar energy is a leading candidate as a resource capable of transitioning
completely away from fossil fuel. With a global energy consumption that is less than
0.01% of the energy that reaches the Earth from the Sun, total dependence on solar
energy is a realizable goal (Lovejoy 1996). There has been rapid growth in recent years
for photovoltaic facilities. In the United States alone the annual growth rate for
photovoltaic and concentrating solar power was 22% in 2010 (Rahim et al. 2012). Similar
figures can be seen worldwide. In Europe, total installed capacity went from 4,600 MW

12
in 2008 to 16,000 MW in 2010. In the Asia-Pacific regions, total installed cumulative
capacity rose from 333 MW in 2006 to 2,036 MW in 2010 (Rahim et al. 2012).
Researchers estimate that only 0.1% of the surface of the Earth would need to be covered
by solar collectors to provide a global solar powered energy supply. Solar collectors
would include biomass and wind generators (Lovejoy 1996). A large majority of the land
area used would be in the desert region terrains, not suitable for agriculture.
There are a variety of ways that sunlight can be used to generate power.
Concentrating solar power, solar heating, photovoltaic, and solar fuel synthesis are the
most common solar technologies utilized. Solar energy does not contribute as much
electricity as wind in the U.S., because it is not yet cost competitive in most locations and
situations (Langniss and Wiser 2003).
Similar to wind, solar power faces the challenge of the inherent inconsistent
nature of the resource. This is one of the largest hurdles that the wind and solar renewable
sources face, and a major issue which researchers are addressing (Garrison and Webber
2011).
In the literature on solar energy, it is stressed that there is going to be a need for
political support for a transition to take place to renewable energy sources. This is true for
both wind and solar energy. There is a great deal of urgency on this matter, as historically
transition times related to energy sources are long (Lovejoy 1996). Texas has had
success in political support for renewable energy. The use of the renewables portfolio
standard, which is a policy instrument aimed at ensuring a minimum amount of
renewable energy contributes to the portfolio of energy resources (Langniss and Wiser
2003). This approach has been quite successful and can be beneficial to other states as

13
well as other countries. It is important that the policies that are designed to support
renewable energy development, encourage the diversification of renewable energy
sources (Langniss and Wiser 2003). One of the major pitfalls Texas has seen with the
renewables portfolio standard is that it is heavily supportive of the development of wind.
While Texas has some of the best wind potential in the country, it would be beneficial to
develop the solar energy potential in the state. When looking at renewable resource
availability for the state, resource availability where populations and energy demand is
highest, should be considered. While there is a great wind resource in the state of Texas,
solar tends to be the more available resource in the populated areas. Wind development in
the panhandle at the commercial level will be important in achieving the coal of zero
dependence on fossil fuel. Contributions of residential renewable energy systems must
also be considered. At the residential level in Texas, solar has the potential to
significantly contribute to energy needs. It is important for policies to also encourage the
development of solar energy.
One of the major problems with solar energy is the difficulty of meeting supply
with demand over long term periods. The availability of solar energy varies as a result of
factors, such as time of day, local weather conditions, geographical position, season, and
other environmental characteristics (Rahim et al. 2012). Over time, there will be a
change in weather conditions which will affect solar radiation availability. It may
increase for some areas, but it may also decrease for others. Energy demand will continue
to grow with the constant rise in population in Texas, in absolute terms, the fastest
growing state in the U.S. It is going to be necessary for new technologies to determine

14
“the balance between demand and supply in developing solar energy to its full efficient
scale” (Rahim et al. 2012).
III. Hybrid Systems that Utilize Wind and Solar
Wind and solar energy are two of the most viable renewable energy options
available today. Although these are the frontrunners for renewable energy technologies
today, there are drawbacks associated with these methods. Solar energy has the potential
to be unpredictable because of its dependence on weather and varying climatic conditions
(Hongxing et al. 2009). Wind energy is very intermittent in nature which decreases its
reliability as a dependable energy source (Hedberg et al. 2010).
Research finds that in a standalone design, neither wind nor solar are effective in
providing continuous power. Periodical and seasonal variations in weather patterns create
times where electrical load demand needs cannot be met by one renewable energy source
(Zhou 2010). Research has found that an effective way to provide more reliable and
consistent energy is to create a system that uses two or more renewable energy sources.
These systems are known as hybrid power generation systems. These hybrid systems are
designed so that the strengths of one source overcome the weaknesses of the other
(Hongxing et al. 2009) (Zhou 2010). Many renewable energy systems are designed to
incorporate a backup power system. These backup power systems are usually either a
generator or the utility grid. The backup power systems are designed to provide power
when too much energy has been consumed or there has not been enough renewable
energy captured by the system. Hybrid systems can minimize or eliminate the need of
backup power for users who struggle with single source systems that are not receiving
enough renewable energy (Subrahmanyam et al. 2012).

15
While it may seem advantageous to always utilize hybrid system, not all locations
are suitable for hybrid renewable energy systems. In order for a hybrid power generation
system to be effective there needs to be complementary characteristics between the
energy sources used. For example, when conditions are favorable for one source, they
are unfavorable for the other.
The use of hybrid energy systems in rural and remote areas has been described as
one of the most promising applications for renewable energy (Nema et al. 2009). There is
growing popularity for hybrid systems in remote areas, mainly due to the increases in
renewable energy technologies and the growing cost of petroleum and petroleum
products.
Existing research warns some of the challenges that hybrid systems have faced. A
Chinese study by Jun et al. describes the Xcalak systems, which perform well for about
the first two years, and by the seventh year is a complete failure.
System optimization is another challenge of hybrid renewable energy systems. It
is difficult to find the best mix and systems between the multiple energy sources. Proper
optimization can lead to an increase of 50% in energy production (Jun et al. 2011).
a. Previous Studies on Hybrid Wind and Solar Systems
i. Examples that worked
There are many studies that have looked at a similar research question and had
findings supportive of the hypothesis proposed. These other research projects are
important and provide valuable insight into how the research in the Texas Hill Country
should be conducted. A study of southwestern Minnesota found that a model wind solar

16
thermal electric power plant produced better electric load matching characteristics than a
wind only power plant (Reichling and Kulacki 2008). Another study in Cardiff, United
Kingdom found that not only did a hybrid wind and solar supply more autonomy than
single source systems, but also a lower unit cost (Celik 2002). One hybrid wind and solar
feasibility study discussed the current global energy crisis and brought up how around 1.5
billion people worldwide still do not have access to electricity. This study focused on
remote populations and the potential impact hybrid wind and solar energy systems can
have for these people. This segment of the population often live in areas where their only
source of electricity comes from expensive and pollution producing diesel generators,
despite the wide local availability of renewable energy resources. This study analyzed the
effectiveness of potential wind and solar systems that utilize a battery storage device. The
results showed that for the particular remote island studied, a hybrid renewable energy
system could not only replace the current diesel generator but it was also cost effective
and would supply continuous power (Ma et al. 2014).
ii. Examples that did not work
While the majority of research projects conducted in this area found it beneficial
to utilize a hybrid renewable energy system, some of the findings did not support this
conclusion. Research that found results not supporting a benefit of hybrid wind and solar
energy systems were anomalies among the research. Thoroughly studying these research
cases will allow future research projects to plan for and overcome the challenges faced in
previous studies.
None of the literature reviewed presented a study that found a hybrid wind and
solar energy system that preformed worse than a single source system. Studies that did
17
not support hybrid wind and solar systems did so because of cost rather than production.
In some cases, the additional benefits of the hybrid system, was not worth the added cost
of the system. One study located conducted by Kershman et al. (2005) in Libya
researched various small scale energy generation systems designed to power a
desalination plant. The energy systems studied include national grid connected solar,
wind, hybrid wind and solar, and power from the local grid connected diesel generator,
hybrid generator and solar and hybrid generator and wind. The study found that there was
an increase in energy production from the hybrid wind and solar system, but the
individual wind and solar components of the hybrid system did not perform as well as
their counterparts in the wind only and solar only systems. Additionally, this study found
that compared to most of the other systems analyzed the significantly higher investment
rate of the hybrid system lead to a higher cost of energy from this system (Kershman et
al. 2005).
Another study located in the Peruvian city of Paita, focused on the potential for
hybrid wind and solar systems to power residential homes. This study supported the
hybrid systems productivity and found that it would be more than enough to meet the
average annual demand with a surplus of 609.64 kWh per year. Despite the promising
projected production researches couldn’t support the system economically. It was found
in this case that the cost of energy from a hybrid wind and solar energy system would be
$0.361/kWh, which is over twice Peru’s current energy price of $0.174/kWh. Until
energy costs are above $0.361/kWh this hybrid system will not be financially viable
energy option (Sócola and Aldana 2015).

18
It was clear that the hybrid systems are successful in producing more reliable
energy. Researchers found that the optimization of the systems was crucial in the success
of the systems. There needs to be preliminary research done to ensure that the wind and
solar components chosen for the hybrid system are suitable for the specific site. Using the
wrong mix of renewable sources will result in the cost of the hybrid system not justifying
the added electrical output.
b. Lack of Data for this and Similar Areas
There are many studies that have analyzed hybrid power generation systems. Of
these studies there are many that examine the feasibility and the efficiency of systems
utilizing wind and solar energy. One of the main uses of these hybrid systems is
electrification for rural and remote areas. While these hybrid systems are more complex,
when placed in the right location they are the ideal option for energy production.
Although, there are many studies analyzing wind and solar hybrid power
generation systems, few to none have been conducted in or in an area comparable to the
Texas Hill Country. Hong Kong, China, Minnesota, Corsica Island, Izmir, Turkey,
Poland, Cardiff, United Kingdom, and Patras, Greece are all locations that have been
used for research of hybrid wind and solar power generation systems (Hongxing et al.
2009) (Notten et al. 2011)(Reichling and Kulacki 2007) (Eke et al. 2005) (Paska et al.
2009) (Celic 2001) (Tripanagnostopoulos et al. 2009). It is important for research to be
done globally in order to effectively assess the energy potential of various landscapes and
terrain.

19
IV. Methods for Analyzing Wind and Solar Potential
The accepted unit of measure used to describe wind velocity is meters per second
(m/s). For solar insolation, the preferred unit of measure watts per square meter (W/m2).
When referring to the amount of solar and wind energy available at each site, a
conversion to kilowatt hours (kWh) is preformed.
There are two different methods that are used to model hybrid energy generation
potential. The first method is to analyze metrological data of a site and then convert it to
energy potential based on hypothetical systems to predict performance. The other method
that is commonly used is to actually build a hybrid system pilot project and measure the
energy output for the system.
When using the method of analyzing metrological data, typically a simple
anemometer is used to record wind speeds. It is not uncommon for researchers to collect
additional data such as wind direction, which requires the use of a propeller anemometer.
When collecting solar insolation an actinometer is used. For the method of building a
hybrid system, photovoltaic solar panels and a wind turbine are used to evaluate the
production potential of the system.
a. Frequency of Data Collection
In the analysis of other studies it is clear that larger data sets are preferred. To be
able to effectively study weather patterns and assess seasonal changes, a minimum of 10
years of data is the industry standard. While 10 years or more is ideal, short to medium
periods ranging from 1 to 5 years are accepted (Coste and Serban 2011). Some
researchers take samples as frequently as every ten seconds and use averages of thirty

20
minute periods. Other researchers take samples once or twice an hour for their data
measurements, which is most common in the research of meteorological conditions (Tina
and Gagliano 2010).
The Internet is another resource that is used for the data collection. In some areas
there is simply not enough data or weather stations in place to provide the specific
measurements needed. In these situations it is appropriate to turn to global weather data
that can be found on the internet. These sources of data are not preferred (Tina and
Gagliano 2010).
Site specific wind data is important to have, as small variations in wind speed can
cause large differences in wind turbine electrical output. When evaluating potential wind
energy it is always preferred to have wind energy data for the specific site.
b. Weibull Analysis
Wind speed is a highly random variable that should not be analyzed in its raw
form. A probability density function is commonly used to translate the wind data into a
usable variable when measuring wind energy potential (Mostafaeipour 2011) (Coste
2011, 7). The most common and widely accepted probability density function used on
wind speed data is the Weibull continuous probability distribution. This specific function
is the most acceptable of the distributions and is the basis for the commercial wind
energy industry applications and software (Odo et al. 2012). The Weibull distribution
describes the percentage of time that that wind speeds are at a certain level (Bivona
2003). Statistical analysis is very important in the analysis of wind power potential of a
site as it can provide data on the reliability of the amount and timing of electricity
production.
21
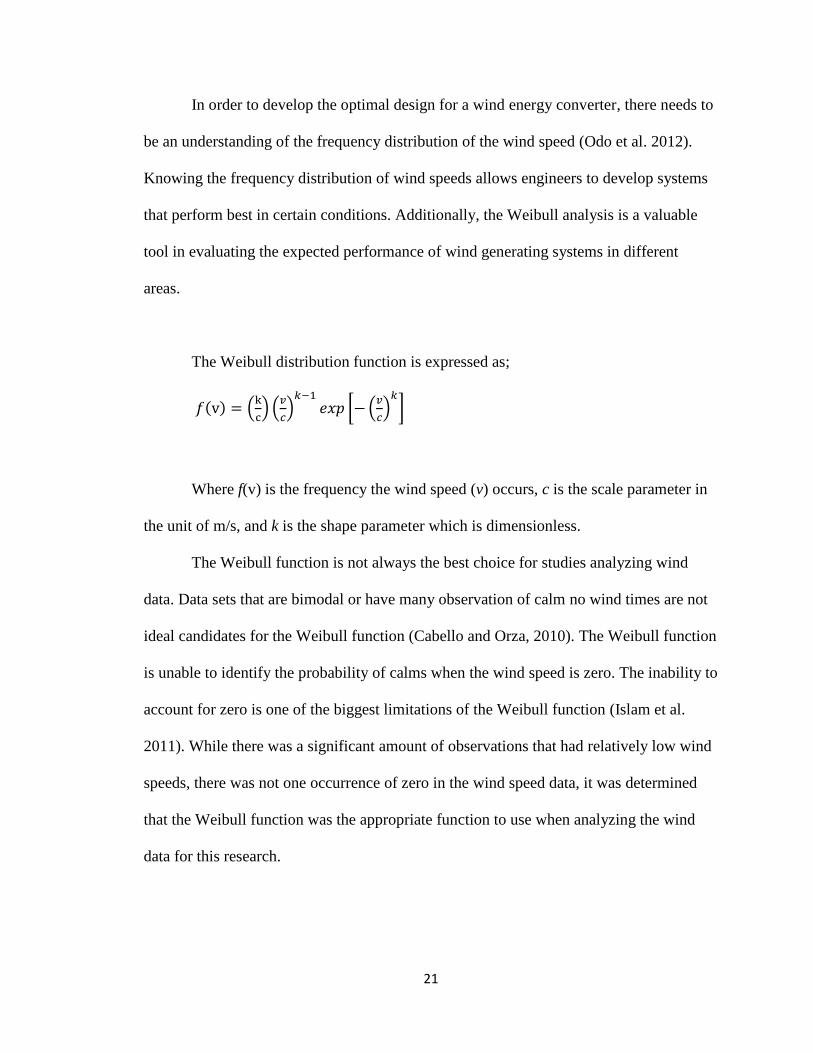
In order to develop the optimal design for a wind energy converter, there needs to
be an understanding of the frequency distribution of the wind speed (Odo et al. 2012).
Knowing the frequency distribution of wind speeds allows engineers to develop systems
that perform best in certain conditions. Additionally, the Weibull analysis is a valuable
tool in evaluating the expected performance of wind generating systems in different
areas.
The Weibull distribution function is expressed as;
Where f(v) is the frequency the wind speed (v) occurs, c is the scale parameter in
the unit of m/s, and k is the shape parameter which is dimensionless.
The Weibull function is not always the best choice for studies analyzing wind
data. Data sets that are bimodal or have many observation of calm no wind times are not
ideal candidates for the Weibull function (Cabello and Orza, 2010). The Weibull function
is unable to identify the probability of calms when the wind speed is zero. The inability to
account for zero is one of the biggest limitations of the Weibull function (Islam et al.
2011). While there was a significant amount of observations that had relatively low wind
speeds, there was not one occurrence of zero in the wind speed data, it was determined
that the Weibull function was the appropriate function to use when analyzing the wind
data for this research.

22
c. Electrical Demand
i. Peaks in Electrical Demand
Studies show that there are diurnal variations in electrical demands. A study on
west Texas found that energy demand was lowest in the morning and steadily increased
until peaking in late afternoon (Garrison and Webber, 2011). Accounting for 18 percent
of household energy use, Texas’ energy consumption for air conditioning is three times
higher than the national average. The U.S. Energy Information Administration explains
that the warmer weather of Texas is responsible for increased energy consumption for
cooling. Obviously, the warm weather increases, highlight the importance of seasonal
variations in demand and potential productivity of hybrid renewable energy systems.
In Texas the average household consumes 77.1 million Btu or 22,595 kWh of
energy annually with southern rural household energy consumption higher than average
at 81.8 million Btu which is 23,973 kWh annually (U.S. Energy Information
Administration 2014). According to 2009 data, Texas household energy consumption is
14% below the national average, while Texas household electricity consumption is 26%
above the national average. The average Texas household consumes 14,283 kWh of
electricity annually with rural residents having a slightly higher than average
consumption at 16,835 kWh annually (U.S. Energy Information Administration 2014).
d. Texas Wind and Solar Resources
i. Maps of Wind and Solar Energy Potential for the Area
Given the large size of the state of Texas, there are varying geographic landscapes
across the state. Just as the landscape changes across the state, the wind availability also

23
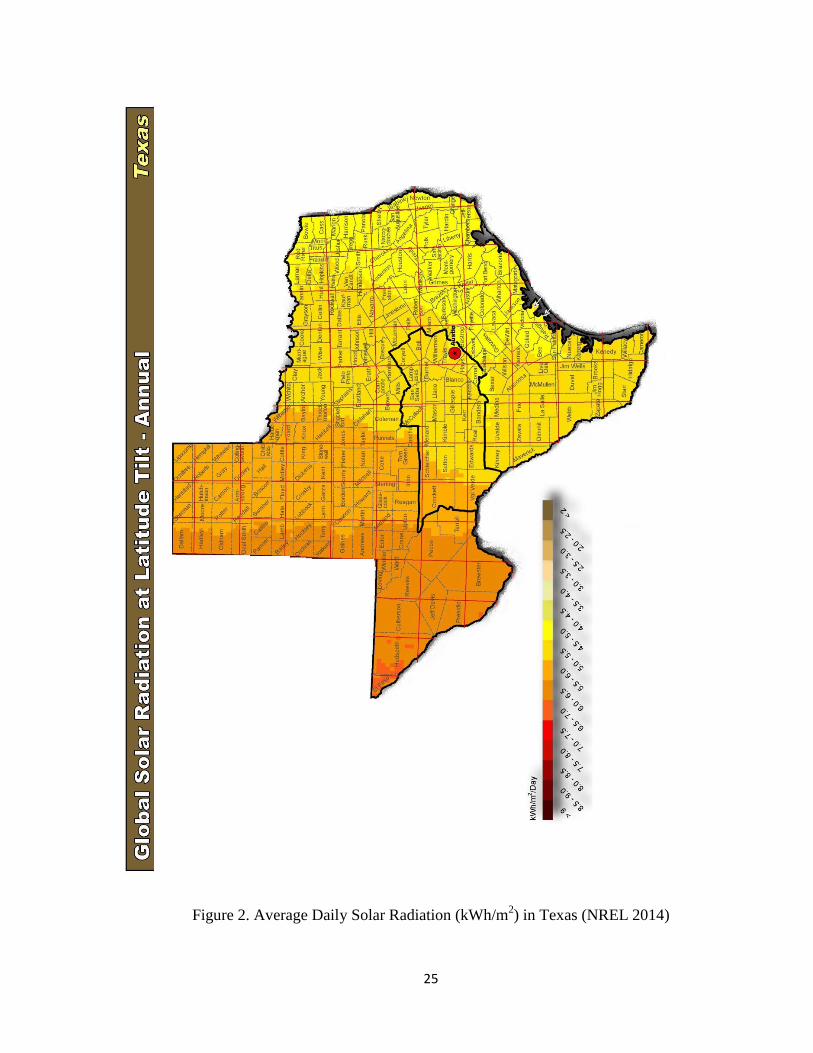
changes. Figure 1. illustrates the average annual wind speed for the entire state of Texas,
and Figure 2. illustrates the daily solar Kwh/m2
for Texas. The counties that comprise the
Texas Hill Country are outlined in bold. Figure 1. also indicates the location of the
Freeman Ranch Center.
The Texas Hill Country is the eastern, fluvially dissected portion of the Edwards
Plateau with a highly variable semi-arid to sub-humid climate (Lai and Lyons 2011). The
Balcones Escarpment defines the eastern boundary of the Hill Country (Fenneman 1931).
It is immediately west of the rapidly growing Austin-San Antonio Corridor along
Interstate Highway 35.

24
Figure 1. Average Annual Wind Speed in Texas (NREL 2014)
25
Figure 2. Average Daily Solar Radiation (kWh/m2) in Texas (NREL 2014)

26
V. Wind and Solar Electric Generation
There are two main types of wind turbines, large and small. Large turbines are
used in industrial wind projects, and on wind farms supplying energy to large
populations. Small wind turbines are seen connected to residential homes and supply
much less power. Turbines that have a capacity of 100 kilowatts or less and a generator
hub height of 120 feet or less are classified as small (Chiras 2010).
Two of the leading small wind turbines are the Polaris P10-20 a 20 kilowatt rated
wind turbine and the Bergey Excel 10 killowatt wind turbine. Both units are rated at a
speed of 11 m/s. These turbines are on the larger end of what would be utilized in a
suburban residential setting and can have trouble receiving permitting in some residential
areas. In the rural setting these turbines are popular choices (Polaris 2014) (Bergey 2015).
The cut in speed of a wind turbine is the wind speed at which the blades of the
wind turbine are rotating fast enough to begin generating energy. The cut in speed of a
turbine is proportional to the size of the turbine itself, smaller turbines have a smaller
minimum speed and vice versa. The Polaris turbine has a cut in speed of 2.7m/s and the
Bergey unit a cut in speed of 2.5 m/s. The maximum output is 12.6 kW at a wind speed of
12.5 m/s for the Bergey turbine. In the Bergey report it states that with average wind
speed of 4.9 m/s the turbine will generate 13,800 kWh of electricity annually (Polaris
2014) (Bergey 2015).
Preliminary analysis of the study location indicates that there is a limited wind
potential for the region (National Renewable Energy Laboratory 2014). Having a wind
power classification of Class One, the Texas Hill Country is not a candidate at this time

27
for major wind power investment in most of the state (National Renewable Energy
Laboratory 2014). It is understood that with current technologies, that large scale wind
turbines would not be cost effective or beneficial to residents in the Texas Hill Country.
Although there is not enough wind to support large turbines, there may be the potential
that smaller to medium sized turbines will have some success in this area.
There are people in the Texas Hill Country who argue that it does not make sense
from aesthetic and other perspectives to pursue wind projects in the area because of the
relatively low wind potential (Galbraih 2012). This research intends to contribute to the
literature on the potential influence wind energy has for the Texas Hill Country.
VI. Gaps in Literature
While there is a significant amount of literature studying renewable energy
sources as well as hybrid wind and solar energy systems, there are some gaps that are
found in the literature. First, the literature focuses on sites that are historically known for
having a high wind and solar energy potential. It comes as no surprise that when
implementing a hybrid wind and solar energy generation system; these locations thrive
supporting this technology. The proposed research helps to fill this gap by studying a
location that has marginal, at best, wind potential. The idea is that wind energy will
complement and supplement solar energy. Solar energy will be the dominant form of
energy production and wind will serve as a backup, reducing the number of instances
when outside power is needed. Demonstrating that areas unsuitable for large scale wind
energy production can benefit from wind energy on a small scale, could be a significant
step forward in the widespread adoption of renewable energy sources.

28
Another gap in the literature is that previous research focuses on the relationship
between wind and solar energy throughout the entire year. This is a shortcoming because
there will be seasonal fluctuations in the available wind and solar energy potential for any
given area. Many research examples acknowledged that there are seasonal fluctuations in
the wind and solar energy potential; few studied the magnitude of these fluctuations. This
research determines if it is possible for a site such as the Texas Hill Country, with a low
average wind speed, has enough wind at precise times of year, to make wind energy a
wise investment.
The next gap in the literature is the failure to analyze the potential environmental
effect of the batteries that are going to be needed to operate the hybrid systems. Energy
storage is a major concern for standalone renewable energy systems that are not tied to
the grid. Almost all renewable energy sources are not dependable or reliable enough to
provide adequate energy around the clock and storage of surplus energy is a necessity to
ensure continuous availability. The environmental consequences of the production and
disposal of batteries need to be examined. Wind and solar energy are praised at being
environmentally superior to the burning of fossil fuels. While it is true that wind and solar
energy have little environmental impacts, there are going to be environmental impacts
associated with the batteries. The entire lifecycle of a battery has potential environmental
impacts, the production, transportation, and disposal. Currently, the literature and
research has failed to recognize the potential consequences from the increased use and
dependence on batteries.

29
CHAPTER 3
METHODS
The research analyzed wind and solar measurements for the Freeman Ranch
Center to determine the relationship between the wind and solar electrical potential for
the region. The wind and solar data was analyzed to determine annual and seasonal
characteristics of potential electrical energy production from those sources. The results
identify if there is a complementary nature to the wind and solar resources in the Texas
Hill Country region which is beneficial to hybrid wind and solar systems.
I. Background on the Freeman Ranch Center
The Freeman Ranch Center covers 4,204 acres (1700 ha) and is situated in the
center of Hays County, Texas. The Freeman Ranch Center is a good representation of the
central Texas Hill Country landscape. Topographically the ranch can be described as
hilly with an elevation that ranges from 680 feet (200 m) to 1,000 feet (300 m). The
Freeman Ranch Center is located in the Balcones Canyonlands landform district of the
Edwards Plateau (Fenneman 1931). The Ranch can be divided into various ecozones
based on soil composition and topographic features. Approximately 74% of the ranch is
made up of upland habitats which are relatively level. Non-sloping lowlands and steep
sloping habitats constitute the remaining habitats found on the Ranch (Barnes et al 2000).
The upland habitats are made up of savanna woody plant clusters mixed with perennial
grasslands. The lower slopes are made up of evergreen woodlands, and the steep slopes
are inhabited by deciduous woodland. Overall, the distribution between herbaceous and
woody plants on the ranch is almost evenly split (Barnes et al 2000).

30
General research on the climatology for the area from San Antonio to Austin
showed that there is an average wind speed of 9 mph (4.0 m/sec) with a dominant
southerly flow. Conditions are typically breezy through the spring. The skies in the
summer months are the clearest, resulting in increased incident solar radiation and hours
of sunlight, while the winter months are significantly cloudier (Dixon 2000).
a. Renewable Energy Resource Availability at the Freeman Ranch Center
The meteorological data collected at the Freeman Ranch are generally consistent
with literature on climate conditions for this area. Table 1. summarizes the wind and solar
availability based on the data collected.
Table 1. Average Annual and Seasonal Renewable Resource Availability
One of the major discrepancies between the collected data and the literature was
the average wind speed. The average annual wind speed for the Freeman Ranch Center
was found to be 2.58 m/s, significantly lower than the expected 4.0 m/s. As predicted, the
winter and spring are the windiest seasons with an average wind speed of 2.74 m/s and
2.97 m/s respectively. For Table 1. the recorded solar data was averaged seasonally and
annually. The solar figures in Table 1. represent the average solar availability at any
given time for the respective season as well as annually. Solar availability on average is
199 W/m2
with spring and summer being the sunniest seasons at 249 W/m2 and 261 W/m
2
respectively.
Resource Fall Winter Spring Summer Annual
Wind (m/s) 2.21 2.74 2.97 2.38 2.58
Solar (W/m2) 146 140 249 261 199

31
Figure 3. illustrates the relationship between the wind and solar resource
availability throughout the year. While summer is the second least favorable season at the
Freeman Ranch when looking at wind energy but is the most favorable for solar energy.
Similarly, winter is the least favorable season for solar energy at the Freeman Ranch
Center but the second best season for wind energy.
Figure 3. Seasonal Renewable Energy Resource Availability
The landscape characteristics of the Freeman Ranch Center and the preliminary
interpretation of the wind and solar data suggest that Freeman Ranch Center is a suitable
location, supporting the complementary wind and solar characteristics preferred for an
efficient hybrid energy system. The complementary relationship provides a more reliable
energy source throughout the year, as the seasons not ideal for one energy source are
more favorable for the other.
0
0.5
1
1.5
2
2.5
3
3.5
0
50
100
150
200
250
300
Fall Winter Spring Summer m
/s
(W
/m2
)
Seasonal Renewable Resource Availability
Solar (W/m2)
Wind (m/s)

32
Understanding the climate data for the study area is important as it is crucial in
selecting the right equipment for optimal performance from a hybrid renewable energy
system. Choosing the wrong equipment for the system can be the difference between
having a successful hybrid renewable energy system and one that fails to meet the needs
of the customer.
b. Energy Usage
Presently, residential consumers of Austin Energy use an average of 11,650 KWh of
electricity per year but the usage varies seasonally as shown in Table 2.
Table 2. Residential Monthly, Annual, and Seasonal Electricity Usage (Austin Energy
2015)
Month
kWh
Season kWh
January 890
Winter
2397 February 785
March 723
April 693
Spring
2646 May 813
June 1139
July 1344
Summer
4096 August 1389
September 1364
October 1006
Fall
2511 November 742
December 763
Monthly average 971
Annual Total 11,650

33
The data used for energy usage was provided from the Austin Energy data library
(Austin Energy 2015). Austin energy provided monthly average usage for the residential
customers from 2000 to 2012. The data set was used to determine monthly and yearly
average residential energy usage. As of 2012, Austin energy had 376,614 residential
customers serving the city of Austin and surrounding areas. While the Austin Energy
residential customer base is more urban than rural, it was determined that the figures on
the previous page will be an appropriate benchmark to analyze performance of a hybrid
system in a residential application. Austin falls within the Texas Hill Country and will
provide an acceptable representation of fluctuations in energy consumption due to
seasonal climate factors. The seasons were divided as follows:
Winter: January, February, March
Spring: April, May, June
Summer: July, August, September
Fall: October, November, December
II. Methods
Data has previously been collected and provided by a research team from Texas
A&M University. Data for this research comes from two weather stations found on the
Freeman Ranch Center. These stations are referred to as the forest site and the transitional
site. The forest site station data ranges from January 1, 2008 to December 31, 2009 and
the transitional site data ranges from January 1, 2009 to December 31, 2010. Both
weather stations measured half hourly samples of average wind speed, solar radiation,

34
and wind direction. The geographic and instrumentation characteristics for the
transitional metrological site and the forest metrological site can be found in Table 3. and
Table 4. respectively.
Table 3. Transitional Site Meteorological Station: Geographic and Instrumentation
Characteristics
Table 4. Forest Site Meteorological Station: Geographic and Instrumentation
Characteristics
a. Simulation Calculator
The data was analyzed with a simulation calculator developed by Dr. Jesus
Jimenez and Dr. Tongdan Jin of Texas State University in the Center for High
Transitional Site
Latitude
Longitude
Elevation
Height of instruments
Anemometer
Radiometer
29 56’ 58.11” N
97 59’ 46.41 W
869 Feet
10 meters
Campbell Scientific CSAT3
Kipp and Zonen CNR1
Forest Site
Latitude
Longitude
Elevation
Height of instruments
Anemometer
Pyranometer
29 56’ 29.99” N
97 59’ 36.33” W
840 Feet
14 meters
Propeller
LiCor LI200

35
Performance Systems in the Ingram School of Engineering. This method is consistent
with the procedures of similar research.
The simulation calculator used in this research is operated by the Microsoft Excel
computer program. This simulation calculator required the input of various parameters
regarding weather conditions, site location, load demand, and wind turbine characteristics
in order to properly simulate weather conditions and system output for the hybrid wind
and solar energy system. To increase accuracy, 10 repetitions of the simulator were done
seasonally and annually, and the results were averaged. Each simulation of the calculator,
in theory, is equivalent to one year of data collection.
b. Model of Wind Production
Simulated wind speeds are used for calculations and modeling rather than the
recorded data. The simulated wind speeds are used because it provides a better prediction
of expected wind than the recorded data. The program used for calculations accounts for
the stochastic nature of wind by applying the Weibull distribution in the wind speed
simulation. The calculator applies average and standard deviation parameters of the
collected wind data and creates a wind speed simulation that follows the Weibull
distribution. The probability density function used by the calculator, fw(yt) is expressed as
yt represents the random wind speed at t time and v and d are the scale and shape
parameters, respectively (Villarreal et al. 2012).
The calculator uses the simulated wind speeds to determine the energy production
from the wind turbine system. There are four operating phases of a wind turbine system.

36
The operating phases are defined by three specific wind speeds: the cut-in speed, vc; the
rated speed, vr; and the cutoff speed, vs. The four operating phases of the wind turbine
system are the standby phase, the nonlinear production phase, the constant power phase,
and the cutoff phase. The standby phase is when the wind speed is greater than or equal
to zero and less than the cut-in speed. At this time there is either no wind or not enough
wind to rotate the turbine fast enough to produce electricity resulting in a power output of
zero. The nonlinear production phase occurs when the wind speed is greater than or equal
to the cut-in speed, but less than the rated speed. During the nonlinear production phase,
the wind speed is strong enough that there is electricity being produced but not at the
rated capacity of the turbine. This phase is called the nonlinear production phase because
if the wind speeds and corresponding power outputs of this phase were plotted, a curve
rather than a straight line would be observed. The constant power phase occurs when the
wind speed is greater than or equal to the rated speed, but less than or equal to the cutoff
speed. During the constant power phase the wind speed is high enough that the power
output achieved is the rated capacity of the turbine. The cutoff phase is described as the
wind speed being greater than the cutoff speed. During the cutoff phase, the wind speed
surpasses the maximum speed at which the turbine can safely produce electricity
resulting in a power output of zero (Villarreal et al. 2012). The power curve used for the
simulation is expressed as
37
Where ηw is the wind energy to electric energy conversion rate, ρ is the air
density, and Aw is the area of the wind turbine blades. Pmax is the rated power for the
turbine which is the maximum power it is capable of producing.
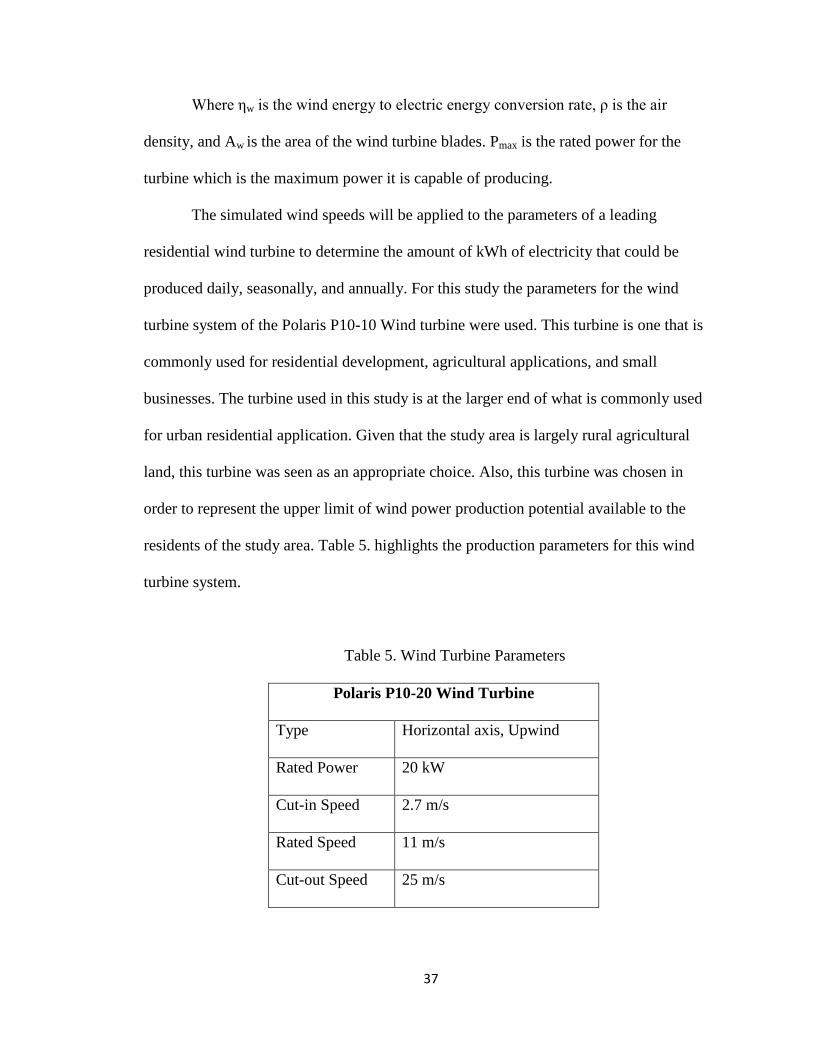
The simulated wind speeds will be applied to the parameters of a leading
residential wind turbine to determine the amount of kWh of electricity that could be
produced daily, seasonally, and annually. For this study the parameters for the wind
turbine system of the Polaris P10-10 Wind turbine were used. This turbine is one that is
commonly used for residential development, agricultural applications, and small
businesses. The turbine used in this study is at the larger end of what is commonly used
for urban residential application. Given that the study area is largely rural agricultural
land, this turbine was seen as an appropriate choice. Also, this turbine was chosen in
order to represent the upper limit of wind power production potential available to the
residents of the study area. Table 5. highlights the production parameters for this wind
turbine system.
Table 5. Wind Turbine Parameters
Polaris P10-20 Wind Turbine
Type Horizontal axis, Upwind
Rated Power 20 kW
Cut-in Speed 2.7 m/s
Rated Speed 11 m/s
Cut-out Speed 25 m/s

38
For the wind data, seasonal and annual averages were gathered. The seasons were
broken apart as follows: fall September 22nd
through December 20th
, winter December
21st through March 19
th, spring March 20
th through June 20
th, and summer June 21
st
through September 21st.
c. Model of Solar Production
Solar electrical output is not calculated in the same manner as the wind electrical
output. The technology for solar power production is relatively consistent. A difference in
solar panel manufacture’s does not result in drastic differences in the production of solar
panels. For this reason, parameters from an actual solar unit are not needed to calculate
the mock output. The simulation calculator is able to calculate solar power production
based on the panel area size of the system. One attractive feature of the simulation
calculator used in the research was that the calculator is able to determine the appropriate
sized solar system needed for the study area. The photovoltaic panel area is determined
by the energy load demand. For this research, the load was based off the average
household energy usage for the study region. The simulator determined that a 2,500 Watt
photovoltaic system was appropriate for the study location. Having the calculator
compute the size of a solar system needed was helpful with system optimization and
ensuring that maximum solar benefit was achieved without choosing a system too large
or too small for the study area.
When modeling the solar conditions of the study area, the simulator did not use
the recorded solar availability data that was collected at the Freeman Ranch Center. Data
was retrieved from the National Oceanic and Atmospheric Administration to determine

39
the average sky conditions for San Marcos, Texas. It was determined on average, there
are 191 clear days, 76 partly cloudy days, and 98 cloudy days per year (National Climate
Data Center, 2014). These weather characteristics are used to simulate the weather
throughout the year and determine solar energy output.
For this research the simulator used the following equation to calculate the PV
panel output;
W is the random variable which represents the weather pattern. In this study the W
values are as follows: 0.9 for clear days, 0.7 for partly cloudy days and 0.3 for cloudy
days (Villarreal et al. 2013). The reason that 0.9 is used for clear days is that even on the
clearest days it is unlikely to see maximum output sustained all day. is the solar
radiation on the PV panel. is the photovoltaic conversion efficiency. represents the
PV panel area. is the PV operating temperature measured in °C. represents the
calendar day and represents the solar hour angle.
A major flaw in the method of modeling solar conditions for this study was that
the sky condition statistic could only be found as an annual figure. For this reason, the
calculator was not able to accurately simulate the seasonal variations in solar radiation
availability, resulting in solar production results that had no variation seasonally. It was
determined that a correction factor was needed for the solar production results to
illustrate variations consistent with the seasonal fluctuations in solar availability.
The correction factor was determined from a latitudinal solar radiation chart
(Pidwrirny 2006). The seasonal correction factors used are as follows; fall 1.23, spring
1.46, and summer 1.81. The correction factors were determined by referencing the solar

40
radiation chart and comparing solar availability of the winter season to the other seasons
of the year. The simulation calculator used in this study was able to accurately model
annual solar production for the system. Using the annual total solar production in kWh
and the correction factor values, the following equation was used to calculate the seasonal
production of the solar energy resource with x representing the solar production for the
winter season;
41
CHAPTER 4
RESULTS
The purpose of this study was to examine the relationship between the wind and solar
energy potential at the Freeman Ranch Center. This research used meteorological data to
simulate weather conditions and determine potential power output from a hypothetical
hybrid wind and solar energy system. The results from the study show that there is
potential for a hybrid wind and solar system to have success in the Texas Hill Country.
While the proposed hybrid system would not be capable of completely providing for
residential homes energy needs it would contribute significantly. Before examining the
production potential of the hybrid system, first the production from each of the energy
sources will be presented.
I. Contributions from Individual Energy Sources
It is important to examine what each individual component of the hybrid system
contributed to production. As expected, solar was the stronger and more productive of the
two renewable energy sources. Total seasonal production from solar energy was; 1,340
kWh in the fall, 1,090 kWh in the winter, 1,590 kWh in the spring, and 1,970 kWh in the
summer. Table 6. presents the seasonal production for the wind and solar components of
the hybrid system and the percentage of the electricity demand for the seasons.
Seasonally the solar component of the hybrid system was able to produce nearly half of
the electricity demands of the study area throughout the year. With a range from 46% of
energy needs met in the winter, to 60% of the energy needs met in the spring.

42
The wind component of the hybrid system produced significantly less than solar,
which was to be expected. The total seasonal production for wind energy was; 493 kWh
in the fall, 1,130 kWh in the winter, 1,340 kWh in the spring, and 599 kWh in the
summer. Seasonally, wind energy was able to provide a much less significant portion of
the needs of the study area. In the summer months the wind production could only
contribute 15% of electricity needs and in the spring the largest contribution to electricity
needs is observed at 50%.
Table 6. Seasonal Production from Solar and Wind Compared to Electricity Demand
Fall Winter Spring Summer
Electrical Need kWh 2511 2397 2640 4090
Solar Production kWh 1,340 1,090 1,590 1,970
% of Electricity Needs 53% 46% 60% 48%
Wind Production kWh 493 1,130 1,340 599
% of Electricity Needs 20% 47% 50% 15%
Energy demand refers to the total electricity, natural gas, and propane
consumption of the residential consumers. When factoring in other energy sources the
productivity of the hybrid wind and solar system is much lower. Table 7. identifies how
much the wind and solar energy components of the hybrid system can contribute annually
to the total energy needs of the residential Texas Hill Country consumer.
The hybrid system can only provide about 40% of the annual energy needs for residents,
with solar energy contributing 25% and wind energy providing 15% of those needs.

43
Table 7. Annual Production from Solar and Wind Compared to Energy Demand
Annual Production
Solar Production kWh 5,990
% of Energy Needs 25%
Wind Production kWh 3,490
% of Energy Needs 15%
Below, Figure 4. illustrates the seasonal average electric production for the hybrid
system. This figure provides a visual representation of the contribution that wind energy
makes to solar energy in the hybrid system, as well as the seasonal fluctuations in
production. It can be observed in Figure 4. that wind energy supplementing solar energy
does provide a more reliable energy source seasonally, despite the seasons with limited
production.
Figure 4. Seasonal Average Electric Production
0
500
1,000
1,500
2,000
2,500
3,000
3,500
Fall Winter Spring Summer
kW
h
Seasonal Average Electric Production
Wind Production
Solar Production

44
II. Hybrid System Performance
On average, the hybrid system provided 9,490 kWh of energy annually. Seasonally,
the typical resident could expect the following energy production from the hybrid system;
fall 1,830 kWh, winter 2,220 kWh, spring 2,930 kWh, and summer 2,570 kWh. Table 8.
compares seasonal and average production of the hybrid system as well as how much
production could contribute to electricity and energy needs.
Table 8. Annual and Seasonal Production from Hybrid System
Hybrid Wind Solar System Fall Winter Spring Summer Annual
Average Production (kWh) 1,830 2,220 2,930 2,570 9,480
Percent of Electricity Needs 73% 93% 110% 63% 81%
Percent of Energy Needs - - - - 40%
Focusing on only electricity consumption, a rural Hill Country resident could
expect for a significant portion of their electricity needs to be met from the hybrid
system. In the spring, the most productive season, over 100% of the electricity needs
could be met by residents. In summer months, when electricity demand is highest at
approximately 4,000 kWh for the season, residents could expect about half of their
electricity needs to come from the hybrid wind and solar system. Annually, about 81% of
electricity needs for the typical Hill Country Resident would be met.
III. Annual and Seasonal Demand and Production
When looking at electrical demand versus energy production it is important to
also consider it in terms of kWh/day. The measure of kWh/Day is a beneficial way to
look at the demand compared to the production because it illustrates the expected day

45
to day performance of the system. Throughout the research process it was found that
when determining demand of a specific area there are many factors that influence it.
Table 9. shows energy demand and energy production of the hybrid system. As seen
in Table 9. Energy demand for a single location can vary greatly depending on which
factors are considered. For a resident that is unsure of anticipated electrical demand
and is looking to install a renewable energy system, it important for a statistic to be
used that is representative of all factors for that specific consumer and location. The
demand data for Table 9. comes from the U.S. Energy Information Administration
and the Austin Energy Online Data Library.

46
Table 9. Seasonal and Total Energy Annual Demand and Production in kWh/Day
Household Demand
kWh/Day
Electrical Demand Austin
Fall 28
Winter 27
Spring 29
Summer 44
Annual 32
Energy Demand Annual
Texas 62
Electricity Demand Annual
Texas 39
Energy Consumption Annually
in Southern States
Urban 37
Rural 46
Production
Hybrid System Wind and Solar
Fall 20
Winter 25
Spring 32
Summer 28
Annual 26
Solar
Fall 15
Winter 12
Spring 17
Summer 21
Annual 16
Wind
Fall 5
Winter 12
Spring 14
Summer 6
Annual 10

47
Examining the results in terms of kWh/day is beneficial because seasonal and
average totals in production vary based on the total number of days. When observing the
results in average kWh per day, comparisons between variations in production are more
reflective because they are all measured based on the same time period. The results of
electrical energy production from the individual renewable energy sources as well as the
hybrid system as a whole were promising when examining total production. It becomes
clear when looking at production in kWh per day that the contributions of wind in
supplementing solar energy are limited. In the windy seasons of winter and spring, an
additional 12 and 14 kWh per day can be contributed from wind respectively. During the
windy seasons, wind is able to nearly double system output. While daily production of
wind is competitive with that of solar in the windy seasons, the rest of the year wind
struggles to contribute. In fall and summer, wind is only able to produce 5 kWh per day
and 6kWh per day respectively. During half the year, wind production is expected to be
less than 10 kWh per day. While the spring and winter seasons for wind production
showed great promise, the fall and summer wind production significantly limits what
wind is able to contribute as a resource.
IV. Cost
An extensive cost analysis of the hybrid system was not conducted because the
results did not support heavy investment in wind energy for the study area.
According to a 2012 study, the cost of wind turbines depends largely on the rated
power. The average cost of wind turbines sized 10-20 kW is $2,550 per kW (Ohunakin et
al. 2013). For a turbine comparable in rated power to the one used in this study, the cost
would be expected to be around $51,000.

48
Compared to wind energy, solar power is much cheaper when looking at price per
installed kW. A California study found that the average purchase cost of small scale
photovoltaic systems to be $6.73/W or $6730/kW (Liu et al. 2014). The cost information
is based on 2012 data, the same as the study referenced for wind costs. For this research,
the expected cost of the installed photovoltaic component of the hybrid system is
$16,800. Table 10. identifies how the cost of the wind and solar energy compare to each
other when amortized over 20 years.
Table 10. Wind and Solar Production versus Cost
Solar Wind
Production kWh/Year 5,990 3,490
20 Years kWh production 119,800 69,800
Resource Cost $16,800 $51,000
Cost/kWh $0.14 $0.73
When examining the cost of the renewable energy resources, the figures in Table
10. represent the cost of the resources before any tax credits or rebates. It is common for
renewable energy systems to qualify for incentives that reduce the cost of the systems.
For the purpose of this research, the full cost of the resources was considered to in order
to compare the differences between the cost and production of the different technologies.
The economic benefit of solar power can be seen in Table 10. In this hypothetical
system, the solar component produced 71% more energy annually than the wind
component, while costing 33 % as much. When considering the cost, it is seen as more
favorable for a Hill Country resident to invest more money in solar energy generation
rather than wind energy generation. Solar energy has experienced a declining trend in

49
cost and it can be expected that it would remain financially competitive option for
residents looking to invest in renewable energy (Liu et al. 2014).

50
CHAPTER 5
DISCUSSION
It was hypothesized that there is enough wind and solar energy potential at the
Freeman Ranch Center to demonstrate that the Texas Hill Country can benefit from small
hybrid renewable energy systems. In the process of testing the hypothesis, the research
questions were answered. It was determined that for a Texas Hill Country Location, a
residential sized solar system could provide 16 kWh of electricity per day on average; a
residential sized wind turbine could provide 10 kWh of electricity per day on average;
and conjunctively in a hybrid system, these renewable resources could provide 26 kWh of
electricity per day on average.
When looking at renewable energy potential for the Texas Hill Country, solar is
the strongest in terms of availability and potential production. The results for solar
production are consistent with what was expected to be found based on the literature.
Solar production seasonally and annually showed the potential to significantly contribute
to the electricity needs of residents in the study area. Even in the seasons least favorable
to solar production, it was still able significantly contribute to demand.
Additionally, with regard to solar production, it was observed that solar
production followed the variation in solar availability with summer being the most
productive month followed by spring, fall, and winter. Interestingly, household electricity
demand seasonally followed the same pattern of solar availability and production. The
fact that solar production and electrical demand have the same seasonal fluctuations
could be a contributing factor as to why the solar resource was able to contribute so
highly to seasonal demands, even in the seasons with the most limited solar availability.

51
The results for wind power generation at the study area were mixed. The average
annual wind speed at the study location was significantly lower than what the literature
indicated to expect. Production could have been greater if the observed annual wind
speed had been more consistent with what was found in the literature. As expected, wind
energy production potential was not overwhelmingly strong. Even in the spring which is
the strongest season for wind, the production observed was only 2 kWh per day higher
than the production seen in the winter for solar. The theory behind hybrid renewable
energy systems is that by coupling different energy sources the strengths in one resource
overcome the weakness in the other. Winter would be described as the weakness of solar
energy, as it is the season that provides the least solar availability. During this time wind
is able to only match the solar production in terms of daily kWh of energy produced. A
truly successful hybrid renewable energy system would show the relationship between
the seasonal variations in production as being more complementary. Rather than seeing
wind energy produce roughly the same amount of energy as solar in the winter, it would
have been more desirable to observe wind being able to produce significantly more.
When examining the production potential of these resources combined together as
a hybrid system the results were promising. In the Texas Hill Country, the typical
resident could expect significant contributions to their electricity needs using a hybrid
system similar to the one modeled in this research. The contribution made from wind
increased seasonal production to a level where residents could expect no less than half
their electricity needs met each season. Despite the high results in terms of how
production could contribute to electricity needs, energy needs should be considered.
When factoring in total household energy needs, the potential production from the

52
hypothetical hybrid dropped dramatically. The contribution the hybrid system had to
energy demand was about half of what was observed with regard to electrical demand.
Once cost was considered when examining the renewable energy resources, it
became clear that wind energy development at the residential level for the Texas Hill
Country is not economically supported. Wind energy produced significantly less energy
while costing significantly more. The purpose of combining the renewable energy
resources is to provide more consistent and reliable energy. One implication from the cost
of wind is that rather than spending an exorbitant amount of money on a resource with
limited production, part of the money that would have been spent on that resource could
be invested in energy conservation measures. Rather than focusing on meeting demand
with renewable resources, consumers should focus on ways to reduce energy
consumption. By reducing consumption the potential benefit of renewable energies
increases. A reduction in consumption, would allow for a single renewable energy source
to have a greater impact with regard to contributions to energy demands as well as reduce
the need for a supplementary energy source.
Another consideration when looking at cost of renewable energy systems for rural
residents such as those found in the Texas Hill Country is the instillation cost of
connecting properties to the electrical grid. Residents that live a considerable distance
from a city or town face the issue of the substantial cost tying into the electric grid. In
some cases, the cost of having an electric company extend the grid to their property may
be more expensive than installing a renewable energy system large enough to meet
energy demands. In cases such as these, it could be beneficial for residents to invest in
renewable energy systems, specifically hybrid systems. When there is no backup energy

53
available from the electric grid, diversifying the energy sources would be advisable. In an
area such as the Texas Hill Country where the available wind resource is not extremely
significant, residents would likely not be advised to choose a wind system comparable to
the one used in this study. The size, cost, and production potential of the wind system
used in this research make it unlikely that the typical residential user would find it an
appropriate choice for their needs. Texas Hill Country residents may find that a smaller
residential wind turbine is more affordable and while it would not be able to provide a
significant amount toward household energy needs, it could serve as a backup power
source when the solar unit fails to meet energy demands.
I. Limitations
While this research does contribute to the literature related to hybrid wind and
solar renewable energy systems, there were some limitations to this research.
The first limitation was that the simulation calculator was unable to properly
simulate variations in solar availability. This was the major weakness in this specific
research. Having had solar data that was collected at the study site, it would have been
beneficial if the collected solar data could have been applied to influence the solar portion
of the weather pattern simulation. The ability to more accurately represent the variations
in solar availability and production would be beneficial in predicting potential output and
understanding the full scope of the impacts this resource could have in the study area.
Considering that solar energy was the strongest of the renewable resources available at
the study area, it would have been beneficial to apply the collected solar data to the
simulation calculator.
54
Another limitation was the amount of data collected at the study site. When
working with weather data, the time period in which data is collected is extremely
important when making predictions of future weather expectations. It is understood that
more years of available data will provide better results when modeling expected weather
patterns. The limited years of available data for this study could have had an impact on
the results. As mentioned before, the measured average annual wind speed was found to
be significantly lower than the literature had predicted. It could be that the data was
collected during a period in which there were unusually low wind speeds. Having a data
set over a longer period of time may have produced different average annual and seasonal
wind speeds, which would affect the production results with regard to wind energy.
While the average annual wind speed was just slightly below the cut in speed of the wind
turbine, observing an average annual wind speed which was at or above the cut in speed
would have resulted in significantly higher wind energy production values.
II. Implications for Future Research
The California study by Liu et al. (2014) discussed the economic differences
between purchasing and leasing photovoltaic systems. While the literature for wind did
not provide information about potential leasing options, this study raises the question of
the potential impact leasing turbines could have on wind energy application in the Texas
Hill Country. It would be beneficial to examine if leasing wind turbines versus
purchasing them makes them any more affordable in the study area. While a lower cost
turbine would not change the production potential of the wind energy resource, it would
make it more feasible to diversify renewable energy resource for the residents of the
study area.

55
There are some political implications of this study. Policies made to promote
renewable energy sources need to be tailored to the resources that best benefit specific
areas. It is clear from this research that central Texas has strong solar resource
availability and that should be considered when making policies relating to renewable
energy. It is important to continue research on the technology and application of wind
energy but political legislation, tax credits, and rebate incentives that encourage wind
development in non suitable areas will only perpetuate dependence on fossil fuel. Future
research on this topic should include how political factors influence consumers’ decisions
regarding renewable energy implementation at the residential level.
III. Summary
This research set out to examine the wind and solar energy potential at the
Freeman Ranch Center to demonstrate the contributions these energy sources could make
to the typical Texas Hill Country resident. Specifically, this study examined the potential
for wind energy to supplement solar energy, creating a more reliable and consistent
energy source.
A simulation calculator was used to simulate weather conditions for the study
area. The simulation calculator also calculated energy production from residential sized
wind and solar energy generation systems. Production from these sources was analyzed
to determine annual and seasonal variations between the two resources, as well as what
these sources could contribute when combined in the form of a hybrid renewable energy
system.
It was found that the benefits of a hybrid renewable wind and solar energy system
in the Texas Hill Country are not significant enough to justify the application of these

56
systems at this time for this region. This research did find that the Texas Hill Country
does, to a degree, demonstrate the complementary characteristics in terms of solar and
wind availability that appeals to hybrid systems. When factoring the cost associated with
these renewable energy resources, residents of the Texas Hill Country would find that a
solar only system would be a more sensible option. This research does not suggest that
wind energy should not be applied in the Texas Hill Country but rather that careful
consideration must be taken when installing wind systems. Understanding climate data
for specific locations will be imperative in seeing these systems perform optimally.
IV. Conclusion
It is understood that the Texas Hill Country is classified as an area that is not
suitable for wind energy development. The purpose of this research was to better
understand the relationship and fluctuations between wind and solar energy potential for
the area. It was hypothesized that there is enough wind and solar energy potential at the
Freeman Ranch Center to demonstrate that the Texas Hill Country could benefit from
small hybrid renewable energy systems. Having a reliable renewable source of power
would be extremely beneficial to the Texas Hill Country residents. In the event of
unusually severe weather conditions, stand alone solar could struggle to meet energy
needs. Diversifying the energy source is one way to prevent an energy shortage during
those times of need.
This project helped fill some of the gaps in the literature. There is relatively little
literature on coupling wind and solar energy together for an application suggested by this
research. Studies similar to this have been conducted elsewhere but few have been
conducted in a comparable setting.

57
The Freeman Ranch Center, Texas State University, and the residents of the
Texas Hill Country have the potential to greatly benefit from this study. This study shows
how the renewable energies, wind and solar, can contribute to meet the energy needs at
the Freeman Ranch Center. More importantly, this study demonstrated how other
landowners in the Hill County can employ similar systems and reduce their energy
expenses and it also demonstrated the negative effects of traditionally produced
electricity from fossil fuels.
While the results of this study did not support the predicted hypothesis, the
implications made from this research are an important contribution. From this research it
can be concluded that the added benefit of supplementing solar energy and wind energy
is not significant enough to justify the added cost of wind power at this time in the Texas
Hill Country. However, the result of this study opens the door for continued research on
the renewable energy potential of the study area and brings the residents of the Texas Hill
Country one step closer to a fossil fuel free future.

58
REFERENCES
Alexander, S. A. 2011. The Texas Wind Estate: Wind as a Natural Resource and a
Servable Property Interest. University of Michigan Journal of Law Reform 44(2): 429-
465.
American Wind Energy Association. “U.S. Wind Industry First Quarter 2015 Market
Report”
http://www.awea.org/Resources/Content.aspx?ItemNumber=7526&RDtoken=25435&us
erID=. Accessed June 17, 2015.
Austin Energy. “Energy Use & Sales.”
http://austinenergy.com/wps/portal/ae/about/reports-and-data-library/data-library/energy-
use-and-sales/. Accessed March 17, 2015.
Barnes W. P., S. L. Liang, K. E. Jessup, L. E. Ruiseco, P. L. Phillips, and S. J. Reagan.
2000. Soils, Topography and Vegetation of the Freeman Ranch. San Marcos, TX:
Department of Biology, Southwest Texas State University.
Bergey Windpower. 2015. The Excel 10 KW wind turbine.
http://bergey.com/products/wind-turbines/10kw-bergey-excel Last accessed June 4, 2015.
Bivona, S., R. Burlon, and C. Leone. 2002. Hourly Winds Speed Analysis in Sicily.
Renewable Energy 28:1371-1385.
Cabello, M. and J.A. G. Orza. 2010. Wind Speed Analysis in the Province of Alicante,
Spain. Potential For Small Scale Wind Turbines. Renewable and Sustainable Energy
14:3185-3191.
Celik, N. A. 2002. Optimiosation and Techno-Economic Analysis of Autonomous
Photovoltaic-Wind Hybrid Energy Systems in Comparison to Single Photovoltaic and
Wind Systems. Energy Conservation and Management 43:2453-2468.
Chiras. D. 2010. Introduction to Small-Scale Wind Energy. Wind Power Basics: A Green
Energy Guide 1-15.
Coste, L. A., and C. Serban. 2011. Solar and Wind Power for Brasov Urban Area.
Environmental Engineering and Management Journal 10(2):257-262.
Dixon, R. W. 2000. Climatology of the Freeman Ranch, Hays County, Texas. Freeman
Ranc Publication Series No. 3-2000. San Marcos, TX: Freeman Ranch Management
Committee, Southwest Texas State University.
Eke, R., O. Kara, and K. Ulgen. 2005. Optimization of a Wind/PV Hybrid Power
Generation System. International Journal of Green Energy 2:57-63.
Fenneman, M. N. 1931. Physiography of Western United States. New York and London:
McGraw Hill Book Company, Inc.

59
Galbraith, K. 2012. “In Texas, Ambivalence Over Wind tax Credit Extension.” The Texas
Tribune. Accessed June 9, 2014. http://www.texastribune.org/2012/02/14/texas-
ambivalence-over-wind-tax-credit-extension/.
Garrison, B. J., and M. Webber. 2011. An Integrated Energy Storage Scheme for a
Dispatchable Solar and Wind Powered Energy System. Journal of Renewable and
Sustainable Energy 3:043101-1-043101-12
Hedberg, D., S. Kullander, and H. Frank. 2010. The World Needs a New Energy
Paradigm. AMBIO 39:1-10.
Hongxing, Y., Z. Wei, and L. Chengzhi. 2009. Optimal Design and Techno-Economic
Analysis of a Hybrid Solar-Wind Power Generation System. Applied Energy 86:163-169.
Islam, R. M., R. Saidur, and N. A. Rahim. 2011. Assessment of Wind Energy Potentiality
at Kudat and Luban, Malaysia using Weibull Distribution Function. Energy 36:985-992.
Jun, Zeng, L. Junfeng W. Jie, and H. W. Ngan. 2011. A Multi-Agent Solution to Energy
Management in Hybrid Renewable Energy Generation System. Renewable Energy
36:1352-1363.
Kershman, A. S., J. Rheinlӓnder, T. Neumann, and O. Goebel. 2005. Hybrid wind/PV
and Conventional Power for Desalination in Libya – GECOL’s Facility for Medium and
Small Scale Research at Ras Ejder. Desalination and the Environment 183(1-3):1-12.
Lai, P., and K. Lyons. 2011. Place-meaning and Sustainable Land Management:
Motivations of Texas Hill Country Landowners. Tourism Geographies 13(3): 360 – 380.
Langniss, O., and R. Wiser. 2003. The Renewables Portfolio Standard in Texas: An Early
Assessment. Energy Policy 31: 527-535.
Leggett, W. M., and Ball, A. D. 2012. The Implication for Climate Change and Peak
Fossil Fuel of the Continuation of the Current Trend in Wind and Solar Energy
Production. Energy Policy 41:610-617.
Liu, X, E. G. O’Rear, W. E. Tyner, and J. F. Peny. 2014. Purchasing vs. Leasing: A
benefit-cost analysis of residential solar PV panel use in California. Renewable Energy
66: 770-774.
Lovejoy, D. 1996. The Necessity of Solar Energy. Renewable Energy 9(1-4):1138-1143
Ma, T., H. Yang, and L. Lu. 2014. A Feasability Study of a Stand-Alone Hybrid Solar-
Wind-Battery system for a Remote Island. Applied Energy 121:149-158.
Mostafaeipour, A., A. Sadaghat, A.A. Dehghan-Niri, and V. Kalantar. 2011. Wind
Energy Feasibility Study for city of Shahrbabak in Iran. Renewable and Sustainable
Energy Reviews 15:2545-2556.
National Renewable Energy Laboratory. “Map Search.” Accessed June 24, 2014
http://www.nrel.gov/gis/mapsearch/.

60
Nema, P., R. K. Nema, and S. J. Rangnekar. 2009. A Current and Future State of Art
Development of Hybrid Energy Systems Using Wind and PV-Solar: A Review.
Renewable and Sustainable Energy Reviews 13:2096-2103.
Notton, G., S. Diaf, and L. Stoyanov. 2011. Hybrid Photovoltaic/Wind Energy System
For Remote Locations. Energy Procedia 6:666-677.
Odo, C. F., S. U. Offiah, and P. E. Ugwuoke. 2012. Weibull Distribution-Based Model
for Prediction of wind Potential in Enugu, Nigeria. Advances in Applied Science
Research 3(2):1202-1208.
Ohunakin, S. O., O. M. Oyewola, and M. S. Adaramola. 2013. Economic Analysis of
Wind Energy Conversion Systems Using Levelized Cost of Electricity and Present Value
Cost Methods in Nigeria. International Journal of Energy and Environmental
Engineering 4(2):1-8
Paska, J., P. Biczel, and M. Kios. 2009. Hybrid Power Systems – An Effective Way of
Utilizing Primary Energy Sources. Renewable Energy 34:2414-2421.
Pasqualetti, J. M. 2004. Wind Power Obstacles and Opportunities. Environment 46
(7):23-38.
Pidwirny, M. 2006. Earth-Sun Relationships and Insolation. Fundamentals of Physical
Geography http://www.physicalgeography.net/fundamentals/6i.html last accessed June
27, 2015.
Polaris America. 2014. Specification Sheet. http://www.polarisamerica.com/wp-
content/uploads/2014/07/WS-0001_P10-20.pdf, Last accessed June 24, 2014.
Rahim, M., J. Yoshino, and T. Yasuda. 2012. Evaluation of Solar Radiation Abundance
and Electricity Production Capacity for Application and Development of Solar Energy.
International Journal of Energy and Environment 3(5):687-700.
Reichling, P. J., and F. A. Kulacki. 2008. Utility Scale Hybrid Wind-Solar Thermal
Electrical Generation: A Case Study for Minnesota. Energy 33:626-638.
Santos-Alamillos, F. J., D. Pozo-Vàzqez, J. A. Ruiz-Arias, V. Lara-Fanego, and J. Tovar-
Pescador. 2012. Analysis of Spatiotemporal Balancing between Wind and Solar Energy
resurces in the Southern Iberian Peninsula. Journal of Applied Meteorology and
Climatology 6:2005-2024.
Sesto, E., and C. Casale. 1998. Exploration of Wind as an Energy Source to Meet the
World’s Electricity Demand. Journal of Wind Engineering and Industrial Aerodynamics
74-76:375-387.
Sócola, S. J., and D. M. Aldana. 2015. Technical Economic Analysis of a Low Power
Hybrid Wind-Solar System Grid Connected. Applied Mechanics and Materials 704:204-
208.

61
Solangi, H. K., M. R. Islam, R. Saidur, N. A. Rahim, and H. Fayaz. 2011. A Review on
Global Solar Energy Policy. Renewable and Sustainable Energy Reviews 15:2149-2163.
Subrahmanyam, J. B. V., P. Alluvada, Bandana, K. Bhanupriya, and C. Shasidhar. 2012.
Renewable Energy Systems: Development and Perspectives of a Hybrid Solar-Wind
System. Engineering, Technology & Applied Science Research 2 (1): 177-181.
Tina, G., and S. Gagliano. 2010. Probabilistic Analysis of Weather Data for Hybrid
Solar/Wind Energy System. International Journal of Energy Research 35:221-232.
Tina, M. G. and S. Gagilano. 2011. Probabilistic Modeling of Hybrid Solar/Wind Power
System with Solar Tracking System. Renewable Energy 36:1719-1727.
Tripanagnostopouls, Y., M. Souliotis, and T. Makris. 2009. Combined Solar and Wind
Energy Systems. American Institute of Physics 1025-1030.
U.S. Energy Information Administration. 2015. Residential Energy Consumption Survey.
http://www.eia.gov/consumption/residential/ Accessed June 4, 2015.
U.S. National Climate Data Center. Climatological Data Texas. Accessed June 10, 2014.
http://www.ncdc.noaa.gov/cdo-web/.
Villarreal, S., J. A. Jimenez, T. Jin, and M. Cabrera-Rios. 2013. Designing a Sustainable
and Distributed Generation System for Semiconductor Wafer Fabs. IEEE Transactions
on Automation Science and Engineering 10 (1): 16-26.
Zhou, W., C. Lou, L. Zhongshi, L. Lu, and H. Yang. 2010. Current Status of Research on
Optimum Sizing of Stand Alone Hybrid Solar-Power Generation Systems. Applied
Energy 87:380-389.


![Wind Farm Electrical Systems.pptx [Read-Only]ewh.ieee.org/r3/atlanta/ias/Wind Farm Electrical Systems.pdf · 2010. 1. 19. · Wind Farm Electrical Systems. ... Maintenance Hoist.](https://static.fdocuments.net/doc/165x107/6122e4b36403441c092ee882/wind-farm-electrical-read-onlyewhieeeorgr3atlantaiaswind-farm-electrical.jpg)