Relationship between Crystalline Structure and Mechanical Behavior …€¦ · ·...
36
1 Relationship between Crystalline Structure and Mechanical Behavior in Isotropic and Oriented Polyamide 6 Nadya Dencheva 1 , Zlatan Denchev 1* , M. Jovita Oliveira 1 , Sérgio S. Funari 2 1 IPC – Institute for Polymers and Composites, Department of Polymer Engineering, University of Minho, 4800-058 Guimarães, Portugal 2 HASYLAB at DESY, Notkestra.e 85, 22603 Hamburg, Germany *) To whom correspondence should be addressed. E-mail: [email protected]
-
Upload
doankhuong -
Category
Documents
-
view
215 -
download
1
Transcript of Relationship between Crystalline Structure and Mechanical Behavior …€¦ · ·...

1
Relationship between Crystalline Structure and Mechanical Behavior in
Isotropic and Oriented Polyamide 6
Nadya Dencheva1, Zlatan Denchev1*, M. Jovita Oliveira1, Sérgio S. Funari2
1IPC – Institute for Polymers and Composites, Department of Polymer Engineering,
University of Minho, 4800-058 Guimarães, Portugal
2HASYLAB at DESY, Notkestraβe 85, 22603 Hamburg, Germany
*) To whom correspondence should be addressed. E-mail: [email protected]

2
ABSTRACT
Polyamide 6 (PA6) isotropic films and oriented cables were prepared by compression
molding or by consecutive extrusion and cold drawing. These samples were isothermally
annealed in the 120-200ºC range and than subjected to tensile tests at room temperature.
Synchrotron wide- (WAXS) and small-angle X-ray scattering (SAXS) patterns were
obtained before and after mechanical failure. These data were related with the mechanical
properties of the respective PA6 samples. Annealing of isotropic PA6 resulted in an
increase of the Young modulus and yield stress values, which was attributed to the
observed proportional reduction of the d-spacings of the inter-sheet distances in both α-
and γ-PA6 polymorphs. Analysis of the WAXS and SAXS patterns of isotropic PA6 after
break allowed the supposition of structural changes in the amorphous phase, being better
pronounced with the increase of annealing temperature making the samples less ductile. In
oriented PA6 samples annealing resulted in a drastic increase of Young moduli and yield
stresses accompanied by phase transition from γ- to α- PA6 and well-pronounced reduction
of the inter-sheet distances of both polymorphs. Stretching the oriented samples led to an
additional γ-to α-transition whose extent was also related with structural changes in the
amorphous phase.
Key Words: polyamide 6, synchrotron WAXS and SAXS, mechanical properties,
polymorphism.

3
INTRODUCTION
Of all n-polyamides currently known and manufactured on an industrial scale, polyamide 6
(PA6) has achieved the widest commercial use and is the best studied. Processing of PA6
may be divided into three broad categories: melt spinning, extrusion and injection molding.
The end products are various types of yarns, films, sheets, rods, tubes, coatings of electric
conduits etc1. A recent application of PA6 is as reinforcing component in what was called
“microfibrillar in-situ composites” (MFC)2,3. All of these processing techniques comprise
controlled heat- and/or mechanical treatments that have an important impact on the PA6
crystalline structure and hence on its mechanical properties.
While there is a large amount of studies relating the structure or the properties of
PA6 to the conditions of its orientation and annealing, relatively few works have been
published so far on the relationship between mechanical properties and crystalline
structure. Galeski et al studied the mechanisms of deformation of PA6 in uniaxial
extension by means of X-ray, microscopy and calorimetric techniques4. Stretching of PA6
reportedly led to orientation of the α- and γ-crystals with macromolecular chains parallel to
the drawing direction (DD). It was also demonstrated that the α-phase experienced a larger
amount of breakdown between the planes determined by the hydrogen bonds, as compared
to the γ-phase. In plane strain compression mode, the same authors5 observed share-
induced α- to γ-transition creating small amounts of γ-polymorph in the originally all-α-
form crystalline phase. The latter underwent extensive deterioration by a chain-slip
mechanism along the (002) planes containing the hydrogen bonds.
More recently, Lin and Argon performed extensive structural and mechanical
investigations on the plastic deformation in PA6 by means of X-ray scattering and electron
microscopy6. Quasi-single crystal PA6 samples were prepared by plain-strain compression
at elevated temperature in a channel die. Investigation of the crystallographic slip

4
processes confirmed the conclusion that in the more stable α-form the (002) planes of the
H-bonded sheets constituted the main active slip system. The same authors represented an
interesting analysis of the crystal slip thermal activation7.
Ito and al8 investigated the effects of PA6 α- and γ-crystalline forms on the
deformation behavior. The α-PA6 crystals were obtained from solution or melt at ordinary
crystallization conditions. The α-phase was converted into γ-form by iodine treatment.
Wide- and small-angle X-ray scattering (WAXS, SAXS) techniques were employed for
structural characterization, and dynamic mechanical analysis – to study mechanical
properties. The general conclusion was that the γ-form was more ductile than the α-form.
However, the authors did not elucidate the potential influence upon ductility of the
profound chemical changes of the γ-PA6 phase studied.
The mechanical behavior and structural evolution upon uniaxial and biaxial drawing
above the glass-transition temperature (Tg) of PA6 films was studied in detail by Penel-
Pierron et al by means of WAXS, infrared spectroscopy and differential scanning
calorimetry9. The authors observed a higher ductility of PA6 in what they called
mesomorphic β-form, as compared to samples in γ- and α- form. Under uniaxial drawing, a
greater part of the β-phase was shown to undergo strain-induced transition into α-PA6, the
latter being more pronounced above 120ºC. The γ-phase, which was thermally stable up to
200ºC, also transformed into α-PA6. A structural explanation for the improved ability of
PA6 for biaxial orientation at temperatures below 120ºC was presented. It was related to
the β→α phase reorganization at higher temperatures accompanied by a collapse of the van
der Waals interactions between the sheets leading to sample splitting under normal stress
component.
The present article is a part of a broader study on the structure-properties relationship
in in-situ composite materials based on polymer blends containing polyamides. It reports

5
on the mutual relationship between the crystalline structure and the mechanical behavior in
well-characterized, oriented or isotropic PA6 samples containing different amounts of α-
and γ-polymorphs. The main goal of this work is twofold: (i) to investigate the influence of
the starting structure (i.e., degree of crystallinity, content of α- and γ-polymorphs and
orientation) upon the mechanical properties of the samples, e.g., Young modulus, yield
stress and elongation, stress and elongation at break; (ii) to elucidate the impact of strain on
the crystalline structure after sample failure considering the changes in the crystalline
phase. For this purpose, synchrotron WAXS and SAXS patterns were obtained before and
after mechanical failure of various PA6 samples and processed so as to extract information
related to the crystallinity, d-spacings, long spacings and phase transitions. An attempt was
made to associate the WAXS and SAXS structural data with the mechanical properties of
the samples.
EXPERIMENTAL
Materials and Sample Preparation
Ultramid B35 (BASF, Germany) - a medium-viscosity, general purpose polycaproamide
grade with a melting temperature Tm of 220ºC (DSC) obtained by ring-opening
polymerization was used as a starting material. Two types of samples were prepared and
studied. The first one designated as “PA6 film” was obtained by compression molding of
as-supplied granules, preliminary dried for 5 hours at 90ºC. The starting material was
pressed at 250ºC and pressure of 6 tons applied for 5 min, followed by isothermal
crystallization for 1 hour at 3 different temperatures - 120ºC, 160ºC or 200ºC. The 200-250
µm–thick films so prepared were cooled to room temperature at a rate of ca. 20ºC/min.

6
Five specimens for tensile stress measurements with 25 mm length and 4 mm width were
cut out from each film.
The second sample designated as “PA6 oriented cable” was prepared in an extruder
line including a Lestritz LSM 30.34 intermeshing co-rotating twin-screw extruder, two
water baths, two haul-off units and a winder positioned downstream. The extrusion was
performed at a set temperature of 250ºC. The extrudate was cooled in the first water bath
down to 12ºC while drawing it at a draw ratio (DR) of λ = 2.6. The final drawing was
performed in the second haul-off unit after heating the stretched cable up to 90-96ºC in the
second water bath. More details about the extruder line can be found elsewhere2. The
oriented PA6 cables were annealed with free ends at 120, 160 or 200ºC in an oven. Each
annealing temperature was reached at heating rates of 10ºC/min. After 1 hour annealing at
the respective temperature, the heating was switched off and the sample was cooled at ca.
10ºC/min until returning to room temperature. Five specimens with gauge length of 50 mm
were cut out from each PA6 cable for tensile testing.
WAXS and SAXS Measurements
Synchrotron radiation with a wavelength of 0.15 nm generated at the Soft Condensed
Matter Beamline (A2) of HASYLAB, Hamburg, Germany was employed. The first setup
used permitted two-dimensional (2D) SAXS and 1D WAXS measurements. The sample-
to-detector distance for SAXS was set to 2850 mm, the diffraction patterns being registered
by means of a MARCCD 2D detector with exposure times between 30 and 90 sec. The 1D
WAXS profiles were registered by a linear scintillation detector positioned at 240 mm in
respect to the sample holder. In the second setup for 2D WAXS, the linear detector was
removed and the MARCCD detector was positioned at 90 mm from the sample. A
specially designed sample holder was used allowing for a controlled heating/cooling of the

7
sample in the 25-300ºC range. A multi-channel process- and program controller was used
to regulate the sample temperature in heating or cooling at various rates. The difference
between the read-out and real temperature of the sample was found to be 1-2ºC at a heating
or cooling rate of 20ºC/min.
SAXS and WAXS Data Handling
Corrections for background scattering, irradiated volume and beam intensity were
performed for each image. The 2D SAXS patterns were integrated in the range of s values
between 0 and 0.19 nm-1, s being the scattering vector, whose modulus is defined as
.sin)/2()( 5.023
212 θλ=+= sss For all isotropic samples the one-dimensional correlation
function (CF) was calculated after Lorentz correction of the raw SAXS profiles as
indicated earlier10.
The 1D WAXS curves were also corrected for background scattering, irradiated
volume and beam intensity. Their scattering angle axis was calibrated using the angular
position of the reflections of a standard crystalline poly(ethylene terephthalate) sample.
The s-range covered in the WAXS measurements was from 0.3 to 4.8 nm-1. All WAXS
curves were fitted with Gaussian peaks. In the case of isotropic PA6 sample the total
degree of crystallinity (or, crystallinity index, CI) was calculated as a relation of the areas
of all crystalline peaks and the total area underneath the WAXS curve:
)( ac
c
AAA
CI∑∑
+= (1)
There, Ac is the integrated area underneath the respective crystalline peaks and Aa is the
integrated area of the amorphous halo.
In PA6 oriented cables, the intensity of the meridional point-like reflections cannot
be determined from the 1D WAXS curves. In this case, ΣAc in Eq. 1 measures the

8
scattering intensity along the equator only, i.e. one can define it as “equatorial crystallinity
index” (ECI)10.
The 1D WAXS patterns were used also to determine the interplanar spacings dh00
and d00l using the Bragg´s law:
λθ =hklhkld sin2 (2)
Here, λ = 1.5 Å is the X-ray wavelength and θ is the half of the 2θ position of the center of
the respective crystalline peak. The d-spacing of the (0k0) crystalline planes was
determined by slicing the meridional point-like reflections of the 2D WAXS patterns of
oriented PA6 samples.
Tensile Tests
Uniaxial tensile tests were performed in an Instron model 4505 tensile test machine. The
tests were carried out at 23±2ºC with a standard tensile force of 1 kN at constant crosshead
speed of 50 mm/min. The nominal stress was determined as a ratio of the tensile force and
the initial cross section of the sample. The nominal strain was determined as a ratio of the
sample gauge length at any time during drawing and that prior to drawing.
RESULTS
Mechanical data
Figure 1 shows the stress-strain curves of differently annealed isotropic PA6 films (a) and
oriented cables (b), respectively. All data extracted from these curves, are presented in
Table 1.

9
Isotropic PA6 samples display an augmentation (from 40 to 50 MPa) of the yield
stresses as the temperature of annealing increases, accompanied by a statistically
significant growth of the E-moduli. At the same time, the strain values drop (Table 1).
The oriented PA6 samples demonstrate different stress-strain curves upon
annealing (Figure 1b, Table1). All sample show two yield points, the first being in the
range between 66 MPa (cable without annealing) and 105 MPa (1h at 160ºC) and the
second yield point - between 123 MPa (cable without annealing) and 180 MPa (1h at
200ºC). After the second yield point, strain hardening occurs being better observable with
the sample without annealing. This same sample showed the biggest strain at break. As
with the isotropic films, increasing the annealing temperature led to a significant drop in
the strain values, whereby the sample annealed at 200ºC showed almost brittle failure. At
the same time, the E-moduli displayed an increase of more than three times, attaining its
maximum of 3.8 GPa for the sample heated at 200ºC (Table1).
1D WAXS
1D WAXS patterns were obtained of isotropic (Figure 2) and oriented (Figure 3) PA6
samples, initially annealed for 1 h at different temperatures in the 100-200ºC range, before
and after the tensile test. After fitting the curves as indicated earlier10,11, data on the α- and
γ-crystal fractions, as well as of the total crystallinity indexes were obtained (Table 2). It
can be seen that in isotropic PA6 samples the α-form is the predominant one and that the
annealing in the 120-200ºC range does not change significantly the relation between the
two polymorphs. The respective CI values remain between 44-45%. Stretching until
mechanical failure of these samples leads to an increase of the α-CI, better expressed for
the sample annealed at 120ºC (by 10%). The γ-crystalline fraction before and after sample
failure remains unchanged or drops slightly at the lowest annealing temperature.

10
Figure 3 a and Table 2 confirm our previous finding10 that oriented PA6 cables
obtained by cold drawing to high DR results in a crystalline structure containing more γ-
than α-crystalline form – 33 against 12%, respectively. Annealing of such cable in the 120-
160ºC range decreases 2-5 times the γ-phase content, whereas the α-type crystallinity
grows at a similar rate. After 1h at 200ºC this tendency is inversed decreasing slightly the
α-phase content. Applying an external tensile stress to the oriented cable without annealing
leads to additional transformation of γ- to α-form. As seen from Table 2, γ-PA6 fraction
decreases from 33 to 16%, while the α-phase content grows from 12 to 32%. Similar trend
is registered with the oriented PA6 samples annealed at 120 and 160ºC. Stressing the
sample annealed at 200ºC displays the inverse transition: the γ-CI value upon sample
failure is with more than 10% higher than before the tensile test. At the same time, the α-CI
decreased with 6%.
2D SAXS and 2D WAXS Isotropic PA6
Figure 4 shows the 2D SAXS patterns of differently annealed isotropic PA6 films before
(a-c) and after (d-f) mechanical tests. The same figure shows also the 2D WAXS patterns
of the respective samples after mechanical failure (g-i). As expected, the SAXS patterns of
the samples before mechanical test are non-oriented, of circular symmetry. They show an
almost homogeneous distribution of the scattered intensity in the angular region between
–π/2 and +π/2 (Figure 5, solid symbols). Stretching to mechanical failure has a different
effect on the orientation of the SAXS patterns, depending on the temperature of annealing.
The sample annealed at 120ºC that attains the highest strain at break (Fig. 1a) displays an
oriented SAXS pattern of fibre symmetry (Fig. 4d). Its azimuthal scan (Fig. 5, 120ºC, open
symbols) is a typical example of a four-point scattering diagram with a bimodal
distribution of the scattered intensity. There is a strong orientation in the direction of the

11
applied stress. Interestingly enough, in the 2D WAXS pattern of this same sample (Fig. 4g)
the two Debye rings are with apparent isotropic intensity distribution. Azimuthal scans in
the –π/+π angular region showed an almost isotropic internal ring (α200) and some week
orientation in the external ring α(002)/(202) coinciding with the stretching direction
(Figure 6a).
Annealing at 160ºC makes that stretching of this sample results in much weaker
orientation of the 2D SAXS pattern (Fig. 4e) as compared to that of the previous sample.
The difference of the azimuthal distribution of the scattered intensity between the initial
unstressed and the broken samples is quite small (Figure 5). At the same time, the
anisotropy of the α(002)/(202) WAXS refection (Figure 6 b) is significantly stronger than
with the broken sample annealed at 120ºC indicating higher deformation of the crystalline
phase. Similar effects are observed with the 2D SAXS and WAXS patterns of the sample
annealed at 200ºC and stretched to break (Fig. 4f and 4i). As seen from the corresponding
azimuthal scans in Figure 6, the anisotropy of the two WAXS reflections are basically the
same as of the sample annealed at 160ºC. The SAXS pattern after break of the film
annealed at 200ºC is slightly more anisotropic as compared to that of the previous sample
(Figure 5).
Table 3 shows the evolution of the long spacing estimates of the isotropic PA6
samples as a function of the initial annealing temperature and the stretching during the
mechanical test. In the non-deformed samples, annealing at 200ºC results in a clear growth
of the long spacing values. The latter is due to an increase of the amorphous phase
thickness la to 36 Å, the respective values at 120 and 160ºC being 25 and 26 Å. At the
same time, the average thickness of the crystalline domains lc remains unchanged (67-68
Å). Mechanical failure of the samples annealed at 160 and 200ºC results in a slight
decrease of lc whereas the la values increase so that the resulting long spacings are slightly

12
larger than those before the test. Only the isotropic sample annealed at 120ºC, which after
stretching showed an oriented 2D SAXS pattern, displayed a decrease of the long spacing
with almost 20 Å.
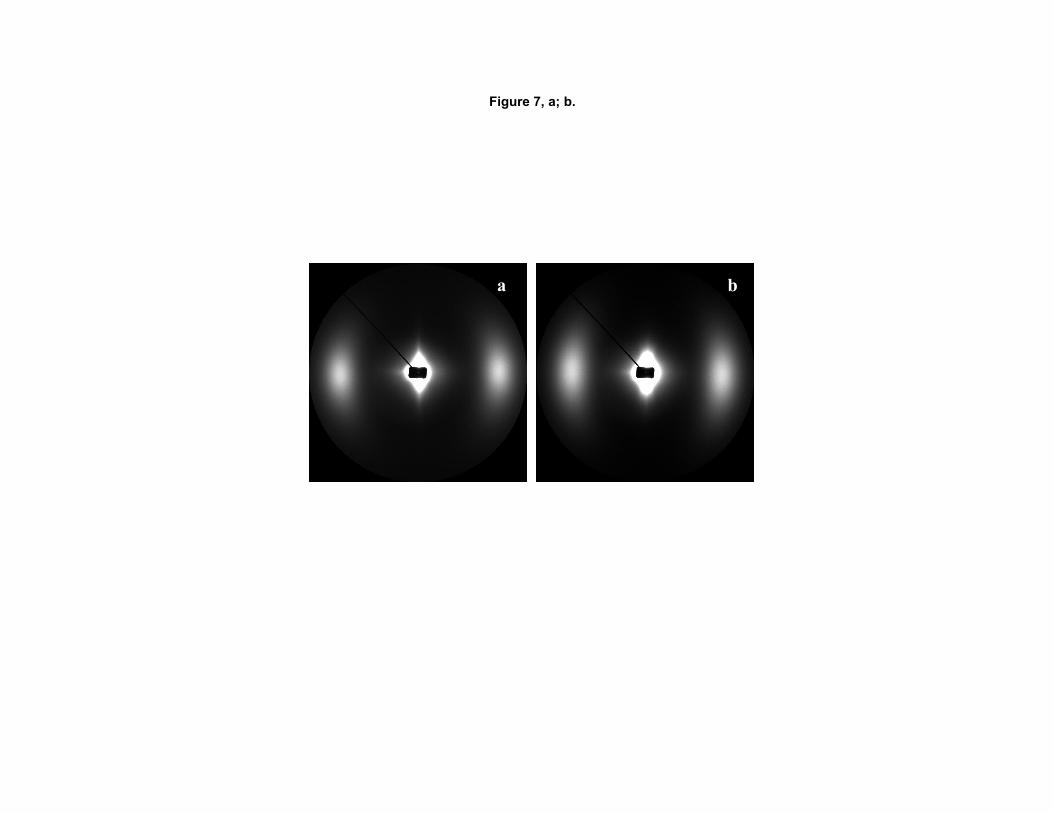
2D SAXS and 2D WAXS data oriented PA6
Table 3 displays also the long spacing values of all oriented cables before and after
stretching. The LB values of the oriented cables annealed up to 160ºC before mechanical
test remained relatively constant in the same range of 67-69 Å. The cable annealed at
200ºC, however, displays a larger LB of 88 Å. Stretching of all cables parallel to their fibre
axis until failure resulted in slightly larger long spacings with the exception of the cable
annealed at 200ºC which showed smaller long spacing. All the oriented 2D SAXS patterns
were very similar to those in Figure 7 obtained with a cable annealed for 1h at 160ºC
before (a) and after tensile test (b). All cables showed typical two-point scattering diagrams
with a streak in the central region.
The 2D WAXS patterns of differently annealed PA6 cables taken before and after
the tensile test are presented in Figure 8. There, the aforementioned increase of the α-form
content that occurs as a result of annealing is best noticed in the sample heated for 1h at
200ºC before the tensile test (Fig. 8d), while the cable without annealing showed the most
pronounced growth of the α- form content as a result of the tensile test (Fig. 8e). Judging
from the differences in the diffracted intensity, the cable without annealing (Fig. 8e) and
that annealed at 120ºC (8f) suffer serious damages in their crystalline structures caused by
stretching. These damages are more evident as compared to those in the cables annealed at
160 and 200ºC (Fig. 8g and 8h). It can be also noticed, that the (020) meridional point-like
reflections of the γ-PA6 are observable irrespective of the fact that the content of this
polymorph strongly decreases as a result of both annealing and stretching (Table 2). The

13
(020) reflections were used for calculation of the b-axis of the γ-phase in all cables (Table
4). The rest of the d-spacings found in Table 4 were extracted from the corresponding 1D
WAXS patterns as a function of the annealing temperature and stretching. They will be
considered in the Discussion part.
DISCUSSION
Isotropic PA6 films
Analyzing the stress-strain curves in Fig. 1a and the numeric data in Table 1, it becomes
evident that the higher the annealing temperature, the higher the E-modulus, as well as the
yield stress values, the engineering strain at break decreasing from 80 to ca. 40%. At the
same time, the X-ray analysis showed that annealing does not change significantly the
crystalline structure of the isotropic PA6 films. As seen from Table 2, the α-PA6 was the
preferable crystalline form independently of the annealing temperature. The α-form content
varied in the range of 37-39% whereas the γ-form content was 6-7%. The data in Table 3
demonstrated that annealing changes neither the long spacings, nor the respective
thicknesses of the crystalline and amorphous domains of the isotropic PA6. Only annealing
close to the Brill transition point (190-200ºC) results in an increase of the long spacing
with about 10 Å, which is mainly due to the increase of la value whereas the lc remains the
same. Irrespective of the fact that all the characteristics of the crystalline structure (degree
of crystallinity, polymorph type, lamellar and amorphous domain thicknesses) do not
change significantly under annealing, the tested PA6 isotropic samples displayed different
tensile behaviour. It is known that the changes in the E-modulus and yield stress values can
be related to the crystalline phase12. The PA6 plasticity in particular was found to be
governed by the crystal slip parallel to the H-bonded sheets, i.e. parallel to the (002)
crystalline plane in α-form and to the (200) crystalline plane in γ-form, without breaking

14
the H-bonds.6,7,9 Therefore, the yield stress of PA6 will be controlled, on the
crystallographic level, by the inter-sheet distance of the two crystalline forms which
corresponds to the d-spacings of the above planes. As seen from Table 4, the inter-sheet
distance of the α-type crystallite remains lower than that of the γ-type within the entire
annealing temperature range. Moreover, the increase of the annealing temperatures leads to
a decrease of the d(002) of α –form from 7,216 to 7.165 Å. Although the contribution of
the γ-form is very small (only 6-7 % from the total CI), the d-spacing of the (200) plane in
this polymorph also decreases from 7.675 Å to 7.640 Å. As a consequence, the critical
resolved shear stress of the main sleep planes in both PA6 polymorphs becomes bigger at
higher annealing temperatures, thus contributing to the yield stress growth.
Considering the 2D SAXS patterns in conjunction with the respective 2D WAXS
images of the samples after tensile test (Fig. 4 d-f and g-i, respectively) allows a deeper
insight into the relation between the structure and the mechanical properties of PA6
isotropic films. The α-form content, as well as the total CI of all samples after break
increases by 2-10% being more notable in the sample annealed at 120ºC (Table 2). Having
in mind that the γ-type crystallinity is almost constant, this increase cannot be due to a
phase transition but is probably a result of stress-induced crystallization of amorphous
material into α-PA6, better expressed with the sample annealed at 120ºC. The same sample
displays, after break, high anisotropy of the SAXS pattern along DR and a significant
decrease of LB (Fig. 4d, Fig. 5 - 120ºC, Table 3). At the same time, in its WAXS pattern
the two Debye rings corresponding to the α(200) and α(002/202) reflections are entirely
isotropic (Figure 4g). Evidently, annealing at 120ºC results in a quite ductile PA6 film with
an amorphous phase susceptible to crystallization. Stretching increases almost twice the α-
form/γ-form proportion (Tab. 2), mainly at the expense of strain-induced crystallization.
The amorphous regions are those that bear the stress, whereby a microfibrillar structure is

15
formed with such an alignment of the crystalline domains that leads to a decrease of the
long spacing values13. As seen from Fig. 4g, these crystalline domains deform very
slightly, without changing the almost isotropic distribution of the scattered intensity along
the (α200) or (α(002/202) reflection (Fig. 6).
Unlike the PA6 film annealed at 120ºC, the samples treated at 160 and 200ºC have
SAXS patterns after stretching that are much more isotropic (Figure 4e and f; Figure 5),
but the WAXS images show more orientation along DR, especially of the outer α(002/202)
reflection. From the respective 1D WAXS patterns in Figure 2 is also seen that the sample
annealed at 200ºC suffers the strongest changes in its crystalline structure after break. It
can be concluded that after annealing at 160 and 200ºC the external stress applied leads to
deformation of the crystalline phase, rather than to deformation of the amorphous phase. It
seems that annealing at elevated temperatures provokes a certain “hardening” of the
amorphous domains that cannot be accounted for by SAXS and WAXS but affects the
deformability of the isotropic PA6. The existence of harder (called also “rigid”) amorphous
phase in PA6 fibres was proved by 13C and 1H solid-state NMR14-16. Again in PA6 fibres,
the presence of oriented fraction in the amorphous phase has been discussed17,18. To the
best of our knowledge, so far there have been no reports relating the changes in the
mechanical properties of isotropic PA6 (e.g, E-moduli, stress and strain values) to
alterations in its amorphous structure upon annealing, as suggested in the present study.
Oriented PA6 cables
The stress-strain curves of all PA6 cables (Fig. 1b) are characterized by double yield, the
two yield stresses increasing linearly with the annealing temperature (Table 1). Another
observation is the drop of ductility as the annealing temperature increases. The biggest
strain at break as well as concomitant strain hardening is displayed by the sample without

16
annealing, whereas the PA6 cables annealed above 160ºC exhibit an almost brittle failure.
As to the Young modulus values, they are also affected by the annealing: the higher the
temperature, the bigger the Young modulus.
The explanation of the tensile behaviour of the annealed PA6 cables can be related
with the alterations in their respective crystalline structure. As seen from Table 2, the
preferable crystalline modification for non-annealed cable is the γ-form. Upon annealing γ-
to α-form transition starts, better expressed above 120ºC. The α-polymorph becomes the
predominant crystalline form for cables annealed between 120 and 200ºC. Table 2 also
shows that ECI slightly increases (by 3-5%), indicating that some formation of α-form
crystals out of the amorphous material also occurs. The SAXS results showed that the γ- to
α-phase transition and the additional crystallization do not result in alterations of the
Bragg´s long spacings when the annealing temperature is up to 160ºC (Table 3). Annealing
in the 160-200ºC range, however, caused a growth of the LB values by approximately 20 Å.
It was not possible to determine the discrete contribution of the two thicknesses lc and la to
the said growth because the linear CF is not applicable for samples with fibber symmetry.
Since the crystallinity index after annealing does not change significantly, the bigger LB
after annealing at 200ºC can hardly be related to lc growth due to lamellar thickening.
Moreover, as seen from Table 4, the d-spacings of all planes decrease, meaning that the
thermal expansion should also be excluded as a possible reason for the increase of LB. It
can be supposed, therefore, that some structural changes in the amorphous domains occur
during the annealing at 200ºC and the subsequent cooling down to 30ºC contributing to the
LB change.
We are inclined to consider that the aforementioned γ-to-α form transition
occurring upon annealing is the main reason to the increase of the Young modulus and
yield stress. The γ-PA6 polymorph is shown to be more ductile, while the α-polymorph is

17
characterized by bigger tensile strength8,9. Since with the increase of the annealing
temperature α-form becomes predominant, it is to be expected that PA6 cables annealed at
higher temperature would display bigger yield stresses, as it was the case. From the point
of view of crystal slip-governed plasticity, this behaviour can be related to the decrease of
the inter-sheet distance in the two crystalline forms when annealed. As it can be seen from
Table 4, the d-spacing of (002)/(202) crystalline plane, which corresponds to the inter-
sheet distance of α-form remains smaller than that of the respective plane (200) in γ-form
for each annealing temperature. In addition, the said distance decreases from 7.467 to
7.165 Å for α-form and from 7.800 to 7.640 Å for γ-one when the annealing temperature
increases up to 200ºC. Annealing, therefore, as in the case of PA6 isotropic films, increases
the critical resolved shear stress of the main slip planes in both α- and γ polymorphs of
oriented PA6 cable thus leading to the higher yield stresses and E-moduli.
As concerned the appearance of two yield points, it cannot be unambiguously
related to the crystal slips occurring in the respective γ- and α-type crystallites. There will
always be a contribution of the amorphous phase, provided that the tensile tests were made
at room temperature, i.e. below the Tg of the material. The PA6 isotropic films, however,
were also tested at room temperature and both α- and γ- polymorphs were also present.
Nevertheless, the respective stress-strain curves showed different behaviour. In our
opinion, the observed double yield is more likely related to the appearance of oriented
fraction in the amorphous phase, rather than to the presence of two polymorphs. Such
oriented fraction was proved in oriented PA6 fibres18. One may suppose that the cold
drawing used for preparation of the PA6 cables in our case also may generate
inhomogeneous amorphous phase that can have an impact on yielding.
The impact of stretching on the structure of PA6 oriented samples is related to a
clear, stress-induced γ- to- α-transition. Interestingly, the latter depends on the annealing

18
temperature. Stretching of cables with no annealing or with 1h at 120ºC results in very
accentuated phase transition, whereas upon annealing at 160ºC this trend becomes weaker
even inverting if annealing at 200ºC is applied (Table 2, Fig. 8). One may suppose that the
amorphous phase has an important impact upon the phase transitions in the crystalline
domains. When it is more flexible, as in the case of cables without annealing or with 1h at
120ºC, the stress-induce crystalline modifications are more intense. On the contrary, when
there is hardening of the amorphous phase at higher annealing temperatures, this impedes
the crystalline phase transitions. Most probably this effect has to do with the effectiveness
of the transfer of the external stress to the crystalline domains.
CONCLUSIONS
The PA6 isotropic films obtained by compression moulding of granules are predominantly
in α crystalline form while the γ-form was the preferable of PA6 cables obtained by
extrusion and consequent cold drawing. The annealing applied does not change
significantly the crystalline structure of isotropic films but caused γ-to α form transition in
oriented cables. Both isotropic and oriented PA6 showed a growth of the E-moduli and of
the yield stresses with increase of the annealing temperature. This behaviour is explained,
on crystallographic level, by decrease of the d-spacing of the main crystal-slip planes of
two polymorphs after annealing. The external stress applied led to additional γ-to α-form
transition in both isotropic and oriented PA6 samples, whereby the higher the annealing
temperature, the weaker the inclination to the stress-induced transition. The explanation of
this effect was attributed to the possibility of formation of hard fraction (PA6 films) or
oriented fraction (PA6 cables) in the amorphous phase.

19
Acknowledgements
This work was supported by the IHP-Contract HPRI-CT-2001-00140 of the
European Commission and the HASYLAB Project II-04-047 EC. A partial financial
support was provided by FCT project POCI/CTM/57358/2004 N.D. thanks for the
financial support of her PhD research by grant No SFRH/BD/13435/2003 awarded by
Fundação para a Ciência e Tecnologia, Portugal..

20
References
1. Aharoni, S. M. n-Nylons, Their Synthesis, Structure and Properties, John Wiley & Sons:
New York, 1997, p. 316-317
2. Denchev, Z.; Oliveira, M. J.; Carneiro, O. S. J Macromol Sci Part B: Physics 2004, B43,
143
3. Denchev, Z.; Oliveira, M. J.; Mano, J. F.; Viana, J. C.; Funari, S.S. J Macromol Sci Part
B: Physics 2004, B43, 163
4. Galeski, A.; Argon, A. S.; Cohen, R. E. Macromolecules 1991, 24, 3945
5. Galeski, A.; Argon, A. S.; Cohen, R. E. Macromolecules 1991, 24, 3953
6. Lin, L; Argon, A. S. Macromolecules 1992, 25, 4011
7. Lin, L; Argon, A. S. Macromolecules 1994, 27, 6903
8. Ito, M.; Mizuochi, K.; Kanamato, T. Polymer 1998, 39, 4593
9. Penel-Pierron, L.; Séguéla, R.; Lefebvre, J.-M.; Miri, V.; Defecher, C.; Jutigny, M.;
Pabiot, J. J Polym Sci Part B: Polym Phys 2001, 39, 1224
10. Dencheva, N.; Nunes, T.; Oliveira, M.J.; Denchev, Z. Polymer 2005, 46, 887
11. Samon, J.M.; Schultz, J.M.; Hsiao, B.S. .Polymer 2000, 41, 2169
12. Schrauwen, B. A. G.; v. Breemen, L. C. A.; Spoelstra, A. B.; Govaert, L. E.; Peters, G.
W. M.; Meijer, H. E. Macromolecules 2004, 37, 8618
13. Stribeck, N.; Extraction, representation and interpretation of nanoscale domain
structure information from small–angle scattering patterns, Conference on X-ray
Investigations of Polymer Structures (XIPS 2001), 5-8 December, 2001 Bielsko Biala,
Poland

21
14. Schreiber, R.; Veeman, W. S.; Gabrie1lse, W.; and Arnauts, J. Macromolecules 1999,
32, 4647
15. Litvinov, V. M.; Penning, J. P. Macromol Chem Phys 2004, 205, 1721
16. Buda, A.; Demco, D:E.; Bertmer, M.; B. Blu1mich, B.; Litvinov, V.M.; Penning, J.P. J
Phys Chem 2003, 107, 5357
17. Murthy, N.S.; Minor, H.; Bednarczyk, C.; Krimm, S. Macromolecules 1993, 26, 1712
18. Murthy, N.S.; Bray, R.G.; Correale, S.T.; Moore, R.A.F. Polymer 1995, 36, 3863

1
Figure and Table Captions
Figure 1 Stress-strain curves of various PA6 samples: (a) isotropic films annealed for 1
hour at 120, 160 or 200ºC and (b) oriented PA6 cables without annealing (w.a.) and
annealed at 120, 160 and 200ºC for 1 hour. The curves represented are selected so as to fit
best the averaged data in Table 2.
Figure 2 1D WAXS curves of isotropic PA6 films annealed for1 hour at different
temperatures: (a) before and (b) after tensile shear the test
Figure 3 1D WAXS curves of oriented PA6 cables without (w.a.) and with annealing for 1
hour at different temperatures: (a) before and (b) after the tensile test.
Figure 4 2D SAXS patterns of PA6 isotropic films annealed for 1 h at (a) 120ºC; (b)
160ºC; (c) 200ºC before tensile test; (d-f) – SAXS patterns of the same samples after test;
(g-i) – 2D WAXS patterns of the samples d-f.
Figure 5 Azimuthal scans in the -1.55 – +1.55CHI region (rad) of the 2D SAXS patterns
of differently annealed isotropic PA6 films before (solid symbols) and after (open
symbols) mechanical failure (CHI = azimuthal angle).
Figure 6 Azimuthal scans in the -1.55 – +1.55 CHI region (rad) of 2D WAXS patterns of
differently annealed isotropic PA6 films after mechanical failure: (a) for the inner α(200)
reflection; (b) for the outer α(002/202) reflection.
Figure 7 Typical 2D SAXS patterns of oriented PA6 cables before (a) and after (b) tensile
test. Prior to the test, the sample was annealed for 1h at 160ºC.

2
Figure 8 2D WAXS patterns variously annealed PA6 oriented cables before tensile test:
(a) without annealing; (b) 120ºC; (c) 160ºC; (d) 200ºC. WAXS patterns (e-h) are of the
respective samples after the tensile test
Table 1 Mechanical properties of isotropic and oriented PA6 samples after various
annealing (iso = isotropic film; oc = oriented cable). Five standard specimens were
analyzed for each sample.
Amendment #1 *) Oriented cables display two yield points.
Table 2 Crystallinity data of variously annealed isotropic and oriented PA6 samples. The
numbers in brackets show the respective values after mechanical failure of the
corresponding sample. (Note: For the isotropic samples, CItotal is the total crystallinity
index representing the sum of the amounts of the α- and γ-polymorphs. In oriented
samples, ECI accounts for the intensity of the equatorial PA6 reflections leaving out the
meridional 020 reflections)
Table 3 Long spacings estimates (L) for differently annealed isotropic and oriented PA6
samples before and after the tensile stress test. In the former case, the average thickness of
the crystalline (lc) and amorphous regions (la) are calculated from the linear correlation
function (CR).
Amendment #2
a) For the isotropic samples, the L estimates include the LB, McL and m
cL values10.
b) For the oriented samples, the LB values are only obtained after Lorentz correction and
subtraction of the liquid scattering.
c) Sample does not show coherent SAXS scattering.

3
Table 4 Unit cell vectors and the corresponding d-spacings obtained from the 1D WAXS
patterns of isotropic and oriented PA6 samples as a function of their initial annealing,
before and after the tensile test resulting in sample failure. The b vector of the γ-form was
obtained from the meridional (020) reflection (Figure 8).

For Peer Review0 10 2 0 30 40 50 60 70 80
0
10
20
30
40
50
60
120
160200
a
Engi
neer
ing
stre
ss, M
Pa
Engineering stra in, %-20 0 20 40 60 80 120 140 160
0
2 5
5 0
7 5
10 0
12 5
15 0
17 5
20 0
22 5b
200
160
120w.a.
Stre
ss, M
Pa
Eng ineering strain, %
Figure 1, a; b.

For Peer Review
a
200
160
120
10 15 20 25 30
2 Theta, degrees
b
10 15 20 25 30
2 Theta, degrees
200
160
120
Figure 2, a; b.

15 20 25 30
2 Theta, degrees10 15 20 25 30
2 Theta, degrees
200
160
120
a b
w.a.
200
160
120
w.a.
Figure 3, a; b.

For Peer Review
a b c
d e f
g h iα(200)
α(002)/(202)
Figure 4, a - i.

-2,0 -1,5 -1,0 -0,5 0,0 0,5 1,0 1,5 2,00,20
0,25
0,30
0,35
0,40
0,45
0,50
0,55
0,60
0,65
200ºC
160ºC
120ºC
Inte
nsity
, a.u
.
CHI azimuthal angle, radians
Figure 5.

-2,0 -1,5 -1,0 -0,5 0,0 0,5 1,0 1,5 2,00,0
0,5
1,0
1,5
2,0α(200) a
160ºC200ºC
120ºC
Inten
sity,
a.u.
CHI azimuthal angle, radians-2,0 -1,5 -1,0 -0,5 0,0 0,5 1,0 1,5 2,0
0,0
0,5
1,0
1,5
2,0
α(002/202)
200ºC
160ºC
120ºC
b
Inten
sity,
a.u.
CHI azimuthal angle in radians
Figure 6, a; b.
α(200)
ba
Figure 7, a; b.

a dcb
e f g h
Figure 8, a - h.

Sample/Annealing
Young modulus,E, GPa
Yield Stress*, σy, MPa
Yield Strain,εy, %
Max. Stress, σmax, MPa
Max.Strain, σmax, %
Stress at break, σbr, MPa
Strain at break,εbr , %
PA6 iso120ºC/1h
0.73± 0.02
42 ± 2. 24 ± 2 44 ± 3 66 ± 18 17 ± 8 81 ± 18
PA6 iso160ºC/1h
1,01± 0.04
47 ± 2 24 ± 3 47 ± 4 24 ± 3 30 ± 14 70 ± 18
PA6 iso200ºC/1h
1.03± 0.04
51 ± 2 28 ± 3 51 ± 2 28 ± 5 41 ± 12 37 ± 6
PA6 oc no annealing
0.99± 0.04
66 ± 2123 ± 2
42 ± 14 201 ± 17 149 ± 26 193 ± 16 150 ± 68
PA6 oc120ºC/1h
1.78± 0.12
88 ± 1157 ± 2
36 ± 3 169 ± 19 72 ± 20 169 ± 19 74 ± 20
PA6 oc160ºC/1h
3.18± 0.14
105 ± 2170 ± 3
28 ± 5 223 ± 14 62 ± 13 223 ± 16 64 ± 14
PA6 oc200ºC/1h
3.78± 0.17
103 ± 3180 ± 2
25 ± 3 185 ± 9 47 ± 9 185 ± 9 48 ± 10
Table 1.

Sample/ Annealing
temperature, ºC
α200, %
α002/α202 %
CIα%
γ001, %
γ200, %
CIγ,%
CITotal or
ECI
α/γcontent
PA6 isotropic 120ºC - 1h
17 (20)
21 (28)
38 (48)
4(2)
2(2)
6(4)
44 (52)
6.3 (12)
PA6 isotropic 160ºC – 1h
17 (16)
22. (25)
39 (41)
4(5)
2(2)
6.0 (7)
45 (48)
6.5 (6.0)
PA6 isotropic 200ºC - 1h
14 (12)
23 (29)
37 (41)
4(3)
2(4)
7(7)
44 (48)
5.3 (5.8)
PA6 oriented No annealing
5(15)
7(17)
12 (32)
24 (8)
9(8)
33 (16)
45 (48)
0.4 (2.0)
PA6 oriented 120ºC – 1h
17 (18)
13 (27)
30 (44)
2(7)
17 (2)
20 (9)
50 (53)
1.5 (4.9)
PA6 oriented 160ºC – 1h
17 (11)
25 (30)
42 (40)
4(5)
2(1)
6(6)
48 (46)
7.0 (6.7)
PA6 oriented 200ºC - 1h
16 (11)
20 (19)
36 (30)
4(16)
10 (9)
14 (25)
50 (55)
2.6 (1.2)
Table 2.

L estimatesa), Å Lc, Å La, ÅAnnealing of 1h at
Before
After Before After Before
After
120ºC 90-92 71b) 67 - 25 -
160ºC 91-94 97-98 68 63 26 34
Isot
ropi
c
PA6
film
s
200ºC 101-105 103-107 67 64 36 41
Without annealing 68 -c) -
100ºC 67 - c) -
120ºC 66 70 -
160ºC 69 73 -
Ori
ente
dPA
6ca
bleb)
200ºC 88 82 -
Figure 3.

dα200 dα002/202 dγ 200 dγ 001 dγ 020Annealing of 1h
at Before After Before After Before After Before After Before After
120ºC 8.499 8.465 7.216 7.314 7.675 7.808 3.990 4.008 - -
160ºC 8.522 8.566 7.197 7.187 7.682 7.649 4.011 4.002 - -
PA
6 is
otro
pic
film
200ºC 8.558 8.554 7.165 7.138 7.640 7.671 4.100 4.054 - -
Without annealing
8.610 8.453 7.467 7.544 7.800 7.828 4.080 4.105 16.858 15.300
120ºC 8.342 8.418 7.438 7.633 7.928 7.826 4.074 4.038 15.880 15.300
160ºC 8.522 8.566 7.197 7.187 7.682 7.649 4.011 4.002 16.028 14.640
PA
6 or
ient
ed c
able
s
200ºC 8.558 8.554 7.165 7.138 7.640 7.671 4.100 4.054 16.028 14.400
Figure 4.