Relationship between Capital Expenditure and Economic ...
14
Relationship between Capital Expenditure and Economic Growth in Indian Economy during the Post-reform period Dr Tamma Koti Reddy Professor &Head, Department of Economics, IBS Hyderabad IFHE (A constituent of ICFAI Foundation for Higher Education), A Deemed to-be University u/s 3 of The UGC Act 1956 Abstract The present study makes an attempt to examine the effect of central government capital expenditure (CGCE), gross fixed capital formation (GFCF), and foreign direction investment (FDI) on Real GDP growth rate for the period 1990-91 to 2018-19.Auto Regressive Distribution Lag (ARDL) model and Error correction model techniques have been The results suggest that there is a long run relationship between real GDP growth rate and CGCE, GFCF and FDI. The study confirm that the capital expenditure of the central government, Gross Fixed capital formation and Foreign Direct Investments have significantly contributed for economic growth in India during the post-reform period. As the central government terminated loans given to the states, the proportion of capital expenditure in the total expenditure was declined in a drastic manner during the post-reform period as compared to pre-reform period. The study also reveals that the proportion of development expenditure in the total capital expenditure should be raised in order to take up more capital projects.The study highlights that the government should focus more on enhancing the proportion of capital expenditure in the total expenditure to achieve higher economic growth. Key Words:Capital Expenditure, Gross Fixed Capital Formation, Economic Growth,Auto Regressive Distribution Lag model,Error Correction Model Journal of Xi'an University of Architecture & Technology Volume XII, Issue IX, 2020 ISSN No : 1006-7930 Page No: 342
Transcript of Relationship between Capital Expenditure and Economic ...

Relationship between Capital Expenditure and Economic Growth in Indian Economy during the
Post-reform period
Dr Tamma Koti Reddy
Professor &Head, Department of Economics, IBS Hyderabad IFHE (A constituent of ICFAI
Foundation for Higher Education), A Deemed to-be University u/s 3 of The UGC Act 1956
Abstract
The present study makes an attempt to examine the effect of central government capital
expenditure (CGCE), gross fixed capital formation (GFCF), and foreign direction investment (FDI) on
Real GDP growth rate for the period 1990-91 to 2018-19.Auto Regressive Distribution Lag (ARDL)
model and Error correction model techniques have been The results suggest that there is a long run
relationship between real GDP growth rate and CGCE, GFCF and FDI. The study confirm that the
capital expenditure of the central government, Gross Fixed capital formation and Foreign Direct
Investments have significantly contributed for economic growth in India during the post-reform
period. As the central government terminated loans given to the states, the proportion of capital
expenditure in the total expenditure was declined in a drastic manner during the post-reform period
as compared to pre-reform period. The study also reveals that the proportion of development
expenditure in the total capital expenditure should be raised in order to take up more capital
projects.The study highlights that the government should focus more on enhancing the proportion
of capital expenditure in the total expenditure to achieve higher economic growth.
Key Words:Capital Expenditure, Gross Fixed Capital Formation, Economic Growth,Auto Regressive
Distribution Lag model,Error Correction Model
Journal of Xi'an University of Architecture & Technology
Volume XII, Issue IX, 2020
ISSN No : 1006-7930
Page No: 342

1.Introduction
The expansion in the economic activities and growing responsibilities of the government have
contributed for increase in public expenditurein India since 1950. The total public expenditure of the
central government in both revenue and capital accounts was Rs.530 crore in 195051.It rose to
Rs.1,63,520crore in 1990-91 and further to Rs.26,98,552crorein2019-20(RE). In 2020-21 Union Budget
the total public expenditure is estimated at Rs.30,42,230crore.The public expenditure is broadly
classified into both development and non-development expenditure. The budget of the central
government consist of both Revenue budget and Capital budget. Receipts and disbursements with
respect to Capital Account will be shown in the Capital Budget. Total capital receipts of the central
government consist of Market borrowings (net), Small savings, Provident funds, Special
deposits,Recovery of loans, Disinvestment receipts, External loans (net). Total capital
expenditureconsists of spending on economic development, social& Community development,
defense, general services and loans to States& U’ts. As the central government terminated loans given
to the states, the decline in the share of capital expenditure in the total expenditure was more during
the post-reform period when compared with pre-reform period(Reserve Bank of India Bulletin,
December 2008).
Table 1.1:Trends in Financial Outlays, Transfer Payments,Loans&Financial Investments of the
Central Government during Planning Period(Rs. in Crore)
Five-year Plan Total
Financial Outlays
Total Transfer
Payments to the Rest of
the Economy
Total Financial Investments&Loans
to the Rest of the Economy(Gross)
Total Expenditure
First Plan(1951-52 to 1955-56) 1854 932 966 3751
Second (1956-61) 3406 1816 2600 7823
Third (1961-66) 6701 3484 5076 15261
Annual Plan(1966-69) 5121 3621 4740 13481
Fouth(1969-74) 12745 9490 10760 32994
Fifth(1974-79) 23527 23003 21145 67674
Sixth(1980-85) 50708 60514 47034 158256
Seventh(1985-90) 113590 160538 89764 363892
Eighth(1992-97) 253275 454179 127752 835206
Ninth(1997-2002) 431711 902546 150754 1485011
Tenth(2002-07) 660192 1575997 123921 2360110
Eleventh(2007-12) 1286341 3475161 212323 4973825
Source: Economic Survey 2019-20 Volume 2,A 55
The above table provides information on total expenditure of the central governmentin terms of
Financial outlay, transfer payments to the rest of the economy and Financial Investments&loans to
the rest of the economy(Gross)during the planningperiod. Final outlays includesGovernment
consumption expenditure and Gross capital formation. The above table reels that the financial
Journal of Xi'an University of Architecture & Technology
Volume XII, Issue IX, 2020
ISSN No : 1006-7930
Page No: 343

outlays of the central government rose from a mere Rs.1,854crore in first five-year plan to Rs.23527
crore in fifth five-year plan and then it rose to Rs.2,53,275 in Eighth five-year plan and finally to
Rs.12,86,341 crore in the Eleventh five-year plan. Total transfer payments to the rest of the economy
increased from Rs.932 crore in first five-year plan to Rs.4,54,179 crore in Eighth five-year plan and
further to Rs.34,75,161 crore in Eleventh five-year plan. Total financial investments&loans to the rest
of the economy also increased considerably from Rs.966 crore in first five-year plan to Rs.1,27,752
crore in Eighth five-year plan and finally to Rs.2,12,323 in Eleventh five-year plan. Total expenditure
of the central government in terms of financial outlays, transfer payments and financial
investments&loans rose from Rs.3,751 crore in First five-year plan to Rs.8,35,206 crore in Eighth five-
year plan and then to Rs.49,73,825 crore in Eleventh five-year plan.
As the capital expenditure of the governmentis directly linked with economic growth, The
associationbetween capitalexpenditure and economic growth is an important subject of analysis and
debate, especially for developing and emerging economies across the world like India. A central
question is whether capitalexpenditure increases the GDP growth rate of the economy?
1.1 Objectives of the Study
The main objective of this study was to study the impact of Central government capital expenditure
on Real GDPgrowth in Indiafor the period 1990-91 to 2018-19.The specific objectives were:
1. To study the trends in capital receipts and capital expenditure of the central governmentfor the
period 1990-91 to 2018-19
2. To study the trends in development and non-development capital expenditure of the central
government for the period 1990-91 to 2018-19.
3. To study the trends in Gross Fixed Capital Formation, FDIs and Gross Domestic product at factor
cost In Indian economy for the period 1990-91 to 2018-19
1.2 Literature Review
Olusola Joel Oyeleke,JamiuAyinla Raheem,Olanipekun Emmanuel Falade(2016) in their article
entitled “Government Capital Expenditure and Economic Growth in Nigeria: Any Lesson from
Disaggregated Functional Analysis?”Have made an attempt to investigate the influence of
disaggregated functional government capital expenditure on economic growth in Nigeriausingerror
correction technique of estimation for the period 1970-2013. The study reveals a long run
association between public capital expenditure and economic growth. The study also revealsa
negative association between capital expenditure on economic services and economicgrowth and
the economy of Nigeria has not been benefitted from such spending on economic services. The
authors opine that the government should monitor itsspending on all developmental projects to
achieve the desired results.
Basema Al-Sharif1, Adel Bino(2019) in their article entitled “The Role of Government Capital
Expenditures in Economic Growth in Jordan”, have attempted to examine the impactof Government
Capital Expenditures on Economic Growth in Jordanusing for the period 1977-2016.In Jordan during
the time period (1977-2016). The findings indicatethat the change in capital expenditures as a
percentage of GDP has long-term equilibrium and has a short-term effect andthere is a short-term
Journal of Xi'an University of Architecture & Technology
Volume XII, Issue IX, 2020
ISSN No : 1006-7930
Page No: 344

impact of net fixed capital formation and net tax on economic growth. the results also indicate thatis
a short-term and long-term effect of government debt on economic growth.
Ben Etimudoh, et al,(2018) in their article entitled “Effect of Administrative Capital Expenditure on
Economic Development:An Emerging Nstion Outlook”, have attempted to study the effect of
administrative capital outflow on recurrent outflow on economic development in Nigeria using
Augmented Dickey-Fuller test andJohansen test for co-integration for the period 1999- 2016. The
study indicates a long run association between government capital spending and economic growth.
The study also reveals a non-significantrelationship betweenGDP and economic services.
Chukwuemeka,Valentneokolo, et. al, (2018) in their article entitled “Economic Analysis of Capital
Expenditure and Infrastructural Development in Nigeria”, have examined the impact of capital
expenditure on infrastructural development in Nigeria using autoregressive distributed lag (ARDL)
model for the period 1970-2017. The results indicates that the capital expenditure, construction
expenditure and non-oil revenue have the potency of accentuating infrastructural development in
the long-run. The authors opine that the economy of Nigeria can depend on external debt for
investing on productive activities other than infrastructural development.
NazifiAbdullahiDarma(2014) in his article entitled “Federal Capital Expenditure and its Impact on
Economic Growth in Nigeria”, has examinedthe impact of federal capital expenditure on economic
growth in Nigeria using Ordinary Least Squares for the period 1980-2010. The study reveals thatthe
Total Capital Expenditure, Capital expenditure on administration capital expenditure on social
community services and capital expenditure on transfers have positive impact on economic growth.
the results also indicates the negative impact of capital expenditure on economic services
AlexandraHukom(2015) in his article entitled “Effect of Capital Expenditures, Economic Growth And
Poverty on Human Development in Central Kalimantan”has examined the impact of capital spending,
economic growth and poverty rates onthe Human Development Index using regression equation for
the period 2006-2013. The results indicates a positive relationship between Capital expenditure and
Human Development Index. The study also reveals a positive association between economic growth
and Human Development Index and a negative association between poverty levels and Human
Development Index. The authors opine that the governmentshould give more priority for Human
Development in the planning process as it influences the economic growth of the country.
1.3. Methodology
The study attempts to examine the effect of central government capital expenditure (CGCE), gross
fixed capital formation (GFCF), and foreign direction investment (FDI) on real GDP growth rate.In
order to examine the relationship between economic growth, government capital expenditure, gross
fixed capital formation, and foreign direction investment, a linear equation is specified as following:
𝐺𝐷𝑃𝑡 = 𝛽0 + 𝛽1𝐶𝐺𝐶𝐸𝑡 + 𝛽2𝐺𝐹𝐶𝐹𝑡 + 𝛽3𝐹𝐷𝐼𝑡 + 휀𝑡(1)
β0 is constant term, β1, β2 and β3 are coefficients or long run parameters of central government
capital expenditure gross fixed capital formationand foreign direction investment respectively. εt is
white noise error term.
Journal of Xi'an University of Architecture & Technology
Volume XII, Issue IX, 2020
ISSN No : 1006-7930
Page No: 345

The study initially applies augmented dickey fuller (ADF) test to examine the stationarity of the given
time series of CGCE, GFCF, FDI and real GDP growth rate. Auto Regressive Distribution Lag (ARDL)
modelhas been used as it can be applied irrespective of whether the given time series are I(0) or I(1)
to examine the relationship between real GDP growth (GDP) and CGCE, GFCF, FDI as follows:
∆(𝐺𝐷𝑃)𝑡 = 𝛼0 + 𝛼1(𝐺𝐷𝑃)𝑡−1 + 𝛼2(𝐶𝐺𝐶𝐸)𝑡−1 + 𝛼3(𝐺𝐹𝐶𝐹)𝑡−1 + 𝛼4(𝐹𝐷𝐼)𝑡−1 +
∑ 𝛿𝑖∆(𝐺𝐷𝑃)𝑡−𝑖𝑝𝑖=1 + ∑ 𝛾𝑖∆(𝐶𝐺𝐶𝐸)𝑡−𝑖
𝑝𝑖=1 + ∑ 𝜃𝑖∆(𝐺𝐹𝐶𝐹)𝑡−𝑖
𝑝𝑖=1 + ∑ 𝜑𝑖∆(𝐹𝐷𝐼)𝑡−𝑖 + 𝜖𝑡
𝑝𝑖=1 (2)
α0is constant term, α1, α2, α3 and α4 are coefficients of one period lagged values of CGCE, GFCF and
FDI respectively. ∆ is first difference operator and p is number of lags for each of the independent
variables. 𝛿𝑖, 𝛾𝑖, 𝜃𝑖 𝑎𝑛𝑑 𝜑𝑖are coefficients of lagged values of change in GDP, CGCE, GFCF and FDI. p
is number of lags as decided by Akaike Information Criterion (AIC) and Schwarz criterion (SC). 𝜖tis
error term.
The study conducts Wald test to examine the existence of long-run relationship among the variables.
Once long run associated among the given variables is confirmed, the study applies the following
error correction model to assess the long association between GDP and CGCE, GFCF and FDI, based
on error term derived from equation (1).
∆(𝐺𝐷𝑃)𝑡 = 𝛼0 + ∑ 𝛿𝑖∆(𝐺𝐷𝑃)𝑡−𝑖𝑝𝑖=1 + ∑ 𝛾𝑖∆(𝐶𝐺𝐶𝐸)𝑡−𝑖
𝑝𝑖=1 + ∑ 𝜃𝑖∆(𝐺𝐹𝐶𝐹)𝑡−𝑖
𝑝𝑖=1 +
∑ 𝜑𝑖∆(𝐹𝐷𝐼)𝑡−𝑖 + 𝜋(𝐸𝐶𝑇)𝑡−1 + 𝜖𝑡3)𝑝𝑖=1
𝜋 is coefficient of error correction term (ECT) derived from long run model in equation 1. 𝜖𝑡is while
noise error term of the model.
In every stage, to test the robustness of the results, Breusch–Godfrey serial correlation Lagrange
multiplier (LM) test has been used to examine serial correlation in residuals of the regression model.
Wald coefficient restrictions test has been used to examine whether coefficients derived from the
model indicate long run association or not. To examine the parameter stability, recursive estimates
have been done.
2. Trends in Capital Receipts and Capital Expenditure of the Central
Government
Table 2.1:Capital Receipts and Expenditure of the Central Government(Rs. in Crore)
year Capital Receipts Central Govt.Capital
Expenditure Difference between Capital Receipts
and Expenditure
1990-91 38997 27327 11670
1991-92 38528 25612 12916
1992-93 36178 29825 6353
1993-94 55440 33190 22250
1994-95 68695 32294 36401
1995-96 58338 34504 23834
1996-97 61544 34533 27011
Journal of Xi'an University of Architecture & Technology
Volume XII, Issue IX, 2020
ISSN No : 1006-7930
Page No: 346

year Capital Receipts Central Govt.Capital
Expenditure Difference between Capital Receipts
and Expenditure
1997-98 99077 27667 71410
1998-99 130064 34415 95649
1999-00 115707 40530 75177
2000-01 134184 35036 99148
2001-02 162500 44838 117662
2002-03 180531 27134 153397
2003-04 211333 111368 102105
2004-05 200391 19519 180872
2005-06 179549 56310 123239
2006-07 144482 50620 93862
2007-08 197978 116289 81689
2008-09 299863 88267 211596
2009-10 453063 107720 345343
2010-11 402428 151837 250591
2011-12 568918 141042 427876
2012-13 582152 155822 426330
2013-14 563894 175296 388598
2014-15 484448 187460 296988
2015-16 582579 284268 298311
2016-17 609886 270309 339577
2017-18 702650 297869 404781
2018-19 686352 316623 369729
Source: Budget documents of the Government of India.
The above table 2.1provides information on capital receipts, capital expenditure and difference
between capital receipts and capital expenditure. It can be observed from the table that the capital
receipts of the central government has recorded a considerable increase during the post-reform
period.The amount of capital receipts increased from Rs.38,997 crore in 1990-91 to Rs.1,62,500
crore in 2000-01 and in 2018-19, the capital receipts were to tune of Rs.6,86,352 crore.Capital
expenditurealso increased considerably since 1990-91. It consists of spending on economic
development, social&Community development, defense, general services and loans to States&U’ts.
The capital expenditureof the central government stood at Rs.27,327crore in1990-91. It rose to
nearlyRs.35,036crorein2000-01 andfurther to Rs.1,51,837 crore in 2010-11 and then it is estimated
at Rs.3,16,623 crore in2018-19. It can beobserved from the above table that the difference between
capital receipts and capital expenditurehas grown considerably from Rs. 11,670 crore in 1990-91 to
Rs.99,148 crore in 2000-01 and further to Rs.4,04,781 crore in 2017-18 then declined to Rs.3,69,729
crore in 2018-19.It is inferred that the entire capital receipts mobilized from different sources are
not transformed as capital expenditure.
Journal of Xi'an University of Architecture & Technology
Volume XII, Issue IX, 2020
ISSN No : 1006-7930
Page No: 347
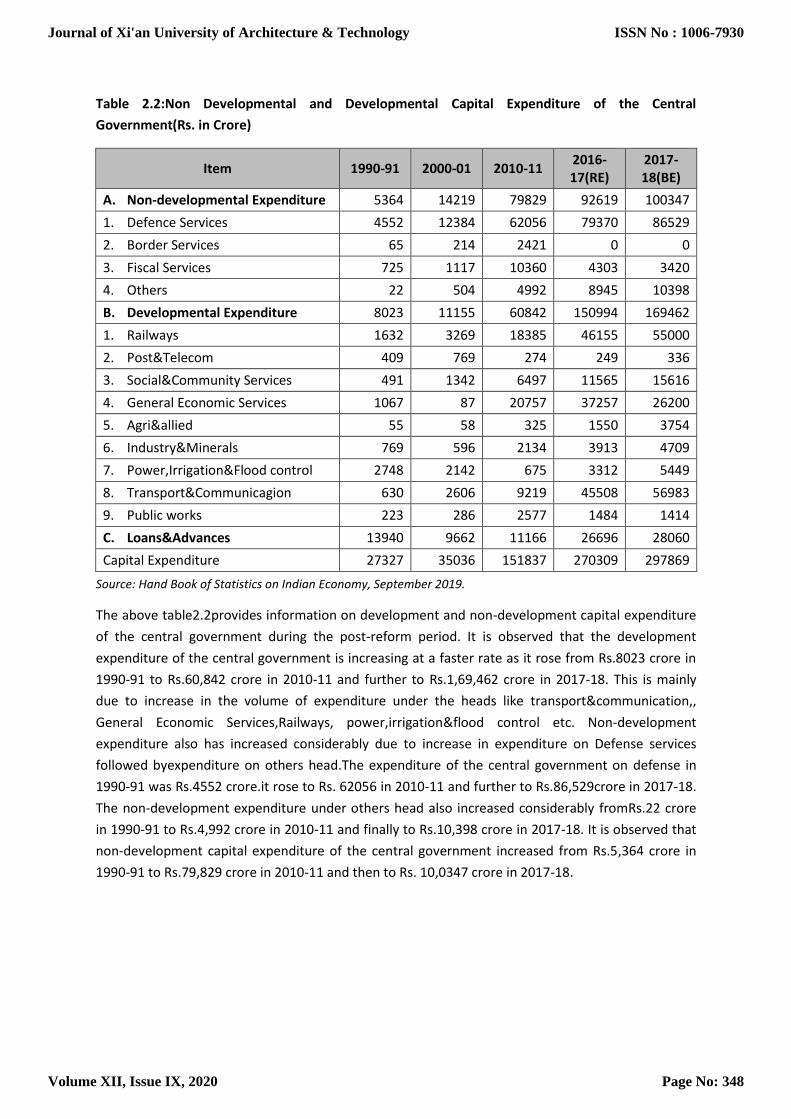
Table 2.2:Non Developmental and Developmental Capital Expenditure of the Central
Government(Rs. in Crore)
Item 1990-91 2000-01 2010-11 2016-17(RE)
2017-18(BE)
A. Non-developmental Expenditure 5364 14219 79829 92619 100347
1. Defence Services 4552 12384 62056 79370 86529
2. Border Services 65 214 2421 0 0
3. Fiscal Services 725 1117 10360 4303 3420
4. Others 22 504 4992 8945 10398
B. Developmental Expenditure 8023 11155 60842 150994 169462
1. Railways 1632 3269 18385 46155 55000
2. Post&Telecom 409 769 274 249 336
3. Social&Community Services 491 1342 6497 11565 15616
4. General Economic Services 1067 87 20757 37257 26200
5. Agri&allied 55 58 325 1550 3754
6. Industry&Minerals 769 596 2134 3913 4709
7. Power,Irrigation&Flood control 2748 2142 675 3312 5449
8. Transport&Communicagion 630 2606 9219 45508 56983
9. Public works 223 286 2577 1484 1414
C. Loans&Advances 13940 9662 11166 26696 28060
Capital Expenditure 27327 35036 151837 270309 297869
Source: Hand Book of Statistics on Indian Economy, September 2019.
The above table2.2provides information on development and non-development capital expenditure
of the central government during the post-reform period. It is observed that the development
expenditure of the central government is increasing at a faster rate as it rose from Rs.8023 crore in
1990-91 to Rs.60,842 crore in 2010-11 and further to Rs.1,69,462 crore in 2017-18. This is mainly
due to increase in the volume of expenditure under the heads like transport&communication,,
General Economic Services,Railways, power,irrigation&flood control etc. Non-development
expenditure also has increased considerably due to increase in expenditure on Defense services
followed byexpenditure on others head.The expenditure of the central government on defense in
1990-91 was Rs.4552 crore.it rose to Rs. 62056 in 2010-11 and further to Rs.86,529crore in 2017-18.
The non-development expenditure under others head also increased considerably fromRs.22 crore
in 1990-91 to Rs.4,992 crore in 2010-11 and finally to Rs.10,398 crore in 2017-18. It is observed that
non-development capital expenditure of the central government increased from Rs.5,364 crore in
1990-91 to Rs.79,829 crore in 2010-11 and then to Rs. 10,0347 crore in 2017-18.
Journal of Xi'an University of Architecture & Technology
Volume XII, Issue IX, 2020
ISSN No : 1006-7930
Page No: 348

3. Trends in Central Government Capital Expenditure, GFCF, FDI and Real
GDP Growth
Capital formation plays an important role in the process of economic development in developing
economies like India. Net additions made to the existing stock of capital in a given period of time is
referred as capital formation. Capital formation in developing economies like India is at low when
compared with developed economies across the world. Lack of strong financial institutions,
demonstration effect, High rate of growth of population, Low rate of growth of national income and
per capita income, Small size of market and lack of infrastructural facilities are the factors
responsible for low rate of savings and investments in the economy. As a result India is experiencing
low rate of capital formation.Aggregate of gross additions to fixed assets(Construction, Machinery
and equipment) plus change in stocks in a given period is referred as Gross Fixed Capital Formation.
Foreign Direct Investments are also contributing towards India’s Gross Fixed Capital Formation. FDI
inflow has been increased during the reform period as the government has removed all restrictions
on capital inflow from abroad. The rate of domestic savings and investments should be raised to
attain a rapid economic growth.
Table 3.1:Trends in Central Government Capital Expenditure, GFCF, FDI and Real GDP Growth
year Central Govt.Capital
Expenditure (Rs. in Crore)
Gross Fixed Capital Formation
(Rs. in Crore)
FDI (Rs. in Crore)
GDP Growth(%)
1990-91 27327 347966 174 5.3
1991-92 25612 328594 316 1.4
1992-93 29825 358162 965 5.4
1993-94 33190 354848 1838 5.7
1994-95 32294 388410 4126 6.4
1995-96 34504 451596 7172 7.3
1996-97 34533 465355 10015 8.0
1997-98 27667 506706 13220 4.3
1998-99 34415 555913 10358 6.7
1999-00 40530 599973 9338 8.0
2000-01 35036 591610 18404 4.1
2001-02 44838 682143 29245 5.4
2002-03 27134 679170 24397 3.9
2003-04 111368 750940 19830 8.0
2004-05 19519 931028 26947 7.1
2005-06 56310 1081792 39457 9.5
2006-07 50620 1231265 102652 9.6
2007-08 116289 1430764 139421 9.3
2008-09 88267 1480943 190645 6.7
2009-10 107720 1594475 157819 8.6
Journal of Xi'an University of Architecture & Technology
Volume XII, Issue IX, 2020
ISSN No : 1006-7930
Page No: 349

year Central Govt.Capital
Expenditure (Rs. in Crore)
Gross Fixed Capital Formation
(Rs. in Crore)
FDI (Rs. in Crore)
GDP Growth(%)
2010-11 151837 1769792 132358 8.9
2011-12 141042 2997733 154961 6.7
2012-13 155822 3145793 146954 4.5
2013-14 175296 3194924 186830 4.7
2014-15 187460 3278096 215893 4.6
2015-16 284268 3492183 294258 7.6
2016-17 270309 3783778 283292 7.1
2017-18 297869 4136572 253977 7.2
2018-19 316623 4548452 301932 6.8
Source: (1) HandBook of Statistics on Indian Economy 2006&2019
(2) Economic Survey: 2014-15&2019-20
The above table 3.1.provides information on the trends in capital expenditure of the central
government, Gross fixed capital formation, FDI and Real GDP Growth of Indian economy since 1990-
91. It is observed that Centralgovernment’s capital expenditure which was Rs.27,327 Crore in 1990-
91 increased by approximately four times to Rs.1,11,368 crore in 2003-04 and then declined to
Rs.19,519 crore in 2004-05. Again the capital expenditure increased from Rs.56,310crore in 2005-06
to Rs.297869 crore in 2017-18 and then to Rs.3,16,623 crore in 2018-19.It is clear from the above
tablethat the central government capital expenditure has shown some improvement in 2000s when
compared with the first decade of reform period.
Gross fixed capital formation (GFCF)has increased considerably during the post-reform period. GFCF
had increased from Rs.3,47,966cfrore in 1990-91 to Rs.5,99,973 crore in 1999-00.GFCF has risen very
rapidly since 2003-04. It has gradually increased from Rs.7,50,940crore in 2003-04 to Rs.29,97,733
crore in 2011-12 and then to Rs.41,36,572 crore in 2017-18. The same again increased to
Rs.45,48,452crore in 2018-19.
During the post-reform period Indian economy has witnessed a tremendous growth in terms of FDI
inflows It is observed that the actual inflows of FDI’s increased from Rs.174 crore in 1990-91to
Rs.9,338 crore in 1999-00 and then to Rs.39,457 crore in 2005-06. FDI inflows into India was very
much impressive in 2006-07.The actual inflows during 2006-07 were registered at Rs.1,02,652crore
and thetrend continued in the next two subsequent years also. The entire world economy has
witnessed a decline in FDI inflows during 2009-10 and 2010-11 and the same was observed in India.
Again FDI inflows into India in Rupee terms increased to Rs.1,54,961 crore in 2011-12 and then
declined to Rs. 146954 crore in 2012-13.Inflows during 2013-14 wererecorded at Rs. 186830 crore
and increased significantly toRs. 215893 crore in 2014-15and then to Rs. 294258 crore in 2015-16.
Though FDI inflows declined in the next two subsequent years finally rose to Rs.301932 crore in
2018-19.During the period1990-91 to 1999-2000 the average annual growth of GDP at factor Cost
was registered at 5.8 percent. It rose to 7.2 per cent during 2000-01 to 2009-10 and then declined to
6.44 per cent for the period 2010-11 to 2018-19.
Journal of Xi'an University of Architecture & Technology
Volume XII, Issue IX, 2020
ISSN No : 1006-7930
Page No: 350
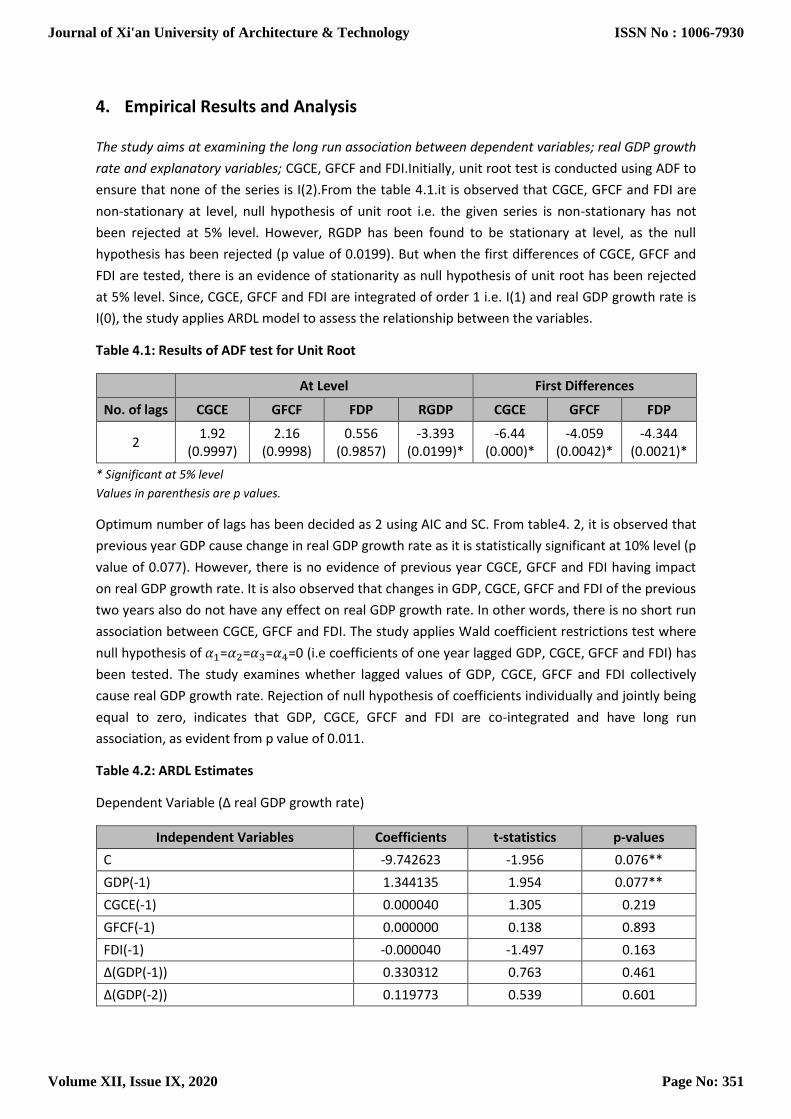
4. Empirical Results and Analysis
The study aims at examining the long run association between dependent variables; real GDP growth
rate and explanatory variables; CGCE, GFCF and FDI.Initially, unit root test is conducted using ADF to
ensure that none of the series is I(2).From the table 4.1.it is observed that CGCE, GFCF and FDI are
non-stationary at level, null hypothesis of unit root i.e. the given series is non-stationary has not
been rejected at 5% level. However, RGDP has been found to be stationary at level, as the null
hypothesis has been rejected (p value of 0.0199). But when the first differences of CGCE, GFCF and
FDI are tested, there is an evidence of stationarity as null hypothesis of unit root has been rejected
at 5% level. Since, CGCE, GFCF and FDI are integrated of order 1 i.e. I(1) and real GDP growth rate is
I(0), the study applies ARDL model to assess the relationship between the variables.
Table 4.1: Results of ADF test for Unit Root
At Level First Differences
No. of lags CGCE GFCF FDP RGDP CGCE GFCF FDP
2 1.92
(0.9997) 2.16
(0.9998) 0.556
(0.9857) -3.393
(0.0199)* -6.44
(0.000)* -4.059
(0.0042)* -4.344
(0.0021)*
* Significant at 5% level
Values in parenthesis are p values.
Optimum number of lags has been decided as 2 using AIC and SC. From table4. 2, it is observed that
previous year GDP cause change in real GDP growth rate as it is statistically significant at 10% level (p
value of 0.077). However, there is no evidence of previous year CGCE, GFCF and FDI having impact
on real GDP growth rate. It is also observed that changes in GDP, CGCE, GFCF and FDI of the previous
two years also do not have any effect on real GDP growth rate. In other words, there is no short run
association between CGCE, GFCF and FDI. The study applies Wald coefficient restrictions test where
null hypothesis of 𝛼1=𝛼2=𝛼3=𝛼4=0 (i.e coefficients of one year lagged GDP, CGCE, GFCF and FDI) has
been tested. The study examines whether lagged values of GDP, CGCE, GFCF and FDI collectively
cause real GDP growth rate. Rejection of null hypothesis of coefficients individually and jointly being
equal to zero, indicates that GDP, CGCE, GFCF and FDI are co-integrated and have long run
association, as evident from p value of 0.011.
Table 4.2: ARDL Estimates
Dependent Variable (∆ real GDP growth rate)
Independent Variables Coefficients t-statistics p-values
C -9.742623 -1.956 0.076**
GDP(-1) 1.344135 1.954 0.077**
CGCE(-1) 0.000040 1.305 0.219
GFCF(-1) 0.000000 0.138 0.893
FDI(-1) -0.000040 -1.497 0.163
∆(GDP(-1)) 0.330312 0.763 0.461
∆(GDP(-2)) 0.119773 0.539 0.601
Journal of Xi'an University of Architecture & Technology
Volume XII, Issue IX, 2020
ISSN No : 1006-7930
Page No: 351

∆(CGCE (-1)) -0.000050 -1.400 0.189
∆(CGCE (-2)) -0.000016 -0.670 0.517
∆(GFCF (-1)) -0.000001 -0.474 0.645
∆(GFCF (-2)) 0.000002 0.918 0.378
∆(FDI(-1)) 0.000040 1.458 0.173
∆(FDI(-2)) 0.000022 1.022 0.329
Diagnostic tests test statistics p-values
Breusch–GodfreyLM serial correlation 2.590 0.120
Wald coefficient restrictions test
Null Hypothesis: 𝛼1=𝛼2=𝛼3=𝛼4=0 5.696 0.011*
* Statistically significant at 5 level
** Statistically significant at 10% level
To test the robustness of the results, the model has been further subject to Breusch–GodfreyLM
serial correlation test to examine the null hypothesis of no serial correlation in the residuals derived
from the model. No serial correlation has been observed as evident from the p value of 0.120. When
the stability of the model has been examined by recursive estimates CUSUM, it is observed that
estimated coefficients of the model are stable (figure 1).
Figure 4. 1: Stability in Coefficients of ARDL Model-Recursive Estimates
-12
-8
-4
0
4
8
12
17 18 19 20 21 22 23 24 25 26 27 28 29
CUSUM 5% Significance
Table 4.3: Long run Estimates
Coefficients t statistics p values
C 6.621661 11.496 0.000*
CGCE -0.0000001 -0.003 0.997
GFCF -0.0000013 -1.256 0.221
FDI 0.0000199 1.626 0.117
* Statistically significant 5% level
Journal of Xi'an University of Architecture & Technology
Volume XII, Issue IX, 2020
ISSN No : 1006-7930
Page No: 352
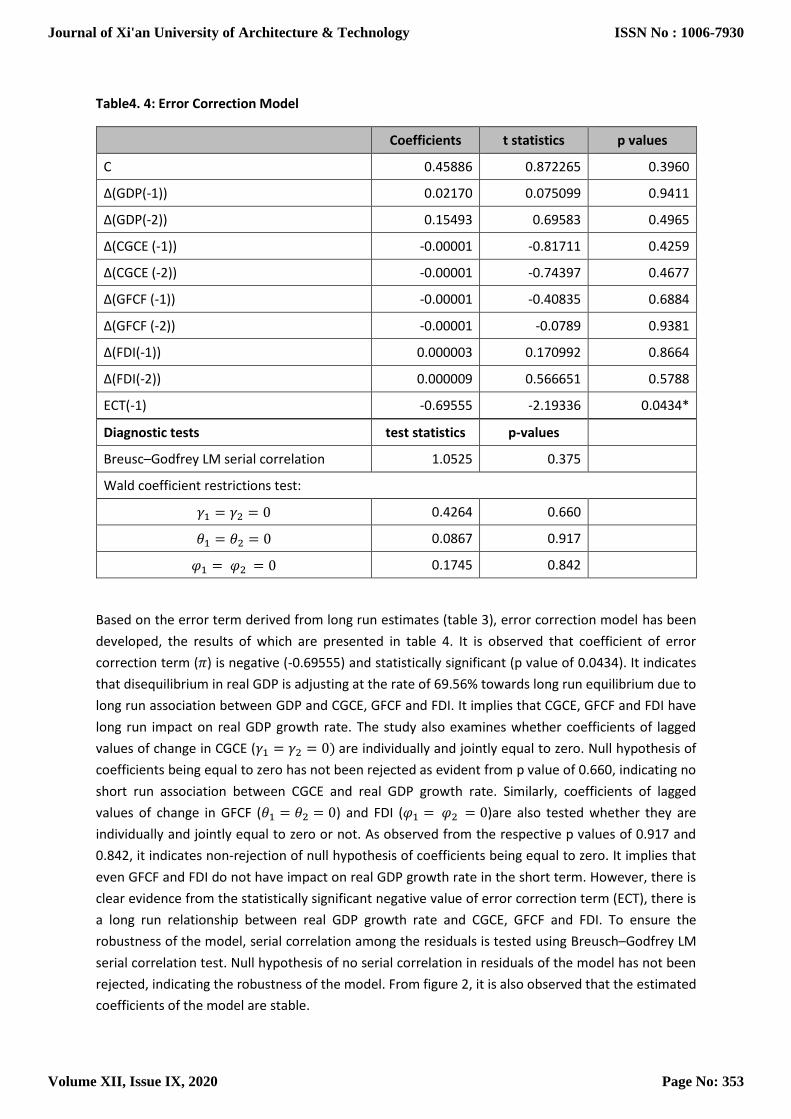
Table4. 4: Error Correction Model
Coefficients t statistics p values
C 0.45886 0.872265 0.3960
∆(GDP(-1)) 0.02170 0.075099 0.9411
∆(GDP(-2)) 0.15493 0.69583 0.4965
∆(CGCE (-1)) -0.00001 -0.81711 0.4259
∆(CGCE (-2)) -0.00001 -0.74397 0.4677
∆(GFCF (-1)) -0.00001 -0.40835 0.6884
∆(GFCF (-2)) -0.00001 -0.0789 0.9381
∆(FDI(-1)) 0.000003 0.170992 0.8664
∆(FDI(-2)) 0.000009 0.566651 0.5788
ECT(-1) -0.69555 -2.19336 0.0434*
Diagnostic tests test statistics p-values
Breusc–Godfrey LM serial correlation 1.0525 0.375
Wald coefficient restrictions test:
𝛾1 = 𝛾2 = 0 0.4264 0.660
𝜃1 = 𝜃2 = 0 0.0867 0.917
𝜑1 = 𝜑2 = 0 0.1745 0.842
Based on the error term derived from long run estimates (table 3), error correction model has been
developed, the results of which are presented in table 4. It is observed that coefficient of error
correction term (𝜋) is negative (-0.69555) and statistically significant (p value of 0.0434). It indicates
that disequilibrium in real GDP is adjusting at the rate of 69.56% towards long run equilibrium due to
long run association between GDP and CGCE, GFCF and FDI. It implies that CGCE, GFCF and FDI have
long run impact on real GDP growth rate. The study also examines whether coefficients of lagged
values of change in CGCE (𝛾1 = 𝛾2 = 0) are individually and jointly equal to zero. Null hypothesis of
coefficients being equal to zero has not been rejected as evident from p value of 0.660, indicating no
short run association between CGCE and real GDP growth rate. Similarly, coefficients of lagged
values of change in GFCF (𝜃1 = 𝜃2 = 0) and FDI (𝜑1 = 𝜑2 = 0)are also tested whether they are
individually and jointly equal to zero or not. As observed from the respective p values of 0.917 and
0.842, it indicates non-rejection of null hypothesis of coefficients being equal to zero. It implies that
even GFCF and FDI do not have impact on real GDP growth rate in the short term. However, there is
clear evidence from the statistically significant negative value of error correction term (ECT), there is
a long run relationship between real GDP growth rate and CGCE, GFCF and FDI. To ensure the
robustness of the model, serial correlation among the residuals is tested using Breusch–Godfrey LM
serial correlation test. Null hypothesis of no serial correlation in residuals of the model has not been
rejected, indicating the robustness of the model. From figure 2, it is also observed that the estimated
coefficients of the model are stable.
Journal of Xi'an University of Architecture & Technology
Volume XII, Issue IX, 2020
ISSN No : 1006-7930
Page No: 353

Figure 4.2: Stability in Coefficients of Error Correction Model-Recursive Estimates
-12
-8
-4
0
4
8
12
14 15 16 17 18 19 20 21 22 23 24 25 26 27 28 29
CUSUM 5% Significance
5. Conclusion
From the above discussion it can be concluded that there is a long run relationship between real
GDP growth rate and CGCE, GFCF and FDIas itis evidentfrom the statistically significant negative
value of error correction term (ECT). The study confirm that the capital expenditure of the central
government, Gross Fixed capital formation and Foreign Direct Investments have significantly
contributed for economic growth in India during the post-reform period. As the central government
terminated loans given to the states, the decline in the share of capital expenditure in the total
expenditure was more during the post-reform period when compared with pre-reform period. The
proportion of development expenditure in the total capital expenditure should be raised in order to
take up more capital projects. The entire capital receipts mobilized from different sources should be
transformed as capital expenditure. It should be the responsibility of the government tofocus more
on enhancing the proportion of capital expenditure in the total expenditure to achieve higher
economic growth.
Journal of Xi'an University of Architecture & Technology
Volume XII, Issue IX, 2020
ISSN No : 1006-7930
Page No: 354

Bibliography:
1. Alexandra Hukom): “Effect Of Capital Expenditures, Economic Growth And Poverty On Human
Development In Central Kalimantan”, IOSR Journal of Economics and Finance (IOSR-JEF),
2015,Volume 6, Issue 6. Ver. IV (Nov. - Dec. 2015), PP 19-27
2. Basema Al-Sharif1, , Adel Bino:”The Role of Government Capital Expenditures in Economic
Growth in Jordan”,International Journal of Business and Economics Research, 2019,8(2): 69-77
3. Ben Etimudoh,Udo Emmanuel Samuel, AbnerIshakuPrince,Ike Ruby Nneka,TingirTerzungwe
Joshua:”Effect of Administrative capital expenditure on Economic Development:An Emerging
Nstion Outlook”, Journal of Internet Banking and Commerce, April 2018, vol. 23, no. 1
4. Chukwuemeka,Valentneokolo,RichardsonKoloEdeme,Chinanuifemmanuel:”Economic Analysis
of Capital Expenditure and Infrastructural Development in Nigeria”, Journal of Infrastructure
Development,2018, 10(1–2) 52–62,Sage Publication
5. Olusola Joel Oyeleke,JamiuAyinla Raheem,Olanipekun Emmanuel Falade:”Government Capital
Expenditure and Economic Growth in Nigeria: Any Lesson from Disaggregated Functional
Analysis?European Journal of Business and Management, 2016,Vol.8,No.31.
6. Nazifi Abdullahi Darma:”Federal Capital Expenditure and its impact on Economic Growth in
Nigeria; 1980-2010”, https://www.semanticscholar.org/paper/Federal-Capital-Expenditure-
and-its-impact-on-in-Darma/90ed0a4d941d16c35054c3785d835da5e28df598
Journal of Xi'an University of Architecture & Technology
Volume XII, Issue IX, 2020
ISSN No : 1006-7930
Page No: 355