RELATEDNESS AMONG GALLING APHIDS AS DETERMINED BY …
48
RELATEDNESS AMONG GALLING APHIDS AS DETERMINED BY AFLP ANALYSIS ____________ A Thesis Presented to the Faculty of California State University, Chico ____________ In Partial Fulfillment of the Requirements for the Degree Master of Science in Biological Sciences ____________ by Brian G. Taylor Spring 2012
Transcript of RELATEDNESS AMONG GALLING APHIDS AS DETERMINED BY …

RELATEDNESS AMONG GALLING APHIDS AS DETERMINED
BY AFLP ANALYSIS
____________
A Thesis
Presented
to the Faculty of
California State University, Chico
____________
In Partial Fulfillment
of the Requirements for the Degree
Master of Science
in
Biological Sciences
____________
by
Brian G. Taylor
Spring 2012


iii
ACKNOWLEDGEMENTS
This work was supported by the Big Chico Creek Ecological Reserve and the
California State University, Chico Office of Graduate studies. I am also grateful to my
committee members for their assistance and support, and would like to thank Dr. David
H. Kistner, the staff of the CSU, Chico Aquatic Bioassessment Lab and the staff of the
CSUC Department of Biological Sciences.

iv
TABLE OF CONTENTS
PAGE
Acknowledgements.................................................................................................... iii
List of Tables ............................................................................................................. vi
List of Figures ............................................................................................................ vii
Abstract ...................................................................................................................... viii CHAPTER I. Introduction................................................................................................. 1 II. Review of Literature ................................................................................... 10
Tamalia coweni – An Overview..................................................... 4 Eusociality and Kin Selection ........................................................ 8 Molecular Genotyping Methodologies .............................................. 10
III. Materials and Methods................................................................................ 13
Sample Acquisition............................................................................ 13 Extraction of Genomic DNA ............................................................. 14 Restriction-Ligation Protocol............................................................. 15 Pre-selective Amplification Protocol................................................. 16 Selective Amplification Protocol....................................................... 16 Product Analysis ................................................................................ 17 Data Analysis ..................................................................................... 17
IV. Results and Discussion ............................................................................... 19
Frequency of Gall Cohabitation and Gall Productivity ..................... 19 Genetic Distance Values .................................................................... 20 Fragment Profiles and Parsimony Analysis....................................... 22 Discussion.......................................................................................... 23 Suggestions for Future Studies .......................................................... 28 Conclusions........................................................................................ 30

v
PAGE Cited References ........................................................................................................ 31

vi
LIST OF TABLES
TABLE PAGE
1. Numbers of Single and Multi-Foundress Galls and Numbers of Offspring per Gall ..................................................................................... 19
2. Average GD Values per Gall........................................................................... 22
3. Pairwise Genetic Distance Values................................................................... 21

vii
LIST OF FIGURES
FIGURE PAGE
1. Map of the Sampling Location........................................................................ 14
2. Average Offspring per Gall vs. Number of Foundresses per Gall .................. 20
3. Boxplot Representing Mean GD Gall; Intra-Gall Values ............................... 23
4. Fragment Profiles Collected for all Individuals (n=33) from AFLP-PCR Reactions................................................................................ 24
5. Maximum Parsimony Tree for Foundresses from Communally Occupied Galls at the Study Site ............................................................... 25

viii
ABSTRACT
RELATEDNESS AMONG GALLING APHIDS AS DETERMINED
BY AFLP ANALYSIS
by
Brian G. Taylor
Master of Science in Biological Sciences
California State University, Chico
Cooperative or eusocial behavior is not unknown among gall-inducing insects,
but the ecological and evolutionary contexts which produce such behaviors vary in their
details. In Northern California, the manzanita leaf-gall aphid Tamalia coweni has shown
a tendency to communally occupy leaf galls, in contrast to solitary gall occupation, the
mode more typical for galling aphids. One potential explanation for this behavior is that
kin selection may make communal gall occupation a viable alternative to solitary gall
occupation, due to a high degree of relatedness between gall co-occupants and increased
numbers of offspring in communally occupied galls. To evaluate this, the “kin selection
hypothesis,” my study involved recording the frequency of communal behavior in a local
population of T. Coweni on Arctostaphylos patula, and evaluated differences in
reproductive rates between single and multiple-occupant galls and the degree of
relatedness among gall co-occupants. Out of 375 galls examined, 11 percent were
communally occupied, with double-foundress galls being the most common type of

ix
communal gall. The maximum number of communal foundresses found in any single gall
was five. The productivity of communal galls (measured by numbers of offspring per
gall) was higher than for single-foundress galls on a per-gall basis but lower per capita.
AFLP-PCR was used to gentotype individual aphids from communal galls. Analysis of
genetic distance between individuals revealed that relatedness among gall cohabitants
was higher, on average, than for non-gall cohabitants. Parsimony analysis of the AFLP
profiles found a number of highly parsimonious pairs cohabiting in galls. These results
support the kin selection hypothesis, and suggest that communal gall occupation in this
species represents a form of cooperative behavior, which may facilitate elaboration of
cooperation, and, potentially, the origins of caste and eusociality in this species.

1
CHAPTER I
INTRODUCTION
Natural selection is inextricably tied to the concept of fitness, which is defined
in a number of ways, including possession of adaptations to the immediate environment
(Darwin 1869), rates of survival (Spencer 1864), of reproduction (Austin & Short 1985),
or even as a probability function (Smith 1989). The variable nature of fitness (and by
extension, adaptation) must be remembered when attempting to interpret seemingly non-
adaptive behaviors in an evolutionary context. In the social insects, for example, there are
numerous instances of sterile worker or soldier castes whose presence benefits the colony
as a whole but whose personal fitness as non-reproductives is effectively zero (Wilson
1971, Itô 1989, Stern & Foster 1996). The persistence of these organisms would appear
anomalous by the standard definition of fitness via reproductive success; however, this
phenomenon becomes less puzzling when the definition of fitness is expanded to include
not only individual reproductive success but the success of relatives (sharing many of the
same genes), a concept known as inclusive fitness (Hamilton 1963, 1964, Fletcher &
Zwick 2006).
In the same way that Inclusive Fitness extends the definition of fitness beyond
the level of the individual organism, a modified version of selection, referred to as kin
selection (Smith 1964 Hamilton 1964, Miller 1998b), expands the concept of selection
beyond the individual unit of selection to define it as acting at a family or population

2
level, where related individuals who have a large number of genes in common are
selected for or against as a group. Kin selection is often invoked to explain occurrences
where individuals behave in a way that enhances the fitness of other members of their
family or population even at risk to their own fitness, known as “altruistic” behavior
(Hamilton 1972, Abbot et al. 2001). Such behaviors are not adaptive at the individual
level but kin selection may favor their evolution, and this is the most well-understood
explanation for the prevalence of such behavior, which is common among social
organisms. Thus, when similar behaviors arise in what are considered to be non-social
species, it begs the question of whether such behaviors are merely anomalous or
indicative of a degree of socialiity (and presumably, relatedness) within the species or
population being observed.
One such example of apparently maladaptive behavior which may be an
unrecognized form of altruism and is related to kin selection occurs in populations of the
galling aphid Tamalia coweni. In northern California, this species induces leaf galls on
the host plant Arctostaphylos viscida and both leaf and inflorescence galls on
Arctostaphylos patlua. In the study population, communal gall occupation has been
observed (multiple reproductives sharing a gall rather than each having their own). What
is surprising about this behavior is that it appears to decrease reproductive success for all
gall co-habitants by lowering numbers of offspring produced per capita, yet communal
galling persists (Miller 1998a, b).
Tamalia coweni, like many other aphids, reproduces in part by
parthenogenetic (asexual) reproduction, so one possible explanation for communal gall
occupation is that the co-occupants are often genetically similar and thus are not

3
competing but rather cooperating with one another. Lending additional plausibility to this
hypothesis is the fact that overall numbers of offspring produced are often higher in
communally founded galls (meaning cohabitation could be beneficial if gall-mates are
closely related) and that other galling aphid species which show communal galling
behavior have evolved sociality (Abbot et al. 2001, Johnson 2002, Bryden & Jansen
2010).
Although kin selection may potentially explain communal gall occupation in
Tamalia coweni, there is little direct support for this hypothesis. Therefore, this study was
designed to assess: (I) the continued presence and frequency of gall cohabitation in a
local population of this species, (II) the productivity of communally occupied galls, and
(III) the relatedness of communal gall occupants. The first two aspects were evaluated by
collection and dissection of galls in the study area; the third aspect was evaluated via the
use of Amplified Fragment Length Polymorphism (AFLP) analysis, calculation of
genetic distances and phylogenetic analysis using parsimony. I observed increased
productivity in communally occupied galls, and a high level of relatedness among gall
co-occupants. These results strongly support for the kin selection hypothesis.

4
CHAPTER II
LITERATURE REVIEW
Tamalia coweni – An Overview
Tamalia coweni was first described as Phyllaphis coweni by Cockerell (1905)
although its earliest report was by Cowen (1895). This initial description was based
solely on wingless individuals obtained from leaf galls. Both the oviparous and
parthenogenic winged females were subsequently described by Gillette (1909). The
genus Tamalia was described by A.C. Baker in 1920 in Generic classification of the
hemipterous family Aphididae (the family Aphididae Latreille itself was established in
Histoire naturelle, générale et particulière des crustacés et des Insectes, 1802). The
Subfamily Tamaliinae was established within the Aphididae by Remaudière and Stroyan
(1984). In addition to Tamalia coweni (Cockerell 1905) and its synonym Cryptosiphon
tahoense (Davidson 1911) the genus includes the species dicksoni (Remaudière &
Stroyan 1984), keltoni (Richards 1967), pallidus (Richards 1967) and inquilinus (Miller
& Sharkey 2000).
A summary description of the genus by Gillette & Palmer (1931) reads as
follows:
Characters – Frontal tubercles absent. First tarsal joint triangular. Cornicles mere flanges on low, conical bases. Antennae 6-jointed, minutely setose and with narrow sensoria. Fore wings with media twice branched and arising proximad of stigmae, hind wings with media and cubitus. Cauda broader than long and rounded. Anal Plate entire in all female forms. Eyes in apterae of 3 facets only. Sexes both alate. Oviparae laying many eggs. Living concealed in pseudo-galls on leaves. (p. 883)

5
The galling behavior described in the final sentence is not is not unique to this
genus, family, or order. Galling aphids, in general, tend to be affiliated with specific host
plants, but although they seem to possess specific host preferences the relationships are
not always obligatory, as some species have been observed using multiple host plants
(Dixon 1985). In addition to alternating sexual and asexual generations, they also have
complex life cycles which show high diversity and region-specific variations (Wool
2004).
The specifics of Tamalia coweni biology have been elucidated most
thoroughly by Miller, who has reviewed the species’s ecology and life history (1998a),
communal gall occupation and kin selection (1998b) and rates of evolution and host-plant
specificity (2003), in addition to co-authoring a description of an inquiline species closely
associated with coweni, Tamalia inquilinus (2000).
The terminology used to describe Tamalia biology is derived from Blackman’s
simplification of aphid terminology (Blackman 1994). Asexual (parthenogenetic) females are
termed viviparous, while the mating females are oviparous. Any wingless morph which
induces gall formation is referred to as a foundress, and a gall occupied by more than one
foundress is a communal gall (Wilson 1971).
There are two distinct groups of gall producers in this life cycle, the first of
which are the recombinant stem mothers, or fundatrices (Miyazaki 1987), which emerge
between late April and early June from overwintering eggs laid at the base of the host
plant (Arctostaphylos patula in the study area) by sexual winged females after mating.
These stem mothers induce gall formation after migrating to the new leaves of the host
plant, and undergo four molts while inside the gall, after which they produce a generation

6
of viviparous winged females by parthenogenesis (Miller 1998a). These asexual winged
females also undergo several molts inside the gall before completing their final molt
outside the gall and aerially dispersing. These second-generation winged females
parthenogenetically produce winged males, which are also winged, winged mating
females, and third-generation parthenogenetic winged and wingless females (Miller
1998a, Miller & Crespi 2003). The second group of gall inducers is the aforementioned
third-generation wingless females (foundresses), which induce a second cohort of galls
on inflorescences and leaves (Figure 2) of the host plants after emergence, where they
produce a fourth generation of mating males and females. Males and mating females
mate after dispersing and the overwintering eggs are deposited by the mating females
between July and September. The cycle occurs a month later in A. patula than in the
similar A. viscida, which is also used as a host plant in Northern California and it is not
uncommon for additional gall-inducing generations to occur on A. patula (Miller &
Crespi 2003).
In both cycles of gall induction, the early-phase gall is not fully enclosed, and
thus allows entry by a variety of common aphid predators, includng hemipterans,
dipterans and neuropterans (Hagen & VanDenBosch 1968, Moran 1993, Rojo & Marcos-
García 1997). Although some Asian galling aphids have evolved soldier-like morphs (Ito
1989) which protect against predators, the only species known to do so in North America
is Pemphigus obesinymphae (Moran 1993, Stern & Foster 1996, Foster & Rhoden 1998).
However, not only do populations of Tamalia coweni lack the ability to exclude predators
from their galls prior to enclosure (before the gall is fully formed and thus still open to
invasion), they seem to show an unusual tolerance for other galling aphids. Thus,

7
foundresses can either initiate galls of their own or migrate to a site occupied by another
foundress and communally occupy the gall formed there.
There is a well-documented history of competition and antagonistic behavior
among sympatric galling aphid species and even conspecific foundresses, which can
sometimes be severe enough to result in mortality (Whitham 1979, Aoki & Makino 1982,
Stern & Foster 1996, Inbar 1998). In contrast, T. coweni foundresses readily tolerate the
presence of other conspecific foundresses within their gall, as well as an inquiline
species, Tamalia inquilinus. This behavior is puzzling from an adaptive perspective,
because communal gall occupation appears to decrease per capita survival and
productivity (Miller 1998b).
Miller (1998b) proposed that this is a density-dependent effect, and that
“…communal gall occupation is foremost a function of foundress density in the absence
of competitive displacement” (p. 100). Inbar (1998) arrived at a similar conclusion.
Whether galling sites are truly limited is an open question; there are indications that the
significance of gall location on reproductive success (and therefore the number of optimal
galling sites) may be variable depending on the host and aphid species (Whitham 1978,
Burstein & Wool 1993). An alternative hypothesis for the communal behavior is that a
form of kin selection may be favoring the production of multi-foundress galls. This
hypothesis is supported by the possibility that multiple asexual generations and low
geographic dispersal distances create populations consisting of individuals who are
closely related and despite losses in per capita fitness the overall productivity of multi-
foundress galls is increased, thus potentially conferring an adaptive advantage at the
group level (Hamilton 1987, Miller 1998b, Bryden & Jansen 2010).

8
In essence, this hypothesis would imply that these aphids are behaving
cooperatively to enhance family-level fitness despite losses in personal fitness, that is,
they are acting as primitively social or eusocial organisms. This implication is not
unprecedented, as gall-making aphids in general are known to be one of the few groups
of clonal and/or haplodiploid taxa to be considered eusocial, although that distinction is
not applicable to all species or populations (Nowak et al. 2010). Here I review eusociality
and the closely related concept of kin selection to provide the appropriate context for
further examining the validity of this theory.
Eusociality and Kin Selection
The phenomenon of individual organisms exhibiting behavior which benefits
others but is often harmful to their own fitness (for example, a sterile soldier ant
defending a nest) was recognized by Darwin (1869) himself as a “special difficulty” for
the theory of evolution. However, he proposed an explanation, “This difficulty, while
appearing insuperable, is lessened, or as I believe, disappears, when it is remembered that
selection may be applied to the family as well as the individual, and may thus gain the
desired end” (Darwin 1869, p. 291).
Both Fisher (1914, 1930) and Haldane (1927, 1932, 1955) would later
elaborate on altruism (acts beneficial to others that come at a cost to the individual) and
the idea of inclusive fitness (where both the individual reproductive success and that of
their relatives is considered in evaluating Darwinian fitness). Expanding on their work,
Hamilton (1963, 1964) developed a mathematical model defining inclusive fitness,
producing “Hamilton’s rule” describing conditions favorable to cooperation which can be

9
expressed most simply as r >c/b, where c represents the cost (to the donor) of altruistic
behavior, b is the benefit gained by the recipient of the behavior, and r is a coefficient of
relatedness (Fletcher & Zwick 2006, Nowak et al. 2010).
In Hamilton’s model, cooperative or eusocial behavior should be favored
when r exceeds c/b, as the gain to the genotype as a whole outweighs the cost to the
individual animal acting as a donor. These conditions are most likely to be met in
populations of closely related individuals. Thus it is no surprise that the most frequent
and most well-documented examples in animals have come from insects, in particular
members of the order Hymenoptera which have haplodiploid sex determination, such as
ants, bees and wasps (Michener 1964, 1974; Wilson 1971, 1975; Lin & Michener 1972,
Chapman 1982, Holldobler & Wilson 1990, Ross & Matthews 1991, Itô 1993,
Linksvayer & Wade 2005) as well as aphids, which can have multiple
parthenogenetically produced generations within their populations (Itô 1984, Foster &
Northcutt 1994, Abbot et al. 2001).
Given this context, it appears plausible that these aphids, like populations of
other gall-forming species, cooperate to maximize group fitness. This would suggest that
the productivity of communal galls and the relatedness among gall cohabitants should
both be higher than average, which would promote such behavior. Productivity can be
measured directly, but there are a number of methods for determining relatedness,
discussed in the next section.

10
Molecular Genotyping Methodologies
One of the earliest methods for assessing genetic diversity utilized variable
number tandem repeats, or ‘minisatellites,’ 60-100 base pair regions of high variability
throughout the genome whose combinations are unique to each individual (Jeffreys et al.
1984, 1985, Nakamura 1987). The technique was enhanced by the discovery that
enzymatic amplification of these regions was possible using DNA polymerase and
specific oligonucleotide primers which allow a degree of selectivity in the amplification,
a technique called polymerase chain reaction or PCR (Jeffreys et al. 1998).
Refinements of these techniques have yielded a variety of similar methods
being developed, such as analysis of simple sequence repeats (SSR); “microsatellites,”
highly polymorphic 2-6 base pair DNA sequences (Goldstein 1995, Blouin et al. 1996,
Dakin & Avise 2004, Varela & Amos 2010), analysis of restriction fragment length
polymorphisms (RLFP), fragments of variable length produced by enzymatic cleavage of
DNA at specific sites in the genome which are also used in linkage and mapping studies
(Botstein et al. 1980, Paterson et al. 1988, Borgo et al. 1996, Wolf et al. 2000), random
amplified polymorphic DNA markers (RAPD), arbitrarily amplified sequences produced
by PCR using nonspecific primers (Williams et al. 1990, MacGowan 1993, Barbanera et
al. 2010), and amplified fragment length polymorphisms (AFLP), restriction-digested
DNA amplified using selective primer combinations (Vos et al. 1995, Vos & Kuiper
1997, Ren & Timpko 2001, Vuylsteke et al. 2007).
Most of these techniques have been successfully applied to analyses of genetic
variation in aphid populations (Carvalho et al. 1991, Fukatsu & Ishikawa 1994, Abbot
2001, Johnson et al. 2002). The AFLP technique has become increasingly popular

11
because it is fast, accurate, requires no prior knowledge of the sequences being amplified
and can be performed with small quantities of sample DNA. These advantages became
apparent quickly; and the AFLP method has become more commonplace. It has been
utilized for aphid populations in particular by Hawthorne and Via (2001) Braendele
(2005), Timm et al. (2005), Ritter et al. and Vorwerk & Forneck (2007), among others.
Because of its advantages over other methods and its previous use in similar contexts, the
AFLP method was chosen for this study.
The AFLP process consists of three principal components: enzymatic
digestion of genomic DNA using a combination of restriction enzymes, ligation of PCR
adaptors to the digest products, and amplification of the ligated products using DNA
polymerase and carefully chosen primers. The enzymes used in the first step are typically
EcoR1 and Mse1, a combination which produces fragments of optimal size while
simultaneously limiting the number of potential amplification products (Vos et al. 1995).
Because the sequences cut by these enzymes are known, the adaptor pairs are designed to
correspond to these sequences. The primers used in the amplification reactions extend
into the fragments themselves and only complementary regions are primed for
amplification. Typically there are two rounds of amplification, one (the “preslelective”
amplification) using a single-base extenstion into the fragment and the second (the
“slelective” amplification) using a two to four-base extenstion (Muller & Wolfenbarger
1999). The use of selective primers reduces the number of fragments amplified.
Amplification products were traditionally separated by gel electrophoresis, although the
use of fluorescently-labeled primers and capillary electrophoresis using automated
scoring software is becoming more common (Meudt & Clark 2007).

12
For this research, I used fluorescently labeled primers and capillary
electrophoresis. The specifics of the AFLP-PCR protocol are given in more detail in
chapter III.

13
CHAPTER III
MATERIALS AND METHODS
Sample Acquisition
Samples were taken on multiple dates in June-September 2007 from an
undeveloped area of northern California accessed via a logging road (N 40°, 2’24’’, W,
121° 36’25”, elevation 1350m, Figure 1). This locality has an abundance of
Arctostaphylos patula, which exhibit the late-blooming inflorescences characteristic of
higher-elevation populations, and also seem to be particularly susceptible to gall
induction on both leaves and inflorescences into late August and even September.
Galls were sampled haphazardly along atransect at approximately 5-meter
intervals. Galls were inspected to determine if they appeared intact (fully eclosed without
obvious apertures or indications of herbivory); galls which appeared to have been vacated
or damaged were not collected. Once a viable gall had been obtained on a particular
plant, no further samples were collected from the same plant. Galls were bagged and
transported to the Biology department at CSU, Chico, where they were stored at 4° C.
Collected galls were opened and examined individually under a dissecting
microscope, and numbers of foundresses and total offspring per gall were recorded. The
presence of inquilines and predators was also noted. Foundresses were rinsed in
deionized water and individually stored in salt buffer at 4°C. Foundresses from
communally occupied galls were assigned a prefix indicating the number of foundresses

14
Figure 1. Map of the sampling location. The enlarged area is Butte County.”X” indicates the sampling area.
(2X, 3X, etc.) numbered sequentially, assigned a suffix demarcating individual
foundresses (F1, F2, etc.), and set aside for use as samples in the ALFP-PCR reactions.
Ultimately, fifteen double-foundress galls (2X01-2X15) and one triple-foundress gall
(3X01) were profiled using the AFLP-PCR protocol described below.
Extraction of Genomic DNA
An Ultra UltraClean® Tissue & Cells DNA Isolation Kit was purchased from
MoBio laboratories, Inc. (http://www.mobio.com/tissue-cells-dna-isolation/ultraclean-

15
tissue-cells-dna-isolation-kit.html). Individual aphids were ground with sterile pestles in a
microcentrifuge tube, and then homogenized using a bead solution and vortex mixing at
high speed for 10 minutes. Supernatant containing suspended genominc DNA was
separated by centrifugation and an approximate volume of 400 µl was recovered. DNA
extracts were stored at -20°C until they could be used in AFLP-PCR reactions.
Restriction-Ligation Protocol
A small-genome AFLP kit including primers, AFLP core mix and adapter
pairs was purchased from Applied Biosystems (http://www.appliedbiosystems.com/
absite/us/en/home.html), and the manufacturer’s protocol was followed to optimize
products for subsequent analysis using an ABI PRISM® 310 Genetic Analyzer.
An enzyme master mix was prepared using 1 µl 10X T4 DNA ligase buffer
with ATP, 1.0 µl 0.5 M NaCl, 5 µl Bovine serum albumin (1 mg/ml), 10 units T4 DNA
ligase (.5ul), 1µl sterile water. This solution was stored on ice until it could be distributed
into individual reaction tubes. Five µl of extracted DNA was combined with 1 µl 10X t4
dna ligase ligase buffer, 1.0 µl 0.5 M NaCl, 0.5 µl Bovine serum albumin (1 mg/ml), 1 µl
of enzyme master mix, and 1.0 µl each of Mse1 and EcoR1 adaptor pairs. Prior to use,
adaptor pairs were annealed by heating at 95 °C for 5 minutes and allowed to cool to
room temperature. The mixture was then maintained at 37 °C for two hours using a
thermal cycler with a heated lid to allow the reaction to proceed. After the two hours 189
µl of 0.1X TE buffer was added. The restiriction-ligation products were stored at -20° C
for later use in amplification reactions.

16
Pre-selective Amplification Protocol
Four µl of the restriction-ligation product were combined with 0.5 µl each of
EcoR1 and Mse1 preselective primers and 15.0 µl AFLP core mix. Samples were loaded
into a thermal cycler and run through a cycle of 2 minutes at 72°C, 20 cycles of (20
seconds at 94°C, 30 seconds at 56°C, two minutes at 72°C) and were then held at 60°C
for 30 minutes.
Selective Amplification Protocol
Preliminary tests on single-foundress galls using varying primer combinations
(Miller, unpublished) determined that the primer combination Mse1-CAC and EcoR1-
ACA yielded the highest variability, and this was the combination used in the selective
amplifications.
A preparatory dilution was prepared with 10.0 µl of pre-selective
amplification product combined with 190.0 µl of 0.1X TE Buffer in a sterile 0.5 ml PCR
reaction tube. Dilutions were used immediately after preparation. The selective
amplification mix consisted of 3.0 µl diluted preselective amplification product, 1.0 µl
Mse1-CAC primer 1.0 µl fluorescently labeled EcoR1-ACA primer and 15.0 µl AFLP
core mix, which were combined in a 0.2 ml PCR reaction tube and run through a PCR
cycle of 2 minutes at 94°C, 10 decreasing temperature cycles of (20 seconds at 94°C, 30
seconds at 66-57°C, and 2 minutes at 72°C) 20 cycles of (20 seconds at 94°C, 30
seconds at 56°C, and 2 minutes at 72°C) and a 30 minute hold cycle at 60°C using a
thermal cycler with a heated lid. Products were stored at - 20°C.

17
To ensure products were free of extraneous primers, nucleotides, or other
impurities, a PCR purification kit was purchased from Qiagen (http://www.qiagen.com).
A binding buffer was used to cause DNA adsorbtion to a silica-gel membrane contained
in a spin column while impurities were separated by centrifugation. The DNA was then
eluted into sterile buffer solution. The final elution volume was 50 ul.
Product Analysis
Separation and sizing of the purified selective amplification products using
capillary electrophoresis was performed at the CSUPERB Microchemical Core Facility at
San Diego State University (http://www.sci.sdsu.edu/dnacore/sdsu_dnacore.html).
Samples were processed using an ABI PRISM® 310 Genetic Analyzer using POP-4™
polymer, and ROX-500 as a size standard.
Output from the genetic analyzer was processed using Peakscanner®
software, (appliedbiosystems.com). For all samples, ROX-500 was the size standard and
the sizing default analysis method was used. In accordance with the analyzer’s
capabilities (single base pair detection below 250 bp, 2bp detection above 250) fragments
from 100-250 base pairs were scored at 1 bp intervals and fragments from 250-500 bp
were recorded at 2 bp intervals. Fragment sizes were recorded at their nearest integer
value, and a binary matrix was constructed with products scored as either present (1) or
absent (0) for each individual.
Data Analysis
To determine the similarity between the AFLP profiles produced by different
individuals, genetic distance (GD) was calculated according to the formula:

18
Dxy = 1 – [2Nxy/(Nx + Ny)]
where Nx is the number of loci detected for individual x, Ny is the number for individual
y, and Nxy is the number that individuals x and y have in common (Nei & Lei 1979, Ren
& Timko 2001). This formula produces values from 1 to 0, where 1 represents the
maximum possible distance between individuals (Nxy=0) and 0 represents the maximum
homology between individuals, where 2Nxy = (Nx + Ny). GD values were calculated for
intra-gall pairs (individuals from the same gall) and all possible inter-gall pairs
(individuals from different galls).
The program PAUP (Phylogenetic Analysis Using parsimony, Version 4.0)
was used to compare the fragment profiles from all individuals and GD values were
compared using the program R, version 2.14.1 (http://www.r-project.org).

19
CHAPTER IV
RESULTS AND DISCUSSION
Frequency of Gall Cohabitation and Gall Productivity
A total of 375 galls were examined, of which 43 were found to be
communally occupied. Among the communally occupied galls, double-foundress galls
were the most common, followed by triple-foundress galls. An equal number of
quadruple- and quintuple-foundress galls were found. No galls were found with more
than five foundresses. Results from the gall dissections are summarized in Table 1.
Table 1. Numbers of single and multi-foundress galls and numbers of offspring per gall. Gall type (# of foundresses) # of galls Percentage Offspring per gall, mean
Total Galls Examined 375 - - Single (1X) 332 89% 20.33 ± 11.4 Double (2X) 24 6% 25.58 ± 14.9 Triple (3X) 11 3% 34.00 ± 14.9 Quadruple (4X) 4 1% 32.33 ± 12.2 Quintuple (5X) 4 1% 31.00 ± 6.0 Total communal galls 43 11% 27.18 ± 15.0 *Note: galls with zero offspring or signs of predation were excluded from this calculation.
The number of offspring per gall was highly variable, with a number of galls
having one or multiple foundresses present with no offspring, and the maximum number
for any gall being 79, in one of the quintuple-foundress galls. A number of galls were
found to contain predators, and because it could not be determined how many of the

20
occupants were consumed prior to dissection, these galls were not included in the
analysis of productivity. Single-foundress galls had an average of roughly 20 offspring
per gall, while communally occupied galls had an average of approximately 31. Triple-
foundress galls had the highest overall productivity with an average of 34 offspring per
gall (Figure 2).
Figure 2. Average offspring per gall vs. number of foundresses per gall. Blue = per
gall. Red= per capita (estimated). Brackets represent standard error.
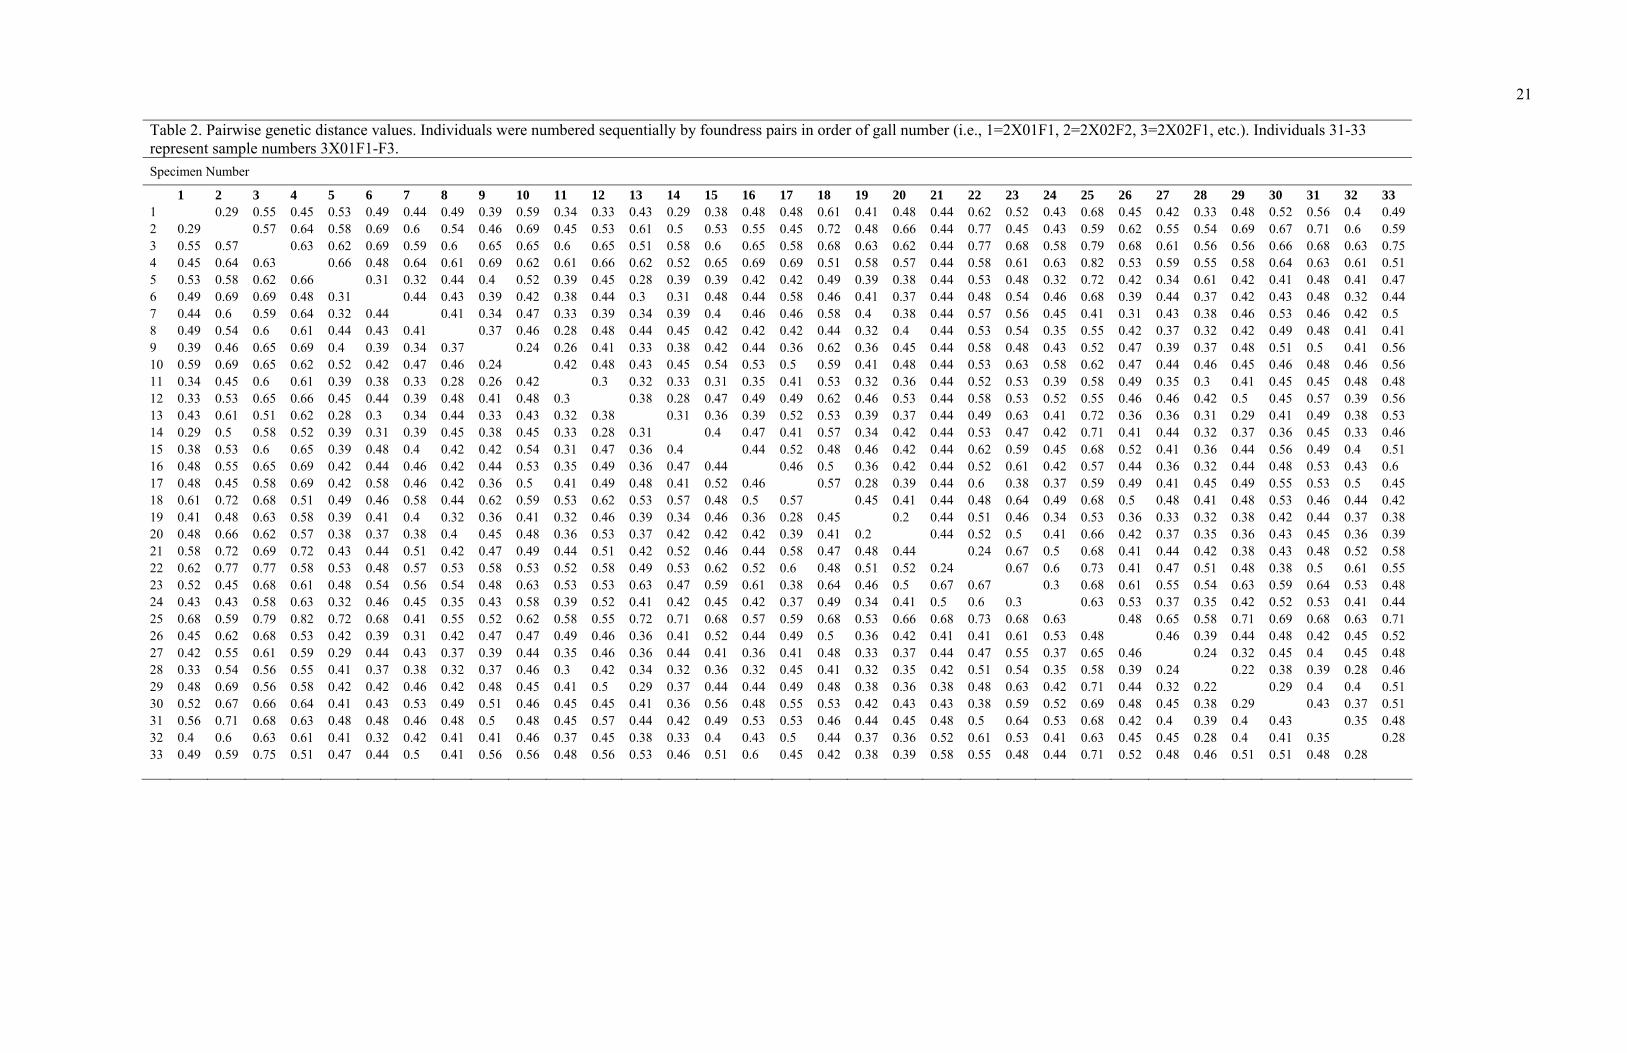
Genetic Distance Values
The Genetic Distance (GD) values calculated for all individual pairs are
shown in Table 2. Mean GD between all foundresses within the sample group was
calculated to be 0.49. This value was consistent whether evaluated on a per-gall or per-
21
Table 2. Pairwise genetic distance values. Individuals were numbered sequentially by foundress pairs in order of gall number (i.e., 1=2X01F1, 2=2X02F2, 3=2X02F1, etc.). Individuals 31-33 represent sample numbers 3X01F1-F3.
Specimen Number
1 2 3 4 5 6 7 8 9 10 11 12 13 14 15 16 17 18 19 20 21 22 23 24 25 26 27 28 29 30 31 32 33 1 0.29 0.55 0.45 0.53 0.49 0.44 0.49 0.39 0.59 0.34 0.33 0.43 0.29 0.38 0.48 0.48 0.61 0.41 0.48 0.44 0.62 0.52 0.43 0.68 0.45 0.42 0.33 0.48 0.52 0.56 0.4 0.49 2 0.29 0.57 0.64 0.58 0.69 0.6 0.54 0.46 0.69 0.45 0.53 0.61 0.5 0.53 0.55 0.45 0.72 0.48 0.66 0.44 0.77 0.45 0.43 0.59 0.62 0.55 0.54 0.69 0.67 0.71 0.6 0.59 3 0.55 0.57 0.63 0.62 0.69 0.59 0.6 0.65 0.65 0.6 0.65 0.51 0.58 0.6 0.65 0.58 0.68 0.63 0.62 0.44 0.77 0.68 0.58 0.79 0.68 0.61 0.56 0.56 0.66 0.68 0.63 0.75 4 0.45 0.64 0.63 0.66 0.48 0.64 0.61 0.69 0.62 0.61 0.66 0.62 0.52 0.65 0.69 0.69 0.51 0.58 0.57 0.44 0.58 0.61 0.63 0.82 0.53 0.59 0.55 0.58 0.64 0.63 0.61 0.51 5 0.53 0.58 0.62 0.66 0.31 0.32 0.44 0.4 0.52 0.39 0.45 0.28 0.39 0.39 0.42 0.42 0.49 0.39 0.38 0.44 0.53 0.48 0.32 0.72 0.42 0.34 0.61 0.42 0.41 0.48 0.41 0.47 6 0.49 0.69 0.69 0.48 0.31 0.44 0.43 0.39 0.42 0.38 0.44 0.3 0.31 0.48 0.44 0.58 0.46 0.41 0.37 0.44 0.48 0.54 0.46 0.68 0.39 0.44 0.37 0.42 0.43 0.48 0.32 0.44 7 0.44 0.6 0.59 0.64 0.32 0.44 0.41 0.34 0.47 0.33 0.39 0.34 0.39 0.4 0.46 0.46 0.58 0.4 0.38 0.44 0.57 0.56 0.45 0.41 0.31 0.43 0.38 0.46 0.53 0.46 0.42 0.5 8 0.49 0.54 0.6 0.61 0.44 0.43 0.41 0.37 0.46 0.28 0.48 0.44 0.45 0.42 0.42 0.42 0.44 0.32 0.4 0.44 0.53 0.54 0.35 0.55 0.42 0.37 0.32 0.42 0.49 0.48 0.41 0.41 9 0.39 0.46 0.65 0.69 0.4 0.39 0.34 0.37 0.24 0.26 0.41 0.33 0.38 0.42 0.44 0.36 0.62 0.36 0.45 0.44 0.58 0.48 0.43 0.52 0.47 0.39 0.37 0.48 0.51 0.5 0.41 0.56 10 0.59 0.69 0.65 0.62 0.52 0.42 0.47 0.46 0.24 0.42 0.48 0.43 0.45 0.54 0.53 0.5 0.59 0.41 0.48 0.44 0.53 0.63 0.58 0.62 0.47 0.44 0.46 0.45 0.46 0.48 0.46 0.56 11 0.34 0.45 0.6 0.61 0.39 0.38 0.33 0.28 0.26 0.42 0.3 0.32 0.33 0.31 0.35 0.41 0.53 0.32 0.36 0.44 0.52 0.53 0.39 0.58 0.49 0.35 0.3 0.41 0.45 0.45 0.48 0.48 12 0.33 0.53 0.65 0.66 0.45 0.44 0.39 0.48 0.41 0.48 0.3 0.38 0.28 0.47 0.49 0.49 0.62 0.46 0.53 0.44 0.58 0.53 0.52 0.55 0.46 0.46 0.42 0.5 0.45 0.57 0.39 0.56 13 0.43 0.61 0.51 0.62 0.28 0.3 0.34 0.44 0.33 0.43 0.32 0.38 0.31 0.36 0.39 0.52 0.53 0.39 0.37 0.44 0.49 0.63 0.41 0.72 0.36 0.36 0.31 0.29 0.41 0.49 0.38 0.53 14 0.29 0.5 0.58 0.52 0.39 0.31 0.39 0.45 0.38 0.45 0.33 0.28 0.31 0.4 0.47 0.41 0.57 0.34 0.42 0.44 0.53 0.47 0.42 0.71 0.41 0.44 0.32 0.37 0.36 0.45 0.33 0.46 15 0.38 0.53 0.6 0.65 0.39 0.48 0.4 0.42 0.42 0.54 0.31 0.47 0.36 0.4 0.44 0.52 0.48 0.46 0.42 0.44 0.62 0.59 0.45 0.68 0.52 0.41 0.36 0.44 0.56 0.49 0.4 0.51 16 0.48 0.55 0.65 0.69 0.42 0.44 0.46 0.42 0.44 0.53 0.35 0.49 0.36 0.47 0.44 0.46 0.5 0.36 0.42 0.44 0.52 0.61 0.42 0.57 0.44 0.36 0.32 0.44 0.48 0.53 0.43 0.6 17 0.48 0.45 0.58 0.69 0.42 0.58 0.46 0.42 0.36 0.5 0.41 0.49 0.48 0.41 0.52 0.46 0.57 0.28 0.39 0.44 0.6 0.38 0.37 0.59 0.49 0.41 0.45 0.49 0.55 0.53 0.5 0.45 18 0.61 0.72 0.68 0.51 0.49 0.46 0.58 0.44 0.62 0.59 0.53 0.62 0.53 0.57 0.48 0.5 0.57 0.45 0.41 0.44 0.48 0.64 0.49 0.68 0.5 0.48 0.41 0.48 0.53 0.46 0.44 0.42 19 0.41 0.48 0.63 0.58 0.39 0.41 0.4 0.32 0.36 0.41 0.32 0.46 0.39 0.34 0.46 0.36 0.28 0.45 0.2 0.44 0.51 0.46 0.34 0.53 0.36 0.33 0.32 0.38 0.42 0.44 0.37 0.38 20 0.48 0.66 0.62 0.57 0.38 0.37 0.38 0.4 0.45 0.48 0.36 0.53 0.37 0.42 0.42 0.42 0.39 0.41 0.2 0.44 0.52 0.5 0.41 0.66 0.42 0.37 0.35 0.36 0.43 0.45 0.36 0.39 21 0.58 0.72 0.69 0.72 0.43 0.44 0.51 0.42 0.47 0.49 0.44 0.51 0.42 0.52 0.46 0.44 0.58 0.47 0.48 0.44 0.24 0.67 0.5 0.68 0.41 0.44 0.42 0.38 0.43 0.48 0.52 0.58 22 0.62 0.77 0.77 0.58 0.53 0.48 0.57 0.53 0.58 0.53 0.52 0.58 0.49 0.53 0.62 0.52 0.6 0.48 0.51 0.52 0.24 0.67 0.6 0.73 0.41 0.47 0.51 0.48 0.38 0.5 0.61 0.55 23 0.52 0.45 0.68 0.61 0.48 0.54 0.56 0.54 0.48 0.63 0.53 0.53 0.63 0.47 0.59 0.61 0.38 0.64 0.46 0.5 0.67 0.67 0.3 0.68 0.61 0.55 0.54 0.63 0.59 0.64 0.53 0.48 24 0.43 0.43 0.58 0.63 0.32 0.46 0.45 0.35 0.43 0.58 0.39 0.52 0.41 0.42 0.45 0.42 0.37 0.49 0.34 0.41 0.5 0.6 0.3 0.63 0.53 0.37 0.35 0.42 0.52 0.53 0.41 0.44 25 0.68 0.59 0.79 0.82 0.72 0.68 0.41 0.55 0.52 0.62 0.58 0.55 0.72 0.71 0.68 0.57 0.59 0.68 0.53 0.66 0.68 0.73 0.68 0.63 0.48 0.65 0.58 0.71 0.69 0.68 0.63 0.71 26 0.45 0.62 0.68 0.53 0.42 0.39 0.31 0.42 0.47 0.47 0.49 0.46 0.36 0.41 0.52 0.44 0.49 0.5 0.36 0.42 0.41 0.41 0.61 0.53 0.48 0.46 0.39 0.44 0.48 0.42 0.45 0.52 27 0.42 0.55 0.61 0.59 0.29 0.44 0.43 0.37 0.39 0.44 0.35 0.46 0.36 0.44 0.41 0.36 0.41 0.48 0.33 0.37 0.44 0.47 0.55 0.37 0.65 0.46 0.24 0.32 0.45 0.4 0.45 0.48 28 0.33 0.54 0.56 0.55 0.41 0.37 0.38 0.32 0.37 0.46 0.3 0.42 0.34 0.32 0.36 0.32 0.45 0.41 0.32 0.35 0.42 0.51 0.54 0.35 0.58 0.39 0.24 0.22 0.38 0.39 0.28 0.46 29 0.48 0.69 0.56 0.58 0.42 0.42 0.46 0.42 0.48 0.45 0.41 0.5 0.29 0.37 0.44 0.44 0.49 0.48 0.38 0.36 0.38 0.48 0.63 0.42 0.71 0.44 0.32 0.22 0.29 0.4 0.4 0.51 30 0.52 0.67 0.66 0.64 0.41 0.43 0.53 0.49 0.51 0.46 0.45 0.45 0.41 0.36 0.56 0.48 0.55 0.53 0.42 0.43 0.43 0.38 0.59 0.52 0.69 0.48 0.45 0.38 0.29 0.43 0.37 0.51 31 0.56 0.71 0.68 0.63 0.48 0.48 0.46 0.48 0.5 0.48 0.45 0.57 0.44 0.42 0.49 0.53 0.53 0.46 0.44 0.45 0.48 0.5 0.64 0.53 0.68 0.42 0.4 0.39 0.4 0.43 0.35 0.48 32 0.4 0.6 0.63 0.61 0.41 0.32 0.42 0.41 0.41 0.46 0.37 0.45 0.38 0.33 0.4 0.43 0.5 0.44 0.37 0.36 0.52 0.61 0.53 0.41 0.63 0.45 0.45 0.28 0.4 0.41 0.35 0.28 33 0.49 0.59 0.75 0.51 0.47 0.44 0.5 0.41 0.56 0.56 0.48 0.56 0.53 0.46 0.51 0.6 0.45 0.42 0.38 0.39 0.58 0.55 0.48 0.44 0.71 0.52 0.48 0.46 0.51 0.51 0.48 0.28

foundress basis (Table 3). The mean GD between pairs of co-habiting foundresses was
found to be 0.35. The difference in GD values between the population average (extra-gall
pairs) and the average for gall cohabitants was statistically significant (Paired t-test,
t = 5.77, df = 17, p ≤ .001). The GD data for extra- and inter-gall pairs are shown in
Figure 3.
A total of 152 AFLP-PCR products were detected in the 100-500 bp range
(Figure 4). Two products were present throughout the entire population, the first in the
102 bp range and the second in the 350-bp range. Maxiumum likelihood parsimony
analysis using PAUP produced a total of 31 unrooted best-fit trees using this data. All
characters were equally weighted and there were a total of 29 non-informative characters.
22
Fragment Profiles and Parsimony Analysis
Table 3. Average GD values per gall. F1 and F2 represent the mean value for all pairwise comparisons (n=17) for foundress1 and foundress 2, respectively. Gall Average is the mean of F1 and F2, and F1-F2 GD is the value calculated between foundress 1 and foundress 2 from the same gall. For the triple-foundress gall (3X01), each possible pair (F1-F2, F1-F3 and F2-F3) was evaluated separately. Gall F1 F2 Gall Average F1-F2 GD 2X01 0.4729 0.5868 0.5298 0.2889 2X02 0.6340 0.6097 0.6218 0.6279 2X03 0.4506 0.4556 0.4531 0.3134 2X04 0.4501 0.4423 0.4462 0.4118 2X05 0.4485 0.5123 0.4804 0.2424 2X06 0.4126 0.4872 0.4499 0.3000 2X07 0.4312 0.4278 0.4296 0.3077 2X08 0.4746 0.4727 0.4736 0.4367 2X09 0.4780 0.5253 0.5017 0.5714 2X10 0.4123 0.4441 0.4282 0.1951 2X11 0.5079 0.5561 0.5320 0.2449 2X12 0.5611 0.4587 0.5010 0.3030 2X13 0.6458 0.4627 0.5542 0.4783 2X14 0.4388 0.4059 0.4223 0.2368 2X15 0.4516 0.4917 0.4717 0.2877 3X01(F1-2) 0.5063 0.4468 0.4766 0.3478 3X01(F1-3) 0.5063 0.5110 0.50863X01(F2-3) 0.4468 0.5109 0.4789Average 0.4850 0.4893 0.4871
0.4792 0.2791 0.3529

23
Figure 3. Boxplot representing mean GD gall; intra-Gall values. Extra-gall pairs = pairs not sharing the same pairs = pairs from the same gall. The dark central line represents the mean, the box is the upper and lower quartile, the whiskers represent minimum and maximum values and the circle indicates a statistical outlier.
For 9 out of the 16 communal galls examined, the cohabitants were determined to have
the greatest amount of genetic similarity with their gall mate (Figure 5).
Discussion
The results of the genetic distance analysis indicate that relatedness among
gall cohabitants is highly variable on a per-gall basis but is significantly higher overall
than between non-cohabitants. Parsimony analysis of the data matrix produced by the
AFLP-PCR profiles revealed that in roughly half of the communal galls studied the
foundresses with the most similar profiles were found within the same gall. Hence in the
remaining galls combinations of two or more genotypes occur, implying no necessary
effect of relatedness on galling cohabitation. Other studies on galling aphids have also

24
Figure 4. Fragment profiles collected for all individuals (n=33) from AFLP-PCR reactions. White bands indicate the presence of a product. Products are arranged in descending order from 100-500bp.
mixing of genotypes in similar proportions, resulting from both intra- and inter-species
cohabitation (Abbot et al. 2001, Wang et al. 2008).
Because only one species was examined in this study, and because only the
final gall-inducing generation is parthenogenetically produced, the highly synonymous
intra-gall pairs may represent clones deposited by a second-generation female. The
resulting larvae either co-founded the gall or joined occupants in existing, early-phase
galls. The less-parsimonius pairs would then represent mixing of two different clones.
The fact that even the highly parsimonious pairs showed some genetic variation does not
necessarily refute this hypothesis, as intraclonal genetic variation has been known to
occur in aphids and high-resolution molecular markers such as AFLPs are able to detect
these differences, which can be attributed to both random mutations and the presence of

25
Figure 5. Maximum parsimony tree for foundresses from communally occupied galls at the study site.
symbiotic bacteria (Vorwerk 2007, Vorwerk & Forneck 2007, Loxdale 2008, Monti et al.
2012).
The high degree of relatedness between these putatively-clonal-pairs
contributed to the significant difference in GD values for intra-gall pairs and extra-gall
pairs (Table 3, Figure 3). It is noteworthy that the difference was so pronounced despite
the inclusion of a relatively equal number of non-parsimonious pairs. This is important
because it suggests that despite the relatively high frequency of apparently unrelated

26
foundresses sharing galls, the similarity between the closely rated individuals is high
enough that overall, the average relatedness between gall co-habitants is significantly
greater than relatedness between non-cohabiting individuals.
The productivity of communally occupied galls was of also of particular
significance in this study. Communally occupied galls with no increase in productivity
relative to single-foundress galls would suggest a net loss in reproductive fitness
regardless of relatedness between gall-mates, because the numbers of offspring are likely
to represent a combination of offspring from multiple foundresses rather than just a single
foundress. Our findings indicate that this is not the case, and that communally occupied
galls are more productive than single-foundress galls. However, the increase in numbers
of offspring produced are not linear multiples of foundress number (in other words, a
double-foundress gall does not double the productivity of a single-foundress gall), and so
per capita reproduction is still reduced. These results are in accordance with Miller’s
experimental data for this species (1998b).
It is possible that this reduction in per capita fitness selects against
cohabitation in larger numbers. For example, double-foundress galls contained, on
average, 6 more offspring per gall than single-foundress galls, a 30% increase. Triple-
foundress galls, contained, on average, 14 more offspring per gall than single-foundress
galls, a 70% increase. But the number of offspring per individual, assuming equal
reproduction among all foundresses, would decrease from 20 to 13 to 11 in 1X, 2X and
3X galls, respectively. As the average productivity for 4X and 5X galls was no higher
than that of 3X galls (Fig. 5), it appears that per capita fitness diminishes with each
additional foundress (it should be noted that because of the low number of 4X and 5X

27
galls found, these estimates may be less reliable than those for the other groups). These
diminishing returns may explain why double-foundress galls, though less productive than
triple, quadruple or quintuple-foundress galls, were far more common, totaling more than
half of the total communal galls found.
The fact that per capita losses seem to outpace group gains was not
unexpected in light of Miller’s (1998b) previous results. It should be remembered that in
assessing cooperative behavior, a high degree of relatedness may mitigate imbalances in
cost/benefit ratio at the individual level. As noted earlier in the discussion, the relatedness
among communal gall occupants is higher than the population average, which is largely
due to the occurrence of a number of closely related pairs of gall occupants. In these
pairs, the genetic similarity between occupants is so high that, from a genotypic
perspective, the decrease in per capita productivity is likely to be less relevant than the
overall increased productivity per gall.
These results are in accordance with what would be expected if kin selection
is truly occurring (i.e., there should be increased productivity in communally occupied
galls, and a high level of relatedness among gall co-occupants). The combination of
increased overall productivity and higher than average genetic relatedness in communal
galls strongly supports the hypothesis that some form of kin selection is occurring in this
population, although it is difficult to say whether this behavior is highly adaptive or
simply a viable enough alternative to non-collaborative behavior that it is not selected
against. The relatively low occurrence of communal galls (11% of the sample population)
suggests that the latter may be the case. As noted By Miller (1998b) and Inbar (1998), a
limited number of ideal galling sites may precipitate communal galling even in the

28
absence of kin selection. Nevertheless, the fact that this behavior has shown to be
potentially beneficial at a group level means there is little selective pressure against
cohabitation, and thus the non-aggressive interactions among Tamalia foundresses can be
explained: as long as they are cohabiting with their own clone-mates or close kin in
sufficient numbers, communal galling is at least somewhat beneficial and thus engaging
in costly defensive or territorial behavior would ultimately be counterproductive. A
consequence of this is that the presence of intraspecific “invaders” of different genotypes
is tolerated.
Suggestions for Future Studies
This mixing of various lineages within the same gall may be relevant to the
production of soldiers, which are truly altruistic (i.e., non-reproductives who act to
enhance the fitness of their colony rather than produce offspring of their own) and are
indicative of eusociality in aphid colonies. In describing the evolution of altruism in
another North American subfamily, the Pemphiginae, Abbot (2009), noted that “the
factors that favored intraspecific competition and clonal admixture…may have also acted
to predispose lineages to soldier production” (p. 2688). The . . . recent discovery of
soldier-like morphs in other northern California Tamalia populations (Donald G. Miller,
personal communication; unreferenced.) may indicate that a similar process is occurring
in this species as well, and the population observed in this study represents a transitional
period from solitary to cooperative, and eventually eusocial, behavior.
This would represent an opportunity for further studies, as it remains largely
unknown why some aphid species evolve higher levels of sociality while otherwise

29
similar species do not. The status quo in current populations may favor some degree of
cohabitation, but a trend towards higher gall invasion rates by competing lineages or
species, or the presence of soldier castes, which have been seen to deter both predation
and/or cohabitation, depending on the circumstance, has the potential to alter this
dynamic. It is difficult to predict these developments or their consequences, but
knowledge of the current population dynamics provided by these results can provide a
frame of reference to allow a comparison between present and future studies, and thus if
social behavior does evolve in this species the ecological factors which helped produce it
would be more easily determined.
Along those lines, future studies should be designed with a careful eye
towards any significant morphological or behavioral deviations in foundresses or their
offspring. For example, Uematsu et al. (2007) found that they could induce defensive
behavior in first-instar offspring of the Japanese galling aphid Quardratus yoshinomiyai
by exposing them to predaceous caterpillars in test arenas. A similar study could be
conducted using Tamalia soldier-like morphs to observe if they are capable (or inclined)
to display defensive behavior. Changes in communal galling rates or fecundity would
also be a significant development. These could be easily observed by random sampling
and gall dissection. An assessment of parsimony among gall-mates in galls with higher
numbers of foundresses using methodology similar to this study is feasible, although
given the relatively rare occurrence of galls with more than two foundresses, a large
number of galls would likely need to be processed in order to attain a reasonable sample
size. Even a simple repetition of the current study would be informative, as there is little
information about the year-to year fluctuations in galling behavior.

30
Conclusions
As I found a higher than average degree of relatedness among communal gall
occupants produced in large part by a number of highly parsimonious intra-gall pairs, and
an increase in productivity in communally inhabited galls as measured by numbers of
viable offspring, the results of this study strongly suggest that kin selection is a plausible
explanation for the occurrence of communal gall occupation in this species. Despite the
apparent benefits of communal occupation, however, there also appear to be factors
limiting the overall frequency of cohabitation, namely a high rate of invasion by
individuals of differing genotypes and diminishing reproductive efficiency in galls
inhabited by three or more foundresses. The circumstances of communal gall occupation
in this species are similar to those found in other aphid species which have evolved
eusociality, and thus future studies should emphasize the potential for social interactions
in these aphids, specifically the origins of altruistic soldier castes, precursors of which
have already been observed in similar populations in California. This species may present
an opportunity to study the transition from solitary to social behavior as it occurs, and
thus answer several unresolved questions regarding the complex nature of the evolution
of altruism and sociality in these insects.

CITED REFERENCES

32
CITED REFERENCES
Abbot P. 2001. Individual and population variation in invertebrates revealed by Inter-simple Sequence Repeats (ISSRs). J Insect Sci.1.8. [Internet]. [cited 2001, August 03]; Available from http://www.insectscience.org/1.8
Abbot P, Withgott JH, Moran N. 2001. Genetic conflict and conditional altruism in social aphid colonies. Proc. Nat. Acad. Sci. 98(21):12068-12071.
Abbot, P. 2009. On the evolution of dispersal and altruism in aphids. Evolution. 63(10):2687-2696.
Aoki S, Makino S. 1982. Gall usurpation and lethal fighting among fundatrices of the aphid Epipemphigus niisimae (Homoptera, Pemphigidae). Konty. (45):276-282.
Austin, CR, Short, RV, editors. 1985. Reproduction in mammals. Volume 4, Reproductive fitness. 2nd ed. Cambridge (MA): Cambridge University Press. 256 p.
Baker AC. 1920. Bulletin of the United States Department of Agriculture. 826:3.
Baker A.C. 1923. Check list of the insects of Connecticut. Part IV. The Hemiptera or sucking insects of Connnecticut. Subfamily Aphidinae – Tribe Callipterini. In: Britton WE, editor. Bulletin of the Conn. Geol. Nat. Hist. Surv. 34:271 290.
Barbanera F, Pergams ORW, Guerrinia M, Forcinaa G, Panayidesc P, Dinia F. 2010. Genetic consequences of intensive management in game birds. Biol. Conserv. 143(5):1259–1268.
Blouin MS, Parsons M, Lacaille M, Lotz S. 1996. Use of microsatellite loci to classify individuals by relatedness. Mol Ecol. 5(3):393–401.
Blackman RL.1994. The simplification of aphid terminology. Eur J Entomol. 91:139-141.
Borgo R, Souty-Grosset C, Bouchon D, Gomot L. 1996. PCR-RFLP Analysis of mitochondrial DNA for identification of snail meat species. J Food Sci. 61(1):1-4.
Botstein, D, White RL, Skolnick M, Davis RW. 1980. Construction of a genetic linkage map in man using restriction fragment length polymorphisms. Am J Hum Genet. 32(3):314–331.

33
Braendle C, Caillaud MC, Stern DL. 2005. Genetic mapping of aphicarus – a sex-linked locus controlling a wing polymorphism in the pea aphid (Acyrthosiphon pisum). Heredity. 94(4):435-42.
Brinkman B. 1991. Population studies on selected AMP-FLPs and their use in the investigation of mixtures of body fluids. Crime Lab Digest. 18:153-155.
Bryden J, Jansen VAA. 2010. The impact of clonal mixing on the evolution of social behaviour in aphids. Proc. R. Soc. B 277:1651-1657.
Burstein M, Wool D. 1993. Gall aphids do not select optimal galling sites (Smynthurodes betae; Pemphigidae). Ecol. Entomol. 18:155-164.
Carvalho GR, Maclean N, Wratten SD, Carter RE, Thurston JP. 1991. Differentiation of aphid clones using DNA fingerprints from individual aphids. Proc. R. Soc. Lond. B. 243(1307):109-114.
Chapman RF. 1982. The insects: structure and function. Cambridge (MA): Harvard University Press. 919 p.
Cockerell TDA. 1905. A gall on bearberry (Arctostaphylos). Can Entomol. 37(11):392.
Cowen JH 1895. In: Gillette CP, Baker CF, editors. A preliminary list of the Hemiptera of Colorado. Bulletin of the Colorado State University Agricultural Experiment Station. 31:118.
Darwin C. 1869. On the origin of species. 5th ed. London (BC): John Murray, 502 p.
Dakin, EE, Avise JC. 2004. Microsatellite null alleles in parentage analysis. Heredity. 93(5):504–509.
Davidson WM. 1911. Two new aphids from California. J Econ Entomol. 4:559 562.
Dixon AFG. 1985. Aphid ecology. Blackie, Glasgow, 157 p.
Fisher RA. 1914. Some hopes of a eugenist. Eugenics Review 5:309-315.
Fisher RA. 1930. The genetical theory of natural selection (2nd ed.) Dover (NY).
Fletcher JA, Zwick M. 2006. Unifying the theories of inclusive fitness and reciprocal altruism. Amer Nat. 168(2):252-262.
Foster WA, Northcutt PK. 1994. Galls and the evolution of social behavior in aphids. Systematics Association. 49:161-182.
Foster WA, Rhoden PK.1998. Soldiers effectively defend aphid colonies against predators in the field. Anim Behav. 55(3):761-5.

34
Fukatsu T, Ishikawa H. 1994. Differentiation of aphid clones by arbitrarily primed polymerase chain reaction (AP-PCR) DNA fingerprinting. Mol Ecol. 3(3):187-192.
Gillette CP 1909. Phyllaphis coweni Ckll. Can Entomol. 41:41-45.
Gillette CP, Palmer D. 1931. Ann. Entomol. Soc. Am. 24(4):845, 847.
Goldstein DB, Linares AR, Cavalli-Sforza LL, Feldman MW. 1995. An avaluation of genetic distances for use with microsatellite loci. Genetics. 139(1):463-471.
Haldnae, JBS 1927. Possible worlds and other essays. London: Chatto and Windus. 312 p.
Haldane JBS. 1932 The causes of evolution, London: Longmans. 235 p.
Haldane JBS. 1955. Population genetics. New Biology.18:34-51.
Hamilton, WD. 1963. The evolution of altruistic behavior. Am. Nat. 97(896):354-356.
Hamilton WD. 1964. The genetical evolution of social behaviour. I. J. Theor. Biol. 7:1-16.
Hamilton, WD. 1972. Altruism and related phenomena, mainly in the social insects’, Annu. Rev. Ecol. and Syst. 3:193-232.
Hamilton WD. 1987. Kinship, recognition and disease: constraints of social evolution. In; Ito Y, Brown JL, Kikkawa K, editors. Animal societies: theories and facts. Tokyo (Japan) Scientific Societies Press: 1-102.
Hagen KS. VanDenBosch R. 1968. Impact of pathogens, parasites, and predators on aphids. Ann Rev of Entomol. 13:325-38.
Hawthorne DJ, Via S. 2001. Genetic linkage of ecological specialization and reproductive isolation in pea aphids. Nature. 412:904-907.
Holland BR. Clarke AC. Meudt HM. 2008. Optimizing automated AFLP scoring parameters to improve phylogenetic resolution. Syst Biol. 57 (3):347-366.
Hölldobler B, Wilson EO. 1990. The Ants. Cambridge (MA): Belknap Press.732 p.
Inbar M. 1998. Competition, territoriality, and maternal defense in a gall-forming aphid. Ethol. Ecol. Evol. 10:159-170.
Itô Y. 1989. The evolutionary biology of sterile soldiers in aphids. Trends Ecol Evol. 4(3):69-73.

35
Itô Y. 1993. Behaviour and social evolution of wasps: the communal aggregation hypothesis. USA: Oxford University Press.
Jeffreys AJ, Wilson V, Thein SW. 1984. Hypervariable 'minisatellite' regions in human DNA. Nature 314:67-73.
Jeffreys AJ, Brookfield FY, Semeonoff R. 1985. Positive identification of an immigration test-case using human DNA fingerprints. Nature 317:818-819.
Jeffreys AJ, Wilson V. Neumann R, Keyte J. 1988. Amplification of human minisatellites by the polymerase chain reaction: towards DNA fingerprinting of single cells. Nucleic Acids Res. 16(23):10953-10971.
Johnson PC, Whitfield JA, Foster WA, Amos W. 2002. Clonal mixing in the soldier-producing aphid Pemphigus spyrothecae (Hemiptera: Aphididae). Mol Ecol. 2002 Aug; 11(8):1525-31.
Jonas D, Meyer HGW, Matthes P, Hartung D, Jahn B, Daschner FD, Jansen B. 2000. Comparative evaluation of three different genotyping methods for investigation of nosocomial outbreaks of Legionnaires' disease in hospitals. J. Clin. Microbiol. 38:2284-2291.
Latreille PA. 1802. Histoire naturelle, générale et particulière des crustacés et des insectes. Tome troisième, F. Dufart, Paris 467 pp.
Lin N, Michener CD.1972. Evolution of sociality in insects. Q. Rev. Biol. 47:131-159.
Linksvayer TA, Wade MJ. 2005. The evolutionary origin and elaboration of sociality in the aculeate Hymenoptera: maternal effects, sib-social effects and heterochrony. Q. Rev. Biol. 80:317-336.
Lynch M, Milligan BG. 1994. Analysis of population genetic structure with RAPD markers. Mol. Ecol. 3:91-99.
Loxdale HD. 2008. The nature and reality of the aphid clone: genetic variation, adaptation and evolution. Agricult Forest Entomol. 10(2):81-90.
Macgowan AP, O'donaghue K, Nicholls S, Mclauchlin J, Bennett PM, Reeves DS. 1993. Typing of Listeria spp. by random amplified polymorphic DNA (RAPD) analysis J. Med Microbiol. 38:322-327.
Mani, M.S. 1964. Ecology of plant galls. The Hague: Dr. W. Junk Publishers. 434 p.
Meudt HM, Clarke AC. 2007. Almost forgotten or latest practice? AFLP applications, analyses and advances. Trends Plant Sci. 12(3):106-17.

36
Michener CD. 1964. Reproductive efficiency in relation to colony size in hymenopterous societies. Insect Soc. 11:317-341.
Michener CD. 1974. The social behavior of the bees. Cambridge (MA): Belknap Press. 418 p.
Miyazaki M. 1987. Morphs and morphs of aphids. In: Minks AK, Harrewijn P, editors. Aphids, their biology, natural enemies and control, vol. 2A, Elsevier: Amsterdam. 27-50 pp.
Miller DG. 1998a. Life history, ecology and communal gall occupation in the manzanita leaf-gall aphid, Tamalia coweni (Cockerell) (Homoptera: Aphididae). J Nat Hist. 32(3):95-103.
Miller D.G. 1998b. Consequences of communal gall occupation and a test for kin discrimination in the aphid Tamalia coweni (Cockerell) (Homoptera: Aphididae). Behav Ecol Sociobiol. 43:95-103.
Miller DG, Crespi, B. 2003. The evolution of inquilinism, host-plant use, and mitochondrial substitution rates in Tamalia gall aphids. J. Evol. Biol. 16:1-13.
Miller DG, Sharkey MJ. 2000. An inquiline species of Tamalia co-occurring with Tamalia coweni (Homoptera: Aphididae). Pan-Pac Entomol. 76(2):77-86.
Monti V, Mandrioli M, Rivi M, Manicardi GC. 2012. The vanishing clone: karyotypic evidence for extensive intraclonal genetic variation in the peach potato aphid, Myzus persicae (Hemiptera: Aphididae). Bio.l J. Linnean Soc. 105(2):350-358.
Moran NA 1993. Defenders in the north american aphid Pemphigus obesinymphae. Insectes Sociaux.40(4):391-402.
Mueller UG, Wolfenbarger LL. 1999. AFLP genotyping and fingerprinting. Trends in Ecology and Evolution. 14:389-394.
Nakamura Y, Leppert M, O’Connell P, Wolff R, Holm T, Culver M, Martin C, Fujimoto E, Hoff M, Kumlin E, White R. 1987. Variable number of tandem repeat (VNTR) markers for human gene mapping. Science. 235:1616-1622.
Nei M, Lei W. 1979. Mathematical model for studying genetic variation in terms of restriction endonuclease. P. Natl. Acad. Sci. USA 76: 5269-5273.
Nowak MA, Tarnita CE, Wilson EO. 2010. The evolution of eusociality. Nature. 466:1057-1062.

37
Paterson AH, Lander ES, Hewitt JD, Peterson S, Lincoln SE, Tanksley SD. 1988. Resolution of quantitative traits into Mendelian factors by using a complete linkage map of restriction fragment length polymorphisms Nature. 335:721-726.
Reeve HK, Westneat DF, Queller DC. 1992 Estimating average within-group relatedness from DNA fingerprints. Mol. Ecol.1:223–232.
Remaudière G, Stroyan HLG. 1984. un Tamailia noveau de Californie (USA) discussion sur les Tamalliinae subfam. nov. Annales de la Société Entomologique de France Nouvelle Série. 20(1):93-103.
Ren M, Timko MP. 2001. AFLP analysis of genetic polymorphism and evolutionary relationships among cultivated and wild Nicotiana species. Genome. 44:559-571.
Richards WR. 1967. A revision of Tamalia, with descriptions of two new species from Mexico (Homoptera: Aphididae). Can Entomol. 99(1):65 74.
Ritter A, Vorwerk S, Blaich, R, Forneck A. 2007. Adaptational potential of grape phylloxera (Daktulosphaira vitifoliae) clonal lineages. Mitteilungen Klosterneuburg 57:116-122.
Rojo S, Marcos-García MA. 1997. Syrphid predators (Dipt: Syrphidae) of gall forming aphids (Hom.: Aphididae) in mediterranean areas: implications for biological control of fruit tree pests. BioControl. 42:269-276.
Ross KG, Matthews RW, editors. 1991. The social biology of wasps. USA: Oxford University Press. 696 p.
Smith JM. 1964. Group selection and kin Selection. Nature. 201:(4924) 1145–1147 p.
Smith JM. 1989. Evolutionary Genetics. 2nd ed. USA: Oxford University Press. 354 p.
Spencer H. 1964. The principles of biology, volume 1. Williams and Norgate. 475 pp.
Stern, DL, Foster WA. 1996. The evolution of soldiers in aphids. Biol Rev Camb Philos Soc. 71(1):27-79.
Timm AE, Pringlea KL Warnicha, L. 2005. Genetic diversity of woolly apple aphid Eriosoma lanigerum (Hemiptera: Aphididae) populations in the Western Cape, South Africa. Bull. Ent. Res. 95:187-191.
Varela MA, Amos W. 2010. Heterogeneous distribution of SNPs in the human genome: Microsatellites as predictors of nucleotide diversity and divergence. Genomics. 95:151-159.

38
Vorwerk S. 2007a. Molecular evidence of intraclonal variation and implications for adaptational traits of grape phylloxera populations (Daktulosphaira vitifoliae, Fitch). Dissertation: zur Erlangung des Grades eines Doktors der Agrarwissenschaften vorgelegt der Fakultät Agrarwissenschaften von Dipl. Agr. Biol. Sonja Vorwerk aus Bonn Stuttgart-Hohenheim. Universität Hohenheim, Germany.
Vorwerk S, Forneck A. 2007. Analysis of genetic variation within clonal lineages of grape phylloxera (Daktulosphaira vitifoliae Fitch) using AFLP fingerprinting and DNA sequencing. Genome 50(7):660-667.
Vos P, Hogers R, Bleeker M, Reijans M, Lee T, Hornes M, Frijters A, Pot J, Peleman J, Kuiper M, Zabeau M. 1995. AFLP: a new technique for DNA fingerprinting. Nucl. Acids Res. 23:4407-4414.
Vos P. Kuiper M. 1997. AFLP analysis. In: DNA Markers: protocols, applications, and overviews. Caetano-Anollés G, Gresshoff PM, editors. Hoboken (NJ): Wiley Publishers. 115–131 pp.
Vuylsteke M, Peleman JD, van Eijk MJT. 2007. AFLP technology for DNA fingerprinting. Nature Protocols. 2:1387-1398.
Wang CC, Tsaur S-C, Kurosu U. Aoki S, Lee H-J. 2008. Social parasitism and behavioral interactions between two gall-forming social aphids. Insectes Sociaux. 55(2):157-152.
Wheeler WM. 1911. The ant colony as an organism. Journal of Morphology. 22(2)307-325.
Whitham TG. 1978. Habitat selection by Pemphigus aphids in response to resource limitation and competition. Ecology. 59:1164-1176.
Whitham, TG. 1979. Territorial behavior of Pemphigus gall aphids. Nature. 279:324-325. doi:10.1038/279324a0
Williams JG, Kubelik AR, Livak KJ, Rafalski JA, Tingey SV. 1990. DNA polymorphisms amplified by arbitrary primers are useful as genetic markers. Nucl. Acids Res. 18(22):6531-6535.
Wilson EO. 1971. The Insect Societies. Cambridge (MA): Belknap Press, 548 pp.
Wilson EO. 1975. Sociobiology: the new synthesis. Cambridge (MA): Harvard University Press. 697 pp.
Wolf C, M. Burgener M, P. Hübner P, Lüthy J. 2000. PCR-RFLP Analysis of Mitochondrial DNA: Differentiation of fish species. LWT - Food Science and Technology. 33(2):144-150.

39
Wool D. 2004. Galling aphids: specialization, biological complexity, and variation. Annu Rev of Entomol. 49:175-192.