Reinsurance Market Outlook · Insured Losses 140,000 2005 Katrina, Rita, Wilma 120,000 1992...
47
Reinsurance Market Outlook David Simmons, Head of Aon Benfield Publications May 2009 Proprietary & Confidential
Transcript of Reinsurance Market Outlook · Insured Losses 140,000 2005 Katrina, Rita, Wilma 120,000 1992...

Reinsurance Market OutlookDavid Simmons, Head of Aon Benfield Publications
May 2009
Proprietary & Confidential

Market Background
Proprietary & Confidential

2009 Economic Outlook
GDP contraction / low growth
Unemployment
600 Change in Non-Farm Payroll
Unemployment
Government intervention
Low reinvestment yields 200
400
y
Deflationary and inflationary risk
Market volatility200
0
hous
ands
Less leveraged optimal capital structures
Capital markets open but expensive -400
-200ThChanging investor interest
Economic and regulatory capital changes-800
-600
… and/or increased M&A
Source: Bloomberg U S Bureau of Labor Statistics
-800Jan 00 Jan 02 Jan 04 Jan 06 Jan 08
Proprietary & Confidential
Source: Bloomberg, U.S. Bureau of Labor Statistics
2

Financial MarketsEquity marketsJan 2001 = 100
5-year government bond yields
6%
5%
6%
110
130
4%90
2%
3%
50
70
1%
%
Jan Jan Jan Jan Jan Jan Jan Jan Jan30
50
Jan Jan Jan Jan Jan Jan Jan Jan Jan Jan 01
Jan 02
Jan 03
Jan 04
Jan 05
Jan 06
Jan 07
Jan 08
Jan 09
UK Eurozone USA
Jan 01
Jan 02
Jan 03
Jan 04
Jan 05
Jan 06
Jan 07
Jan 08
Jan 09
S&P 500 FTSE 100Eurotop 100 Nikkei
Proprietary & Confidential 3
Source: Bloomberg
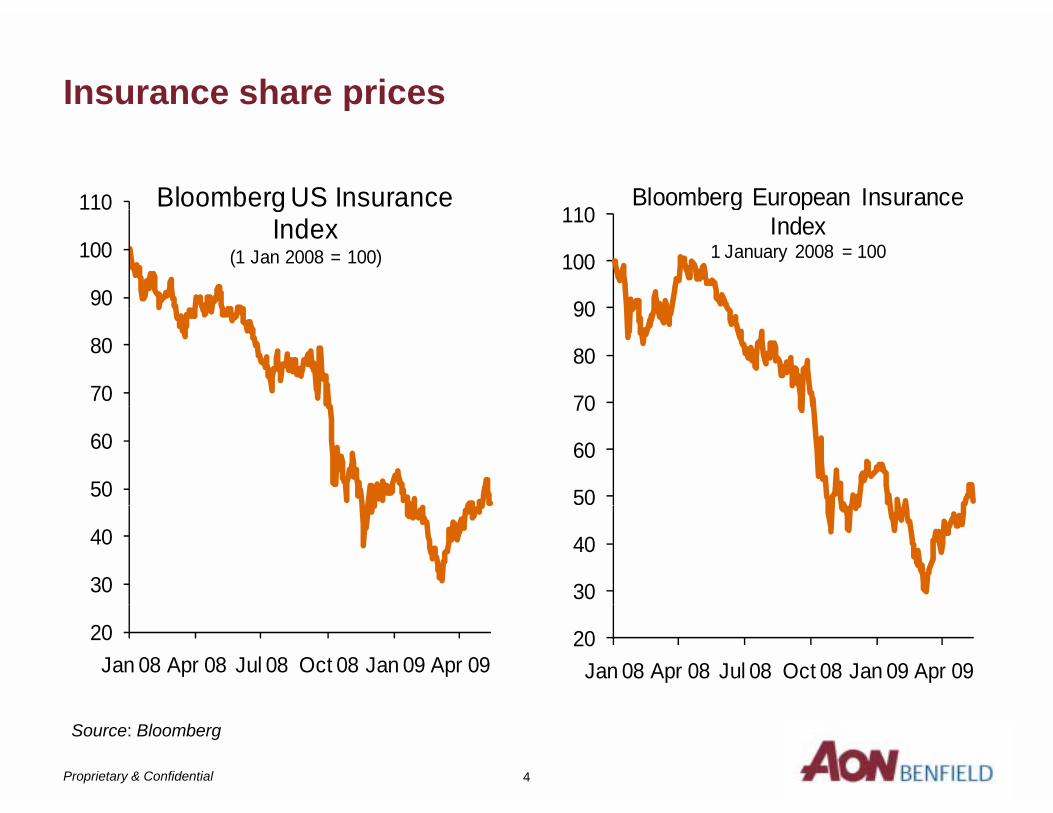
Insurance share pricesp
110 Bloomberg US Insurance 110
Bloomberg European Insurance
90
100
110 gIndex
(1 Jan 2008 = 100)
90
100
110g p
Index1 January 2008 = 100
70
80
70
80
90
50
60
50
60
70
30
40
30
40
20Jan 08 Apr 08 Jul 08 Oct 08 Jan 09 Apr 09
20Jan 08 Apr 08 Jul 08 Oct 08 Jan 09 Apr 09
Proprietary & Confidential 4
Source: Bloomberg

CDS Spreadsp
1,200 900
1,000700
800
600
800
s po
ints
400
500
600
poin
ts
400
Bas
i
200
300
400
Bas
is
200
0
100
200
0Jan 08 Apr 08 Jul 08 Oct 08 Jan 09 Apr 09
XL Berkshire ACEOdyssey Axis
Jan 08 Apr 08 Jul 08 Oct 08 Jan 09 Apr 09
Swiss Re Munich ReHannover Re SCOR
Proprietary & Confidential
Source: Bloomberg
5
Odyssey Axis Hannover Re SCOR

Insured Losses
140,0002005 Katrina, Rita, Wilma
120,000
1992 Hurricane Andrew 2001 September 11
2004 Charlie, Frances, Ivan, Jean, Songda 2008 Ike
80,000
100,000
8 pr
ices
)
1994 Northridge
1999 Storm Lothar
40,000
60,000
USD
bn (2
00 Earthquake
20,000
,U
01970 1975 1980 1985 1990 1995 2000 2005
Man-made disasters Natural catastrophes
Proprietary & Confidential 6
Source: Swiss Re, sigma no 2/2009

Ike and Top Ten Catastrophe Losses
8 9
7.9
Typhoon Mirelle/No
Hurricane Hugo
11.1
9.2
8.9
Hurricane Rita
Hurricane Charley
Typhoon Mirelle/No …
20 0
14.7
13.8
Hurricane Ike
Hurricane Ivan
Hurricane Wilma
22.8
20.3
20.0
Terror Attack on WTC
Northridge …
Hurricane Ike
71.3
24.6
0 20 40 60 80
Hurricane Katrina
Hurricane Andrew
0 20 40 60 80USDbn
Source: Swiss Re sigma 2/2009 Aon Benfield Analytics Research
Proprietary & Confidential 7 7
Source: Swiss Re, sigma 2/2009, Aon Benfield Analytics Research
Other catastrophe losses in USD indexed to 2008

Insurer Impairment Correlates With Underwritingp g
120%70
110%
115%
50
60
s
105%
110%
40
50
ned
ratio
pairm
ents
95%
100%
20
30
Com
bin
No
of Im
p
85%
90%
0
10
1969 1973 1977 1981 1985 1989 1993 1997 2001 2005
No of Impairments P&C Combined Ratio (RH scale)
Proprietary & Confidential 8
Source: A.M. Best Special Report 6 April 2009

Reasons For Insurer Impairment 1999 – 2008p
0%R d f i i
27%
Reserve def iciency
Rapid growth
Af f ili t bl40%
Aff iliate problems
Catastrophe losses
Mi ll
4%2%
Miscellaneous
Alleged f raud
O t t d t
6%6%
3% Overstated assets
Signif icant changes
U id if i d6%12% Unidentif ied
Reinsurance failure
Proprietary & Confidential 9
Source: A.M. Best Special Report 6 April 2009

2008 Reinsurer Results

Top 10 Concentration: Market Share Of Top 10 Aon Benfield Research P&C Reinsurance Groupsp
2008 GPW: USD 135bn
16%
Munich Re
Swiss Re
40%
Lloyd's
Hannover Re
Berkshire Hathaway13%
y
SCOR
Transatlantic Re
P t R9%
5%
Partner Re
Everest Re
Mapfre Re5%
4%3%3%3%2%
2% Remainder
Proprietary & Confidential 11
Source: Aon Benfield Analytics Research

Aon Benfield Aggregate Combined Ratiogg g
5.6% 4.6% 95.7%110%
90.8%
70%
90%
65.2%63.8%
50%
29.1% 29.5%10%
30%
-2.0%-10%
10%
2007 COR Expenseratio
Loss ratio G&I losses Prior yearreserve adj
2008 COR
Proprietary & Confidential 12
Source: Company Data, Aon Benfield Analytics Research

2008 Combined Ratios
Paris Re
White Mountains
Transatlantic Holdings
Odyssey
ACE
ABA*
Swiss Re
Allied World
Flagstone Re
40% 50% 60% 70% 80% 90% 100% 110%
IPC Holdings
RenaissanceRe
40% 50% 60% 70% 80% 90% 100% 110%
Combined Ratio (Reporting Currency)
Proprietary & Confidential
Source: Company Data, Aon Benfield Analytics Research
13

2008 Prior Year Reserve Adjustmentsj
IPC Holdings
Max Capital
Montpelier Re
Allied World
Odyssey
ABA*
RenaissanceRe
SCOR
Transatlantic Holdings
Odyssey
2% 2% 6% 10% 14% 18% 22% 26% 30%
Everest Re
White Mountains
-2% 2% 6% 10% 14% 18% 22% 26% 30%
Prior Year Reserve Adj as % NPE (Reporting Currency)
Proprietary & Confidential
Source: Company Data, Aon Benfield Analytics Research
14

2008 Hurricane Losses
Montpelier Re
IPC Holdings
Validus
Flagstone Re
XL Capital
ABA*
RenaissanceRe
White Mountains
Munich Re
XL Capital
SCOR
ACE
0% 5% 10% 15% 20% 25% 30% 35%
Gustav & Ike Losses as % NPE (Reporting Currency)
Proprietary & Confidential
Source: Company Data, Aon Benfield Analytics Research
15

Development of Aon Benfield Aggregate Shareholders’ Fundsp gg g
-5-524
170
-17-5158
150
160
127-1
-9
130
140
US
D b
n
120
130
100
110
31 Dec Additional Net Dividends FX Investment Share Other 31 Dec31 Dec2007 SHF
AdditionalCapital
Net Income
Dividends FX Investmentlosses
Sharebuybacks
Other 31 Dec2008 SHF
Proprietary & Confidential 16
Source: Company Data, Aon Benfield Analytics Research

2008 Shareholders’ Funds, % Changeg
Odyssey
Allied World
Aspen
Validus
Odyssey
ABA*
PartnerRe
XL Capital
Max Capital
Flagstone Re
White Mountains
Swiss Re
XL Capital
-40% -35% -30% -25% -20% -15% -10% -5% 0% 5% 10%
% Change in 2008/2007 Shareholders' Funds (Reporting Currency)
Proprietary & Confidential
Source: Company Data, Aon Benfield Analytics Research
17

Aon Benfield Aggregate 2008 Invested Asset Splitgg g p
Total Invested Assets 31 December 2008 USD698bn
14%
5%
Fixed Interest investments
Cash and cash equivalents
Oth i t t9% Other investments
Equity investments
72%
Proprietary & Confidential
Source: Company Data, Aon Benfield Analytics Research
18

2008 Invested Asset Leverageg
Swiss Re
SCOR
Munich Re
Hannover Re
ABA*
XL Capital
SCOR
R i R
Montpelier Re
Validus
IPC Holdings
Flagstone Re
RenaissanceRe
0 1 2 3 4 5 6 7 8 9 10
g
Invested Asset Leverage (Reporting Currency)
Proprietary & Confidential
Source: Company Data, Aon Benfield Analytics Research
19
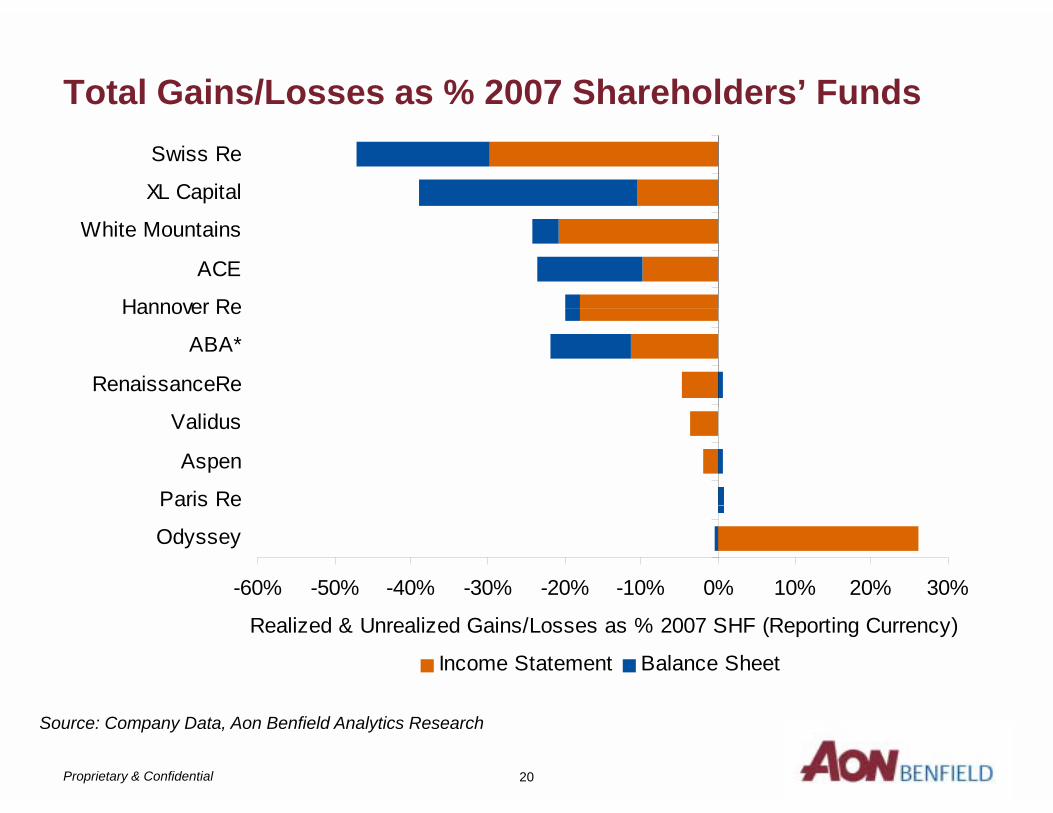
Total Gains/Losses as % 2007 Shareholders’ Funds
XL Capital
Swiss Re
Hannover Re
ACE
White Mountains
RenaissanceRe
ABA*
Hannover Re
Paris Re
Aspen
Validus
-60% -50% -40% -30% -20% -10% 0% 10% 20% 30%
Odyssey
Paris Re
Realized & Unrealized Gains/Losses as % 2007 SHF (Reporting Currency)
Income Statement Balance Sheet
Proprietary & Confidential
Source: Company Data, Aon Benfield Analytics Research
20

Reinsurers 10-year Risk/Return* Comparisony p
WR Berkley
20%
HannoverRe
ACE Everest
RenaissanceRe15%
erag
e
Hannover Re
Swiss RePartnerRe
TransatlanticOdyssey
IPCNat Indemnity
10%
-200
8 A
ve
Munich Re White MountainsXLIPCNat. Indemnity
GeneralRe
0%
5%
RoE
199
9 -
SCOR-5%
0%R
5%0 p.p. 5 p.p. 10 p.p. 15 p.p. 20 p.p. 25 p.p.
Standard Deviation 10 Year
Proprietary & Confidential
*Pre-tax operating return on average equity
Source: Company Data, Aon Benfield Analytics Research21

Reinsurer Rating Changesg g
Everest ReEverest Re
Transatlantic Re
Atradius
S i RSwiss Re
SCOR
Secura
NR
2001 2008 Mar 2009
NR BBB A AA AAA
Proprietary & Confidential 22
Source: Standard & Poor’s, Aon Benfield Analytics Research

Reinsurer Rating Changesg g
60
50
30
40
D bn
20
USD
0
10
0AAA AA+ AA AA- A+ A A- BBB+ BBB BBB- NR
2001 2008 Mar 2009
Proprietary & Confidential 23
Source: Standard & Poor’s, Aon Benfield Analytics Research

2008 Lloyd’s Results2008 Lloyd’s Results

2003-2008 Results
GBPmn 2004 2005 2006 2007 20082008/7
% chGross written premiums 14,614 14,982 16,414 16,366 17,985 10%Reinsurance as % GWP 20% 21% 24.1% 19.0% 21.0% 2ppNet written premiums 11,734 11,770 13,201 13,256 14,217 7%Net earned premiums 11 797 11 785 12 688 13 097 13 796 5%Net earned premiums 11,797 11,785 12,688 13,097 13,796 5%Net claims incurred 7,646 9,505 6,219 6,547 8,464 29%Net operating expenses 3,755 3,668 4,327 4,451 4,134 -7%Underwriting result 396 -1,388 2,142 2,099 1,198 -43%C bi d i 96 6% 111 8% 86 0% 84 0% 91 3%Combined ratio 96.6% 111.8% 86.0% 84.0% 91.3% 7ppProfit before tax 1,367 -103 3,662 3,846 1,899 -51%Net resources (incls sub debt) 12,169 10,992 13,333 14,461 15,264 6%Equity 11,663 10,491 12,836 13,449 14,182 5%q y , , , , ,Central assets 1,663 1,850 2,054 2,465 2,608 6%Pre tax return on average net resources 12.3% -0.9% 31.4% 29.3% 13.7% -16pp
Proprietary & Confidential
Source: Lloyd’s, Aon Benfield Analytics Research
25

Proforma Results
4
4.5
30%
35%
3
3.5
n 20%
25%
30%
1 5
2
2.5
GBP
bn
10%
15%
20%
0.5
1
1.5
5%
10%
-0.5
0
2004 2005 2006 2007 2008-5%
0%
2004 2005 2006 2007 2008
Profit before tax (LH scale) Pre-tax return on capital (RH scale)
Proprietary & Confidential
Source: Lloyd’s, Aon Benfield Analytics Research
26

Combined Ratio by Business Liney
123.8%140%
99.6% 96.7% 95.1%86 8%
100%
120%
d ra
tio
86.8% 84.6% 83.8%80%
r com
bine
d
40%
60%
enda
r yea
r
0%
20%Cale
0%Energy Motor Property Casualty Aviation Marine Reinsurance
2007 2008
Proprietary & Confidential
Source: Lloyd’s, Aon Benfield Analytics Research
27

Prior Year Reserve Adjustmentsj
-1.3%
0%
p.p.
-6.5%7 8%
-5%
mov
emen
t p
-7.8% -8.2%
-12.1%
-8.8%-10%
rese
rve
m
20%
-15%
Prio
r yea
r
-23.7%-25%
-20%
Motor Property Marine Energy Casualty Reinsurance Aviation
2007 2008
Proprietary & Confidential
Source: Lloyd’s, Aon Benfield Analytics Research
28

2009 Outlook
Proprietary & Confidential

1Q 2009 Changes in Shareholders’ Fundsg
GAAP Equity Change, Investment Losses and Invested Asset Ratio - Reinsurers Net Net Total realized Investment
Change realized unrealized & unrealized losses Invested Invested GAAP GAAP in investment investment investment as % of Total Total assets assets equity equity GAAP losses losses losses GAAP equity investments investments leverage leverage
Company 31/03/2009 31/12/2008 equity 31/03/2009 31/03/2009 31/03/2009 31/12/2008 31/03/2009 31/12/2008 31/03/2009 31/12/2008Arch 3,630 3,433 6% (41) 58 17 0% 11,109 10,800 3.1 3.1Aspen 2,832 2,779 2% (12) 1 (11) 0% 6,063 5,754 2.1 2.1AXIS 4,493 4,461 1% (40) (58) (98) -2% 10,841 10,925 2.4 2.4Endurance 2,254 2,207 2% (10) (8)** (18) -1% 5,606 5,502 2.5 2.5Endurance 2,254 2,207 2% (10) (8) (18) 1% 5,606 5,502 2.5 2.5Everest 5,040 4,960 2% (48) 47 (2) n.a. 13,737 13,863 2.7 2.8Flagstone 1,224 1,183 3% 6* - 6 0% 1,777 1,708 1.5 1.4Hannover Re 4,526 4,696 -4% (17)* (294) (311) -7% 42,602 42,404 9.4 9.0IPC 1,849 1,851 0% (36)* - (36) -2% 2,218 2,263 1.2 1.2Max 1,263 1,280 -1% 18 (66) (48) -4% 5,036 5,410 4.0 4.2Montpelier 1,437 1,358 6% (5)* 9 4 0% 2,451 2,365 1.7 1.7Munich Re 28 660 29 965 4% 50* (212) (162) 1% 230 308 242 614 8 0 8 1Munich Re 28,660 29,965 -4% 50 (212) (162) -1% 230,308 242,614 8.0 8.1Odyssey 2,714 2,828 -4% (65) (87)** (151) -5% 7,534 7,959 2.8 2.8PartnerRe 4,282 4,199 2% (5)* (64)* (69) -2% 11,901 12,236 2.8 2.9Platinum 1,829 1,809 1% 15* (2)** 13 1% 4,347 4,289 2.4 2.4RenaissanceRe 3,121 3,033 3% 3* (5)* (2) 0% 6,307 6,244 2.0 2.1SCOR 4,764 4,816 -1% (171)* (447) (618) -13% 22,748 23,924 4.8 5.0Swiss Re 17,876 22,585 -21% (2,094)* (1,584) (3,678) -16% 167,466 171,356 9.4 7.6T tl ti 3 321 3 198 4% (61)* 105 44 1% 11 014 10 660 3 3 3 3Transatlantic 3,321 3,198 4% (61)* 105 44 1% 11,014 10,660 3.3 3.3Validus 2,023 1,939 4% (23)* 22* (1) 0% 3,483 3,302 1.7 1.7White Mountains 3,482 3,513 -1% (23)* (21)* (45) -1% 9,569 9,474 2.7 2.7Total 100,622 106,093 -5% (2,559) (2,606) (5,165) -5% 576,118 593,052 5.7 5.6
As at 8 May 2009USD mn Foreign exchange at balance sheet date*Pre-tax realized/unrealized **Other CompreInvestments include cash and securities lendingSource: Company data
Proprietary & Confidential 30

Reinsurance 2009 Projectionsj
M&A activity
N t tNew entrants
Cat bond issuance
Share buybacks
Tax environments
Some existing players very well placed• High business diversification• Focus on traditional reinsurance business• Prudent and conservative asset management policy• Limited leverage through medium term capital management strategy• Focus on liquidity and operational cash flow
Proprietary & Confidential 31

Some Challenges and Opportunities g pp
Demand• Certainty of demand • Reduction in economic activity• Reinsurance diversification
S lSupply• Healthy financial situation• Capital management• Product innovation• Product innovation
Pricing• Recessionary claimsy• Inflation and deflation• Prior year adjustments• Investment returns
Proprietary & Confidential 32

Consolidation
Proprietary & Confidential

Top 20 Nations by GDPInsurance company domestic non life market sharep y
India100%Japan
ChinaFranceSouth Korea
T k
Sweden
80%ket
shar
e
UKItaly
CanadaAustralia
TurkeyBelgium
60%e co
mar
k
USAGermanySpain
CanadaBrazil
RussiaNetherlands
Indonesia60%
nsur
ance
y
Mexico40%
Top
10 i
20%0.1 1.0 10.0
GDP USD trillions (Log scale)
Proprietary & Confidential
Source: International Monetary Fund, Aon Benfield ResearchGDP USD trillions (Log scale)

Selected countriesInsurance company domestic non life market sharesp y
77.6%78.8%80%
90%
51.8%60%
70%
29.9%30.8%30.2%40%
50%
10%
20%
30%
0%
10%
USA Japan Germany China UK Netherlands
Market leader # 2 # 3 # 4 # 5
Proprietary & Confidential
Source: International Monetary Fund, Aon Benfield Research

Consolidation
1
1.2
50
60
0.8
1
40
50
rers
0.6
W U
SDbn
30
of R
eins
u
0.4
NPW
20
Num
ber
0.2 10
01995 1997 1999 2001 2003 2005 2007
0
Average NPW (LH scale) RAA Reinsurers (RH Scale)
Proprietary & Confidential 36
Source: Reinsurance Association of America, Aon Benfield Research

Lloyd’s Average Syndicate Capacity & Numbery g y p y300
400
450
200
250
300
350
400
er
150
200
BPm
n 250
300
ate
num
be
100
GB
150
200
Synd
ica
5050
100
01989 1991 1993 1995 1997 1999 2001 2003 2005 2007 2009
0
Average syndicate capacity (LH scale) No. of syndicates (RH scale)
Proprietary & Confidential 37
Source: Lloyd’s, Moody’s, Aon Benfield Research

Lloyd’s M&AyDate Acquirer Target Price
GBPmnSyndicates
May 2007 Validus Holdings Talbot Underwriting 200e 1183
Jul 2007 Ariel Re Atrium Underwriting 193 570, 609
Jul 2007 Sagicor Gerling at Lloyd's n.a. 1209
Oct 2007 Munich Re MSP Underwriting 52 318
Dec 2007 Tokio Marine & Nichido Fire Kiln Ltd 442 308, 510, 557, 807
Dec 2007 American Financial Group Marketform 37 2468
Apr 2008 Argo Group Heritage Underwriting Agency 137 1200, 3245g g g g y
Jul 2008 Ironshore Pembroke 17 4000
Jul 2008 AIG Ascot n/a 1414
Aug 2008 Max Capital Imagine Group (UK) Ltd 101 1400, 2525, 2526g p g p ( ) , ,
Aug 2008 Fairfax Advent 67.2 2, 780
Sep 2008 Beazley Momentum Underwriting Management Ltd. (MUM)
Up to USD37.5mn
3623, 3622
Oct 2008 Flagstone Re Marlborough Underwriting Agency Ltd
n/a 1861
Feb 2009 Beazley First State Management Group Inc
24 623,2623
Proprietary & Confidential 38
Inc
Source: Lloyd’s, Company information, Aon Benfield Research

Desaparición o cierre de reaseguradores en los últimos 10 añosDesaparición o cierre de reaseguradores en los últimos 10 años
H tf d R •Gerling Re•Hartford Re
•Lexington
•AIU Re
Gerling Re
•Chiyoda
•Reliance•AIU Re
•REAC
•New Cap
Reliance
•CNA Re
•Nationwide Re•New Cap
•Signet Star
•American Re
•Kemper Re
•CopenhagenAmerican Re
•Rhine Re •F&G Re
•GIO Re
Proprietary & Confidential

Compras o fusiones de reaseguradores
C
Brockbank Synd
Cat ReACE
Capital Re
Tempest Re
AXAGroupe Victorie
AXAGRE Re
General Re
Cologne Re BerkshireCologne Re
Global Aviation
Berkshire Hathaway
Proprietary & Confidential

Compras o fusiones de reaseguradores
Transcontinentale Re
Skandia AmericaFairfax FinancialSphere Drake
Ranger Re
Christiania GeneralFolksamericaUSF Re
ScorSorema Scor
Proprietary & Confidential

Compras o fusiones de reaseguradores
Aachen Re
Cigna Re (Japan & K )
General Electric / ERC
Korea)
Eagle Star
Frankona Re
Industrial Risk Insurance
Medical Protective
National Re
NRG Victory
Nordisk Re
Skandia InternationalSkandia InternationalHannover Re
ClarendonClarendonHannover Re
Proprietary & Confidential

Compras o fusiones de reaseguradoresp g
Equus ReKKR
Equus Re
Rhine Re
American Re
Munich ReNew Re
Real Riassicurazione
SAFRSAFR
Winterthur RePartner Re
Proprietary & Confidential

Compras o fusiones de reaseguradoresCompras o fusiones de reaseguradores
St. Paul ReCigna Re (Asia, Europe & LA)
F&G Re
Mercantile & General
Swiss Re
Reaseguros Alianza
Reaseguradora de Colombia Swiss Re
Unione Italiana de Riassicurazione
Union Re
Lincoln Life
Proprietary & Confidential

Compras o fusiones de reaseguradoresCompras o fusiones de reaseguradores
Chartwell ReTrenwick Re
Chartwell Re
La Salle Re
Sorema UK
Latin American Re
XL CapitalLe Mans Re
Mid Ocean
Nac ReNac Re
Guardian Re Transatlantic Re
Proprietary & Confidential

ContactsDavid Simmons T: +44 (0)20 7522 4177
Aon Benfield T: +44 (0)20 7522 3823Analytics Research E: [email protected]
© Aon Limited trading as Aon Benfield (for itself and on behalf of each subsidiary company of Aon Corporation) (“Aon Benfield”) reserves allrights to the content of this document. This document is provided exclusively for the use of the directors and employees of the organisation towhich it was originally delivered. Copies may be made by that organisation for its own internal purposes, but no part of this document may bewhich it was originally delivered. Copies may be made by that organisation for its own internal purposes, but no part of this document may bemade available to any third party without both (i) Aon Benfield’s prior written consent and (ii) that third party having first signed a “recipient ofreport” letter in a form acceptable to Aon Benfield. Aon Benfield will accept no liability to any third party to whom this document is disclosedwhether in compliance with the preceding sentence or otherwise. This document does not constitute any form of legal, accounting, taxationregulatory or actuarial advice. Without prejudice to the generality of the preceding sentence this document does not constitute an opinion ofreserving levels or accounting treatment. The recipient acknowledges that in preparing this document Aon Benfield may have based analysis ondata provided by the recipient and/or from third party sources. This data may have been subjected to mathematical and/or empirical analysisand modelling. Aon Benfield has not verified, and accepts no responsibility for, the accuracy or completeness of any such data. In addition, theand modelling. Aon Benfield has not verified, and accepts no responsibility for, the accuracy or completeness of any such data. In addition, therecipient acknowledges that any form of mathematical and/or empirical analysis and modelling (including that used in the preparation of thisdocument) may produce results which differ from actual events or losses. Where this document includes a recommendation or an assessmentof risk, the recipient acknowledges that such recommendation or assessment of risk is an expression of Aon Benfield’s opinion only and not astatement of fact. Any decision to rely upon any such recommendation or assessment will be solely at the risk of the recipient, for which AonBenfield accepts no liability, and the recipient acknowledges that this document does not replace the need for the recipient to make its ownassessment. Aon Benfield will not be liable, in any event, for any special, indirect or consequential loss or damage of any kind (including, but notlimited to, loss of profit and business interruption) arising from any use of the information contained in this document. Aon Limited is authorised
Proprietary & Confidential 46
ted to, oss o p o t a d bus ess te upt o ) a s g o a y use o t e o at o co ta ed t s docu e t o ted s aut o sedand regulated by the Financial Services Authority in respect of insurance mediation activities only.