Reinforcement Costs in Low-voltage Grids · Reinforcement Costs in Low-voltage Grids ... Comparison...
99
D4.3 – B2 “Reinforcement Costs in LV Grids” GA MOVE/FP7/265499/Green eMotion Page 1 of 99 Deliverable D4.3 – B2 Grid Impact studies of electric vehicles Reinforcement Costs in Low-voltage Grids Prepared by: Jasmin Mehmedalic Jan Rasmussen Silas Harbo Danish Energy Association Date: November 25 th , 2013 Version: 1.1
Transcript of Reinforcement Costs in Low-voltage Grids · Reinforcement Costs in Low-voltage Grids ... Comparison...

D4.3 – B2 “Reinforcement Costs in LV Grids”
GA MOVE/FP7/265499/Green eMotion Page 1 of 99
Deliverable D4.3 – B2Grid Impact studies of electric vehicles
Reinforcement Costs in Low-voltageGrids
Prepared by:
Jasmin MehmedalicJan Rasmussen
Silas HarboDanish Energy Association
Date: November 25th, 2013
Version: 1.1

D4.3 – B2 “Reinforcement Costs in LV Grids”
Page 2 of 99 GA MOVE/FP7/265499/Green eMotion
Document Information
AuthorsName Company
Key author Jasmin Mehmedalic Danish Energy AssociationFurther authors Jan Rasmussen Danish Energy Association
Silas Harbo Danish Energy AssociationContributors Thomas Wiedermann RWE
Vera Silva EDFAna González Bordagaray IberdrolaAna Lafuente IberdrolaGemma Odena Bulto ENEL
DistributionDissemination levelPU Public xPP Restricted to other programme participants (including the Commission Services)RE Restricted to a group specified by the consortium (including the Commission Services)CO Confidential, only for members of the consortium (including the Commission Services)
Revision historyVersion Date Author Description0.1 May 15, 2013 Jasmin Mehmedalic, Jan
Rasmussen and Silas HarboDraft for PartnersComments & Rev
0.2 June 06, 2013 Jasmin Mehmedalic Draft for PartnersComments& Rev
0.3 June 28, 2013 Jasmin Mehmedalic Draft for IndependentReviewer
1.0 September 30, 2013 Jasmin Mehmedalic Final Draft for Review1.1 November 25, 2013 Submission to EC Final revision
StatusFor InformationDraft VersionFinal Version (Internal document)Submission for Approval (deliverable) xFinal Version (deliverable, approved on)

D4.3 – B2 “Reinforcement Costs in LV Grids”
GA MOVE/FP7/265499/Green eMotion Page 3 of 99
Table of Contents
1 Executive Summary 9
2 Introduction 11
2.1 Electric Vehicles for Personal Transportation 112.1.1 EU Project Green eMotion and D4.3 122.1.2 The Subject for the Investigation 12
2.2 Outline of This Report 132.2.1 Terms and Abbreviations 14
3 Review on EVs Impact on the Low-voltage Grid 15
3.1 Concerns Regarding Charging of EVs 15
3.2 Description of EV Charging from a Grid Perspective 15
3.3 Parameters for Evaluation 17
4 Methodology 19
4.1 Description of method 19
4.2 Description of networks 20
4.3 Description of ITRES 21
4.4 Description of used parameters 234.4.1 Load 244.4.2 Charging power 294.4.3 Charging profile 294.4.4 EV location 324.4.5 EV penetration 334.4.6 Asset costs 34
4.5 Description of economic calculations 36
5 Results and Analysis 39
5.1 General Analysis 39
5.2 Baseline Analysis 41
5.3 Voltage control 445.3.1 Network impact 445.3.2 Economic impact 465.3.3 Subconclusion 46

D4.3 – B2 “Reinforcement Costs in LV Grids”
Page 4 of 99 GA MOVE/FP7/265499/Green eMotion
5.4 Location 465.4.1 Network impact 475.4.2 Economic impact 495.4.3 subconclusion 49
5.5 Charging profile 505.5.1 Network impact 505.5.2 Economic impact 525.5.3 Subconclusion 53
5.6 EV penetration 545.6.1 Network impact 545.6.2 Economic impact 565.6.3 Subconclusion 57
5.7 Charging power 575.7.1 Network impact 575.7.2 Economic impact 595.7.3 Subconclusion 59
6 Perspectives 60
7 Conclusion 65
8 Appendix 67
8.1 Load Profiles 67
8.2 Charging Profiles 69
8.3 Economic Results 73
8.4 Scenarios 97

D4.3 – B2 “Reinforcement Costs in LV Grids”
GA MOVE/FP7/265499/Green eMotion Page 5 of 99
List of Figures
Figure 2.1.1: Overview of deliverable D4.3. 12Figure 4.1.1: Overview of method used for study. 19Figure 4.3.1: Example of reinforcement schedule in ITRES. 23Figure 4.4.1: Load profile set for Danish networks. 24Figure 4.4.2: Scaling factor for generalized load profiles used to account for load uncertainty
when dealing with few customers. 25Figure 4.4.3: Example of load offset and its effect on the reinforcement schedule. 27Figure 4.4.4: Charging profile sets for Danish networks for user dependent (UD) and timer based
(TB) charging with slow and fast chargers. 31Figure 4.4.5: Charge profile set for Danish network for load dependent charging. 32Figure 4.4.6: Example feeder/network with voltage rating of nodes. 33Figure 4.4.7: EV penetration profiles for main network calculations (Low, Med, High) and basic
network evaluation (100). 34Figure 5.3.1: Baseline (top) and voltage controlled (bottom) reinforcement schedules for
Network 3. 45Figure 5.4.1: Reinforcement schedules for Network 2 for best case (top), distributed/baseline
(middle) and worst case (bottom) EV location. 48Figure 5.5.1: Reinforcement schedules for Network 28 with medium EV penetration and user
dependent (top) and timer based (bottom) charging. 51Figure 5.6.1: Reinforcement schedules for Network 6 with low (top), medium/baseline (middle)
and high (bottom) EV penetration and user dependent charging. 55Figure 5.7.1: Reinforcement schedule for Network 21 with slow/baseline (top) and fast (bottom)
chargers. 58Figure 8.1.1: Load profile set for Danish networks. 67Figure 8.1.2: Load profile set for Italian networks. 68Figure 8.1.3: Load profile set for Spanish networks. 68Figure 8.2.1: Charging profile sets for Danish networks for user dependent (UD) and timer based
(TB) charging with slow and fast chargers. 69Figure 8.2.2: Charge profile set for Danish networks for load dependent (LD) charging. 70Figure 8.2.3: Charging profile sets for Italian networks for user dependent (UD) and timer based
(TB) charging with slow and fast chargers. 71Figure 8.2.4: Charge profile set for Italian networks for load dependent (LD) charging. 71Figure 8.2.5: Charging profile sets for Spanish networks for user dependent (UD) and timer based
(TB) charging with slow and fast chargers. 72Figure 8.2.6: Charge profile set for Spanish networks for load dependent (LD) charging. 72

D4.3 – B2 “Reinforcement Costs in LV Grids”
Page 6 of 99 GA MOVE/FP7/265499/Green eMotion
List of Tables
Table 4.4.1: Asset Costs for ITRES calculations. 35Table 5.1.1: Summary of general analysis. Highlights indicate the nature of the reinforcement –
voltage (red), current (blue) or transformer (cyan). 40Table 5.2.1: Summary of networks and baseline results showing number of customers, length,
offset, reinforcements and first reinforcement. For reinforcement, colors indicatereinforcement type and numbers indicate years in which reinforcement occurs. 42
Table 8.3.1: Comparison of reinforcement costs in EUR for charging profiles with medium EVpenetration (scenarios 1a, 1b and 1c). 73
Table 8.3.2: Comparison of reinforcement costs in % of network value for charging profiles withmedium EV penetration (scenarios 1a, 1b and 1c). Network value is in EUR. 74
Table 8.3.3: Comparison of reinforcement costs in EUR for voltage control (scenarios 1a, 2.1 and2.2). 75
Table 8.3.4: Comparison of reinforcement costs in % of network value for voltage control(scenarios 1a, 2.1 and 2.2). Network value is in EUR. 76
Table 8.3.5: Comparison of reinforcement costs in EUR for EV location (scenarios 1a, 3.1 and 3.2).77
Table 8.3.6: Comparison of reinforcement costs in % of network value for EV location (scenarios1a, 3.1 and 3.2). Network value is in EUR. 78
Table 8.3.7: Comparison of reinforcement costs in EUR for charging profiles with low EVpenetration (scenarios 4.1a, 4.1b and 4.1c). 79
Table 8.3.8: Comparison of reinforcement costs in % of network value for charging profiles withlow EV penetration (scenarios 4.1a, 4.1b and 4.1c). Network value is in EUR. 80
Table 8.3.9: Comparison of reinforcement costs in EUR for charging profiles with high EVpenetration (scenarios 4.2a, 4.2b and 4.2c). 81
Table 8.3.10: Comparison of reinforcement costs in % of network value for charging profiles withhigh EV penetration (scenarios 4.2a, 4.2b and 4.2c). Network value is in EUR. 82
Table 8.3.11: Comparison of reinforcement costs in EUR for charging profiles with fast charging(scenarios 5a, 5b and 5c). 83
Table 8.3.12: Comparison of reinforcement costs in % of network value for charging profiles withfast charging (scenarios 5a, 5b and 5c). Network value is in EUR. 84
Table 8.3.13: Comparison of reinforcement costs in EUR for EV penetration with UD charging(scenarios 1a, 4.1a and 4.2a). 85
Table 8.3.14: Comparison of reinforcement costs in % of network value for EV penetration withUD charging (scenarios 1a, 4.1a and 4.2a). Network value is in EUR. 86

D4.3 – B2 “Reinforcement Costs in LV Grids”
GA MOVE/FP7/265499/Green eMotion Page 7 of 99
Table 8.3.15: Comparison of reinforcement costs in EUR for EV penetration with TB charging(scenarios 1b, 4.1b and 4.2b). 87
Table 8.3.16: Comparison of reinforcement costs in % of network value for EV penetration withTB charging (scenarios 1b, 4.1b and 4.2b). Network value is in EUR. 88
Table 8.3.17: Comparison of reinforcement costs in EUR for EV penetration with LD charging(scenarios 1c, 4.1c and 4.2c). 89
Table 8.3.18: Comparison of reinforcement costs in % of network value for EV penetration withLD charging (scenarios 1c, 4.1c and 4.2c). Network value is in EUR. 90
Table 8.3.19: Comparison of reinforcement costs in EUR for charging power with UD charging(scenarios 1a and 5a). 91
Table 8.3.20: Comparison of reinforcement costs in % of network value for charging power withUD charging (scenarios 1a and 5a). Network value is in EUR. 92
Table 8.3.21: Comparison of reinforcement costs in EUR for charging power with TB charging(scenarios 1b and 5b). 93
Table 8.3.22: Comparison of reinforcement costs in % of network value for charging power withTB charging (scenarios 1b and 5b). Network value is in EUR. 94
Table 8.3.23: Comparison of reinforcement costs in EUR for charging power with LD charging(scenarios 1c and 5c). 95
Table 8.3.24: Comparison of reinforcement costs in % of network value for charging power withLD charging (scenarios 1c and 5c). Network value is in EUR. 96
Table 8.4.1: Overview of calculation scenarios. 99

D4.3 – B2 “Reinforcement Costs in LV Grids”
Page 8 of 99 GA MOVE/FP7/265499/Green eMotion

D4.3 – B2 “Reinforcement Costs in LV Grids”
GA MOVE/FP7/265499/Green eMotion Page 9 of 99
1 Executive Summary
The scope of this report is to describe the impact of EVs on the reinforcement andreinforcement costs of low-voltage networks. The focus is on how differentparameters relating the EVs to the grid affect the reinforcement costs. Theevaluation has been done by developing and analyzing a set of scenarios that varythe parameters under study. These parameters are:
- Charging Power- Charging Profile- EV Location- EV Penetration
Apart from these parameters, the influence of voltage control has also beenevaluated.
Load flow simulations have been performed on each scenario using ITRES. ITRESis a tool developed within Green eMotion1 that evaluates reinforcement costs over anumber of years with a user-specified load increase. The reinforcement scheduleand reinforcement cost results have been analyzed and comparisons have beenmade for each of the parameters in the study. The comparison of costs is based onnet present value (a way of representing time value of money concept). Thisassures that it is not only the amount of reinforcement that is considered, but alsothe time at which it occurs.
The results have shown that the charging profile is the most important parameter ofall the investigated parameters. As the charging profile depends on the chargemanagement strategy, it means that the charge management strategy is the mostimportant parameter. With a grid friendly charge management strategy it is possibleto avoid most reinforcements and their associated costs, reducing the significanceof all the other parameters.
The results also showed that a simple timer based charge management strategy withthe goal of improved grid friendliness, could end up making the charging process
1 D4.3-C1 “Tool Kit” will be published early 2014

D4.3 – B2 “Reinforcement Costs in LV Grids”
Page 10 of 99 GA MOVE/FP7/265499/Green eMotion
less grid friendly due to a kickback effect. This resulted in significantly increasedreinforcement costs in many of the networks when using the simple timer basedcharge management strategy. More elaborate timer based charge managementstrategies can likely avoid kickback and its negative effects on reinforcement costs,while still providing the benefits of moving EV charging away from the existingload peaks.
Variations in EV penetration and charging power had a significant impact onreinforcement costs, showing the importance of accurate forecasting.
EV location and voltage control only had an economic impact in networks wherereinforcement was necessary due to voltage issues. Location had a significantimpact on reinforcement costs and showed that in order to evaluate thereinforcement of a network, it is necessary to know the exact location of EVsduring grid planning. The use of voltage control could defer the vast majority ofreinforcements associated with voltage issues and allow long feeders toaccommodate a significantly larger amount of EVs before reinforcement isnecessary.
It was found that new tools are needed – tools that can estimate the economicimpact of different solutions better and allow more flexibility when it comes toload forecasting. It was also found that new methods may be necessary forestimating load, especially in cases with fewer customers and flexible loads, whereaverages are a poor estimation. New technologies such as Smart Meters canprovide a large statistical base which can facilitate more accurate load estimationand forecasting.

D4.3 – B2 “Reinforcement Costs in LV Grids”
GA MOVE/FP7/265499/Green eMotion Page 11 of 99
2 Introduction
Europe is undergoing a change from fossil based energy consumption to renewableenergy sources such as wind, water, solar energy, burning of waste and bioproducts. A great part of this development has taken place in the electricity market,replacing the existing power production units with something more environmentfriendly, thus reducing CO2 emissions and lowering the dependency on heavy fueloil products. As part of a similar transition in the transportation sector, electricvehicles have long been in use as trams and trains. To fulfill the Transport 20502
goals, which include a drastic reduction of CO2 emissions from the transportsector, new technology is needed and for the common car the electric car is theprimary replacement.
2.1 Electric Vehicles for Personal Transportation
The transition from oil based cars to electric cars (EVs) will have a significant andpositive effect on society, the local environment in particular, and set new demandsto the electric grid.
Unlike Internal Combustion Engine cars (ICE), EVs are connected to and use theelectric grid when refueling, either via an On-board charger or via an Off-boardcharger.
Chargers are typically connected to the low-voltage grid. Home chargers areusually single phase units, while public fast chargers are three phase units with amuch higher power rating. Home chargers are expected to be the primary chargingpoint for EVs and are located in residential low-voltage grids. Fast chargers areexpected to be employed in different parts of the low-voltage grid.
2Goals for the future in the transportation sector, details can be seen at:http://europa.eu/rapid/pressReleasesAction.do?reference=IP/11/372&format=HTML&

D4.3 – B2 “Reinforcement Costs in LV Grids”
Page 12 of 99 GA MOVE/FP7/265499/Green eMotion
2.1.1 EU Project Green eMotion and D4.3
The large EU project Green eMotion focuses on electric vehicles; the technicaldevelopment, penetration, and interaction with society. The project consists ofeleven work packages investigating numerous topics related to EVs. The project issupported by partners throughout the European continent and each investigationstands as a small part of a larger picture.
D4.3 will include recommendations for future planning tools for DSOs and aninvestigation of the effect EVs have on the grid and power quality. D4.3 consists ofseveral reports covering different topics relating EVs to the electrical grid. Anoverview of D4.3 is shown in Figure 2.1.1.
Figure 2.1.1: Overview of deliverable D4.3.
All reports are available on the Green Emotion website under following link:http://www.greenemotion-project.eu/dissemination/deliverables-infrastructure-solutions.php
2.1.2 The Subject for the Investigation
Input from T4.2
A. Power QualityD4.3-A1investigates howEVs affect theharmonics in theelectrical grid. Itmay beadvantageous toread D4.3-B1 first.standards.
B. Grid impactD4.3-B1 is an overview of theparameters that relate EVs to theelectrical grid. It also defines many ofthe basic terms that are used throughoutthe deliverable D4.3 reports.
D4.3-B2 investigates the technical andeconomical grid impact of EVs based onthe parameters defined in D4.3-B1. It isrecommended to read D4.3-B1 first.
D4.3-B3 investigates the impact of EVson grid planning and the functionality ofplanning tools. It may be advantageousto read D4.3-B1 first.
C. Tool kitD4.3-C1 is a tool forassessing the technicaland economic impactof EVs in thedistribution network.The tool is calledITRES.
D4.3 – B2 “Reinforcement Costs in LV Grids”
GA MOVE/FP7/265499/Green eMotion Page 13 of 99
This study aims to investigate the economic impact on grid reinforcements arisingfrom the introduction of EVs. GeM WP9 is going to investigate the economicimpact on a European scale. This study looks to investigate the economic impacton a much smaller scale – specifically on the scale of individual low-voltagefeeders. Rather than focus on the economic impact of EVs with a fixed set ofparameters, the study will investigate the economic impact of various parameterson the reinforcement costs introduced by home charging of EVs. The investigationsare focused on charging at private households as it is deemed important due to thenumber of charging facilities and a significant increase in the power consumptionat households. The objective of this report is to describe the impact of variousparameters on the reinforcement costs, as well as the data required to get the fullpotential of the identified benefits. As stated above, this study is focusing on homecharging of EVs. Deployment of public and semi-public charging infrastructuremight have a positive effect on the grid impact; however this is not included in thisstudy.
2.2 Outline of This Report
Chapter 3 gives a short overview of the impact EVs have on the low-voltage grid,and the special challenges they pose.
Chapter 4 explains the method used for the study. It explains the parameters thathave been used for the study. It discusses the reasoning behind the parameterchoices and the limitations imposed by the used method and parameters.
Chapter 5 gives an overview of the results and presents an analysis detailing thefindings of the study.
Chapter 6 puts the results of chapter 5 into perspective and discusses some of thebroader implications. It also looks ahead at the future work that is required tofurther uncover the impact of EVs on the electrical grid and to consider EVs duringgrid planning.
Chapter 7 contains a conclusion which summarizes the findings of the study.

D4.3 – B2 “Reinforcement Costs in LV Grids”
Page 14 of 99 GA MOVE/FP7/265499/Green eMotion
2.2.1 Terms and Abbreviations
Abbreviation Representation Explanation
CMS Charge ManagementStrategy
The strategy or philosophy of how to chargeone or more EVs in order to reach a goal.
DSO Distribution SystemOperator, grid owners
The company which owns the lower voltagelevel grids. The company can be a privatelyowned enterprise, state owned or have mixedownership.
EN European Norm EN in front of the number of a standardindicates that the standard is adopted by theEuropean Committee for ElectrotechnicalStandardization (CENELEC).
EV Electric Vehicle Electric car which recharges its battery fromthe grid. Substitute for an ordinary commuteor family car, not a truck or a train.
D4.3 – B2 “Reinforcement Costs in LV Grids”
GA MOVE/FP7/265499/Green eMotion Page 15 of 99
3 Review on EVs Impact on the Low-voltage Grid
EVs, like most other load, are connected to the low-voltage grid. However, unlikeother loads EVs travel about and are therefore not always connected to the sameplace in the grid. Additionally, their charging depends on their usage pattern, andthus the time and duration when they draw power from the electrical grid can varysignificantly. These conditions present some special challenges to the grid,especially when EVs are charged at home, as EVs are a large load compared tonormal household load.
3.1 Concerns Regarding Charging of EVs
As EVs are large loads compared to normal household loads, their charging processcan severely increase the load in the low-voltage grid. One of the concerns withregards to EV charging is the time of the day at which EVs are charged. Thenormal usage of vehicles shows that EVs will mainly be on the road during the dayand connected to the grid during the evening and night. It is assumed that whenusers get home in the afternoon/evening, they connect their EVs to the grid andcontinue their day as they normally would. This means that EV charging coincideswith the existing peak load of households, as residential peak load most oftenoccurs in the afternoon/evening,. The end result is a significantly larger peak load,while the load in the remaining part of the day is unaffected. The significantlyincreased peak load will overload grids and require expensive grid reinforcement,in order to provide the necessary power during those few hours of the day whereresidential peak load and EV charging coincide.
3.2 Description of EV Charging from a Grid Perspective
EV charging and its impact on the grid depend on many factors, a description ofwhich can be found in D4.3-B1: “Grid Impact studies of electricvehicles_Parameters for Assessment of EVs Impact on LV Grid”. Some of theimportant factors from a grid perspective include charging power, charging time,which gives the energy consumption, and charging profile. The charging power

D4.3 – B2 “Reinforcement Costs in LV Grids”
Page 16 of 99 GA MOVE/FP7/265499/Green eMotion
determines the maximum load presented to the grid. The charging time andcharging profile, determine in what time frame the grid is additionally loaded.
Without considering future features of the converter, an EV affects the grid similarto any other load. The introduction of an EV therefore requires the grid to providemore power and more energy. Providing more power gives higher loading of thegrid and results in larger voltage drop.
Similar to any other load, placing an EV at the end of a long feeder will result insubstantial voltage drop. On the other hand, placing that same EV at the beginningof the feeder will result in a minor voltage drop. In that regard an EV is just likeany other load. There are some issues to take into consideration though, especiallyin regard to home charging of EVs.
Compared to the usual load of a household, an EV is a large load. The driving andusage pattern of an EV results in charging occurring at the same time as theevening load peak – a load peak that often defines the peak load of a household inboth size and time. This is unfortunate, as the load from the EV is added at a timewhen the grid is already highly loaded.
The driving pattern of an EV, however, suggests that moving the charging process,and thus the EV load, to a different time of the day – away from the evening loadpeak – could be done without affecting the driving pattern. By moving the chargingof the EV to a different time of the day, the power and energy required can besupplied when the grid is in a low load situation, and thus not stressed.
The ability to make the EV charging process flexible is an important aspect of EVcharging. The flexibility is achieved through control of the charging process andcan affect the impact that EVs have on the grid. However, this flexibility is limitedby the EVs only being connected to the grid during certain times of the day. Toevaluate the impact on the grid, the usage pattern of EVs - a usage pattern thatclosely resembles that of ICE cars - should also be evaluated.

D4.3 – B2 “Reinforcement Costs in LV Grids”
GA MOVE/FP7/265499/Green eMotion Page 17 of 99
In D4.2: “Recommendations on grid-supporting opportunities of EVs”3 severalways of controlling the charging process of EVs are described. The chargemanagement strategies that will be used in this study consist of two strategies fromthe conservative world category and one from the pragmatic world category. Theselected charge management strategies are uncontrolled charging, time of usetariffs charging and soft charging. These strategies correspond to the userdependent, timer based and load dependent charge management strategiespresented in section 4.4.3.
3.3 Parameters for Evaluation
In D4.3-B1: ” Grid Impact studies of electric vehicles_Parameters for Assessmentof EVs Impact on LV Grid” the different parameters that need to be consideredwhen evaluating the impact of EVs on the low-voltage grid are covered. From theparameters identified in the report, the subset that will be evaluated in this study is:
- Charging Power- Charging Profile- EV location- EV penetration
Charging Power- The maximum power that the charger can draw from the grid.
The charging power is directly related to the charging time. The two are animportant part of determining the charging profile. Two different charging powersare evaluated in this study – 3.7 kW and 22 kW.
Charging Profile- A charging profile for a number of EVs: typically a curve depicting demand per hour or 15
minutes during a day.
The number of EVs which can be accommodated by the electrical grid depends onthe charging profile. Three different charging profiles are evaluated in this study,representing three different charge management strategies.
3 Available on Green Emotion website under following link:http://www.greenemotion-project.eu/dissemination/deliverables-infrastructure-solutions.php
D4.3 – B2 “Reinforcement Costs in LV Grids”
Page 18 of 99 GA MOVE/FP7/265499/Green eMotion
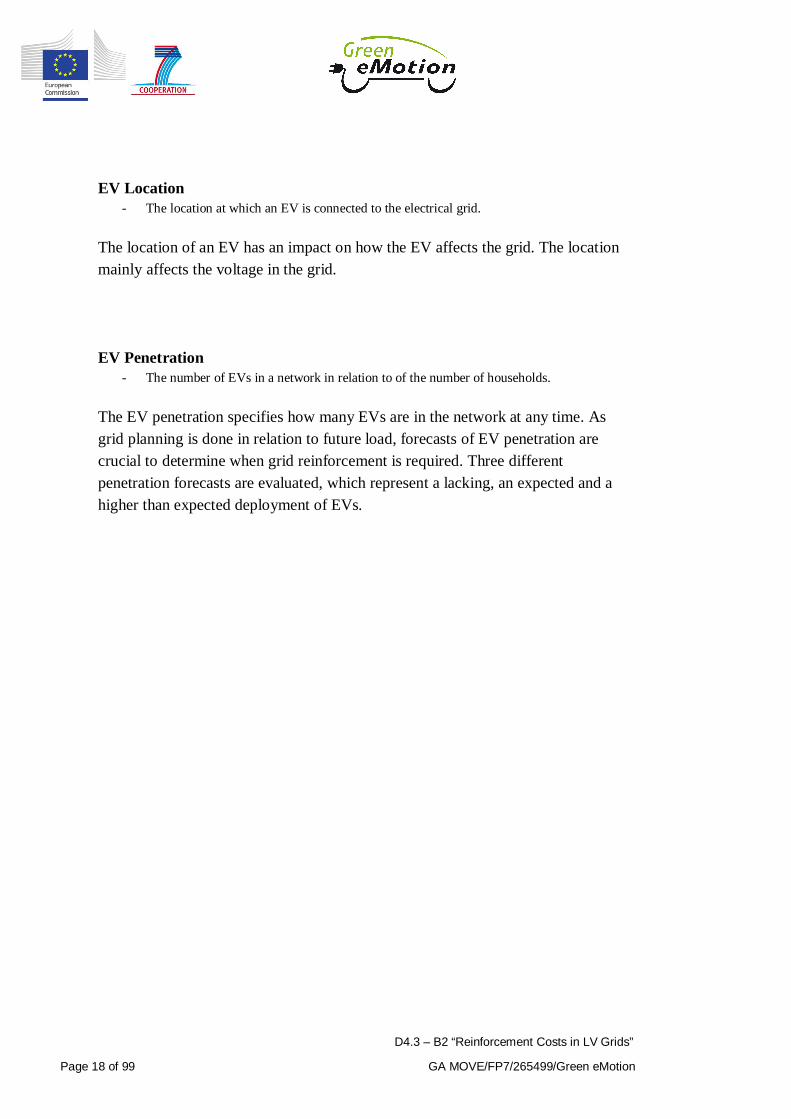
EV Location- The location at which an EV is connected to the electrical grid.
The location of an EV has an impact on how the EV affects the grid. The locationmainly affects the voltage in the grid.
EV Penetration- The number of EVs in a network in relation to of the number of households.
The EV penetration specifies how many EVs are in the network at any time. Asgrid planning is done in relation to future load, forecasts of EV penetration arecrucial to determine when grid reinforcement is required. Three differentpenetration forecasts are evaluated, which represent a lacking, an expected and ahigher than expected deployment of EVs.

D4.3 – B2 “Reinforcement Costs in LV Grids”
GA MOVE/FP7/265499/Green eMotion Page 19 of 99
4 Methodology
4.1 Description of method
Before describing the method, it is important to align it with the goal of the study.As the goal of the study is to evaluate the influence of different parameters and theeconomic impact on reinforcement costs, it will be necessary to stress the networksto the point where reinforcement is necessary.
The study is performed by use of the ITRES tool4. ITRES is a tool developedwithin the Green eMotion project for assessing the reinforcement needs over agiven time frame, specified in years, when the load in the network is known in eachyear.
An overview of the method is given in Figure 4.1.1.
1.Specificationof input data
andparameters
2. Basicnetwork
evaluation3. Baselinecalculation
4. Offsetadjustment
5. Mainnetwork
calculations6. Economiccalculations
Figure 4.1.1: Overview of method used for study.
In step 1, the necessary input data and parameters are specified. This is a quiteextensive task, as it requires data about the network, the existing load and the EVload in each year.
Step 2 consists of basic network calculations. This is a set of calculationsperformed to evaluate how many EVs the selected networks can manage beforevoltage or thermal issues arise. The scenarios used for these calculations can beseen in Table 8.4.1 in Appendix (Scenarios 0a to 0c). The number of EVs in the
4 The tool is available on the Green Emotion website under following link:http://www.greenemotion-project.eu/dissemination/deliverables-infrastructure-solutions.php

D4.3 – B2 “Reinforcement Costs in LV Grids”
Page 20 of 99 GA MOVE/FP7/265499/Green eMotion
first year of evaluation is 0 and is then linearly increased until each customer has anEV (see Figure 4.4.7 in section 4.4.5).
The third and fourth steps are tied together. In step 3 a baseline calculation(Scenario 1a, see Table 8.4.1 in Appendix for details) is run to evaluate thereinforcement of the network. In step 4 the reinforcement is evaluated and the loadoffset adjusted. Steps 3 and 4 are repeated until the following condition is satisfied:
- The first reinforcement must occur in year 10 or earlier. The target year is year 10.
Load offset and target year are explained in section 4.4.1.
Step 5 consists of a set of calculations (Scenario 1b to 5c) that vary the parameters(see section 3.3) under study. The offset is kept constant for all calculations of anetwork.
The final step is the economic calculation. The output of the calculations in step 5is used as the input for these calculations.
4.2 Description of networks
While low-voltage networks are generally designed with a radial topology, thenetworks differ greatly in design and topology depending on the geographical area.These differences in design and topology are necessary to facilitate the reliablesupply to different customers. For instance, a low-voltage network in a rural area isnotably different than a network in an urban area. A low-voltage network supplyingan industrial area is notably different than a network supplying a residential area.Furthermore, the design and topology differs from country to country.Due to these differences it has been necessary to look at different low-voltagenetworks. For the purpose of this study the scope of networks was limited toresidential networks supplying detached houses. There were several reasons for thischoice – among them was that EVs will likely have the largest impact on LVnetworks supplying detached houses and that networks supplying such areas are themost diverse in topology and the challenges posed. Networks supplying apartmentswill be affected less and in a different way, as customers are likely to have tocharge their EVs from dedicated charging facilities. Such dedicated charging
D4.3 – B2 “Reinforcement Costs in LV Grids”
GA MOVE/FP7/265499/Green eMotion Page 21 of 99
facilities and public charging facilities will most likely have their own LV feeders,so the EVs will not affect the existing LV feeders.Rather than evaluating entire networks with many feeders, low-voltage feederswere evaluated individually. This was done because the vast majority of issues andchallenges experienced in low-voltage networks relate to the individual feeders dueto the radial topology.A total of 33 networks/feeders were selected for analysis. These networks coverdifferent countries (Denmark, Italy and Spain) and different geographical areas(rural and urban) and should thus present both voltage and thermal (overload)issues.
4.3 Description of ITRES
The tool used for the calculations is ITRES. ITRES is a tool specifically developedto evaluate the impact of EVs. ITRES performs balanced 3-phase load flowcalculations on the network under study. All loads are therefore considered to be 3-phase balanced loads. This of course gives some limitations that must beconsidered during analysis. As a lot of loads, including EVs, are single phase loads,the 3 phases will often be unbalanced. The influence of voltage and currentunbalance cannot be quantified by the use of ITRES and the ITRES results coulddiffer significantly from what is seen in practice. The main difference will be thatvoltage issues will be more common and occur earlier in practice than what theITRES calculations suggest.
ITRES provides several modes of use. For the purpose of this study mode B2 isused. Mode B2 requires the user to specify the following:
- The network- The voltage limits- The daily load profile of each load- The growth of load in each year of the study- The daily load profile for a given number of EVs- The number of EVs in each year of the study- The cost associated with each network asset
ITRES operates with daily load profiles specified in hours, i.e. 24 load values perload profile (one day). In each year of the study ITRES performs 24 load flows,one for each hour of the day, and finds the highest loading of each component/asset

D4.3 – B2 “Reinforcement Costs in LV Grids”
Page 22 of 99 GA MOVE/FP7/265499/Green eMotion
and the lowest voltage of each node. If the voltage drop is too high or any asset ofthe network is overloaded, ITRES will reinforce it.ITRES offers two ways of reinforcing the assets – reinforcement mode andinstallation mode. In this study, installation mode is used. When an asset isreinforced in installation mode, the new size of the asset is used in all followingyears. Assets can be reinforced multiple times and all reinforcements are based on aseparate list of assets, which specifies the electrical characteristics and price ofeach asset.
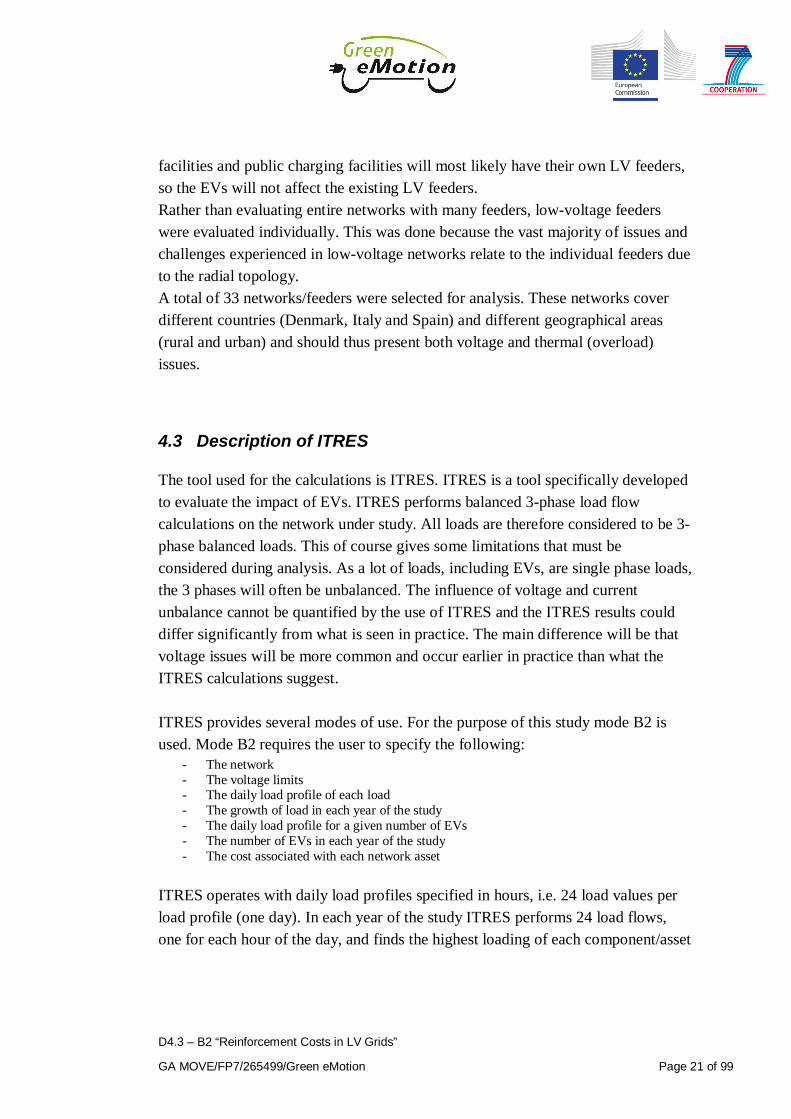
The output of ITRES is a reinforcement schedule specifying which assets must bereinforced in which year and why, as well as the cost of the reinforcement. Anexample of the output can be seen in Figure 4.3.1. What is shown is thereinforcement schedule over a 25 year time frame. The 6 categories ofreinforcement are as follows:
- UG-I: Reinforcement of underground cables due to violation of thermal/current limit(overload).
- UG-V: Reinforcement of underground cables due to violation of voltage limit.- OH-I: Reinforcement of overhead lines due to violation of thermal/current limit
(overload).- OH-V: Reinforcement of overhead lines due to violation of voltage limit.- GMT: Reinforcement of ground mounted transformer due to violation of thermal limit
(overload).- PMT: Reinforcement of pole mounted transformer due to violation of thermal limit
(overload).
In the example given in Figure 4.3.1, it is seen that a voltage reinforcement ofunderground cables occurs in year 3 and is the first necessary reinforcement. As thenumber of EVs is further increased, it also becomes necessary to reinforce thetransformer. Towards the end of the 25 year period, current reinforcement ofunderground cables becomes necessary as their thermal limits are exceeded.
D4.3 – B2 “Reinforcement Costs in LV Grids”
GA MOVE/FP7/265499/Green eMotion Page 23 of 99
Figure 4.3.1: Example of reinforcement schedule in ITRES.
ITRES’ ability to reinforce assets automatically and calculate the cost of thereinforcement is the main reason why this tool was selected for use in this study.
A more detailed description of ITRES, its features and functionality can be foundin the ITRES User Manual (ITRES User Manual, Imperial College, 2013).
4.4 Description of used parameters
A large number of parameters must be set for each calculation. These parameterspertain to both the grid and the EVs. Some of these parameters change fromcalculation to calculation, while others do not. A summary of parameters and theirdependencies is given in D4.3-B1: “Grid Impact studies of electricvehicles_Parameters for Assessment of EVs Impact on LV Grid” and it is a subsetof these parameters that are investigated in this study. In order to ease thecalculations, it was necessary to make simplifications to some of the parametersand their associated data.
In addition to the parameters, the value of voltage control is investigated. This isdone by varying the allowed voltage drop – i.e. a larger voltage drop can beallowed along the feeder if voltage control is utilized.
0
5
10
15
20
25
30
35
1 2 3 4 5 6 7 8 9 10 11 12 13 14 15 16 17 18 19 20 21 22 23 24 25
Rein
forc
emen
tcos
t(€k
)
Year
UG-I UG-V OH-I OH-V GMT PMT
D4.3 – B2 “Reinforcement Costs in LV Grids”
Page 24 of 99 GA MOVE/FP7/265499/Green eMotion
4.4.1 Load
Starting with the load specification, the load is divided into two parts – existingload and EV load. Since this study focuses on detached houses, the existing load isordinary residential load. ITRES requires a daily load profile for each existing loadin the network. Since this is at best difficult to provide, it was decided to apply thesame load profile to all existing loads. This load profile is based on the country ofstudy and the number of customers.
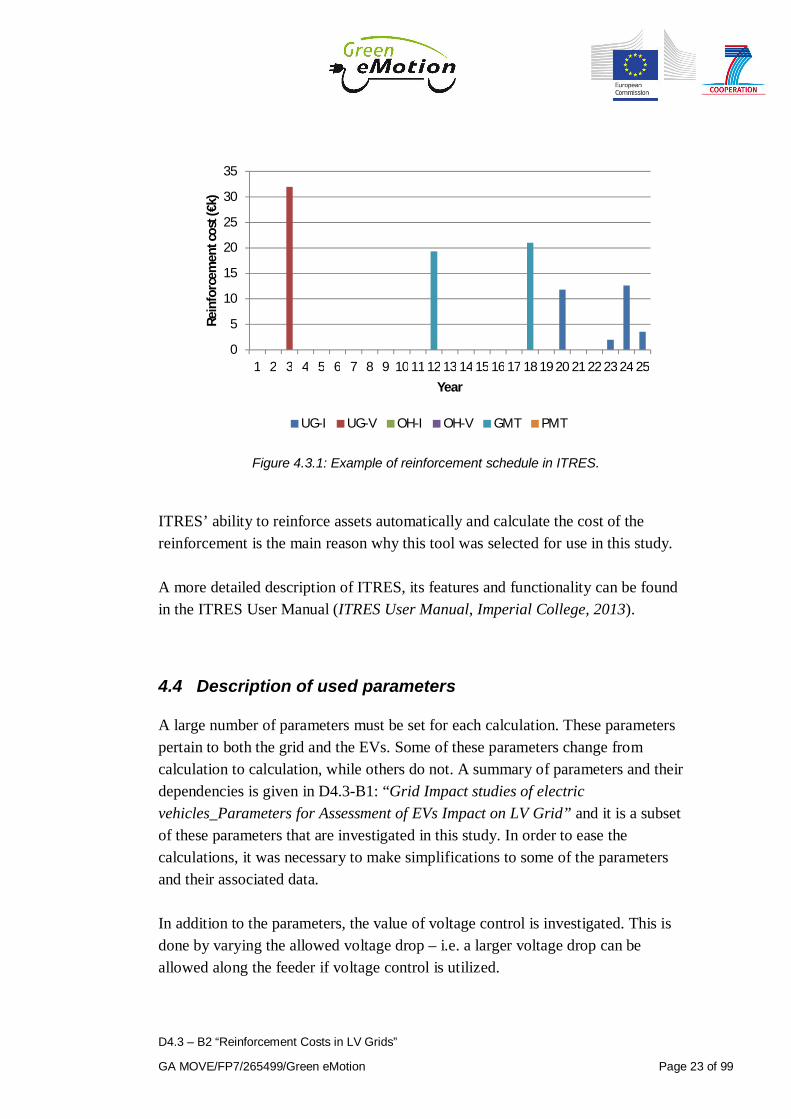
The daily load profile of the Danish networks is based on Smart Metermeasurements of individual customers. A set of load profiles covering 1 to 200customers is generated based on these Smart Meter measurements. They present astatistical worst case situation – something akin to the 99th percentile. Details ofhow the load profiles are produced can be found in D4.3-B1: “Grid Impact studiesof electric vehicles_Parameters for Assessment of EVs Impact on LV Grid” (Annex2). This set of load profiles gives a good representation of the daily load profile aswell as the simultaneity of the loads. An overview of the load profiles is shown inFigure 4.4.1.
Figure 4.4.1: Load profile set for Danish networks.

D4.3 – B2 “Reinforcement Costs in LV Grids”
GA MOVE/FP7/265499/Green eMotion Page 25 of 99
The daily load profile for the Italian and Spanish networks is based on ageneralized load profile. Generalized load profiles are based on measurements athigher voltage levels. Such measurements give an aggregated profile of manycustomers. Because such a measurement is only a single data point representingmany customers, the effect of simultaneity cannot be assessed.
This effect of simultaneity results in decreasing peak load per customer as thenumber of customers increases. Once the number of customers is sufficiently large,the load profile coincides with the generalized load profile for residential loads.The effect of simultaneity is important and it was therefore deemed necessary tohave it represented in the Italian and Spanish networks. From the Danish load dataa factor is generated that expresses the effect of simultaneity. This factor is shownin Figure 4.4.2.
Figure 4.4.2: Scaling factor for generalized load profiles used to account for loaduncertainty when dealing with few customers.
This factor is used to generate a set of daily load profiles for 1 to 200 customersthat account for simultaneity for Italian and Spanish networks, based on thegeneralized load profile for residential loads in these countries.
0
0,5
1
1,5
2
2,5
3
3,5
0 50 100 150 200
Scal
ing
fact
or
Number of loads

D4.3 – B2 “Reinforcement Costs in LV Grids”
Page 26 of 99 GA MOVE/FP7/265499/Green eMotion
This gives a complete set of load profiles covering 1 to 200 customers for each ofthe countries in the study. The three sets of load profiles can be found in AppendixFigure 8.1.1 - Figure 8.1.3.
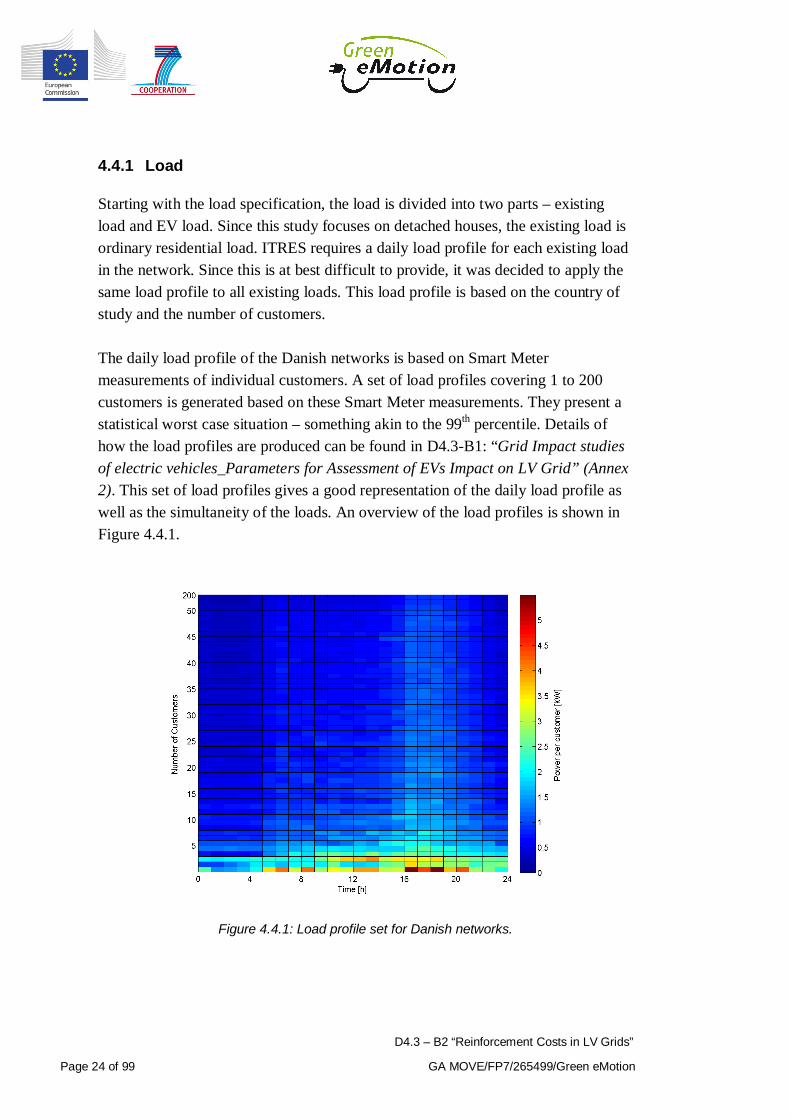
In the calculations a load offset is applied. It is used to increase the load in thenetwork until reinforcement occurs at a specific time (year 10). The load offset is aconstant power added to the daily load profile of all existing loads. By increasingthe load offset, the entire reinforcement schedule is moved ahead without affectingthe daily load variation or the EV penetration.An example of this is shown in Figure 4.4.3, which shows a daily load profilebeing offset, and the effect that it has on the reinforcement schedule. The entireschedule is moved ahead, which reveals additional reinforcement that was outsideof the 25 year schedule with no offset applied. The reinforcements still occur at thesame pace however, as the daily variations are unchanged.
D4.3 – B2 “Reinforcement Costs in LV Grids”
GA MOVE/FP7/265499/Green eMotion Page 27 of 99
0
0,1
0,2
0,3
0,4
0,5
0,6
0,7
0,8
1 2 3 4 5 6 7 8 9 10 11 12 13 14 15 16 17 18 19 20 21 22 23 24
Pow
erpe
rcus
tom
er[k
W]
Time [h]
Load without offset Load with offset
0
5
10
15
20
25
1 2 3 4 5 6 7 8 9 10 11 12 13 14 15 16 17 18 19 20 21 22 23 24 25
Rein
forc
emen
tcos
t(€k
)
Year
UG-I UG-V OH-I OH-V GMT PMT
0
5
10
15
20
25
1 2 3 4 5 6 7 8 9 10 11 12 13 14 15 16 17 18 19 20 21 22 23 24 25
Rein
forc
emen
tcos
t(€k
)
Year
UG-I UG-V OH-I OH-V GMT PMT
OffsetO
ffset
Figure 4.4.3: Example of load offset and its effect on the reinforcement schedule.
By using the offset it is possible to push the networks to the breaking point to findwhen issues arise and in which order the issues arise. By forcing the reinforcementschedule to begin in a predetermined year (year 10), it is possible to evaluate theinfluence of different parameters on the schedule. Furthermore, it is possible toalign the reinforcement schedules of different networks. By aligning thereinforcement schedules of different networks, it is ensured that the EV penetrationin the networks is comparable when considering the penetration as a percentage ofcustomers, making it possible to compare the results of different networks moresystematically.

D4.3 – B2 “Reinforcement Costs in LV Grids”
Page 28 of 99 GA MOVE/FP7/265499/Green eMotion
Year 10 was used as the target year to assure that there would be some EVs in thenetworks in the target year and that it was the EVs triggering the firstreinforcement, rather than the offset triggering it in year 1. While a later target yearthan year 10 would have resulted in more EVs at the time of the first reinforcement,it was expected that many of the scenarios would postpone reinforcementscompared to the baseline. Therefore it was decided to reserve more years of theschedule for seeing postponement of reinforcements than moving ahead ofreinforcements.
Load growth is not used in any of the calculations. The reason for this decision isthat load growth is applied as a factor to the daily load profile – this changes thedaily variation and amplifies the load peaks. Normally, such change to the loadcurve would be acceptable, but in this study it presents several issues.As the load dependent charging profile is created based on the variation of theexisting load, a change of the load variation would reduce the effectiveness of theload dependent profile, and it would no longer be optimal in regard to the existingload.The use of an offset also complicates the use of load growth, as the offset is appliedbefore the load growth factor. The net effect of this is that the applied load growthdepends on the offset and is not the same for all networks, which couldsignificantly skew the results. The effect can be explained by considering (4.4.1)and (4.4.2).
= ( ℎ)( ) + (4.4.1)
= ( ℎ)( + ) (4.4.2)
In (4.4.1) the load growth is only applied to the load profile. In (4.4.2), which iswhat happens with ITRES, the load growth is also applied to the offset. In the caseof (4.4.2), the offset is no longer just shifting the reinforcement schedule, but isdirectly affecting the rate at which load increases.
Additionally, the omission of load growth reduces the complexity of the analysis,as there is one less parameter to consider.

D4.3 – B2 “Reinforcement Costs in LV Grids”
GA MOVE/FP7/265499/Green eMotion Page 29 of 99
4.4.2 Charging power
In this study two different charging powers are used, designated “Slow” and“Fast”:
- Slow charging is charging with a single phase 16 A charger (3.7 kW).- Fast charging is charging with a three phase 32 A charger (22 kW).
Slow charging represents a typical home charger, as seen today. Fast charging ismore representative of commercial and public chargers, but may also find use ashome chargers in the future.
4.4.3 Charging profile
The charging profile of an EV will depend on the charge management strategy, thecharging power and the size and state of the battery. Charging power affects thecharge duration and thus the charging profile. In this study 3 different chargemanagement strategies have been employed:
- User dependent (UD) chargingThe EV is connected to the charger as soon as the user arrives at home. TheEV immediately starts charging at full power and continues charging at fullpower until the battery is full.
- Timer based (TB) chargingThe EV is prevented from charging in a specified time-interval. Otherwisethe same as the user dependent charging – i.e. the EV is connected to thecharger as soon as the user arrives at home and charges at full power(outside the blocked time interval) until the battery is full.
- Load dependent (LD) chargingThe EV is connected at home the entire day and varies its charging powerdepending on the load in the grid. This is an ideal scenario, where the EVuses a softcharger and has a whole day to charge its battery and the loadprofile of all existing loads is known.
The three charge management strategies have been selected to cover a range ofcontrol options designed to improve the grid friendliness of EVs. User dependentcharging is representative of how an EV operates today when used in households.Timer based charging represents a very simple control strategy to move EVcharging to a more grid friendly time of the day. In the case of introducing peakload tariffs, the result is likely to be a charging profile close to the timer basedprofile. The time of the day where EVs are not allowed to charge when using TBcharging, is a 3 hour window covering the evening load peak. The 3 hour window

D4.3 – B2 “Reinforcement Costs in LV Grids”
Page 30 of 99 GA MOVE/FP7/265499/Green eMotion
is selected on a country basis according to the evening load peak. While the loadprofiles for Italy and Spain also have a significant load peak in the morning andnoon respectively, there are no EVs connected to home chargers at these times ofthe day. The choice of a 3 hour window was a compromise between avoiding peakload hours and allowing the EVs enough time to charge, while keeping the controlas simple as possible.Load dependent charging is an ideal scenario that is meant to give an idea of whatcan be achieved if complex charge management strategies are utilized.
Based on the 3 charge management strategies, charging profiles are generated forslow charging and fast charging. The charging profiles are generated frominformation about time of departure, time of arrival and driving distance. Statisticaldata is used to produce probability density functions for each of these 3 parameters.Sampling of the three probability density functions is then used to produce thecharging profiles for each combination of charge management strategy andcharging power, producing 6 charging profiles. The charging profiles present astatistical worst case situation – something akin to the 99th percentile.The 6 charging profiles are produced as sets of charging profiles. Each set containsmultiple charging profiles that vary with the number of EVs. As the load profile,time of arrival and departure and driving distance are unique to each country, it hasbeen necessary to produce the 6 charging profile sets for each country. Thecharging profile sets for each country can be found in Appendix Figure 8.2.1-Figure 8.2.6. The charging profile sets for Denmark are shown in Figure 4.4.4 andFigure 4.4.5 as an example.

D4.3 – B2 “Reinforcement Costs in LV Grids”
GA MOVE/FP7/265499/Green eMotion Page 31 of 99
Figure 4.4.4: Charging profile sets for Danish networks for user dependent (UD) and timerbased (TB) charging with slow and fast chargers.
D4.3 – B2 “Reinforcement Costs in LV Grids”
Page 32 of 99 GA MOVE/FP7/265499/Green eMotion
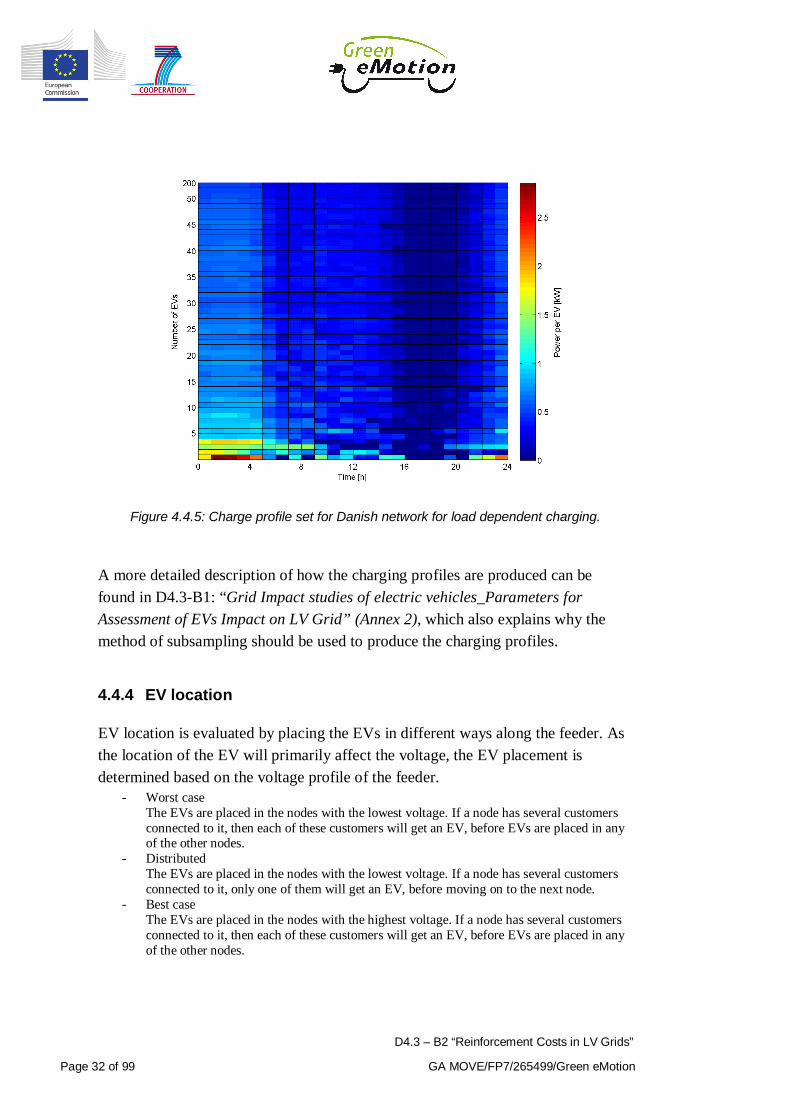
Figure 4.4.5: Charge profile set for Danish network for load dependent charging.
A more detailed description of how the charging profiles are produced can befound in D4.3-B1: “Grid Impact studies of electric vehicles_Parameters forAssessment of EVs Impact on LV Grid” (Annex 2), which also explains why themethod of subsampling should be used to produce the charging profiles.
4.4.4 EV location
EV location is evaluated by placing the EVs in different ways along the feeder. Asthe location of the EV will primarily affect the voltage, the EV placement isdetermined based on the voltage profile of the feeder.
- Worst caseThe EVs are placed in the nodes with the lowest voltage. If a node has several customersconnected to it, then each of these customers will get an EV, before EVs are placed in anyof the other nodes.
- DistributedThe EVs are placed in the nodes with the lowest voltage. If a node has several customersconnected to it, only one of them will get an EV, before moving on to the next node.
- Best caseThe EVs are placed in the nodes with the highest voltage. If a node has several customersconnected to it, then each of these customers will get an EV, before EVs are placed in anyof the other nodes.
D4.3 – B2 “Reinforcement Costs in LV Grids”
GA MOVE/FP7/265499/Green eMotion Page 33 of 99
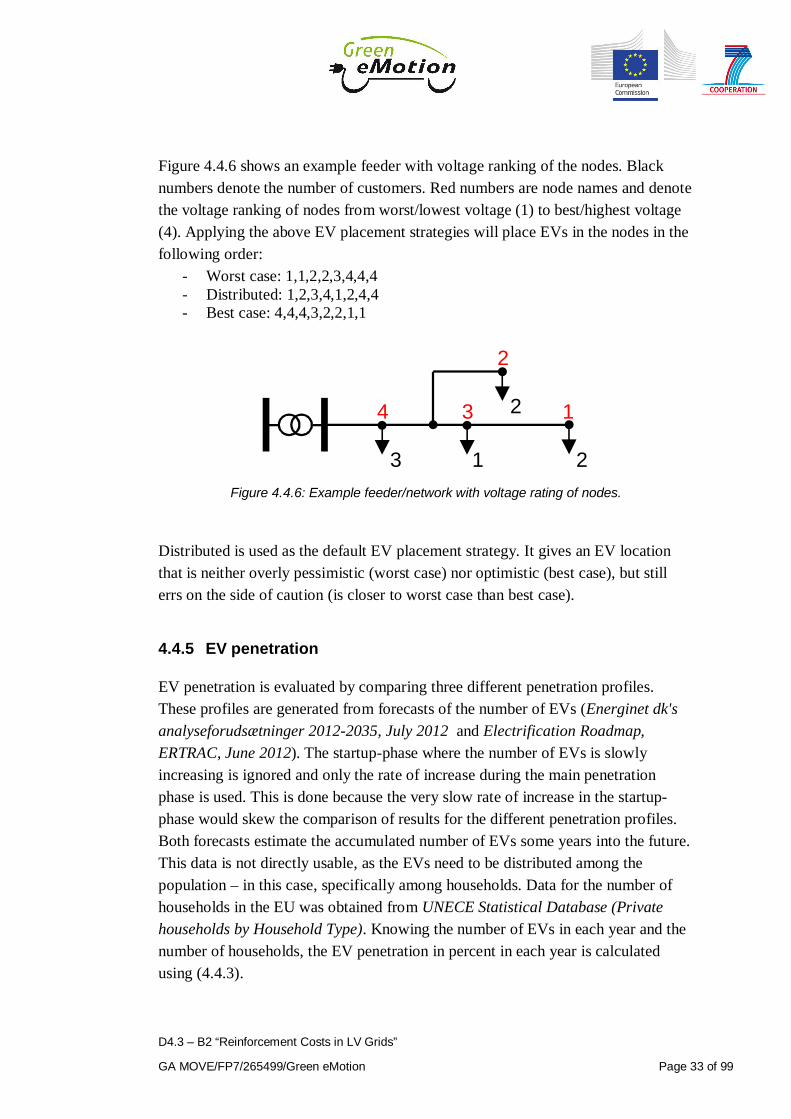
Figure 4.4.6 shows an example feeder with voltage ranking of the nodes. Blacknumbers denote the number of customers. Red numbers are node names and denotethe voltage ranking of nodes from worst/lowest voltage (1) to best/highest voltage(4). Applying the above EV placement strategies will place EVs in the nodes in thefollowing order:
- Worst case: 1,1,2,2,3,4,4,4- Distributed: 1,2,3,4,1,2,4,4- Best case: 4,4,4,3,2,2,1,1
1
2
34 2
213Figure 4.4.6: Example feeder/network with voltage rating of nodes.
Distributed is used as the default EV placement strategy. It gives an EV locationthat is neither overly pessimistic (worst case) nor optimistic (best case), but stillerrs on the side of caution (is closer to worst case than best case).
4.4.5 EV penetration
EV penetration is evaluated by comparing three different penetration profiles.These profiles are generated from forecasts of the number of EVs (Energinet dk'sanalyseforudsætninger 2012-2035, July 2012 and Electrification Roadmap,ERTRAC, June 2012). The startup-phase where the number of EVs is slowlyincreasing is ignored and only the rate of increase during the main penetrationphase is used. This is done because the very slow rate of increase in the startup-phase would skew the comparison of results for the different penetration profiles.Both forecasts estimate the accumulated number of EVs some years into the future.This data is not directly usable, as the EVs need to be distributed among thepopulation – in this case, specifically among households. Data for the number ofhouseholds in the EU was obtained from UNECE Statistical Database (Privatehouseholds by Household Type). Knowing the number of EVs in each year and thenumber of households, the EV penetration in percent in each year is calculatedusing (4.4.3).

D4.3 – B2 “Reinforcement Costs in LV Grids”
Page 34 of 99 GA MOVE/FP7/265499/Green eMotion
( ) = ℎ ℎ ( )
=( )
ℎ ℎ(4.4.3)
The three different penetration profiles are shown in Figure 4.4.7. The high profilecorresponds to the high forecast for Denmark. The medium profile corresponds tothe medium penetration forecast for Denmark and the high penetration forecast forEU. Both are representative of the expected evolution of EVs, based on anassumption of steady technological progress. The low profile corresponds to thelow penetration forecast for the EU.
Figure 4.4.7: EV penetration profiles for main network calculations (Low, Med, High) andbasic network evaluation (100).
4.4.6 Asset costs
In reinforcement mode ITRES separates the total cost into a supply cost (cost of theasset) and an installation cost (cost of installing the asset). Each asset class(underground cables, overhead lines and transformers) is divided into asset types(size of the asset), so the reinforcement cost depends on the size of the new asset –e.g. it is more expensive to reinforce with a 1000 kVA transformer than a 630 kVAtransformer.
00,10,20,30,40,50,60,70,80,9
1
EVsp
ercu
stom
er
Year
EV Penetration
Low
Med
High
100

D4.3 – B2 “Reinforcement Costs in LV Grids”
GA MOVE/FP7/265499/Green eMotion Page 35 of 99
The supply cost of each asset type is based on actual costs – i.e. the costs arerepresentative of the real price range of assets at the time of writing.
Installation costs are based on the total reinforcement costs stated by projectpartners and G4V-Grid for Vehicles - D5.3: Report with the recommendations forthe grid planning and operation. The installation cost of each asset class is thenadjusted, so the total cost of each asset class is roughly equal to the totalreinforcement costs stated by project partners and G4V-Grid for Vehicles - D5.3:Report with the recommendations for the grid planning and operation.
The total cost used by ITRES should thus be representative of the real costs ofreinforcement at the time of writing. The asset costs are shown in Table 4.4.1.
Asset type Total cost (€k/km) Asset Type Total cost (€k)
UG 0.4kV 50Al 69.5 GMT 0.4kV 100kVA 14.0
UG 0.4kV 95Al 71.9 GMT 0.4kV 200kVA 15.4
UG 0.4kV 150Al 75.0 GMT 0.4kV 400kVA 18.0
UG 0.4kV 240Al 79.9 GMT 0.4kV 500kVA 19.3
UG 0.4kV 300Al 83.2 GMT 0.4kV 630kVA 21.0
UG 0.4kV Inf 88.7 GMT 0.4kV 800kVA 23.3
UG 0.4kV Failsafe 95.0 GMT 0.4kV 1000kVA 25.9
OH 0.4kV 50Al 32.8 GMT 0.4kV Inf 33.8
OH 0.4kV 95Al 35.2 PMT 0.4kV 50kVA 3.4
OH 0.4kV 185Al 40.2 PMT 0.4kV 100kVA 3.4
OH 0.4kV 300Al 46.5 PMT 0.4kV Inf 3.4
OH 0.4kV Inf 52.0
OH 0.4kV Failsafe 65.0
Table 4.4.1: Asset Costs for ITRES calculations.
While most of Table 4.4.1 is straightforward, there are a few things to note. Firstly,overhead lines (OH) and pole mounted transformers (PMT) are unchanged fromthe Asset Cost template that was supplied with ITRES. The reason for this is that itwas not expected to see any PMTs in the networks, and very few, if any, overhead

D4.3 – B2 “Reinforcement Costs in LV Grids”
Page 36 of 99 GA MOVE/FP7/265499/Green eMotion
lines. However, prices for overhead lines were adjusted so the cost increase fromsize to size was similar to that of underground cables (UG).
For each asset class there is an “Inf” size. This is an “infinitely” large asset in eachclass. These “infinitely” large assets have electrical characteristics corresponding to2 parallel assets of the size before “Inf”. This means that there is still a voltage dropover these components. In some extreme cases, this voltage drop would requirevoltage reinforcement of “Inf” assets, which would cause the ITRES calculation tofail.Due to this, it was necessary to add a “Failsafe” size for underground cables (UG)and overhead lines (OH). These “Failsafe” asset types have zero impedance andthus no voltage drop.
4.5 Description of economic calculations
The economic calculations are an important part of this study. While the networkcalculations should give a good view of how the different parameters affect thereinforcement schedule, it is the economic calculations that will reveal the value ofdelaying and avoiding reinforcements. From an economic point of view, this valueis what will drive the market and what is available for investments in an attempt tomake EVs part of a more intelligent energy system. The economic calculations willattempt to quantify that value.
In ITRES each reinforcement is associated with a cost. That cost is the investmentthat needs to be made in each year of the reinforcement schedule. The cost isdefined according to the asset it concerns and categorized according to the kind ofissue it resolves. As the reinforcement cost is categorized by the issue it resolves, itshould be possible to determine which issues are more costly and thus morevaluable to delay or avoid.
The vast majority of the economic comparisons are made between three scenarios.The economic calculations are therefore constructed to calculate the cost of threescenarios and present and compare the results of these three scenarios.
Each scenario (A, B, and C) provides an investment horizon for six gridreinforcement categories over a 25 year time span. These investment horizons arethe reinforcement schedules produced by ITRES (see section 4.3) for the cases that

D4.3 – B2 “Reinforcement Costs in LV Grids”
GA MOVE/FP7/265499/Green eMotion Page 37 of 99
will be compared. A decision maker needs to understand the value of each scenarioand compare them individually in order assess the best option at hand. A list of allscenarios can be found in Appendix Table 8.4.1.
The value from deferred investments is generated from the time value of moneyconcept. An investor is better off investing 1 million Euros next year than today, asit gives the opportunity to invest the 1 million Euros now and earn an interest. Away of expressing this in the scenario comparisons is to use the method of netpresent value (NPV).
To calculate the value of each investment scenario, all the investments are turnedinto annual amortization representing the annual depreciation and interest paymentof each year.5 In the six grid asset categories multiple investments within the samecategory can occur at different times, and the amortizations start from the first yearand runs throughout the economic lifetime of the asset. The value generated simplyarises from two drivers; the value of the investments, and the difference in timingof the annual amortization.
The decision for which path to choose is taken in year 0. Therefore all investmentsmust be discounted back to the value they represent in year 0 in order to allowdecision makers to make the right choice. After lining up the annual amortizations,starting in different years they must be discounted back to year 0, to factor in valueof the lost opportunity which could have been achieved if an investor had chosen tokeep the money in the bank and earn risk-free interests. The present value of eachinvestment can now be summed and the scenarios can be compared accordingly(i.e. based on the NPV).
In the comparison, the potential revenues are neglected and the risk associated witheach scenario is assumed to be the same across investments and scenarios.Therefore, the right financial metric is the present value which represents the valueof investments in each scenario in year 0, as explained above. Assuming thatpotential revenues and the associated risk is the same across scenarios, a decision
5 In the calculations an economic lifetime of 35 years, a WACC of 7% and socio-economic discountrate of 5% are assumed.

D4.3 – B2 “Reinforcement Costs in LV Grids”
Page 38 of 99 GA MOVE/FP7/265499/Green eMotion
maker is best off choosing the scenario which represents the lowest present valueof investments.
D4.3 – B2 “Reinforcement Costs in LV Grids”
GA MOVE/FP7/265499/Green eMotion Page 39 of 99
5 Results and Analysis
As the complete results of the study consist of a large amount of data, the fullresults will not be presented in this report. Instead a summary of the maintendencies seen in the results will be given, with illustrative examples and a limitedrange of the complete results.
5.1 General Analysis
Before going into analysis of the different parameters, a simple evaluation of thenetworks is done with a fixed set of parameters (Calculation 0a to 0c). Thenetworks are evaluated with distributed EV location and slow chargers. Each of thethree charging profiles is evaluated with an EV penetration that increases linearlyfrom 0 to 100% throughout the 25 year timeframe of the ITRES calculations (seeFigure 4.4.7).
The results are summarized in Table 5.1.1. As seen in Table 5.1.1, most of thenetworks require reinforcement to accommodate 100% EVs. However, a large partof the networks can accommodate a significant amount of EVs (more than 30%),without any reinforcement. It is important to note that the charge managementstrategy is a crucial factor in determining how large an EV penetration thenetworks can accommodate before reinforcement is necessary. With loaddependent charging, all the networks can accommodate 100% EVs, except forNetwork 30, which requires reinforcement in the first year in order toaccommodate the existing load of the network.Timer based charging has a mixed influence, increasing the EV penetration beforefirst reinforcement in some networks and reducing it in others. The reason for thisbehavior is a kickback effect that occurs in the timer based charging profile. Amore detailed description of the kickback effect can be found in section (chargeprofile).

D4.3 – B2 “Reinforcement Costs in LV Grids”
Page 40 of 99 GA MOVE/FP7/265499/Green eMotion
Network
User Dependent ChargingFirst Reinforcement
Timer Based ChargingFirst Reinforcement
Load Dependent ChargingFirst Reinforcement
Year EVs (%) Year EVs (%) Year EVs (%)1 100% 24 95% 100%2 22 89% 21 82% 100%3 7 26% 7 26% 100%4 3 9% 5 17% 100%5 9 32% 9 32% 100%6 4 13% 4 13% 100%7 13 52% 13 52% 100%8 4 14% 5 18% 100%9 12 46% 13 54% 100%
10 10 38% 10 38% 100%11 19 75% 20 81% 100%12 19 19 77% 21 21 21 82% 100%13 17 70% 17 70% 100%14 100% 100% 100%15 21 86% 21 86% 100%16 100% 100% 100%17 100% 20 79% 100%18 22 88% 18 70% 100%19 100% 100% 100%20 7 25% 8 28% 100%21 22 88% 17 67% 100%22 12 46% 11 41% 100%23 6 20% 6 20% 100%24 100% 100% 100%25 17 66% 13 51% 100%26 14 54% 12 46% 100%27 100% 100% 100%28 11 42% 9 33% 100%29 10 38% 8 29% 100%30 1 0% 1 0% 1 0%31 24 95% 17 68% 100%32 2 5% 3 9% 100%33 100% 100% 100%
Table 5.1.1: Summary of general analysis. Highlights indicate the nature of the
reinforcement – voltage (red), current (blue) or transformer (cyan).

D4.3 – B2 “Reinforcement Costs in LV Grids”
GA MOVE/FP7/265499/Green eMotion Page 41 of 99
5.2 Baseline Analysis
The baseline calculation (calculation 1a) is made with medium EV penetration,distributed EV location, slow chargers and an allowed voltage drop of 5%.EN50160 specifies that voltage must remain within ±10% of nominal value. Sincethis voltage range covers voltage variation from all voltage levels, only a fractionof this voltage range can be allocated to voltage variation in the LV grid. Anallowed voltage drop of 5% is used because it is assumed that the rest of theEN50160 voltage range must be reserved for voltage variations in the mediumvoltage grid and the distribution transformer.
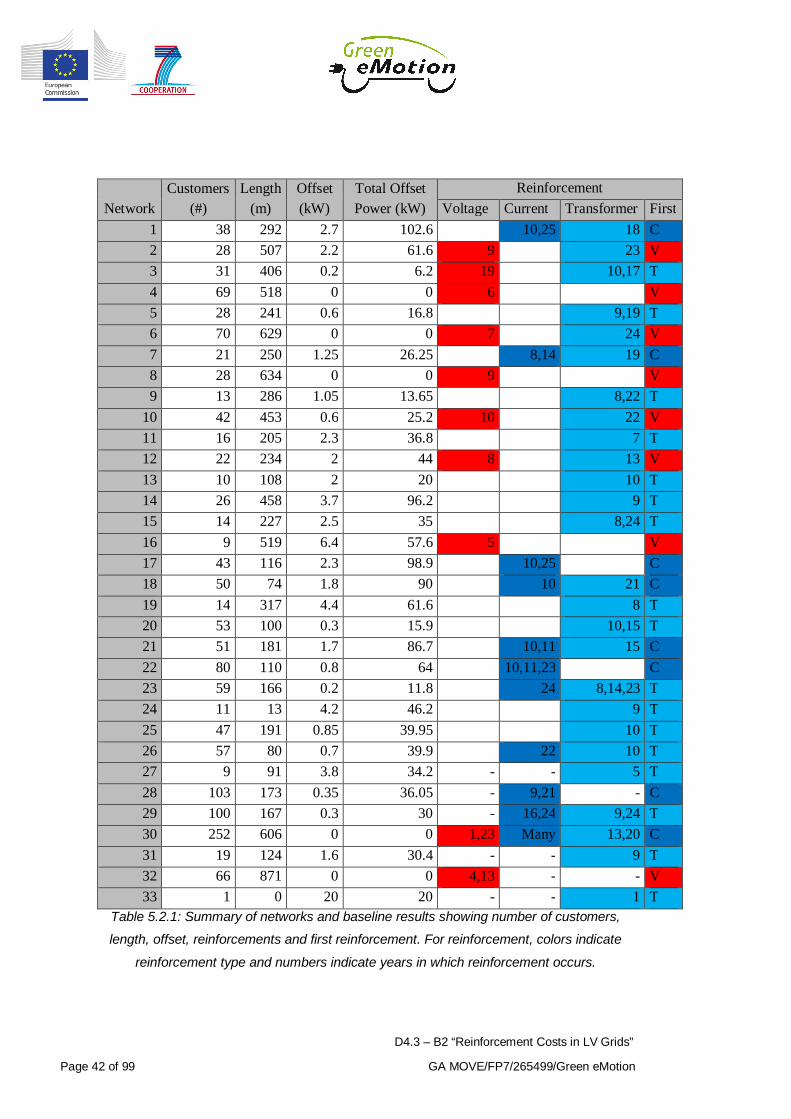
Table 5.2.1 shows an overview of the networks, specifying number of customers,length and offset. It also details the kind of reinforcements that occur in eachnetwork and in what year they occur.
D4.3 – B2 “Reinforcement Costs in LV Grids”
Page 42 of 99 GA MOVE/FP7/265499/Green eMotion
NetworkCustomers
(#)Length
(m)Offset(kW)
Total OffsetPower (kW)
ReinforcementVoltage Current Transformer First
1 38 292 2.7 102.6 10,25 18 C2 28 507 2.2 61.6 9 23 V3 31 406 0.2 6.2 19 10,17 T4 69 518 0 0 6 V5 28 241 0.6 16.8 9,19 T6 70 629 0 0 7 24 V7 21 250 1.25 26.25 8,14 19 C8 28 634 0 0 9 V9 13 286 1.05 13.65 8,22 T
10 42 453 0.6 25.2 10 22 V11 16 205 2.3 36.8 7 T12 22 234 2 44 8 13 V13 10 108 2 20 10 T14 26 458 3.7 96.2 9 T15 14 227 2.5 35 8,24 T16 9 519 6.4 57.6 5 V17 43 116 2.3 98.9 10,25 C18 50 74 1.8 90 10 21 C19 14 317 4.4 61.6 8 T20 53 100 0.3 15.9 10,15 T21 51 181 1.7 86.7 10,11 15 C22 80 110 0.8 64 10,11,23 C23 59 166 0.2 11.8 24 8,14,23 T24 11 13 4.2 46.2 9 T25 47 191 0.85 39.95 10 T26 57 80 0.7 39.9 22 10 T27 9 91 3.8 34.2 - - 5 T28 103 173 0.35 36.05 - 9,21 - C29 100 167 0.3 30 - 16,24 9,24 T30 252 606 0 0 1,23 Many 13,20 C31 19 124 1.6 30.4 - - 9 T32 66 871 0 0 4,13 - - V33 1 0 20 20 - - 1 T
Table 5.2.1: Summary of networks and baseline results showing number of customers,
length, offset, reinforcements and first reinforcement. For reinforcement, colors indicate
reinforcement type and numbers indicate years in which reinforcement occurs.

D4.3 – B2 “Reinforcement Costs in LV Grids”
GA MOVE/FP7/265499/Green eMotion Page 43 of 99
The networks can be divided into three groups:- Networks requiring voltage reinforcement- Networks requiring current reinforcement- Networks requiring transformer reinforcement
The voltage reinforced networks are characterized by a high length (more than400m to farthest node/load). There is one exception, and that is Network 12, whichhas a length of 234m and 22 customers. This network is rather weak however, withthe first 80m of it being 35mm2 aluminum cable, and 18 of the 22 customers placedtowards the far end of the feeder. Thus those 80m of 35mm2 aluminum cable aresupplying nearly all the customers, resulting in a high voltage drop across this partof the feeder.
The current and transformer reinforced networks are generally short (less than300m to the farthest node/load). A large part of them are very short (less than150m). There is one exception, and that is Network 14 with a length of 458m and26 customers. This network would be expected to be voltage reinforced, but thefeeder is constructed from 240mm2 and 150mm2 aluminum cables and a fairlysmall transformer. Due to this, the transformer needs to be reinforced before thenetwork runs into any voltage issues. Closer inspection shows that the network isclose to violating the voltage drop limit and had it been supplied by a largertransformer would likely run into voltage issues first.
For the current reinforced networks it generally applies that they have manycustomers (more than 50). The high amount of customers on the feeders means thata larger percentage of the transformer rating is reserved for those feeders, and thusthe cable ratings are exceeded first. However, outside of a few exceptions, all thecurrent reinforced networks are also transformer reinforced. For the fewexceptions, the reserved transformer rating is high (more than 200 kVA).
The transformer reinforced networks generally have few customers (often less than20). The reason for this is that when a feeder has few customers, less of thetransformer rating is reserved for the feeder. More notably, the reservedtransformer rating is mostly between 50 and 100 kVA for the feeders that aretransformer reinforced first. As most feeders start with 95mm2 or 150mm2
aluminum cables, which are rated at roughly 120 and 150 kVA, the transformerwill be reinforced first if the reserved rating is less than those values.

D4.3 – B2 “Reinforcement Costs in LV Grids”
Page 44 of 99 GA MOVE/FP7/265499/Green eMotion
There are a few networks that need special mention, as they present some specialcases.
- Network 30 is voltage and current reinforced in year one. At this point intime, there are no EVs in the network, so the existing load is more than thenetwork can handle.
- Network 33 is transformer reinforced in year one. This network consists ofa single customer connected directly to the transformer, so only transformerreinforcement can be expected.
- Networks 28 and 29 both have a cable reinforcement to “Inf” (see section4.4.6), indicating that in these two networks low-voltage cablereinforcement may not be sufficient and that more extensive reinforcementin the form of MV reinforcement may be necessary.
5.3 Voltage control
Voltage control can be used to avoid voltage reinforcements in networks, but hasno real effect on other types of reinforcement. Thus this section is only of interestin regard to the voltage reinforced networks.
Voltage control in low-voltage networks can be performed in different ways. Forthis study, the way of performing voltage control is not of interest. The use ofvoltage control allows for better utilization of the allowable voltage range specifiedin EN50160 – i.e. less of the voltage range in EN50160 has to be reserved forvoltage variations in the medium voltage grid and distribution transformer. Thisbetter utilization is expressed in these calculations by allowing a larger voltagedrop in the LV network. This is practically done by changing the voltage setpointand minimum voltage for the calculations (see scenario 2.1 and 2.2 in Table 8.4.1).The economic comparison to the base case (scenario 1a) for all networks can befound in Appendix Table 8.3.3 and Table 8.3.4.
5.3.1 Network impact
For the voltage reinforced networks, the results show that voltage control results inbig changes to the reinforcement schedule. For current and transformer reinforcednetworks, however, voltage control is of no importance.
D4.3 – B2 “Reinforcement Costs in LV Grids”
GA MOVE/FP7/265499/Green eMotion Page 45 of 99
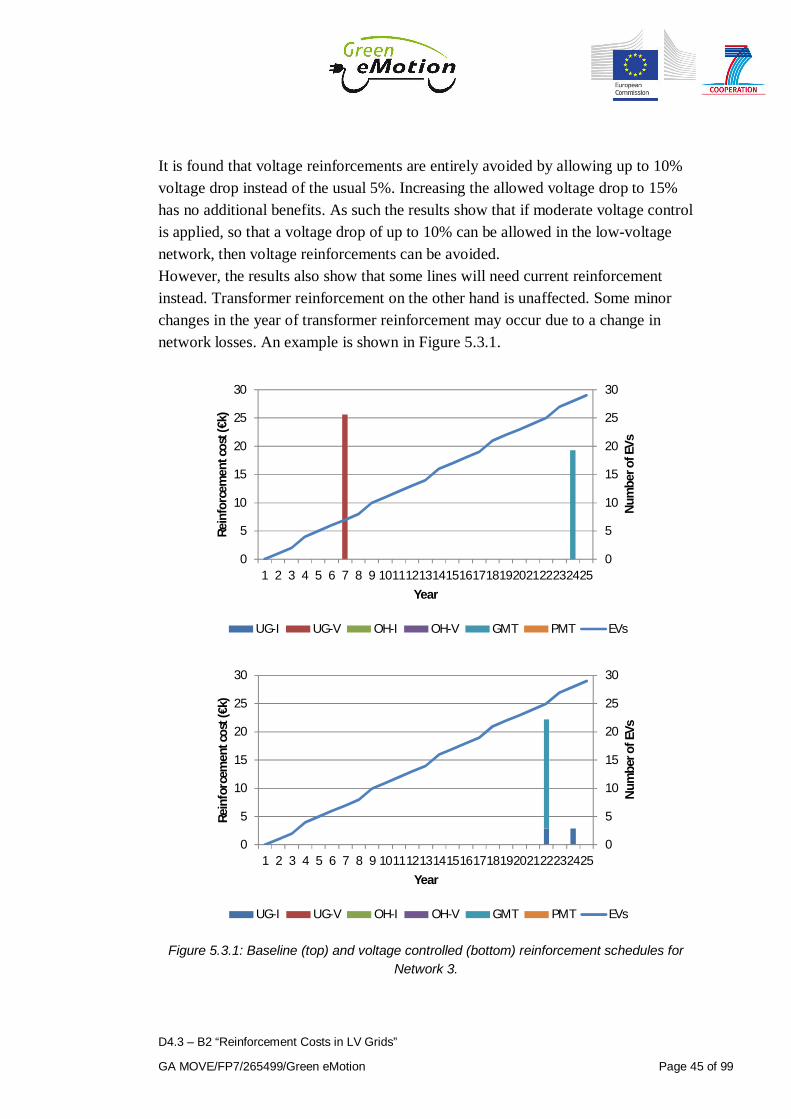
It is found that voltage reinforcements are entirely avoided by allowing up to 10%voltage drop instead of the usual 5%. Increasing the allowed voltage drop to 15%has no additional benefits. As such the results show that if moderate voltage controlis applied, so that a voltage drop of up to 10% can be allowed in the low-voltagenetwork, then voltage reinforcements can be avoided.However, the results also show that some lines will need current reinforcementinstead. Transformer reinforcement on the other hand is unaffected. Some minorchanges in the year of transformer reinforcement may occur due to a change innetwork losses. An example is shown in Figure 5.3.1.
0
5
10
15
20
25
30
0
5
10
15
20
25
30
1 2 3 4 5 6 7 8 9 10111213141516171819202122232425
Num
bero
fEVs
Rein
forc
emen
tcos
t(€k
)
Year
UG-I UG-V OH-I OH-V GMT PMT EVs
0
5
10
15
20
25
30
0
5
10
15
20
25
30
1 2 3 4 5 6 7 8 9 10111213141516171819202122232425
Num
bero
fEVs
Rein
forc
emen
tcos
t(€k
)
Year
UG-I UG-V OH-I OH-V GMT PMT EVs
Figure 5.3.1: Baseline (top) and voltage controlled (bottom) reinforcement schedules forNetwork 3.
D4.3 – B2 “Reinforcement Costs in LV Grids”
Page 46 of 99 GA MOVE/FP7/265499/Green eMotion
5.3.2 Economic impact
As voltage reinforcements are usually fairly extensive in nature, the economicimpact of avoiding them is quite significant. While not all voltage reinforcednetworks have voltage reinforcement as the first reinforcement, the results of allvoltage reinforced networks are very similar. On average, the reinforcement costsare 19.8 €k lower in the networks with voltage control, with sums varying from 7.6€k to 30.8 €k. In terms of network value this corresponds to an average of 28.2%with variations from 14.4% to 40.6%.
5.3.3 Subconclusion
The results show that with a moderate amount of voltage control (i.e. a largerallowed voltage drop), voltage reinforcement can be entirely avoided in all thestudied networks, leading to an average economic gain of 19.8 €k for the networksthat required voltage reinforcement.The limited amount of voltage control required to avoid voltage reinforcements andthe fast following current reinforcements in some of the networks indicate thatreactive power may not be a useful solution of voltage issues in some low-voltagenetworks – especially given their low voltage sensitivity to reactive power.
5.4 Location
Location is primarily important in regard to voltage and voltage reinforcement.While it also affects current reinforcements, it does so to a much lower degree. Thissection is based on scenarios 3.1 and 3.2 and the different ways of distributing theEVs are explained in section 4.4.4. For economic comparison to the base case(scenario 1a) for all the networks see Appendix Table 8.3.5 and Table 8.3.6.

D4.3 – B2 “Reinforcement Costs in LV Grids”
GA MOVE/FP7/265499/Green eMotion Page 47 of 99
5.4.1 Network impact
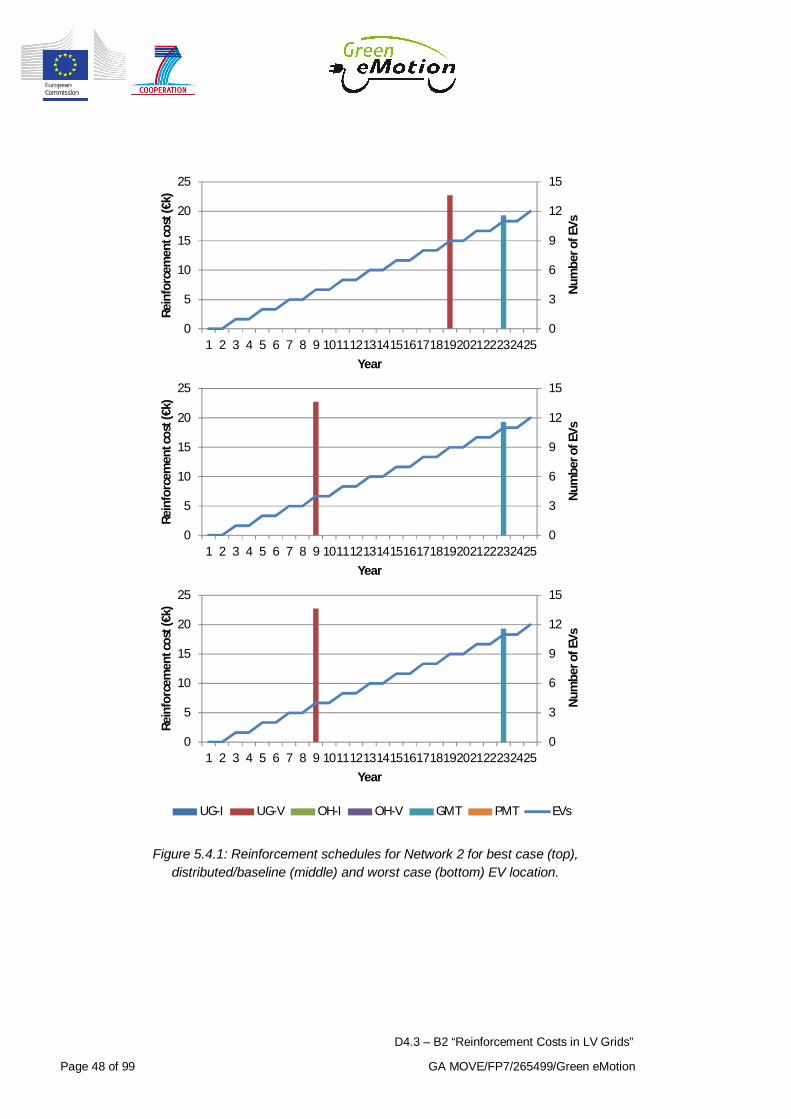
For voltage reinforced networks, a best case EV location will either delay voltagereinforcement significantly (more than 5 years) or avoid it entirely compared todistributed EV location. Some of the lines that were previously voltage reinforcedwill have to be current reinforced instead, while transformer reinforcement isunaffected. For current reinforced networks, some lines are reinforced later, or thereinforcement avoided. This is not surprising, given that fewer lines are beingloaded by the EVs, as they are all placed at the beginning of the network/feeder.However the effect is fairly limited, the lines at the beginning of the network areusually the strongest, thus requiring a significant amount of EVs before they areoverloaded.
Looking at worst case EV location, it is found that in most cases, there is littledifference in the reinforcement schedule compared to the distributed case. This isbecause the networks often have few customers at the far end, and thus the EVlocations in the two cases end up being very similar. In networks where there aremore customers at the far end, worst case EV location results in voltage and currentreinforcements having to be made earlier and sometimes also requires more lines tobe voltage or current reinforced.
An example of how location impacts the reinforcement schedule of voltagereinforced networks is shown in Figure 5.4.1.
D4.3 – B2 “Reinforcement Costs in LV Grids”
Page 48 of 99 GA MOVE/FP7/265499/Green eMotion
0
3
6
9
12
15
0
5
10
15
20
25
1 2 3 4 5 6 7 8 9 10111213141516171819202122232425
Num
bero
fEVs
Rein
forc
emen
tcos
t(€k
)
Year
UG-I UG-V OH-I OH-V GMT PMT EVs
0
3
6
9
12
15
0
5
10
15
20
25
1 2 3 4 5 6 7 8 9 10111213141516171819202122232425N
umbe
rofE
Vs
Rein
forc
emen
tcos
t(€k
)
Year
UG-I UG-V OH-I OH-V GMT PMT EVs
0
3
6
9
12
15
0
5
10
15
20
25
1 2 3 4 5 6 7 8 9 10111213141516171819202122232425
Num
bero
fEVs
Rein
forc
emen
tcos
t(€k
)
Year
UG-I UG-V OH-I OH-V GMT PMT EVs
Figure 5.4.1: Reinforcement schedules for Network 2 for best case (top),distributed/baseline (middle) and worst case (bottom) EV location.

D4.3 – B2 “Reinforcement Costs in LV Grids”
GA MOVE/FP7/265499/Green eMotion Page 49 of 99
5.4.2 Economic impact
The network results showed that it was primarily the voltage reinforced networksthat were affected. The economic results reflect the network results and show thatlocation can be a quite important parameter for these networks.
Looking at best case EV location the economic results show that for voltagereinforced networks, the economic gain compared to the distributed case is 13.3 €kon average, spanning values of 7.2 €k to 22.8 €k. In terms of network value thiscorresponds to an average of 18.8%, with variations from 8.3% to 35%. Looking atall other networks, most see no difference. For those that do, the best casedistribution gives a reinforcement cost that is on average 1.9 €k lower,corresponding to 4.9% of network value. This result, however, is heavily affectedby Network 29, which sees an economic gain of 8.3 €k, corresponding to 23.1% ofnetwork value.
When comparing the distributed case to the worst case, it is found that on averagethe reinforcement costs for voltage reinforced networks are 5.3 €k higher with theworst case distribution of EVs. In terms of network value this corresponds to 7% ofnetwork value. While the majority of the other networks do not see an economiceffect between the two distributions, some do. For those that do, the averagereinforcement costs are 725 € higher (corresponding to 2.1% of network value),which is a very moderate amount.
5.4.3 subconclusion
The results show that for current and transformer reinforcements, the location is oflittle importance given that neither the network nor economic impact is significantin any of the networks. The location of EVs is only important in networks thatexperience voltage issues, where the average economic difference between worstcase and best case EV location is 18.6 €k.

D4.3 – B2 “Reinforcement Costs in LV Grids”
Page 50 of 99 GA MOVE/FP7/265499/Green eMotion
5.5 Charging profile
This section is based on many different scenarios, as the charging profiles dependon the number of EVs and the charging power. The charging profiles are explainedin section 4.4.3. For economic comparisons between the charging profiles for allthe networks see Appendix Table 8.3.1, Table 8.3.2 and Table 8.3.7 to Table8.3.12.
5.5.1 Network impact
The effect of changing the charging profile is compared across several cases,namely low, medium and high penetration. Going from user dependent charging totimer based charging, it is found that for a low number of EVs the effect on thereinforcement schedule is positive. The peak load is reduced by moving the EVcharging away from the existing load peak.However, with a higher number of EVs, the effect on the reinforcement schedule isnegative. The peak load increases, but the time at which the peak load occurs haschanged. The peak occurs in the hour after release of the EVs. The reason for this isa kickback effect that occurs when preventing the EVs from charging in a giventimeframe. With a high number of EVs the effect of simultaneity will reduce theEV peak load. However, when the EVs are prevented from charging in the existingload peak, the effect of reduced simultaneity will be removed and the EVs will nolonger have their charging distributed across the evening hours. Instead they willall charge at the same time and thus produce a higher peak load. The higher theamount of EVs, the more pronounced the kickback effect. This is clear from Figure4.4.4, where the charging profiles for user dependent and timer based charging areshown.
With low penetration the overall effect in the networks is positive. This is due tothe low amount of EVs introduced in the low penetration case.
In the medium penetration case, the effect largely depends on the number ofcustomers. In networks with few customers, the overall effect is positive andreinforcement is delayed or avoided. In networks with many customers and thusmany EVs, the effect is different. The first reinforcements are delayed, as thenumber of EVs is low in the beginning of the reinforcement schedule. But as thenumber of EVs increases, during the last years, the kickback effect takes over and

D4.3 – B2 “Reinforcement Costs in LV Grids”
GA MOVE/FP7/265499/Green eMotion Page 51 of 99
the later reinforcements are moved ahead and the amount of reinforcementincreases. The overall effect when evaluating the final year is therefore negative.An example of the effect of kickback on the reinforcement schedule is shown inFigure 5.5.1.
05101520253035404550
02468
101214161820
1 2 3 4 5 6 7 8 9 10111213141516171819202122232425
Num
bero
fEVs
Rein
forc
emen
tcos
t(€k
)
Year
UG-I UG-V OH-I OH-V GMT PMT EVs
05101520253035404550
02468
101214161820
1 2 3 4 5 6 7 8 9 10111213141516171819202122232425
Num
bero
fEVs
Rein
forc
emen
tcos
t(€k
)
Year
UG-I UG-V OH-I OH-V GMT PMT EVs
Figure 5.5.1: Reinforcement schedules for Network 28 with medium EV penetration anduser dependent (top) and timer based (bottom) charging.
For the high penetration case, the effects seen in the medium penetration casecontinue. As the number of EVs is higher in this case, the overall effect on thenetworks is much more affected by the kickback effect and the effect on thereinforcement schedules is more negative overall.
D4.3 – B2 “Reinforcement Costs in LV Grids”
Page 52 of 99 GA MOVE/FP7/265499/Green eMotion
In the fast charging case, the kickback effect is much more pronounced, as is clearfrom Figure 4.4.4. As such, the use of the timer based charging profile has a verynegative effect on the reinforcement schedule.
The load dependent charging profile removes the need for all reinforcements, as itdoes not increase the peak load of the networks. The exception to this is found inthe case of the Spanish networks. The reason that these networks still see anamount of reinforcement is that the idealized load dependent charging profileactually increases the peak load of the networks, as all the energy required by theEVs cannot be moved away from the existing load peak.
5.5.2 Economic impact
The economic effect of controlling the charging profile is very mixed, whencomparing the timer based charging profile to the user dependent charging profile.The reason for this is the kickback effect seen with timer based charging.
Starting with the low penetration case, most of the networks do not require anyreinforcement. However, looking at the networks that do require reinforcementthere is an economic gain of 8.7 €k on average, with values spanning from 3.9 €kto 14.6 €k. In terms of network value this corresponds to an average of 18.1%, withvariations from 2.9% to 47%.
Looking at medium penetration the economic results are quite different. Theaverage economic gain is 90 € if viewed across all 33 networks. That average is aresult of 3 distinctly different cases – networks where an economic loss is seen,networks where no economic impact is seen and networks that see an economicgain. The networks where an economic gain is seen as a result of moving from userdependent charging to timer based charging on average see an economic gain of 3.3€k (corresponding to 8.5% of network value). However, the networks where thereis an economic loss have an average loss of 5.7 €k (corresponding to 13.5% ofnetwork value). This shows that in the networks used in this study, there are morenetworks that experience a positive impact from using timer based charging, thanthere are networks which experience a negative impact.

D4.3 – B2 “Reinforcement Costs in LV Grids”
GA MOVE/FP7/265499/Green eMotion Page 53 of 99
The high penetration case continues the trend seen in the medium penetration case.However, the negative impact from kickback is much more apparent in the highpenetration case. Looking across all networks, there is an average economic loss of6.3 €k (corresponding to 14% of network value). This comes from many of thenetworks experiencing a significant kickback effect. For the networks experiencinga loss, the average economic loss is 11.4 €k (corresponding to 26.3% of networkvalue). The networks that see an improvement see an average economic gain of 2€k (corresponding to 6.2% of network value). A few of the networks see noeconomic impact.
Comparing the load dependent charging profile to the user dependent chargingprofile, the economic gains from using load dependent charging largely mirrors thereinforcement costs with user dependent charging. This is not surprising given thenetwork results, which showed that using load dependent charging preventedreinforcement in nearly all networks, as it moved the EV charging entirely awayfrom the existing load peak. This is true regardless of EV penetration.The average economic gains across all networks for low, medium and high EVpenetration are 11.4 €k, 21.5 €k and 38.5 €k, respectively. In terms of networkvalue this corresponds to 19.2%, 50.5% and 92.8%.
5.5.3 Subconclusion
The results for timer based charging show that even simple control of EV chargingcan be of benefit to the grid. However, attention must be paid to kickback. As theresults show, the kickback effect can be a severe issue and end up loading thenetworks more than when no control is applied to EV charging, thus leading toincreased reinforcement costs. Kickback presents a serious issue that must beaddressed by any charge management strategy that aims to move EV chargingaway from the existing peak load. If kickback is controlled, even simple measureslike timer based charging could benefit the network and postpone reinforcementsseveral years.
Looking at complex charge management strategies, the results for load dependentcharging show that in most cases EV charging can be moved entirely away fromthe existing load peak. Load dependent charging avoids all reinforcement of the
D4.3 – B2 “Reinforcement Costs in LV Grids”
Page 54 of 99 GA MOVE/FP7/265499/Green eMotion
networks and the associated costs, and shows the value that a complex chargemanagement strategy can provide.
5.6 EV penetration
This section is based on scenarios 4.1 and 4.2. The EV penetrations used areexplained in section 4.4.5. For economic comparisons between the EV penetrationsfor all the networks see Appendix Table 8.3.13 to Table 8.3.18.
5.6.1 Network impact
When it comes to EV penetration, each charging profile must be viewed separately.Starting with the user dependent profile, it is clear that the EV penetration has alarge impact on the reinforcement. In the low penetration case, most of thenetworks require no reinforcement to deal with the load. For the few networks thatdo require reinforcement, compared to the medium penetration case, thereinforcements are postponed significantly and occur during the last years of thereinforcement schedule.A high EV penetration results in significantly higher amount of reinforcement. Thereinforcement schedule is also pushed forward. In several of the networks lines arereinforced multiple times and end up being reinforced to “Inf”. This means thattraditional line reinforcement may not be sufficient, and that a more extensivereinforcement may be required – i.e. an MV grid reinforcement. An example isshown in Figure 5.6.1.
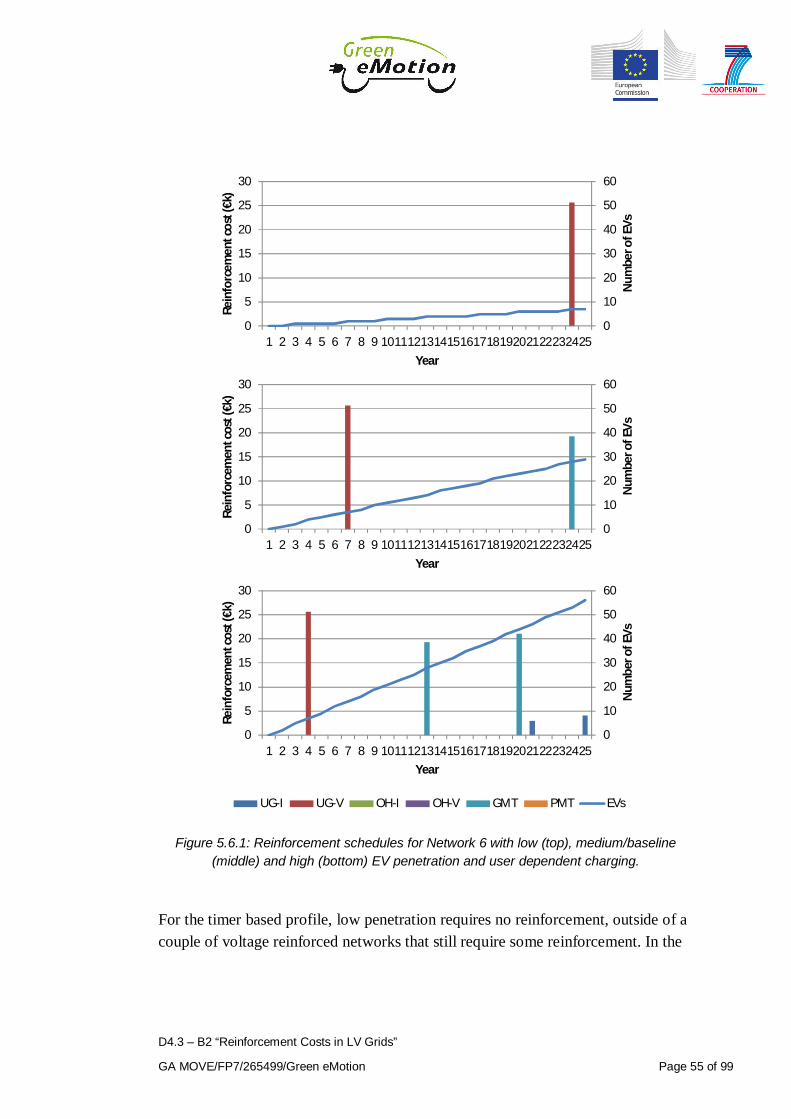
D4.3 – B2 “Reinforcement Costs in LV Grids”
GA MOVE/FP7/265499/Green eMotion Page 55 of 99
0
10
20
30
40
50
60
0
5
10
15
20
25
30
1 2 3 4 5 6 7 8 9 10111213141516171819202122232425
Num
bero
fEVs
Rein
forc
emen
tcos
t(€k
)
Year
UG-I UG-V OH-I OH-V GMT PMT EVs
0
10
20
30
40
50
60
0
5
10
15
20
25
30
1 2 3 4 5 6 7 8 9 10111213141516171819202122232425
Num
bero
fEVs
Rein
forc
emen
tcos
t(€k
)
Year
UG-I UG-V OH-I OH-V GMT PMT EVs
0
10
20
30
40
50
60
0
5
10
15
20
25
30
1 2 3 4 5 6 7 8 9 10111213141516171819202122232425
Num
bero
fEVs
Rein
forc
emen
tcos
t(€k
)
Year
UG-I UG-V OH-I OH-V GMT PMT EVs
Figure 5.6.1: Reinforcement schedules for Network 6 with low (top), medium/baseline(middle) and high (bottom) EV penetration and user dependent charging.
For the timer based profile, low penetration requires no reinforcement, outside of acouple of voltage reinforced networks that still require some reinforcement. In the
D4.3 – B2 “Reinforcement Costs in LV Grids”
Page 56 of 99 GA MOVE/FP7/265499/Green eMotion
two voltage reinforced networks that do require reinforcement, the reinforcement ispostponed significantly.In the high penetration case the need for reinforcement increases significantlycompared to the medium penetration case. A significant part of the networksrequires line reinforcement to “Inf”, and a few require transformer reinforcement to“Inf”. Traditional line and transformer reinforcement may not be sufficient forthese networks and a more extensive reinforcement in the form of MVreinforcement may be necessary.
Looking at the load dependent profile, penetration has no influence on thereinforcement of most of the networks. The exception consists of a two Spanishnetworks that require transformer reinforcement in the late years of the highpenetration case. This is because EV charging during the existing load peak cannotbe entirely avoided in with the Spanish load profile, and with a high amount of EVsthe increase in peak load is significant enough to require reinforcement.
5.6.2 Economic impact
Starting with user dependent charging, the average economic gain of moving froma medium EV penetration to a low EV penetration is 19.1 €k, spanning values of 0to 51.3 €k. In terms of network value this corresponds to an average of 46.4%, withvariations from 0% to 134%. Moving from medium to high EV penetration resultsin an average economic penalty of 17.5 €k, spanning values of 0 to 48.9 €k. Interms of network value this corresponds to an average of 43.3%, with variationsfrom 0% to 131%.
Looking at the timer based case, the average economic gain of moving to low EVpenetration is 20.6 €k, spanning values from 0 to 73.7 €k. In terms of networkvalue this corresponds to an average of 49.1%, with variations from 0% to 134%.Moving to a high penetration incurs an average economic penalty of 23.9 €k,spanning values of 0 to 59.1 €k. In terms of network value this corresponds to anaverage of 57.9%, with variations from 0% to 185%.
In the case of load dependent charging, EV penetration plays no real role, as theEVs do not increase the peak load of the networks. Two networks see an impactfrom EV penetration. Both require transformer reinforcement in the late years of
D4.3 – B2 “Reinforcement Costs in LV Grids”
GA MOVE/FP7/265499/Green eMotion Page 57 of 99
the high penetration case, resulting in an economic penalty of 7.6 €k, compared tothe medium penetration case. This corresponds to 17% of network value.
5.6.3 Subconclusion
The results show that the influence of EV penetration depends highly on thecharging profile of the EVs. If the charging of the EVs is distributed well across theday by the use of an efficient charge management strategy, then EV penetrationbecomes less important. However, if the charging of EVs is not distributed wellacross the day, as is the case with user dependent and timer based charging, thereinforcement requirements and costs depend highly on the EV penetration. Thisstresses the importance of good forecasts of EV penetration.
5.7 Charging power
This section is based on scenario 5. Charging powers are explained in section 4.4.2.For economic comparisons between charging powers for all the networks seeAppendix Table 8.3.19 to Table 8.3.24.
5.7.1 Network impact
The charging power has a very large influence on the reinforcement schedule of thenetworks. Its influence however, depends highly on the charge managementstrategy. For the load dependent charging profile, there is no difference between theuse of a slow and fast charger. The reason for this is that the charging powerdepends on the load and never exceeds the power limit of the slow charger.
For the user dependent charging profile, the increase in charging power overloadsalmost all the networks beyond what can be handled with conventional line andtransformer reinforcement and more extensive reinforcement will likely benecessary – i.e. reinforcement of the MV grid. It is primarily the lines that needheavy reinforcement, as they end up being reinforced to “Inf” in many of thenetworks. The transformers end up being reinforced to “Inf” in a handful ofnetworks and do not require reinforcement as badly as the lines. See Figure 5.7.1
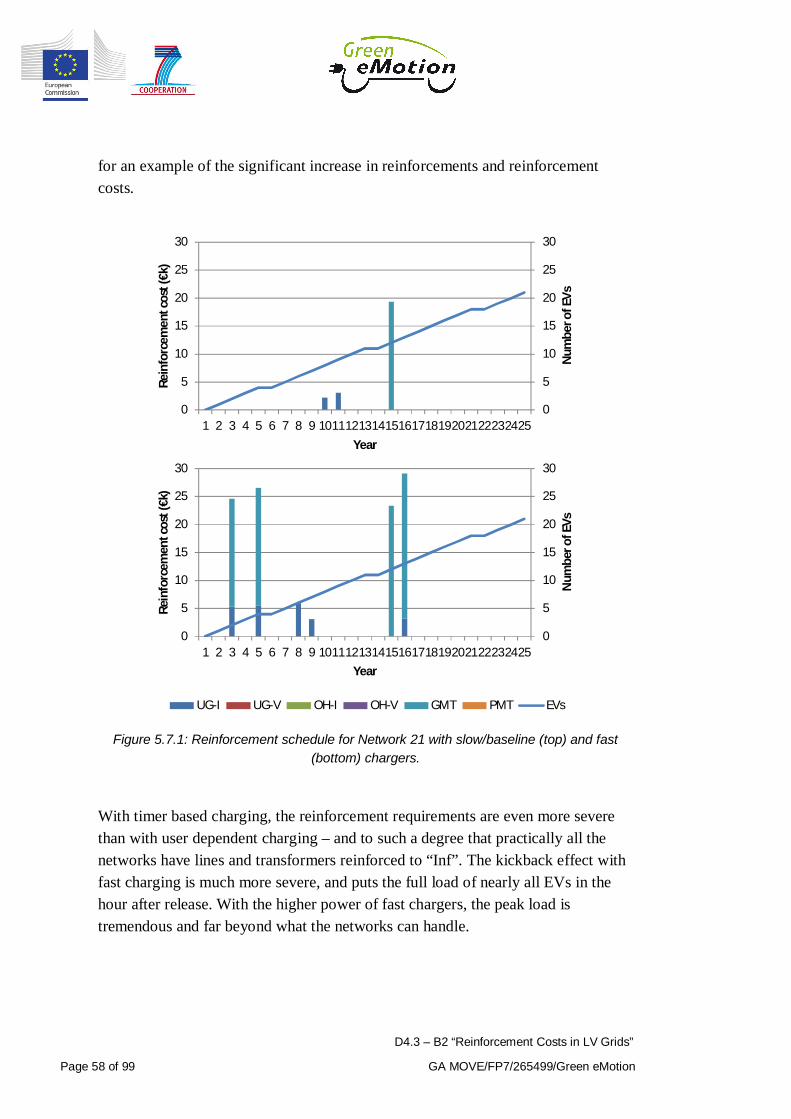
D4.3 – B2 “Reinforcement Costs in LV Grids”
Page 58 of 99 GA MOVE/FP7/265499/Green eMotion
for an example of the significant increase in reinforcements and reinforcementcosts.
0
5
10
15
20
25
30
0
5
10
15
20
25
30
1 2 3 4 5 6 7 8 9 10111213141516171819202122232425
Num
bero
fEVs
Rein
forc
emen
tcos
t(€k
)
Year
UG-I UG-V OH-I OH-V GMT PMT EVs
0
5
10
15
20
25
30
0
5
10
15
20
25
30
1 2 3 4 5 6 7 8 9 10111213141516171819202122232425
Num
bero
fEVs
Rein
forc
emen
tcos
t(€k
)
Year
UG-I UG-V OH-I OH-V GMT PMT EVs
Figure 5.7.1: Reinforcement schedule for Network 21 with slow/baseline (top) and fast(bottom) chargers.
With timer based charging, the reinforcement requirements are even more severethan with user dependent charging – and to such a degree that practically all thenetworks have lines and transformers reinforced to “Inf”. The kickback effect withfast charging is much more severe, and puts the full load of nearly all EVs in thehour after release. With the higher power of fast chargers, the peak load istremendous and far beyond what the networks can handle.

D4.3 – B2 “Reinforcement Costs in LV Grids”
GA MOVE/FP7/265499/Green eMotion Page 59 of 99
5.7.2 Economic impact
Looking at charging power, the network impact was quite severe, requiring largeparts of the networks to be reinforced several times. The economic impact is verysevere as well. With user dependent charging, the average economic penalty of fastchargers instead of slow chargers is 73.9 €k (corresponding to 181% of networkvalue). With timer based charging, where the kickback effect plays a larger role,the average economic penalty of going from slow chargers to fast chargers is 101.1€k (corresponding to 239% of network value). For the load dependent charging,there is no difference as the charging power remains lower than the 3.7 kW limit ofthe slow charger at all times.
5.7.3 Subconclusion
The results show that if a complex charge management strategy is used, chargingpower is of little concern, as the CMS keeps the actual charging power low andwell beneath the peak capacity of the charger. This also shows that in the case of acomplex CMS, the use of a fast charger only serves to allow the CMS moreflexibility in prioritizing which EVs to charge when.
In the case of simple charge management strategies charging power is veryimportant. As the charging power increases, the charging duration decreases, whichproduces short load peaks with high amplitudes. This effect is seen very clearlywith the timer based charging profile, as well as its substantially negative effect onreinforcement requirements and costs.
D4.3 – B2 “Reinforcement Costs in LV Grids”
Page 60 of 99 GA MOVE/FP7/265499/Green eMotion
6 Perspectives
Charge Management StrategyThe study showed that controlling the charging process has a great impact onreinforcement costs, but control loops are a very complex subject. While it can beof great benefit to the grid to control the charging of EVs, the results have shownthat one must tread carefully when employing different forms of control. Simpleforms of control, such as timer based charging are easy and inexpensive toimplement, but can introduce severe issues in the form of kickback if they are notimplemented in a correct manner. Complex forms of control, like load dependentcharging present an entirely different set of challenges. They are difficult andexpensive to implement, and require detailed and reliable information of futureevents in order to ensure that all EVs are fully charged when they are needed. Thiskind of control requires a suitable monitoring of the network and assets and aneffective way to perform the appropriate control actions. Additionally, the moregeneral effect of introducing more control loops into the grid must be considered.As the number of control loops grows, so does the overall complexity and the riskof different control loops affecting each other or the overall system negatively.Furthermore, it complicates the work of grid planers, as the interactions of differentgrid elements can become more difficult to understand.
In order to control EV charging, some form of measurements and communicationwith the EVs is necessary. The requirements for both depend on what sort ofcharge management strategy will be used. When evaluating the economic impact ofdifferent charge management strategies and their associated charging profiles, onemust remember the investments that must be made to facilitate the different chargemanagement strategies and the OPEX required to operate them. Whethercontrolling EV charging is cheaper than reinforcing can only be answered byconsidering grid reinforcement at a larger scale and multiple voltage levels. Such alarger scale analysis of reinforcement costs will be conducted in WP9.
Voltage issuesYet another concern is voltage. While the results showed that voltage control canalleviate many of the voltage reinforcements, it also showed that it is not always asuitable option. In some of the networks the thermal limit is exceeded only a few

D4.3 – B2 “Reinforcement Costs in LV Grids”
GA MOVE/FP7/265499/Green eMotion Page 61 of 99
years after the voltage drop limit. In these cases, voltage control would not be asuitable option, as one would need to reinforce the network regardless. The resultsshowed the impact of the physical and electrical location of EVs and theimportance of knowing where in the grid an EV is connected when evaluatingvoltages. However there is currently no way for DSOs to obtain such information.
Load BalanceAnother condition that one must consider is load balance. In this study all loads,including EVs, were balanced three phase loads. Home chargers for EVs today aresingle phase units. Unbalanced load imposes additional stress on the grid, andvoltage in particular can be significantly affected. Every single phase loadintroduced in the grid is a potential increase of unbalance in the grid. For countrieswhere residential premises are supplied with a single phase unbalance should be abigger concern than in countries where residential premises are supplied with 3phases. Smart Meters could help to map the load unbalance in the LV grid. Such amapping would allow for distributing single phase loads more evenly across thephases. For countries where residential premises are supplied with 3 phases, itshould be considered whether to connect EVs to the grid using single phasechargers or three phase chargers, and what benefits can be obtained from the use ofthree phase chargers.
Distributed GenerationWhile distributed generation was not considered in this study, it will be necessaryto consider the above mentioned topics for distributed generation as well.Distributed generation greatly affects voltage and load balance conditions on LVfeeders and will likely move reinforcements ahead. A control strategy fordistributed generation must be developed in order to integrate distributedgeneration in an effective manner.
Future WorkWhile the results of this study showed the economic impact of different parameterson low-voltage grid reinforcement, more work needs to be done in order tounderstand the impact EVs have on the higher voltage levels of the electrical grid.
The results of this study showed that there were cases where conventional low-voltage reinforcement of lines and transformers was not sufficient to accommodatethe EVs introduced in the networks, and suggested that reinforcement of the

D4.3 – B2 “Reinforcement Costs in LV Grids”
Page 62 of 99 GA MOVE/FP7/265499/Green eMotion
medium voltage grid was likely necessary. Future work should investigate theimpact of EVs on the medium voltage grid and the coordination required with theLV network. The medium voltage grid is designed and operated differently than thelow-voltage grid, and the costs associated with reinforcement of the mediumvoltage grid are different than those of low-voltage grids.
A large amount of data was necessary to perform this study. This data was notreadily available, and while it was possible to obtain some of the base data directly,other data was estimated based on what was obtainable. Future work shouldinvestigate what data is necessary and desirable for studies such as this one. Itshould be investigated how much of this data is readily available and how it isacquired, but more importantly focus on how to acquire data that is not available.More detailed information of existing load is needed, so load can be estimatedmore accurately. Such data about load could be obtained with Smart Meters, so thatload profiles can be generated in a way similar to what has been done in this study.Data that does not relate directly to the grid should also be considered, asinformation regarding driving patterns (e.g. time of departure and arrival) isnecessary to properly assess EV charging profiles.
As shown in D4.3-B1: D4.3-B1 Grid Impact studies of electricvehicles_Parameters for Assessment of EVs Impact on LV Grid (Annex 2), futurework should re-evaluate how different loads are estimated. Simplifications, such asscaling down averages obtained for a large amount of customers, may not besufficiently good to capture the challenges when dealing with few customers.Similarly, future work should evaluate if the way distributed generation, such asPV, is represented sufficiently well in current grid planning procedures or if newmethods are required.
Estimation of load does not only pertain to existing load conditions, but also tofuture load conditions. While estimation of existing load conditions can be aided bymeasurements, estimation of future load conditions is more difficult. Goodestimation of future load conditions, however, is crucial to the grid planningprocess, as grid assets have an expected lifetime of up to 40 years. Planninghorizons are usually shorter than asset lifetime, so while long term forecastsreaching up to 40 years into the future should not be forgotten, the focus should beon making more accurate and more frequent forecasts on a shorter timescale e.g. 10years. Long term forecasts are important when evaluating whether the current grid

D4.3 – B2 “Reinforcement Costs in LV Grids”
GA MOVE/FP7/265499/Green eMotion Page 63 of 99
structure and design is suitable for the future e.g. should reinforcement be made atlow or medium voltage. If the forecasts are incorrect and the grid has to bereinforced before reaching its designed lifetime, unexpected grid reinforcementsare necessary and the economic evaluation that was made during grid planning nolonger holds true. Such forecast errors often result in significantly higher costs thanwhat would have been incurred if a more expensive solution had been chosenduring the original grid planning. If the forecast has overestimated the future loadincrease, a too expensive solution would be chosen during grid planning, whichwould also be an economically non-optimal decision.
For this study, ITRES was the main tool. ITRES was developed as part of GeMT4.3, because there were no tools available that had the necessary functionality.This clearly demonstrates that going forward, new tools are necessary. While thecurrent tools are well suited for conventional grid planning, the onset of EVs anddistributed generation is challenging the current methods of evaluation used forgrid planning. Furthermore, a transition towards smarter grids, introduces newways of dealing with load, allowing control of loads. The optimal solution willdepend on the economic investment, and current tools are ill suited to comparedifferent solutions based on economic value, especially when the aspect of time isincluded as well. The future requires new tools to support new ways of evaluatingand comparing different solutions to the challenges presented by EVs, distributedgeneration and other new technologies.

D4.3 – B2 “Reinforcement Costs in LV Grids”
Page 64 of 99 GA MOVE/FP7/265499/Green eMotion
D4.3 – B2 “Reinforcement Costs in LV Grids”
GA MOVE/FP7/265499/Green eMotion Page 65 of 99
7 Conclusion
The impact of different parameters on low-voltage network reinforcement andreinforcement costs has been investigated. The parameters that were investigatedwere voltage control, EV location, EV charge management strategy, EVpenetration and EV charging power.
It was found that the importance of different parameters depended highly on thetopology of the networks. Networks with lengths of more than 400m betweensecondary substation and farthest customer were generally found to be impacted byvoltage issues first. Networks with lengths below 300m were generally found to beimpacted by thermal issues first. Networks with thermal issues could be dividedinto two groups – those that required current (line) reinforcement first and thosethat required transformer reinforcement first. In the evaluated networks thedeciding factor appeared to be the number of customers. Networks with fewcustomers were generally supplied by smaller transformers, thus exceeding thethermal limit of the transformer first. Networks with many customers on the otherhand were supplied by larger transformers, exceeding the thermal limit of the linesfirst.
Voltage control and EV location were found to only have a significant impact innetworks with voltage issues, while networks with thermal issues were largelyunaffected. For networks with voltage issues, EV location is an importantparameter.
EV charge management strategy, penetration and charging power were found tohave a profound impact on all networks, both with regards to networkreinforcement and reinforcement costs.The two simple charge management strategies showed a significant impact onnetwork reinforcement and reinforcement costs from both penetration and chargingpower. Two different charging powers were evaluated – 3.7 kW and 22 kW,corresponding to ordinary home chargers and fast chargers. It was found that use offast chargers increased network reinforcement and reinforcement costssubstantially. EV penetration rates were found to have a high impact on networkreinforcement and reinforcement costs as well. With low penetration and home

D4.3 – B2 “Reinforcement Costs in LV Grids”
Page 66 of 99 GA MOVE/FP7/265499/Green eMotion
chargers, the majority of the investigated networks required no reinforcement. Withhigh penetration, a significant increase in both network reinforcement andreinforcement costs was found.The large influence of both charging power and penetration rate show that goodforecasts of these parameters are crucial when evaluating the impact of EVs, asboth parameters have a significant influence on both network reinforcement andreinforcement costs.
The complex charge management strategy showed a very limited impact from EVpenetration and charging power. In the majority of the networks, no reinforcementswere seen regardless of EV penetration and charging power.This demonstrates that with more complex, i.e. grid friendly, charge managementstrategies, the other parameters evaluated in this study can become largelyinsignificant.
The study also revealed a need for new methods of estimating load, which requiremore detailed information. The new level of information requires new ways andmore dedicated efforts to acquire the necessary information, among other thingsstressing the need for more measurements in the electrical grid. For the purpose ofcollecting more detailed load information, Smart Meters can provide a great valuethat supports new methods of estimating load.
Furthermore, a need for new tools was found - tools which can estimate theeconomic impact of different solutions and tools that allow for more flexibilitywhen it comes to forecasts of load, so that grid planning can include new types ofloads.
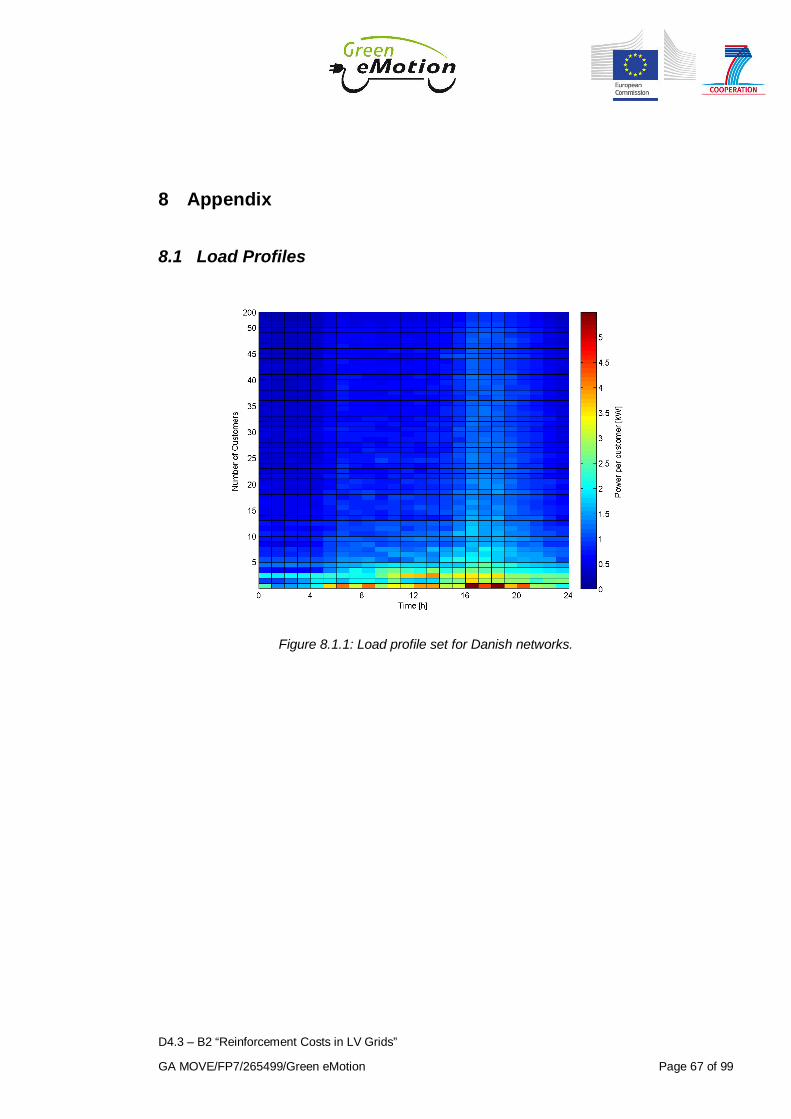
D4.3 – B2 “Reinforcement Costs in LV Grids”
GA MOVE/FP7/265499/Green eMotion Page 67 of 99
8 Appendix
8.1 Load Profiles
Figure 8.1.1: Load profile set for Danish networks.
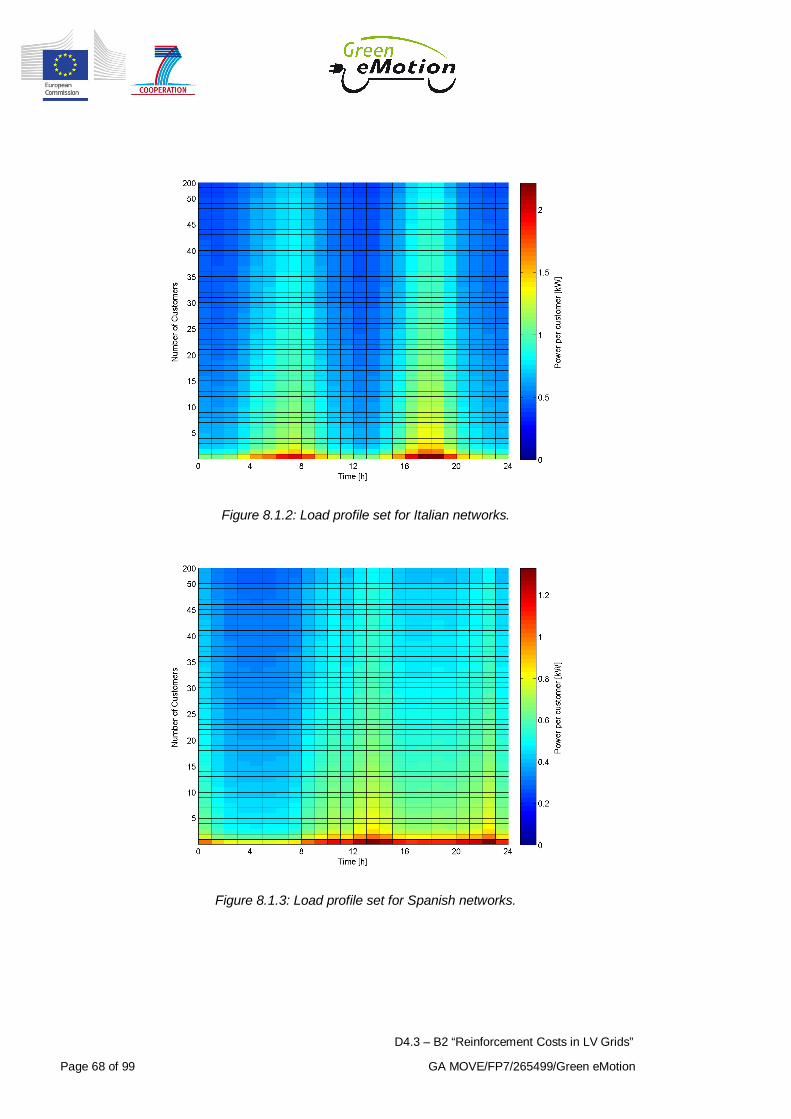
D4.3 – B2 “Reinforcement Costs in LV Grids”
Page 68 of 99 GA MOVE/FP7/265499/Green eMotion
Figure 8.1.2: Load profile set for Italian networks.
Figure 8.1.3: Load profile set for Spanish networks.

D4.3 – B2 “Reinforcement Costs in LV Grids”
GA MOVE/FP7/265499/Green eMotion Page 69 of 99
8.2 Charging Profiles
Figure 8.2.1: Charging profile sets for Danish networks for user dependent (UD) and timerbased (TB) charging with slow and fast chargers.

D4.3 – B2 “Reinforcement Costs in LV Grids”
Page 70 of 99 GA MOVE/FP7/265499/Green eMotion
Figure 8.2.2: Charge profile set for Danish networks for load dependent (LD) charging.
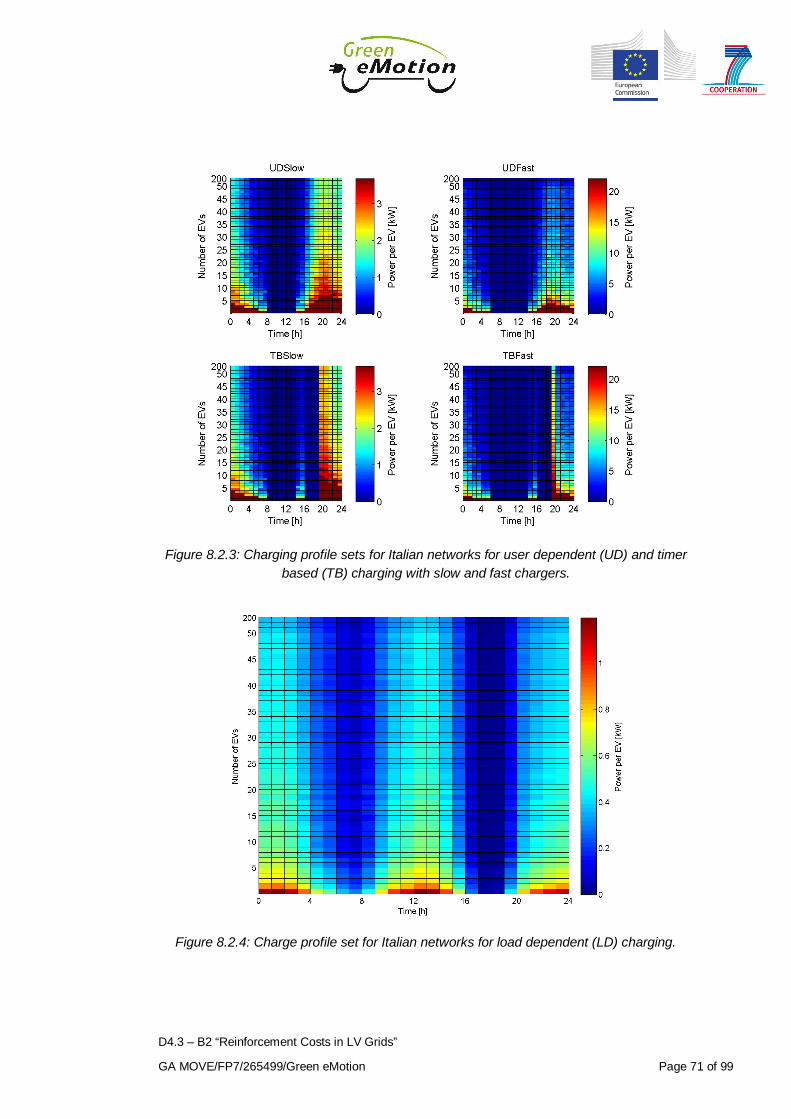
D4.3 – B2 “Reinforcement Costs in LV Grids”
GA MOVE/FP7/265499/Green eMotion Page 71 of 99
Figure 8.2.3: Charging profile sets for Italian networks for user dependent (UD) and timerbased (TB) charging with slow and fast chargers.
Figure 8.2.4: Charge profile set for Italian networks for load dependent (LD) charging.

D4.3 – B2 “Reinforcement Costs in LV Grids”
Page 72 of 99 GA MOVE/FP7/265499/Green eMotion
Figure 8.2.5: Charging profile sets for Spanish networks for user dependent (UD) and timerbased (TB) charging with slow and fast chargers.
Figure 8.2.6: Charge profile set for Spanish networks for load dependent (LD) charging.

D4.3 – B2 “Reinforcement Costs in LV Grids”
GA MOVE/FP7/265499/Green eMotion Page 73 of 99
8.3 Economic Results
Network CAPEX1 (1a) CAPEX2 (1b) CAPEX3 (1c) CAPEX1 – CAPEX2 CAPEX1 – CAPEX3
1 15,474.52 13,641.60 0.00 1,832.92 15,474.52
2 26,695.61 24,213.71 0.00 2,481.91 26,695.61
3 39,844.27 37,356.62 0.00 2,487.65 39,844.27
4 30,363.25 23,181.10 0.00 7,182.15 30,363.25
5 26,427.06 24,954.07 0.00 1,472.99 26,427.06
6 30,833.95 29,056.89 0.00 1,777.06 30,833.95
7 15,102.32 14,095.44 0.00 1,006.88 15,102.32
8 14,757.03 13,385.06 0.00 1,371.97 14,757.03
9 25,778.19 10,723.62 0.00 15,054.57 25,778.19
10 33,314.76 30,598.52 0.00 2,716.24 33,314.76
11 16,291.07 13,402.71 0.00 2,888.37 16,291.07
12 23,528.59 18,198.35 0.00 5,330.24 23,528.59
13 14,072.84 14,072.84 0.00 0.00 14,072.84
14 15,843.67 13,686.36 0.00 2,157.31 15,843.67
15 24,928.22 24,928.22 0.00 0.00 24,928.22
16 20,803.68 20,803.68 0.00 0.00 20,803.68
17 3,337.89 3,068.94 0.00 268.95 3,337.89
18 10,352.81 11,950.81 0.00 -1,597.99 10,352.81
19 16,635.86 16,635.86 0.00 0.00 16,635.86
20 27,953.39 35,699.47 0.00 -7,746.08 27,953.39
21 15,872.58 16,720.06 0.00 -847.48 15,872.58
22 7,992.04 10,854.50 0.00 -2,862.45 7,992.04
23 40,673.07 40,738.27 0.00 -65.20 40,673.07
24 15,843.67 11,822.79 0.00 4,020.88 15,843.67
25 15,089.21 23,077.66 0.00 -7,988.45 15,089.21
26 15,402.23 24,576.64 0.00 -9,174.42 15,402.23
27 19,258.08 14,370.68 0.00 4,887.41 19,258.08
28 10,775.80 18,179.68 0.00 -7,403.88 10,775.80
29 26,810.12 27,524.93 0.00 -714.81 26,810.12
30 103,110.10 121,610.16 40,162.37 -18,500.06 62,947.73
31 15,843.67 13,686.36 0.00 2,157.31 15,843.67
32 30,823.26 30,046.35 0.00 776.91 30,823.26
33 23,408.32 23,408.32 23,408.32 0.00 0.00
Table 8.3.1: Comparison of reinforcement costs in EUR for charging profiles with mediumEV penetration (scenarios 1a, 1b and 1c).

D4.3 – B2 “Reinforcement Costs in LV Grids”
Page 74 of 99 GA MOVE/FP7/265499/Green eMotion
Network Net Value CAPEX1 (1a) CAPEX2 (1b) CAPEX3 (1c) CAPEX1 – CAPEX2 CAPEX1 – CAPEX3
1 60,369.80 25.6% 22.6% 0.0% 3.0% 25.6%
2 55,860.70 47.8% 43.3% 0.0% 4.4% 47.8%
3 48,450.00 82.2% 77.1% 0.0% 5.1% 82.2%
4 75,085.50 40.4% 30.9% 0.0% 9.6% 40.4%
5 36,075.00 73.3% 69.2% 0.0% 4.1% 73.3%
6 65,175.00 47.3% 44.6% 0.0% 2.7% 47.3%
7 33,400.50 45.2% 42.2% 0.0% 3.0% 45.2%
8 71,873.00 20.5% 18.6% 0.0% 1.9% 20.5%
9 39,053.20 66.0% 27.5% 0.0% 38.5% 66.0%
10 58,064.10 57.4% 52.7% 0.0% 4.7% 57.4%
11 38,613.00 42.2% 34.7% 0.0% 7.5% 42.2%
12 36,930.90 63.7% 49.3% 0.0% 14.4% 63.7%
13 22,982.80 61.2% 61.2% 0.0% 0.0% 61.2%
14 67,865.36 23.3% 20.2% 0.0% 3.2% 23.3%
15 47,124.00 52.9% 52.9% 0.0% 0.0% 52.9%
16 117,356.90 17.7% 17.7% 0.0% 0.0% 17.7%
17 32,325.50 10.3% 9.5% 0.0% 0.8% 10.3%
18 25,933.50 39.9% 46.1% 0.0% -6.2% 39.9%
19 41,781.75 39.8% 39.8% 0.0% 0.0% 39.8%
20 27,418.50 102.0% 130.2% 0.0% -28.3% 102.0%
21 35,208.75 45.1% 47.5% 0.0% -2.4% 45.1%
22 29,112.00 27.5% 37.3% 0.0% -9.8% 27.5%
23 30,327.60 134.1% 134.3% 0.0% -0.2% 134.1%
24 18,903.50 83.8% 62.5% 0.0% 21.3% 83.8%
25 36,175.60 41.7% 63.8% 0.0% -22.1% 41.7%
26 25,991.00 59.3% 94.6% 0.0% -35.3% 59.3%
27 25,166.90 76.5% 57.1% 0.0% 19.4% 76.5%
28 51,019.70 21.1% 35.6% 0.0% -14.5% 21.1%
29 35,772.50 74.9% 76.9% 0.0% -2.0% 74.9%
30 133,988.90 77.0% 90.8% 30.0% -13.8% 47.0%
31 27,795.60 57.0% 49.2% 0.0% 7.8% 57.0%
32 80,562.80 38.3% 37.3% 0.0% 1.0% 38.3%
33 18,000.00 130.0% 130.0% 130.0% 0.0% 0.0%
Table 8.3.2: Comparison of reinforcement costs in % of network value for charging profileswith medium EV penetration (scenarios 1a, 1b and 1c). Network value is in EUR.

D4.3 – B2 “Reinforcement Costs in LV Grids”
GA MOVE/FP7/265499/Green eMotion Page 75 of 99
Network CAPEX1 (1a) CAPEX2 (2.1) CAPEX3 (2.2) CAPEX1 - CAPEX2 CAPEX1 - CAPEX3
1 15,474.52 15,474.52 0.00 15,474.52
2 26,695.61 8,822.35 17,873.26 26,695.61
3 39,844.27 26,757.40 13,086.87 39,844.27
4 30,363.25 0.00 30,363.25 30,363.25
5 26,427.06 26,427.06 0.00 26,427.06
6 30,833.95 10,790.29 20,043.66 30,833.95
7 15,102.32 15,102.32 0.00 15,102.32
8 14,757.03 0.00 14,757.03 14,757.03
9 25,778.19 25,778.19 0.00 25,778.19
10 33,314.76 9,726.64 23,588.12 33,314.76
11 16,291.07 16,291.07 0.00 16,291.07
12 23,528.59 15,960.60 7,567.99 23,528.59
13 14,072.84 14,072.84 0.00 14,072.84
14 15,843.67 15,843.67 15,843.67 0.00 0.00
15 24,928.22 24,928.22 24,928.22 0.00 0.00
16 20,803.68 0.00 0.00 20,803.68 20,803.68
17 3,337.89 3,337.89 3,337.89 0.00 0.00
18 10,352.81 10,352.81 10,352.81 0.00 0.00
19 16,635.86 16,635.86 16,635.86 0.00 0.00
20 27,953.39 27,953.39 27,953.39 0.00 0.00
21 15,872.58 15,872.58 15,248.07 0.00 624.51
22 7,992.04 7,992.04 7,992.04 0.00 0.00
23 40,673.07 40,673.07 40,673.07 0.00 0.00
24 15,843.67 15,843.67 0.00 15,843.67
25 15,089.21 15,089.21 0.00 15,089.21
26 15,402.23 15,402.23 0.00 15,402.23
27 19,258.08 19,258.08 0.00 19,258.08
28 10,775.80 10,775.80 0.00 10,775.80
29 26,810.12 26,810.12 0.00 26,810.12
30 103,110.10 83,810.80 19,299.31 103,110.10
31 15,843.67 15,843.67 0.00 15,843.67
32 30,823.26 0.00 30,823.26 30,823.26
33 23,408.32 23,408.32 0.00 23,408.32
Table 8.3.3: Comparison of reinforcement costs in EUR for voltage control (scenarios 1a,2.1 and 2.2).
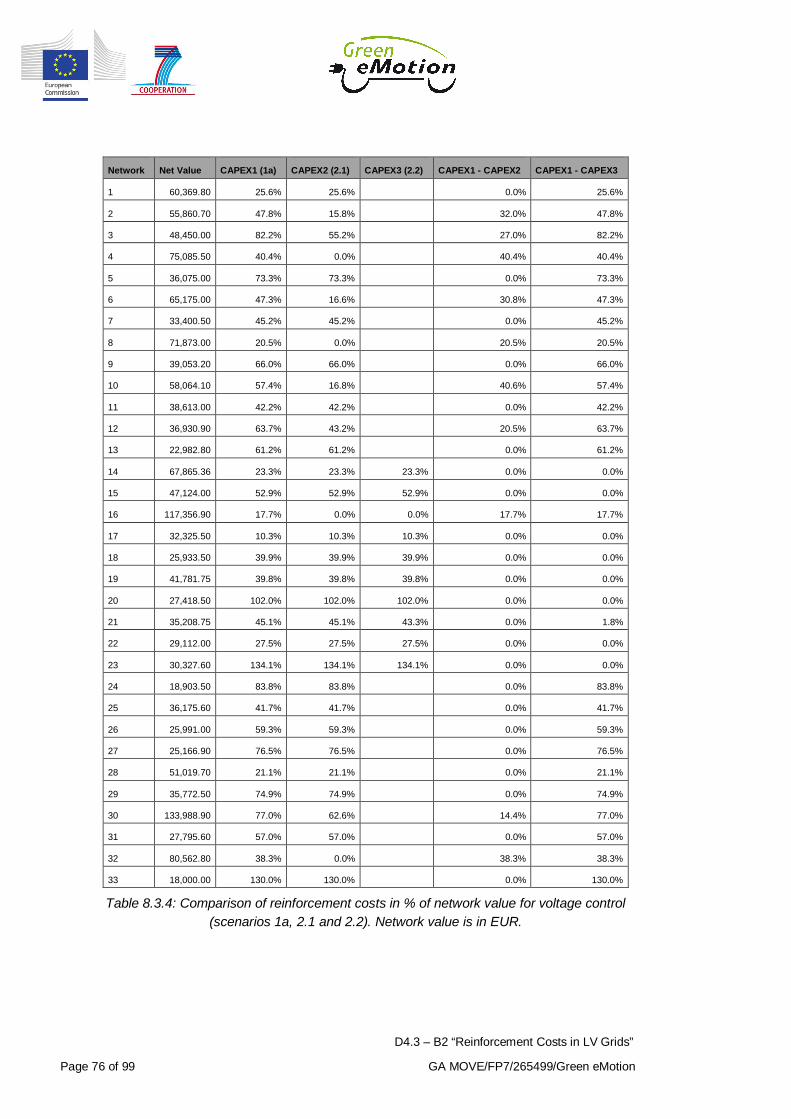
D4.3 – B2 “Reinforcement Costs in LV Grids”
Page 76 of 99 GA MOVE/FP7/265499/Green eMotion
Network Net Value CAPEX1 (1a) CAPEX2 (2.1) CAPEX3 (2.2) CAPEX1 - CAPEX2 CAPEX1 - CAPEX3
1 60,369.80 25.6% 25.6% 0.0% 25.6%
2 55,860.70 47.8% 15.8% 32.0% 47.8%
3 48,450.00 82.2% 55.2% 27.0% 82.2%
4 75,085.50 40.4% 0.0% 40.4% 40.4%
5 36,075.00 73.3% 73.3% 0.0% 73.3%
6 65,175.00 47.3% 16.6% 30.8% 47.3%
7 33,400.50 45.2% 45.2% 0.0% 45.2%
8 71,873.00 20.5% 0.0% 20.5% 20.5%
9 39,053.20 66.0% 66.0% 0.0% 66.0%
10 58,064.10 57.4% 16.8% 40.6% 57.4%
11 38,613.00 42.2% 42.2% 0.0% 42.2%
12 36,930.90 63.7% 43.2% 20.5% 63.7%
13 22,982.80 61.2% 61.2% 0.0% 61.2%
14 67,865.36 23.3% 23.3% 23.3% 0.0% 0.0%
15 47,124.00 52.9% 52.9% 52.9% 0.0% 0.0%
16 117,356.90 17.7% 0.0% 0.0% 17.7% 17.7%
17 32,325.50 10.3% 10.3% 10.3% 0.0% 0.0%
18 25,933.50 39.9% 39.9% 39.9% 0.0% 0.0%
19 41,781.75 39.8% 39.8% 39.8% 0.0% 0.0%
20 27,418.50 102.0% 102.0% 102.0% 0.0% 0.0%
21 35,208.75 45.1% 45.1% 43.3% 0.0% 1.8%
22 29,112.00 27.5% 27.5% 27.5% 0.0% 0.0%
23 30,327.60 134.1% 134.1% 134.1% 0.0% 0.0%
24 18,903.50 83.8% 83.8% 0.0% 83.8%
25 36,175.60 41.7% 41.7% 0.0% 41.7%
26 25,991.00 59.3% 59.3% 0.0% 59.3%
27 25,166.90 76.5% 76.5% 0.0% 76.5%
28 51,019.70 21.1% 21.1% 0.0% 21.1%
29 35,772.50 74.9% 74.9% 0.0% 74.9%
30 133,988.90 77.0% 62.6% 14.4% 77.0%
31 27,795.60 57.0% 57.0% 0.0% 57.0%
32 80,562.80 38.3% 0.0% 38.3% 38.3%
33 18,000.00 130.0% 130.0% 0.0% 130.0%
Table 8.3.4: Comparison of reinforcement costs in % of network value for voltage control(scenarios 1a, 2.1 and 2.2). Network value is in EUR.
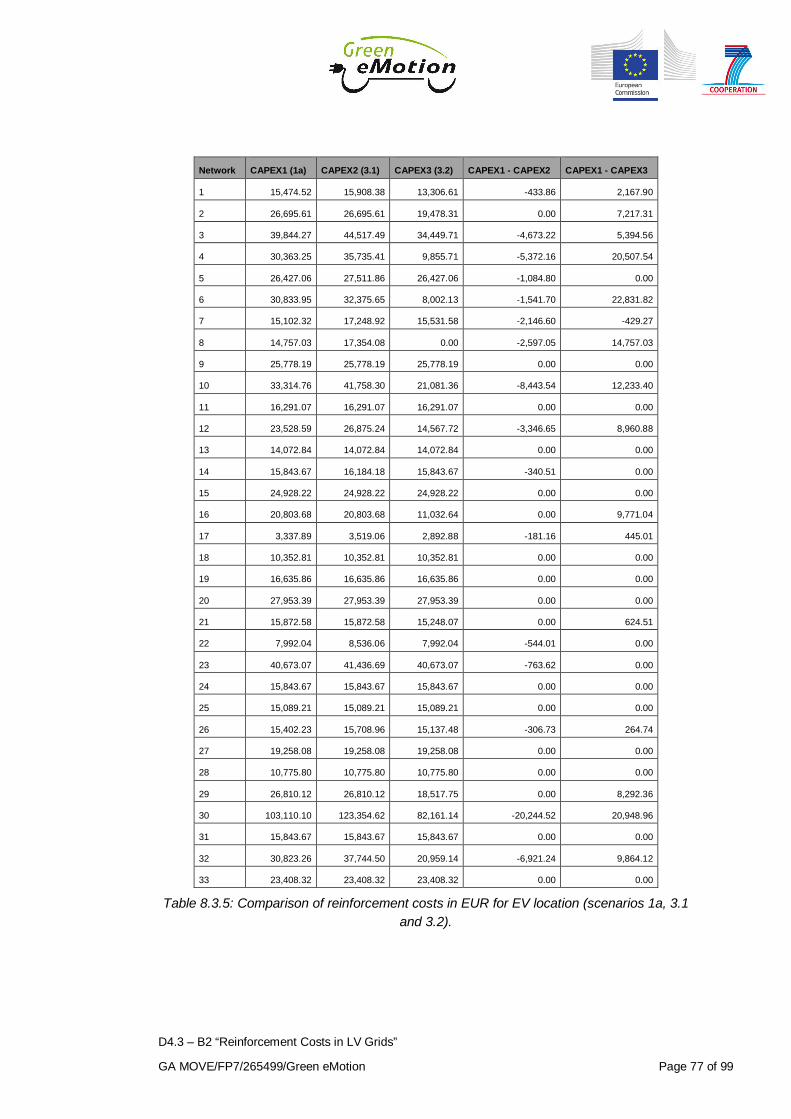
D4.3 – B2 “Reinforcement Costs in LV Grids”
GA MOVE/FP7/265499/Green eMotion Page 77 of 99
Network CAPEX1 (1a) CAPEX2 (3.1) CAPEX3 (3.2) CAPEX1 - CAPEX2 CAPEX1 - CAPEX3
1 15,474.52 15,908.38 13,306.61 -433.86 2,167.90
2 26,695.61 26,695.61 19,478.31 0.00 7,217.31
3 39,844.27 44,517.49 34,449.71 -4,673.22 5,394.56
4 30,363.25 35,735.41 9,855.71 -5,372.16 20,507.54
5 26,427.06 27,511.86 26,427.06 -1,084.80 0.00
6 30,833.95 32,375.65 8,002.13 -1,541.70 22,831.82
7 15,102.32 17,248.92 15,531.58 -2,146.60 -429.27
8 14,757.03 17,354.08 0.00 -2,597.05 14,757.03
9 25,778.19 25,778.19 25,778.19 0.00 0.00
10 33,314.76 41,758.30 21,081.36 -8,443.54 12,233.40
11 16,291.07 16,291.07 16,291.07 0.00 0.00
12 23,528.59 26,875.24 14,567.72 -3,346.65 8,960.88
13 14,072.84 14,072.84 14,072.84 0.00 0.00
14 15,843.67 16,184.18 15,843.67 -340.51 0.00
15 24,928.22 24,928.22 24,928.22 0.00 0.00
16 20,803.68 20,803.68 11,032.64 0.00 9,771.04
17 3,337.89 3,519.06 2,892.88 -181.16 445.01
18 10,352.81 10,352.81 10,352.81 0.00 0.00
19 16,635.86 16,635.86 16,635.86 0.00 0.00
20 27,953.39 27,953.39 27,953.39 0.00 0.00
21 15,872.58 15,872.58 15,248.07 0.00 624.51
22 7,992.04 8,536.06 7,992.04 -544.01 0.00
23 40,673.07 41,436.69 40,673.07 -763.62 0.00
24 15,843.67 15,843.67 15,843.67 0.00 0.00
25 15,089.21 15,089.21 15,089.21 0.00 0.00
26 15,402.23 15,708.96 15,137.48 -306.73 264.74
27 19,258.08 19,258.08 19,258.08 0.00 0.00
28 10,775.80 10,775.80 10,775.80 0.00 0.00
29 26,810.12 26,810.12 18,517.75 0.00 8,292.36
30 103,110.10 123,354.62 82,161.14 -20,244.52 20,948.96
31 15,843.67 15,843.67 15,843.67 0.00 0.00
32 30,823.26 37,744.50 20,959.14 -6,921.24 9,864.12
33 23,408.32 23,408.32 23,408.32 0.00 0.00
Table 8.3.5: Comparison of reinforcement costs in EUR for EV location (scenarios 1a, 3.1and 3.2).
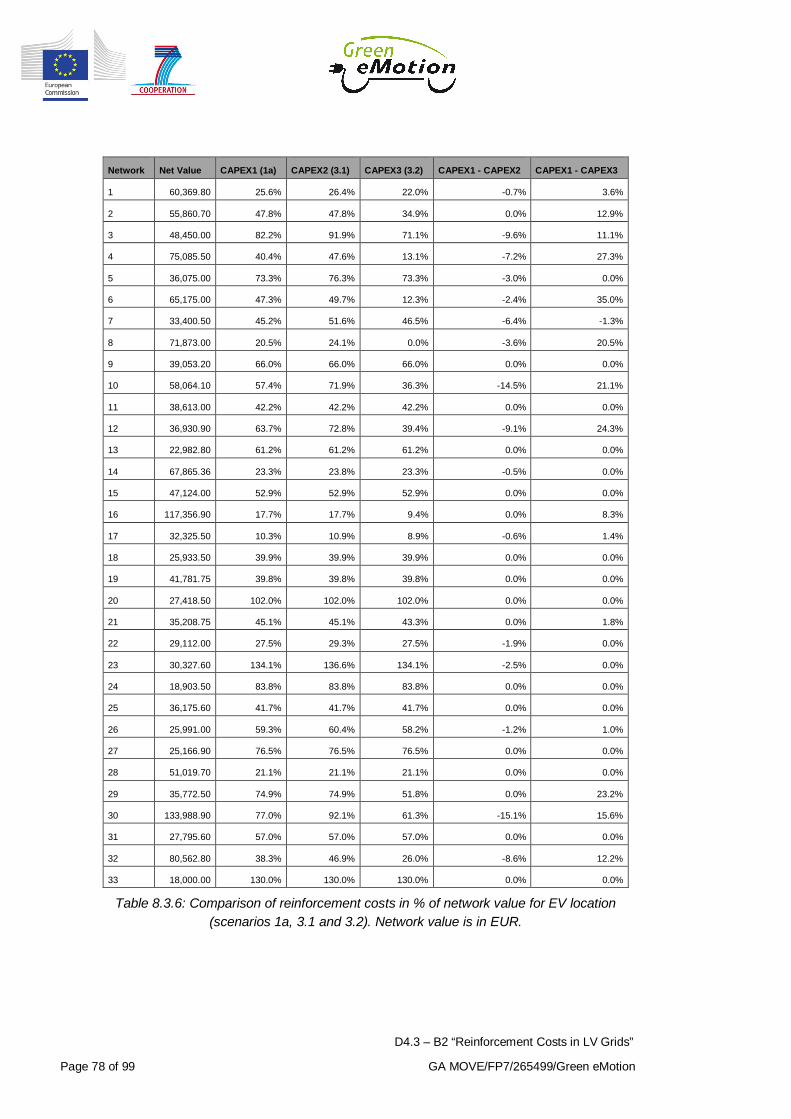
D4.3 – B2 “Reinforcement Costs in LV Grids”
Page 78 of 99 GA MOVE/FP7/265499/Green eMotion
Network Net Value CAPEX1 (1a) CAPEX2 (3.1) CAPEX3 (3.2) CAPEX1 - CAPEX2 CAPEX1 - CAPEX3
1 60,369.80 25.6% 26.4% 22.0% -0.7% 3.6%
2 55,860.70 47.8% 47.8% 34.9% 0.0% 12.9%
3 48,450.00 82.2% 91.9% 71.1% -9.6% 11.1%
4 75,085.50 40.4% 47.6% 13.1% -7.2% 27.3%
5 36,075.00 73.3% 76.3% 73.3% -3.0% 0.0%
6 65,175.00 47.3% 49.7% 12.3% -2.4% 35.0%
7 33,400.50 45.2% 51.6% 46.5% -6.4% -1.3%
8 71,873.00 20.5% 24.1% 0.0% -3.6% 20.5%
9 39,053.20 66.0% 66.0% 66.0% 0.0% 0.0%
10 58,064.10 57.4% 71.9% 36.3% -14.5% 21.1%
11 38,613.00 42.2% 42.2% 42.2% 0.0% 0.0%
12 36,930.90 63.7% 72.8% 39.4% -9.1% 24.3%
13 22,982.80 61.2% 61.2% 61.2% 0.0% 0.0%
14 67,865.36 23.3% 23.8% 23.3% -0.5% 0.0%
15 47,124.00 52.9% 52.9% 52.9% 0.0% 0.0%
16 117,356.90 17.7% 17.7% 9.4% 0.0% 8.3%
17 32,325.50 10.3% 10.9% 8.9% -0.6% 1.4%
18 25,933.50 39.9% 39.9% 39.9% 0.0% 0.0%
19 41,781.75 39.8% 39.8% 39.8% 0.0% 0.0%
20 27,418.50 102.0% 102.0% 102.0% 0.0% 0.0%
21 35,208.75 45.1% 45.1% 43.3% 0.0% 1.8%
22 29,112.00 27.5% 29.3% 27.5% -1.9% 0.0%
23 30,327.60 134.1% 136.6% 134.1% -2.5% 0.0%
24 18,903.50 83.8% 83.8% 83.8% 0.0% 0.0%
25 36,175.60 41.7% 41.7% 41.7% 0.0% 0.0%
26 25,991.00 59.3% 60.4% 58.2% -1.2% 1.0%
27 25,166.90 76.5% 76.5% 76.5% 0.0% 0.0%
28 51,019.70 21.1% 21.1% 21.1% 0.0% 0.0%
29 35,772.50 74.9% 74.9% 51.8% 0.0% 23.2%
30 133,988.90 77.0% 92.1% 61.3% -15.1% 15.6%
31 27,795.60 57.0% 57.0% 57.0% 0.0% 0.0%
32 80,562.80 38.3% 46.9% 26.0% -8.6% 12.2%
33 18,000.00 130.0% 130.0% 130.0% 0.0% 0.0%
Table 8.3.6: Comparison of reinforcement costs in % of network value for EV location(scenarios 1a, 3.1 and 3.2). Network value is in EUR.
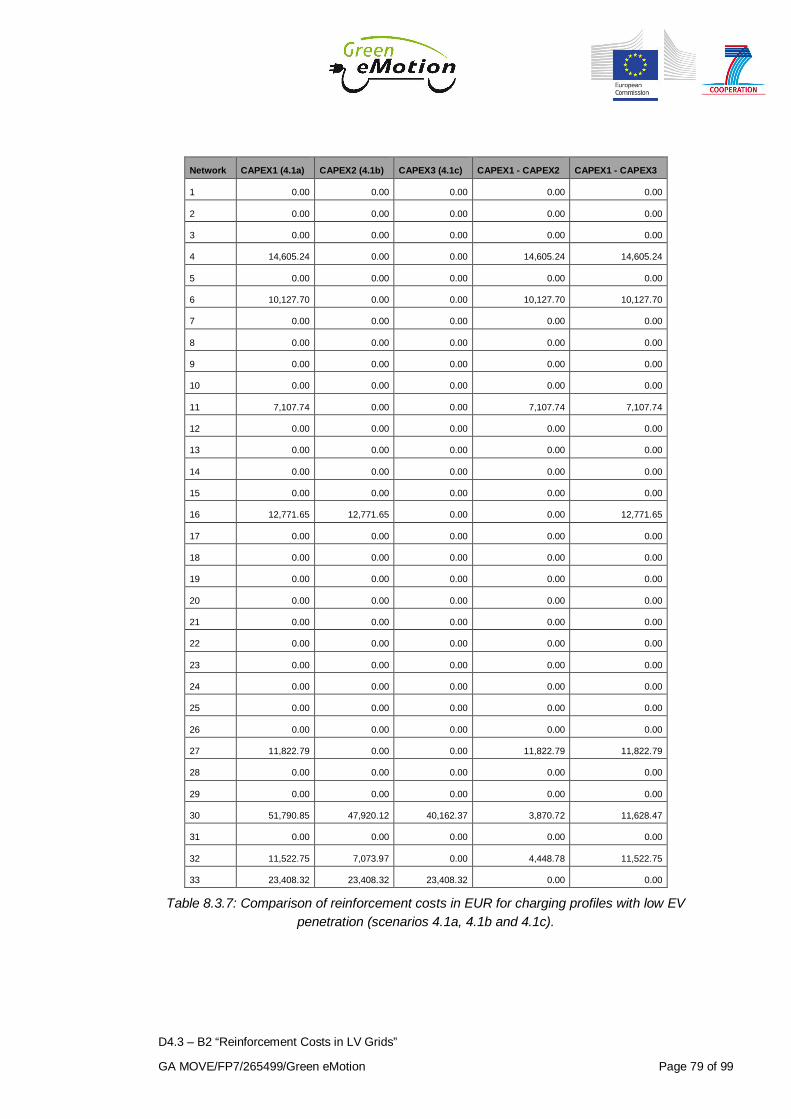
D4.3 – B2 “Reinforcement Costs in LV Grids”
GA MOVE/FP7/265499/Green eMotion Page 79 of 99
Network CAPEX1 (4.1a) CAPEX2 (4.1b) CAPEX3 (4.1c) CAPEX1 - CAPEX2 CAPEX1 - CAPEX3
1 0.00 0.00 0.00 0.00 0.00
2 0.00 0.00 0.00 0.00 0.00
3 0.00 0.00 0.00 0.00 0.00
4 14,605.24 0.00 0.00 14,605.24 14,605.24
5 0.00 0.00 0.00 0.00 0.00
6 10,127.70 0.00 0.00 10,127.70 10,127.70
7 0.00 0.00 0.00 0.00 0.00
8 0.00 0.00 0.00 0.00 0.00
9 0.00 0.00 0.00 0.00 0.00
10 0.00 0.00 0.00 0.00 0.00
11 7,107.74 0.00 0.00 7,107.74 7,107.74
12 0.00 0.00 0.00 0.00 0.00
13 0.00 0.00 0.00 0.00 0.00
14 0.00 0.00 0.00 0.00 0.00
15 0.00 0.00 0.00 0.00 0.00
16 12,771.65 12,771.65 0.00 0.00 12,771.65
17 0.00 0.00 0.00 0.00 0.00
18 0.00 0.00 0.00 0.00 0.00
19 0.00 0.00 0.00 0.00 0.00
20 0.00 0.00 0.00 0.00 0.00
21 0.00 0.00 0.00 0.00 0.00
22 0.00 0.00 0.00 0.00 0.00
23 0.00 0.00 0.00 0.00 0.00
24 0.00 0.00 0.00 0.00 0.00
25 0.00 0.00 0.00 0.00 0.00
26 0.00 0.00 0.00 0.00 0.00
27 11,822.79 0.00 0.00 11,822.79 11,822.79
28 0.00 0.00 0.00 0.00 0.00
29 0.00 0.00 0.00 0.00 0.00
30 51,790.85 47,920.12 40,162.37 3,870.72 11,628.47
31 0.00 0.00 0.00 0.00 0.00
32 11,522.75 7,073.97 0.00 4,448.78 11,522.75
33 23,408.32 23,408.32 23,408.32 0.00 0.00
Table 8.3.7: Comparison of reinforcement costs in EUR for charging profiles with low EVpenetration (scenarios 4.1a, 4.1b and 4.1c).

D4.3 – B2 “Reinforcement Costs in LV Grids”
Page 80 of 99 GA MOVE/FP7/265499/Green eMotion
Network Net Value CAPEX1 (4.1a) CAPEX2 (4.1b) CAPEX3 (4.1c) CAPEX1 - CAPEX2 CAPEX1 - CAPEX3
1 60,369.80 0.0% 0.0% 0.0% 0.0% 0.0%
2 55,860.70 0.0% 0.0% 0.0% 0.0% 0.0%
3 48,450.00 0.0% 0.0% 0.0% 0.0% 0.0%
4 75,085.50 19.5% 0.0% 0.0% 19.5% 19.5%
5 36,075.00 0.0% 0.0% 0.0% 0.0% 0.0%
6 65,175.00 15.5% 0.0% 0.0% 15.5% 15.5%
7 33,400.50 0.0% 0.0% 0.0% 0.0% 0.0%
8 71,873.00 0.0% 0.0% 0.0% 0.0% 0.0%
9 39,053.20 0.0% 0.0% 0.0% 0.0% 0.0%
10 58,064.10 0.0% 0.0% 0.0% 0.0% 0.0%
11 38,613.00 18.4% 0.0% 0.0% 18.4% 18.4%
12 36,930.90 0.0% 0.0% 0.0% 0.0% 0.0%
13 22,982.80 0.0% 0.0% 0.0% 0.0% 0.0%
14 67,865.36 0.0% 0.0% 0.0% 0.0% 0.0%
15 47,124.00 0.0% 0.0% 0.0% 0.0% 0.0%
16 117,356.90 10.9% 10.9% 0.0% 0.0% 10.9%
17 32,325.50 0.0% 0.0% 0.0% 0.0% 0.0%
18 25,933.50 0.0% 0.0% 0.0% 0.0% 0.0%
19 41,781.75 0.0% 0.0% 0.0% 0.0% 0.0%
20 27,418.50 0.0% 0.0% 0.0% 0.0% 0.0%
21 35,208.75 0.0% 0.0% 0.0% 0.0% 0.0%
22 29,112.00 0.0% 0.0% 0.0% 0.0% 0.0%
23 30,327.60 0.0% 0.0% 0.0% 0.0% 0.0%
24 18,903.50 0.0% 0.0% 0.0% 0.0% 0.0%
25 36,175.60 0.0% 0.0% 0.0% 0.0% 0.0%
26 25,991.00 0.0% 0.0% 0.0% 0.0% 0.0%
27 25,166.90 47.0% 0.0% 0.0% 47.0% 47.0%
28 51,019.70 0.0% 0.0% 0.0% 0.0% 0.0%
29 35,772.50 0.0% 0.0% 0.0% 0.0% 0.0%
30 133,988.90 38.7% 35.8% 30.0% 2.9% 8.7%
31 27,795.60 0.0% 0.0% 0.0% 0.0% 0.0%
32 80,562.80 14.3% 8.8% 0.0% 5.5% 14.3%
33 18,000.00 130.0% 130.0% 130.0% 0.0% 0.0%
Table 8.3.8: Comparison of reinforcement costs in % of network value for charging profileswith low EV penetration (scenarios 4.1a, 4.1b and 4.1c). Network value is in EUR.

D4.3 – B2 “Reinforcement Costs in LV Grids”
GA MOVE/FP7/265499/Green eMotion Page 81 of 99
Network CAPEX1 (4.2a) CAPEX2 (4.2b) CAPEX3 (4.2c) CAPEX1 - CAPEX2 CAPEX1 - CAPEX3
1 33,368.22 35,088.73 0.00 -1,720.50 33,368.22
2 35,756.67 42,760.96 0.00 -7,004.28 35,756.67
3 76,780.98 83,456.84 0.00 -6,675.86 76,780.98
4 58,883.65 72,698.93 0.00 -13,815.27 58,883.65
5 47,840.71 56,663.89 0.00 -8,823.19 47,840.71
6 52,888.18 78,108.09 0.00 -25,219.91 52,888.18
7 26,114.82 25,292.68 0.00 822.14 26,114.82
8 25,045.00 24,546.23 0.00 498.77 25,045.00
9 44,800.79 37,797.17 0.00 7,003.62 44,800.79
10 54,551.08 60,644.71 0.00 -6,093.63 54,551.08
11 24,547.93 23,843.30 0.00 704.63 24,547.93
12 29,700.83 26,488.95 0.00 3,211.88 29,700.83
13 17,105.63 17,105.63 0.00 0.00 17,105.63
14 31,071.76 33,711.73 0.00 -2,639.98 31,071.76
15 43,584.47 42,641.42 7,621.08 943.06 35,963.40
16 22,936.06 22,936.06 0.00 0.00 22,936.06
17 8,040.29 8,905.23 0.00 -864.94 8,040.29
18 27,568.06 29,716.02 0.00 -2,147.96 27,568.06
19 31,509.68 30,370.64 7,621.08 1,139.04 23,888.60
20 63,937.83 81,642.94 0.00 -17,705.10 63,937.83
21 40,169.89 50,904.78 0.00 -10,734.88 40,169.89
22 23,836.03 27,029.30 0.00 -3,193.27 23,836.03
23 73,831.87 96,953.54 0.00 -23,121.67 73,831.87
24 29,395.48 27,690.31 0.00 1,705.18 29,395.48
25 31,848.42 46,905.37 0.00 -15,056.95 31,848.42
26 33,493.09 49,065.27 0.00 -15,572.18 33,493.09
27 32,900.23 29,135.84 0.00 3,764.39 32,900.23
28 33,998.23 47,229.87 0.00 -13,231.64 33,998.23
29 48,226.25 64,973.01 0.00 -16,746.76 48,226.25
30 151,969.49 180,711.95 40,162.37 -28,742.47 111,807.11
31 30,926.27 30,331.83 0.00 594.44 30,926.27
32 39,735.19 48,840.35 0.00 -9,105.16 39,735.19
33 23,408.32 23,408.32 23,408.32 0.00 0.00
Table 8.3.9: Comparison of reinforcement costs in EUR for charging profiles with high EVpenetration (scenarios 4.2a, 4.2b and 4.2c).
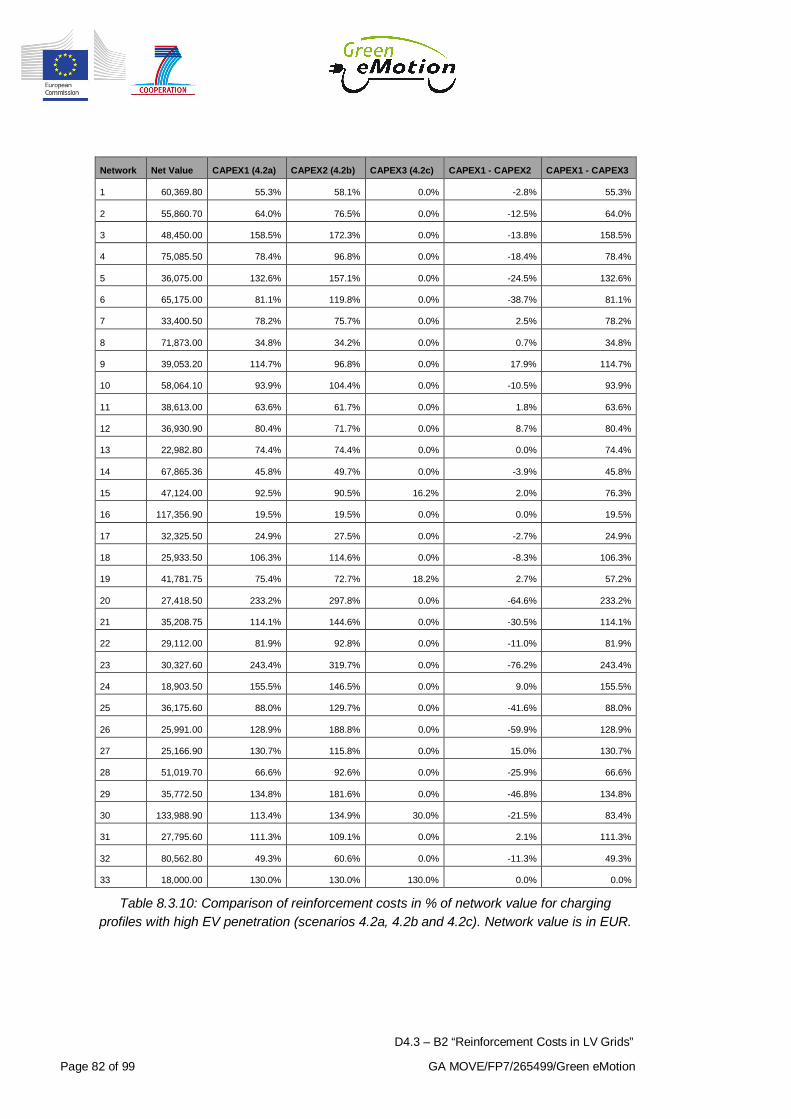
D4.3 – B2 “Reinforcement Costs in LV Grids”
Page 82 of 99 GA MOVE/FP7/265499/Green eMotion
Network Net Value CAPEX1 (4.2a) CAPEX2 (4.2b) CAPEX3 (4.2c) CAPEX1 - CAPEX2 CAPEX1 - CAPEX3
1 60,369.80 55.3% 58.1% 0.0% -2.8% 55.3%
2 55,860.70 64.0% 76.5% 0.0% -12.5% 64.0%
3 48,450.00 158.5% 172.3% 0.0% -13.8% 158.5%
4 75,085.50 78.4% 96.8% 0.0% -18.4% 78.4%
5 36,075.00 132.6% 157.1% 0.0% -24.5% 132.6%
6 65,175.00 81.1% 119.8% 0.0% -38.7% 81.1%
7 33,400.50 78.2% 75.7% 0.0% 2.5% 78.2%
8 71,873.00 34.8% 34.2% 0.0% 0.7% 34.8%
9 39,053.20 114.7% 96.8% 0.0% 17.9% 114.7%
10 58,064.10 93.9% 104.4% 0.0% -10.5% 93.9%
11 38,613.00 63.6% 61.7% 0.0% 1.8% 63.6%
12 36,930.90 80.4% 71.7% 0.0% 8.7% 80.4%
13 22,982.80 74.4% 74.4% 0.0% 0.0% 74.4%
14 67,865.36 45.8% 49.7% 0.0% -3.9% 45.8%
15 47,124.00 92.5% 90.5% 16.2% 2.0% 76.3%
16 117,356.90 19.5% 19.5% 0.0% 0.0% 19.5%
17 32,325.50 24.9% 27.5% 0.0% -2.7% 24.9%
18 25,933.50 106.3% 114.6% 0.0% -8.3% 106.3%
19 41,781.75 75.4% 72.7% 18.2% 2.7% 57.2%
20 27,418.50 233.2% 297.8% 0.0% -64.6% 233.2%
21 35,208.75 114.1% 144.6% 0.0% -30.5% 114.1%
22 29,112.00 81.9% 92.8% 0.0% -11.0% 81.9%
23 30,327.60 243.4% 319.7% 0.0% -76.2% 243.4%
24 18,903.50 155.5% 146.5% 0.0% 9.0% 155.5%
25 36,175.60 88.0% 129.7% 0.0% -41.6% 88.0%
26 25,991.00 128.9% 188.8% 0.0% -59.9% 128.9%
27 25,166.90 130.7% 115.8% 0.0% 15.0% 130.7%
28 51,019.70 66.6% 92.6% 0.0% -25.9% 66.6%
29 35,772.50 134.8% 181.6% 0.0% -46.8% 134.8%
30 133,988.90 113.4% 134.9% 30.0% -21.5% 83.4%
31 27,795.60 111.3% 109.1% 0.0% 2.1% 111.3%
32 80,562.80 49.3% 60.6% 0.0% -11.3% 49.3%
33 18,000.00 130.0% 130.0% 130.0% 0.0% 0.0%
Table 8.3.10: Comparison of reinforcement costs in % of network value for chargingprofiles with high EV penetration (scenarios 4.2a, 4.2b and 4.2c). Network value is in EUR.
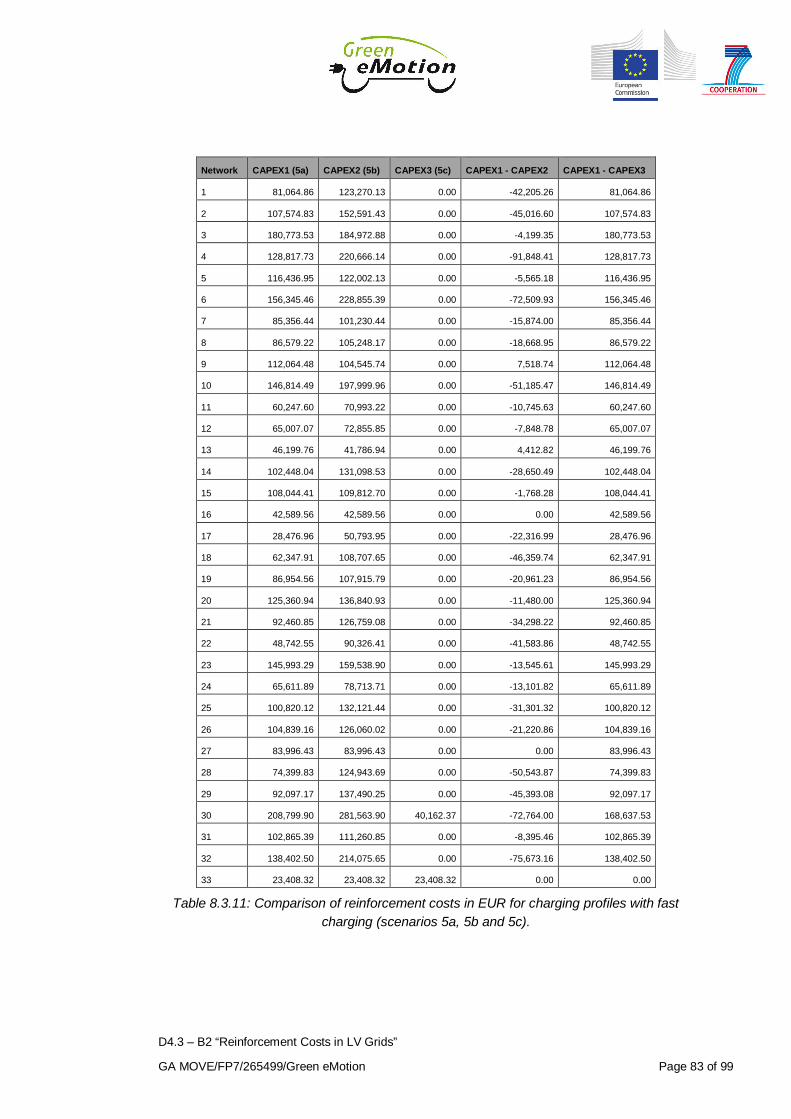
D4.3 – B2 “Reinforcement Costs in LV Grids”
GA MOVE/FP7/265499/Green eMotion Page 83 of 99
Network CAPEX1 (5a) CAPEX2 (5b) CAPEX3 (5c) CAPEX1 - CAPEX2 CAPEX1 - CAPEX3
1 81,064.86 123,270.13 0.00 -42,205.26 81,064.86
2 107,574.83 152,591.43 0.00 -45,016.60 107,574.83
3 180,773.53 184,972.88 0.00 -4,199.35 180,773.53
4 128,817.73 220,666.14 0.00 -91,848.41 128,817.73
5 116,436.95 122,002.13 0.00 -5,565.18 116,436.95
6 156,345.46 228,855.39 0.00 -72,509.93 156,345.46
7 85,356.44 101,230.44 0.00 -15,874.00 85,356.44
8 86,579.22 105,248.17 0.00 -18,668.95 86,579.22
9 112,064.48 104,545.74 0.00 7,518.74 112,064.48
10 146,814.49 197,999.96 0.00 -51,185.47 146,814.49
11 60,247.60 70,993.22 0.00 -10,745.63 60,247.60
12 65,007.07 72,855.85 0.00 -7,848.78 65,007.07
13 46,199.76 41,786.94 0.00 4,412.82 46,199.76
14 102,448.04 131,098.53 0.00 -28,650.49 102,448.04
15 108,044.41 109,812.70 0.00 -1,768.28 108,044.41
16 42,589.56 42,589.56 0.00 0.00 42,589.56
17 28,476.96 50,793.95 0.00 -22,316.99 28,476.96
18 62,347.91 108,707.65 0.00 -46,359.74 62,347.91
19 86,954.56 107,915.79 0.00 -20,961.23 86,954.56
20 125,360.94 136,840.93 0.00 -11,480.00 125,360.94
21 92,460.85 126,759.08 0.00 -34,298.22 92,460.85
22 48,742.55 90,326.41 0.00 -41,583.86 48,742.55
23 145,993.29 159,538.90 0.00 -13,545.61 145,993.29
24 65,611.89 78,713.71 0.00 -13,101.82 65,611.89
25 100,820.12 132,121.44 0.00 -31,301.32 100,820.12
26 104,839.16 126,060.02 0.00 -21,220.86 104,839.16
27 83,996.43 83,996.43 0.00 0.00 83,996.43
28 74,399.83 124,943.69 0.00 -50,543.87 74,399.83
29 92,097.17 137,490.25 0.00 -45,393.08 92,097.17
30 208,799.90 281,563.90 40,162.37 -72,764.00 168,637.53
31 102,865.39 111,260.85 0.00 -8,395.46 102,865.39
32 138,402.50 214,075.65 0.00 -75,673.16 138,402.50
33 23,408.32 23,408.32 23,408.32 0.00 0.00
Table 8.3.11: Comparison of reinforcement costs in EUR for charging profiles with fastcharging (scenarios 5a, 5b and 5c).
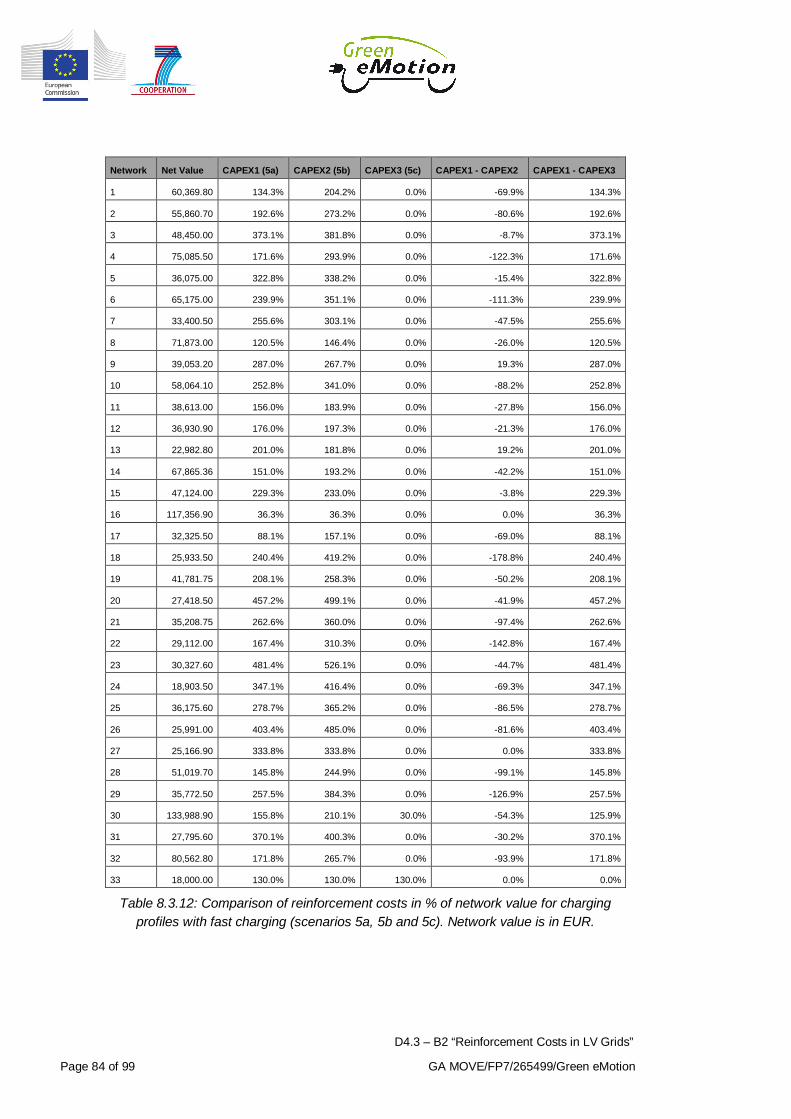
D4.3 – B2 “Reinforcement Costs in LV Grids”
Page 84 of 99 GA MOVE/FP7/265499/Green eMotion
Network Net Value CAPEX1 (5a) CAPEX2 (5b) CAPEX3 (5c) CAPEX1 - CAPEX2 CAPEX1 - CAPEX3
1 60,369.80 134.3% 204.2% 0.0% -69.9% 134.3%
2 55,860.70 192.6% 273.2% 0.0% -80.6% 192.6%
3 48,450.00 373.1% 381.8% 0.0% -8.7% 373.1%
4 75,085.50 171.6% 293.9% 0.0% -122.3% 171.6%
5 36,075.00 322.8% 338.2% 0.0% -15.4% 322.8%
6 65,175.00 239.9% 351.1% 0.0% -111.3% 239.9%
7 33,400.50 255.6% 303.1% 0.0% -47.5% 255.6%
8 71,873.00 120.5% 146.4% 0.0% -26.0% 120.5%
9 39,053.20 287.0% 267.7% 0.0% 19.3% 287.0%
10 58,064.10 252.8% 341.0% 0.0% -88.2% 252.8%
11 38,613.00 156.0% 183.9% 0.0% -27.8% 156.0%
12 36,930.90 176.0% 197.3% 0.0% -21.3% 176.0%
13 22,982.80 201.0% 181.8% 0.0% 19.2% 201.0%
14 67,865.36 151.0% 193.2% 0.0% -42.2% 151.0%
15 47,124.00 229.3% 233.0% 0.0% -3.8% 229.3%
16 117,356.90 36.3% 36.3% 0.0% 0.0% 36.3%
17 32,325.50 88.1% 157.1% 0.0% -69.0% 88.1%
18 25,933.50 240.4% 419.2% 0.0% -178.8% 240.4%
19 41,781.75 208.1% 258.3% 0.0% -50.2% 208.1%
20 27,418.50 457.2% 499.1% 0.0% -41.9% 457.2%
21 35,208.75 262.6% 360.0% 0.0% -97.4% 262.6%
22 29,112.00 167.4% 310.3% 0.0% -142.8% 167.4%
23 30,327.60 481.4% 526.1% 0.0% -44.7% 481.4%
24 18,903.50 347.1% 416.4% 0.0% -69.3% 347.1%
25 36,175.60 278.7% 365.2% 0.0% -86.5% 278.7%
26 25,991.00 403.4% 485.0% 0.0% -81.6% 403.4%
27 25,166.90 333.8% 333.8% 0.0% 0.0% 333.8%
28 51,019.70 145.8% 244.9% 0.0% -99.1% 145.8%
29 35,772.50 257.5% 384.3% 0.0% -126.9% 257.5%
30 133,988.90 155.8% 210.1% 30.0% -54.3% 125.9%
31 27,795.60 370.1% 400.3% 0.0% -30.2% 370.1%
32 80,562.80 171.8% 265.7% 0.0% -93.9% 171.8%
33 18,000.00 130.0% 130.0% 130.0% 0.0% 0.0%
Table 8.3.12: Comparison of reinforcement costs in % of network value for chargingprofiles with fast charging (scenarios 5a, 5b and 5c). Network value is in EUR.

D4.3 – B2 “Reinforcement Costs in LV Grids”
GA MOVE/FP7/265499/Green eMotion Page 85 of 99
Network CAPEX1 (1a) CAPEX2 (4.1a) CAPEX3 (4.2a) CAPEX1 - CAPEX2 CAPEX1 - CAPEX3
1 15,474.52 0.00 33,368.22 15,474.52 -17,893.71
2 26,695.61 0.00 35,756.67 26,695.61 -9,061.06
3 39,844.27 0.00 76,780.98 39,844.27 -36,936.71
4 30,363.25 14,605.24 58,883.65 15,758.01 -28,520.41
5 26,427.06 0.00 47,840.71 26,427.06 -21,413.64
6 30,833.95 10,127.70 52,888.18 20,706.25 -22,054.22
7 15,102.32 0.00 26,114.82 15,102.32 -11,012.50
8 14,757.03 0.00 25,045.00 14,757.03 -10,287.97
9 25,778.19 0.00 44,800.79 25,778.19 -19,022.61
10 33,314.76 0.00 54,551.08 33,314.76 -21,236.32
11 16,291.07 7,107.74 24,547.93 9,183.33 -8,256.86
12 23,528.59 0.00 29,700.83 23,528.59 -6,172.24
13 14,072.84 0.00 17,105.63 14,072.84 -3,032.79
14 15,843.67 0.00 31,071.76 15,843.67 -15,228.08
15 24,928.22 0.00 43,584.47 24,928.22 -18,656.25
16 20,803.68 12,771.65 22,936.06 8,032.03 -2,132.38
17 3,337.89 0.00 8,040.29 3,337.89 -4,702.40
18 10,352.81 0.00 27,568.06 10,352.81 -17,215.25
19 16,635.86 0.00 31,509.68 16,635.86 -14,873.83
20 27,953.39 0.00 63,937.83 27,953.39 -35,984.44
21 15,872.58 0.00 40,169.89 15,872.58 -24,297.32
22 7,992.04 0.00 23,836.03 7,992.04 -15,843.98
23 40,673.07 0.00 73,831.87 40,673.07 -33,158.81
24 15,843.67 0.00 29,395.48 15,843.67 -13,551.81
25 15,089.21 0.00 31,848.42 15,089.21 -16,759.21
26 15,402.23 0.00 33,493.09 15,402.23 -18,090.86
27 19,258.08 11,822.79 32,900.23 7,435.29 -13,642.14
28 10,775.80 0.00 33,998.23 10,775.80 -23,222.43
29 26,810.12 0.00 48,226.25 26,810.12 -21,416.13
30 103,110.10 51,790.85 151,969.49 51,319.26 -48,859.38
31 15,843.67 0.00 30,926.27 15,843.67 -15,082.60
32 30,823.26 11,522.75 39,735.19 19,300.51 -8,911.93
33 23,408.32 23,408.32 23,408.32 0.00 0.00
Table 8.3.13: Comparison of reinforcement costs in EUR for EV penetration with UDcharging (scenarios 1a, 4.1a and 4.2a).

D4.3 – B2 “Reinforcement Costs in LV Grids”
Page 86 of 99 GA MOVE/FP7/265499/Green eMotion
Network Net Value CAPEX1 (1a) CAPEX2 (4.1a) CAPEX3 (4.2a) CAPEX1 - CAPEX2 CAPEX1 - CAPEX3
1 60,369.80 25.6% 0.0% 55.3% 25.6% -29.6%
2 55,860.70 47.8% 0.0% 64.0% 47.8% -16.2%
3 48,450.00 82.2% 0.0% 158.5% 82.2% -76.2%
4 75,085.50 40.4% 19.5% 78.4% 21.0% -38.0%
5 36,075.00 73.3% 0.0% 132.6% 73.3% -59.4%
6 65,175.00 47.3% 15.5% 81.1% 31.8% -33.8%
7 33,400.50 45.2% 0.0% 78.2% 45.2% -33.0%
8 71,873.00 20.5% 0.0% 34.8% 20.5% -14.3%
9 39,053.20 66.0% 0.0% 114.7% 66.0% -48.7%
10 58,064.10 57.4% 0.0% 93.9% 57.4% -36.6%
11 38,613.00 42.2% 18.4% 63.6% 23.8% -21.4%
12 36,930.90 63.7% 0.0% 80.4% 63.7% -16.7%
13 22,982.80 61.2% 0.0% 74.4% 61.2% -13.2%
14 67,865.36 23.3% 0.0% 45.8% 23.3% -22.4%
15 47,124.00 52.9% 0.0% 92.5% 52.9% -39.6%
16 117,356.90 17.7% 10.9% 19.5% 6.8% -1.8%
17 32,325.50 10.3% 0.0% 24.9% 10.3% -14.5%
18 25,933.50 39.9% 0.0% 106.3% 39.9% -66.4%
19 41,781.75 39.8% 0.0% 75.4% 39.8% -35.6%
20 27,418.50 102.0% 0.0% 233.2% 102.0% -131.2%
21 35,208.75 45.1% 0.0% 114.1% 45.1% -69.0%
22 29,112.00 27.5% 0.0% 81.9% 27.5% -54.4%
23 30,327.60 134.1% 0.0% 243.4% 134.1% -109.3%
24 18,903.50 83.8% 0.0% 155.5% 83.8% -71.7%
25 36,175.60 41.7% 0.0% 88.0% 41.7% -46.3%
26 25,991.00 59.3% 0.0% 128.9% 59.3% -69.6%
27 25,166.90 76.5% 47.0% 130.7% 29.5% -54.2%
28 51,019.70 21.1% 0.0% 66.6% 21.1% -45.5%
29 35,772.50 74.9% 0.0% 134.8% 74.9% -59.9%
30 133,988.90 77.0% 38.7% 113.4% 38.3% -36.5%
31 27,795.60 57.0% 0.0% 111.3% 57.0% -54.3%
32 80,562.80 38.3% 14.3% 49.3% 24.0% -11.1%
33 18,000.00 130.0% 130.0% 130.0% 0.0% 0.0%
Table 8.3.14: Comparison of reinforcement costs in % of network value for EV penetrationwith UD charging (scenarios 1a, 4.1a and 4.2a). Network value is in EUR.
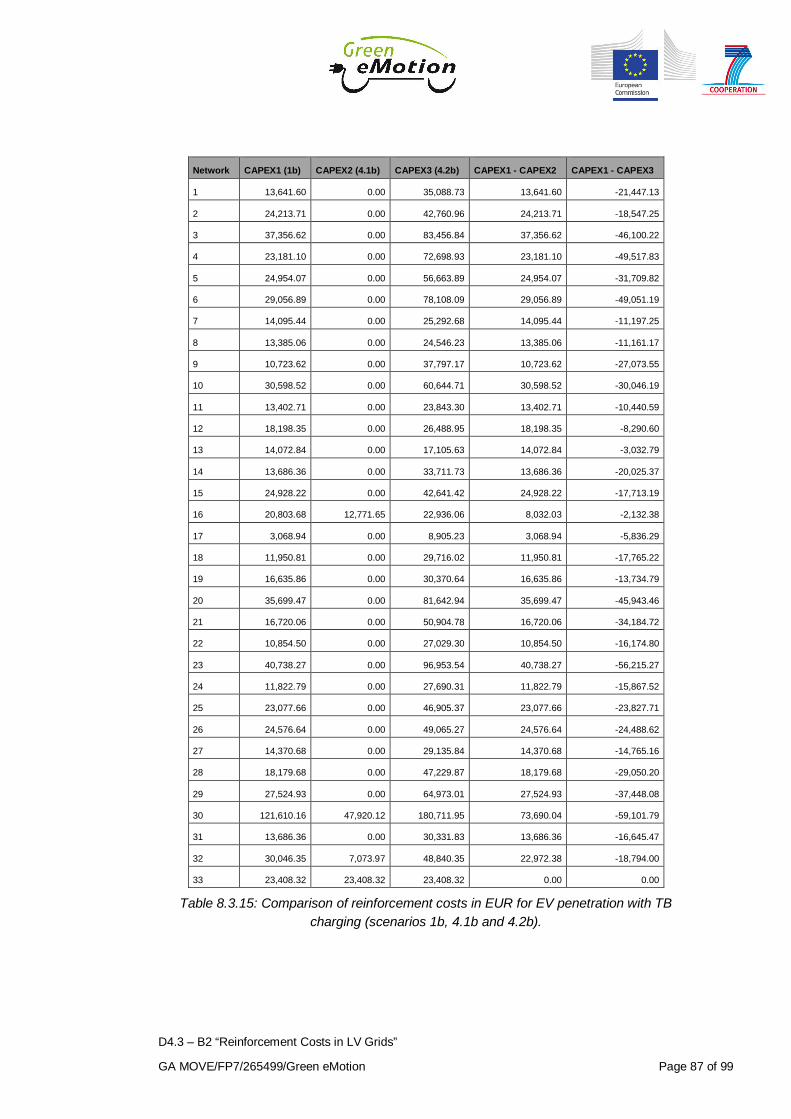
D4.3 – B2 “Reinforcement Costs in LV Grids”
GA MOVE/FP7/265499/Green eMotion Page 87 of 99
Network CAPEX1 (1b) CAPEX2 (4.1b) CAPEX3 (4.2b) CAPEX1 - CAPEX2 CAPEX1 - CAPEX3
1 13,641.60 0.00 35,088.73 13,641.60 -21,447.13
2 24,213.71 0.00 42,760.96 24,213.71 -18,547.25
3 37,356.62 0.00 83,456.84 37,356.62 -46,100.22
4 23,181.10 0.00 72,698.93 23,181.10 -49,517.83
5 24,954.07 0.00 56,663.89 24,954.07 -31,709.82
6 29,056.89 0.00 78,108.09 29,056.89 -49,051.19
7 14,095.44 0.00 25,292.68 14,095.44 -11,197.25
8 13,385.06 0.00 24,546.23 13,385.06 -11,161.17
9 10,723.62 0.00 37,797.17 10,723.62 -27,073.55
10 30,598.52 0.00 60,644.71 30,598.52 -30,046.19
11 13,402.71 0.00 23,843.30 13,402.71 -10,440.59
12 18,198.35 0.00 26,488.95 18,198.35 -8,290.60
13 14,072.84 0.00 17,105.63 14,072.84 -3,032.79
14 13,686.36 0.00 33,711.73 13,686.36 -20,025.37
15 24,928.22 0.00 42,641.42 24,928.22 -17,713.19
16 20,803.68 12,771.65 22,936.06 8,032.03 -2,132.38
17 3,068.94 0.00 8,905.23 3,068.94 -5,836.29
18 11,950.81 0.00 29,716.02 11,950.81 -17,765.22
19 16,635.86 0.00 30,370.64 16,635.86 -13,734.79
20 35,699.47 0.00 81,642.94 35,699.47 -45,943.46
21 16,720.06 0.00 50,904.78 16,720.06 -34,184.72
22 10,854.50 0.00 27,029.30 10,854.50 -16,174.80
23 40,738.27 0.00 96,953.54 40,738.27 -56,215.27
24 11,822.79 0.00 27,690.31 11,822.79 -15,867.52
25 23,077.66 0.00 46,905.37 23,077.66 -23,827.71
26 24,576.64 0.00 49,065.27 24,576.64 -24,488.62
27 14,370.68 0.00 29,135.84 14,370.68 -14,765.16
28 18,179.68 0.00 47,229.87 18,179.68 -29,050.20
29 27,524.93 0.00 64,973.01 27,524.93 -37,448.08
30 121,610.16 47,920.12 180,711.95 73,690.04 -59,101.79
31 13,686.36 0.00 30,331.83 13,686.36 -16,645.47
32 30,046.35 7,073.97 48,840.35 22,972.38 -18,794.00
33 23,408.32 23,408.32 23,408.32 0.00 0.00
Table 8.3.15: Comparison of reinforcement costs in EUR for EV penetration with TBcharging (scenarios 1b, 4.1b and 4.2b).

D4.3 – B2 “Reinforcement Costs in LV Grids”
Page 88 of 99 GA MOVE/FP7/265499/Green eMotion
Network Net Value CAPEX1 (1b) CAPEX2 (4.1b) CAPEX3 (4.2b) CAPEX1 - CAPEX2 CAPEX1 - CAPEX3
1 60,369.80 22.6% 0.0% 58.1% 22.6% -35.5%
2 55,860.70 43.3% 0.0% 76.5% 43.3% -33.2%
3 48,450.00 77.1% 0.0% 172.3% 77.1% -95.2%
4 75,085.50 30.9% 0.0% 96.8% 30.9% -65.9%
5 36,075.00 69.2% 0.0% 157.1% 69.2% -87.9%
6 65,175.00 44.6% 0.0% 119.8% 44.6% -75.3%
7 33,400.50 42.2% 0.0% 75.7% 42.2% -33.5%
8 71,873.00 18.6% 0.0% 34.2% 18.6% -15.5%
9 39,053.20 27.5% 0.0% 96.8% 27.5% -69.3%
10 58,064.10 52.7% 0.0% 104.4% 52.7% -51.7%
11 38,613.00 34.7% 0.0% 61.7% 34.7% -27.0%
12 36,930.90 49.3% 0.0% 71.7% 49.3% -22.4%
13 22,982.80 61.2% 0.0% 74.4% 61.2% -13.2%
14 67,865.36 20.2% 0.0% 49.7% 20.2% -29.5%
15 47,124.00 52.9% 0.0% 90.5% 52.9% -37.6%
16 117,356.90 17.7% 10.9% 19.5% 6.8% -1.8%
17 32,325.50 9.5% 0.0% 27.5% 9.5% -18.1%
18 25,933.50 46.1% 0.0% 114.6% 46.1% -68.5%
19 41,781.75 39.8% 0.0% 72.7% 39.8% -32.9%
20 27,418.50 130.2% 0.0% 297.8% 130.2% -167.6%
21 35,208.75 47.5% 0.0% 144.6% 47.5% -97.1%
22 29,112.00 37.3% 0.0% 92.8% 37.3% -55.6%
23 30,327.60 134.3% 0.0% 319.7% 134.3% -185.4%
24 18,903.50 62.5% 0.0% 146.5% 62.5% -83.9%
25 36,175.60 63.8% 0.0% 129.7% 63.8% -65.9%
26 25,991.00 94.6% 0.0% 188.8% 94.6% -94.2%
27 25,166.90 57.1% 0.0% 115.8% 57.1% -58.7%
28 51,019.70 35.6% 0.0% 92.6% 35.6% -56.9%
29 35,772.50 76.9% 0.0% 181.6% 76.9% -104.7%
30 133,988.90 90.8% 35.8% 134.9% 55.0% -44.1%
31 27,795.60 49.2% 0.0% 109.1% 49.2% -59.9%
32 80,562.80 37.3% 8.8% 60.6% 28.5% -23.3%
33 18,000.00 130.0% 130.0% 130.0% 0.0% 0.0%
Table 8.3.16: Comparison of reinforcement costs in % of network value for EV penetrationwith TB charging (scenarios 1b, 4.1b and 4.2b). Network value is in EUR.

D4.3 – B2 “Reinforcement Costs in LV Grids”
GA MOVE/FP7/265499/Green eMotion Page 89 of 99
Network CAPEX1 (1c) CAPEX2 (4.1c) CAPEX3 (4.2c) CAPEX1 - CAPEX2 CAPEX1 - CAPEX3
1 0.00 0.00 0.00 0.00 0.00
2 0.00 0.00 0.00 0.00 0.00
3 0.00 0.00 0.00 0.00 0.00
4 0.00 0.00 0.00 0.00 0.00
5 0.00 0.00 0.00 0.00 0.00
6 0.00 0.00 0.00 0.00 0.00
7 0.00 0.00 0.00 0.00 0.00
8 0.00 0.00 0.00 0.00 0.00
9 0.00 0.00 0.00 0.00 0.00
10 0.00 0.00 0.00 0.00 0.00
11 0.00 0.00 0.00 0.00 0.00
12 0.00 0.00 0.00 0.00 0.00
13 0.00 0.00 0.00 0.00 0.00
14 0.00 0.00 0.00 0.00 0.00
15 0.00 0.00 7,621.08 0.00 -7,621.08
16 0.00 0.00 0.00 0.00 0.00
17 0.00 0.00 0.00 0.00 0.00
18 0.00 0.00 0.00 0.00 0.00
19 0.00 0.00 7,621.08 0.00 -7,621.08
20 0.00 0.00 0.00 0.00 0.00
21 0.00 0.00 0.00 0.00 0.00
22 0.00 0.00 0.00 0.00 0.00
23 0.00 0.00 0.00 0.00 0.00
24 0.00 0.00 0.00 0.00 0.00
25 0.00 0.00 0.00 0.00 0.00
26 0.00 0.00 0.00 0.00 0.00
27 0.00 0.00 0.00 0.00 0.00
28 0.00 0.00 0.00 0.00 0.00
29 0.00 0.00 0.00 0.00 0.00
30 40,162.37 40,162.37 40,162.37 0.00 0.00
31 0.00 0.00 0.00 0.00 0.00
32 0.00 0.00 0.00 0.00 0.00
33 23,408.32 23,408.32 23,408.32 0.00 0.00
Table 8.3.17: Comparison of reinforcement costs in EUR for EV penetration with LDcharging (scenarios 1c, 4.1c and 4.2c).
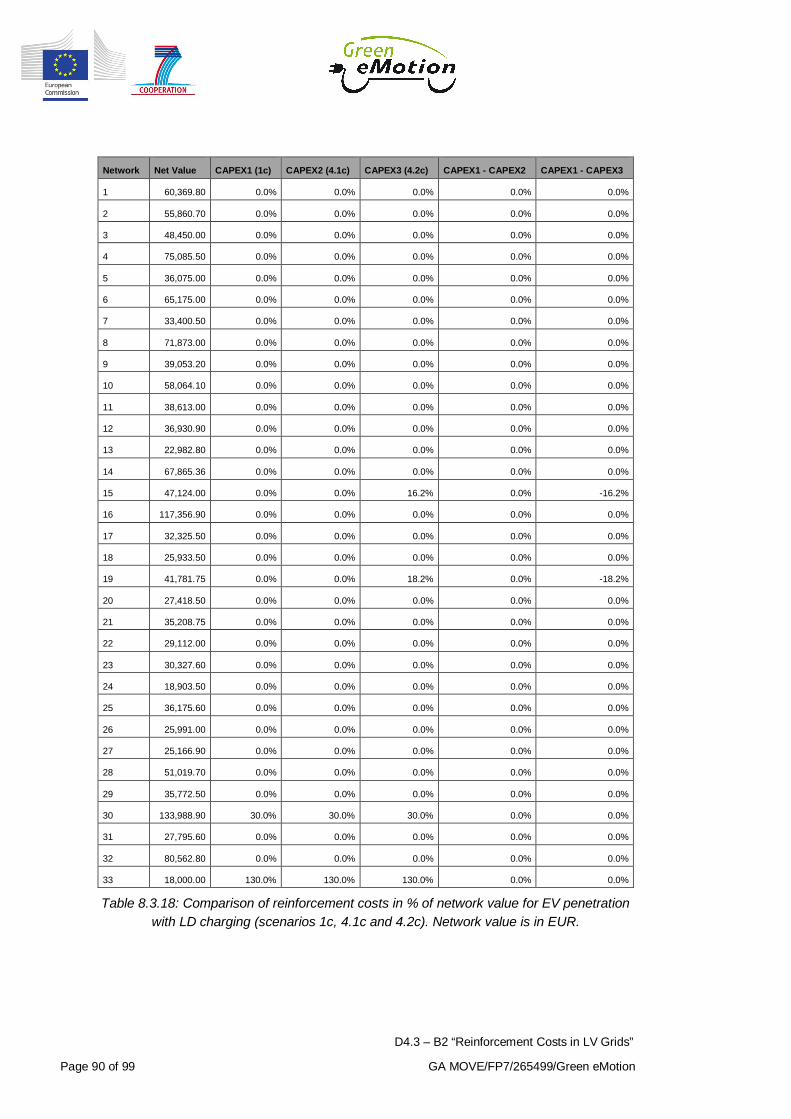
D4.3 – B2 “Reinforcement Costs in LV Grids”
Page 90 of 99 GA MOVE/FP7/265499/Green eMotion
Network Net Value CAPEX1 (1c) CAPEX2 (4.1c) CAPEX3 (4.2c) CAPEX1 - CAPEX2 CAPEX1 - CAPEX3
1 60,369.80 0.0% 0.0% 0.0% 0.0% 0.0%
2 55,860.70 0.0% 0.0% 0.0% 0.0% 0.0%
3 48,450.00 0.0% 0.0% 0.0% 0.0% 0.0%
4 75,085.50 0.0% 0.0% 0.0% 0.0% 0.0%
5 36,075.00 0.0% 0.0% 0.0% 0.0% 0.0%
6 65,175.00 0.0% 0.0% 0.0% 0.0% 0.0%
7 33,400.50 0.0% 0.0% 0.0% 0.0% 0.0%
8 71,873.00 0.0% 0.0% 0.0% 0.0% 0.0%
9 39,053.20 0.0% 0.0% 0.0% 0.0% 0.0%
10 58,064.10 0.0% 0.0% 0.0% 0.0% 0.0%
11 38,613.00 0.0% 0.0% 0.0% 0.0% 0.0%
12 36,930.90 0.0% 0.0% 0.0% 0.0% 0.0%
13 22,982.80 0.0% 0.0% 0.0% 0.0% 0.0%
14 67,865.36 0.0% 0.0% 0.0% 0.0% 0.0%
15 47,124.00 0.0% 0.0% 16.2% 0.0% -16.2%
16 117,356.90 0.0% 0.0% 0.0% 0.0% 0.0%
17 32,325.50 0.0% 0.0% 0.0% 0.0% 0.0%
18 25,933.50 0.0% 0.0% 0.0% 0.0% 0.0%
19 41,781.75 0.0% 0.0% 18.2% 0.0% -18.2%
20 27,418.50 0.0% 0.0% 0.0% 0.0% 0.0%
21 35,208.75 0.0% 0.0% 0.0% 0.0% 0.0%
22 29,112.00 0.0% 0.0% 0.0% 0.0% 0.0%
23 30,327.60 0.0% 0.0% 0.0% 0.0% 0.0%
24 18,903.50 0.0% 0.0% 0.0% 0.0% 0.0%
25 36,175.60 0.0% 0.0% 0.0% 0.0% 0.0%
26 25,991.00 0.0% 0.0% 0.0% 0.0% 0.0%
27 25,166.90 0.0% 0.0% 0.0% 0.0% 0.0%
28 51,019.70 0.0% 0.0% 0.0% 0.0% 0.0%
29 35,772.50 0.0% 0.0% 0.0% 0.0% 0.0%
30 133,988.90 30.0% 30.0% 30.0% 0.0% 0.0%
31 27,795.60 0.0% 0.0% 0.0% 0.0% 0.0%
32 80,562.80 0.0% 0.0% 0.0% 0.0% 0.0%
33 18,000.00 130.0% 130.0% 130.0% 0.0% 0.0%
Table 8.3.18: Comparison of reinforcement costs in % of network value for EV penetrationwith LD charging (scenarios 1c, 4.1c and 4.2c). Network value is in EUR.

D4.3 – B2 “Reinforcement Costs in LV Grids”
GA MOVE/FP7/265499/Green eMotion Page 91 of 99
Network CAPEX1 (1a) CAPEX2 (5a) CAPEX1 - CAPEX2
1 15,474.52 81,064.86 -65,590.35
2 26,695.61 107,574.83 -80,879.22
3 39,844.27 180,773.53 -140,929.26
4 30,363.25 128,817.73 -98,454.48
5 26,427.06 116,436.95 -90,009.88
6 30,833.95 156,345.46 -125,511.50
7 15,102.32 85,356.44 -70,254.12
8 14,757.03 86,579.22 -71,822.20
9 25,778.19 112,064.48 -86,286.29
10 33,314.76 146,814.49 -113,499.73
11 16,291.07 60,247.60 -43,956.53
12 23,528.59 65,007.07 -41,478.48
13 14,072.84 46,199.76 -32,126.92
14 15,843.67 102,448.04 -86,604.37
15 24,928.22 108,044.41 -83,116.19
16 20,803.68 42,589.56 -21,785.88
17 3,337.89 28,476.96 -25,139.07
18 10,352.81 62,347.91 -51,995.10
19 16,635.86 86,954.56 -70,318.71
20 27,953.39 125,360.94 -97,407.55
21 15,872.58 92,460.85 -76,588.27
22 7,992.04 48,742.55 -40,750.50
23 40,673.07 145,993.29 -105,320.23
24 15,843.67 65,611.89 -49,768.22
25 15,089.21 100,820.12 -85,730.91
26 15,402.23 104,839.16 -89,436.94
27 19,258.08 83,996.43 -64,738.34
28 10,775.80 74,399.83 -63,624.03
29 26,810.12 92,097.17 -65,287.05
30 103,110.10 208,799.90 -105,689.80
31 15,843.67 102,865.39 -87,021.71
32 30,823.26 138,402.50 -107,579.24
33 23,408.32 23,408.32 0.00
Table 8.3.19: Comparison of reinforcement costs in EUR for charging power with UDcharging (scenarios 1a and 5a).
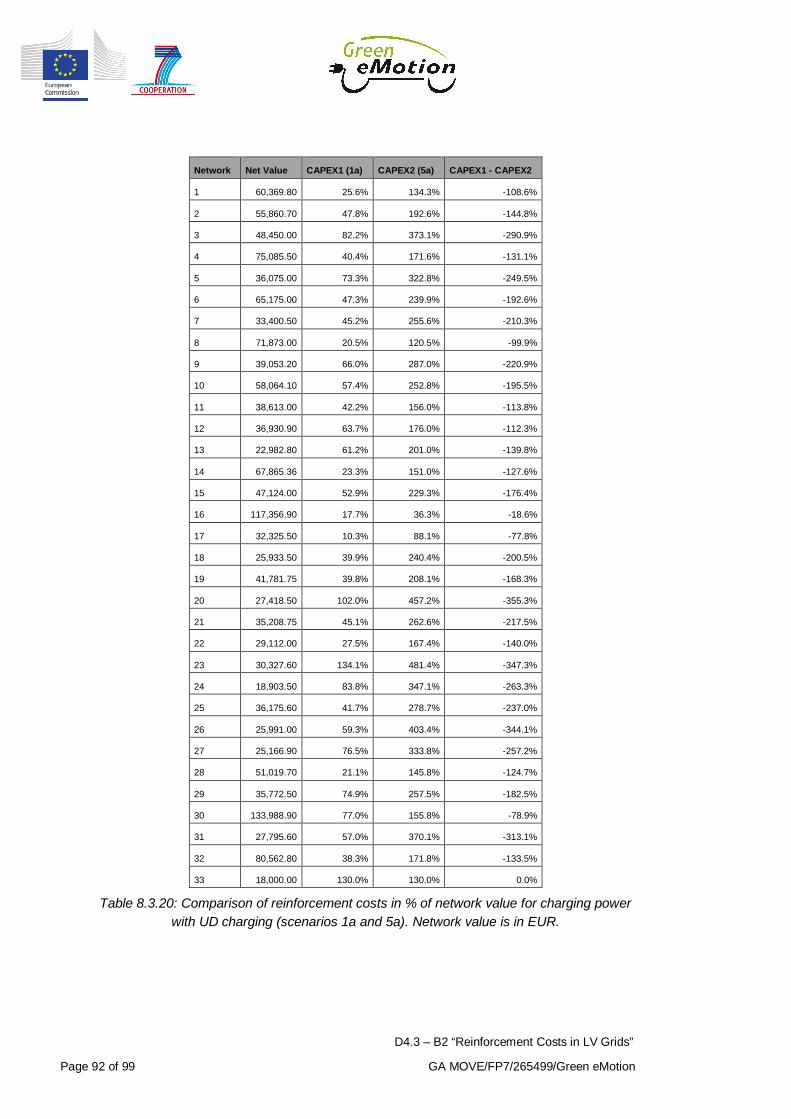
D4.3 – B2 “Reinforcement Costs in LV Grids”
Page 92 of 99 GA MOVE/FP7/265499/Green eMotion
Network Net Value CAPEX1 (1a) CAPEX2 (5a) CAPEX1 - CAPEX2
1 60,369.80 25.6% 134.3% -108.6%
2 55,860.70 47.8% 192.6% -144.8%
3 48,450.00 82.2% 373.1% -290.9%
4 75,085.50 40.4% 171.6% -131.1%
5 36,075.00 73.3% 322.8% -249.5%
6 65,175.00 47.3% 239.9% -192.6%
7 33,400.50 45.2% 255.6% -210.3%
8 71,873.00 20.5% 120.5% -99.9%
9 39,053.20 66.0% 287.0% -220.9%
10 58,064.10 57.4% 252.8% -195.5%
11 38,613.00 42.2% 156.0% -113.8%
12 36,930.90 63.7% 176.0% -112.3%
13 22,982.80 61.2% 201.0% -139.8%
14 67,865.36 23.3% 151.0% -127.6%
15 47,124.00 52.9% 229.3% -176.4%
16 117,356.90 17.7% 36.3% -18.6%
17 32,325.50 10.3% 88.1% -77.8%
18 25,933.50 39.9% 240.4% -200.5%
19 41,781.75 39.8% 208.1% -168.3%
20 27,418.50 102.0% 457.2% -355.3%
21 35,208.75 45.1% 262.6% -217.5%
22 29,112.00 27.5% 167.4% -140.0%
23 30,327.60 134.1% 481.4% -347.3%
24 18,903.50 83.8% 347.1% -263.3%
25 36,175.60 41.7% 278.7% -237.0%
26 25,991.00 59.3% 403.4% -344.1%
27 25,166.90 76.5% 333.8% -257.2%
28 51,019.70 21.1% 145.8% -124.7%
29 35,772.50 74.9% 257.5% -182.5%
30 133,988.90 77.0% 155.8% -78.9%
31 27,795.60 57.0% 370.1% -313.1%
32 80,562.80 38.3% 171.8% -133.5%
33 18,000.00 130.0% 130.0% 0.0%
Table 8.3.20: Comparison of reinforcement costs in % of network value for charging powerwith UD charging (scenarios 1a and 5a). Network value is in EUR.
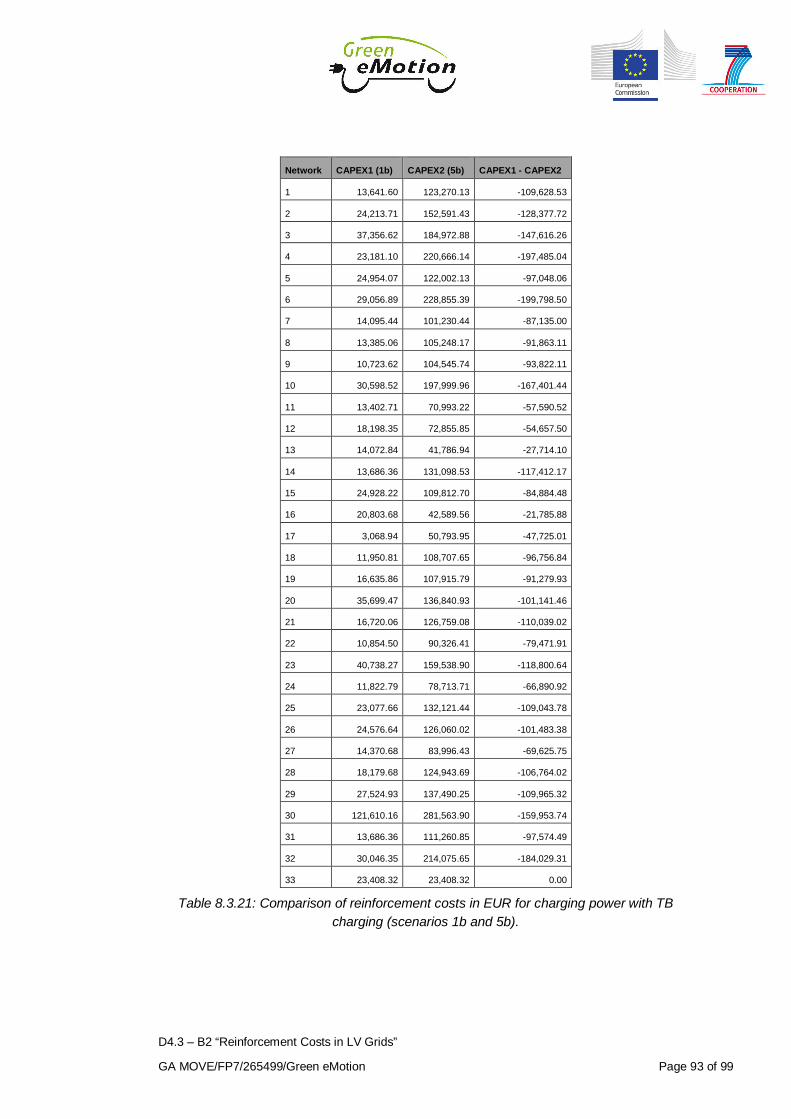
D4.3 – B2 “Reinforcement Costs in LV Grids”
GA MOVE/FP7/265499/Green eMotion Page 93 of 99
Network CAPEX1 (1b) CAPEX2 (5b) CAPEX1 - CAPEX2
1 13,641.60 123,270.13 -109,628.53
2 24,213.71 152,591.43 -128,377.72
3 37,356.62 184,972.88 -147,616.26
4 23,181.10 220,666.14 -197,485.04
5 24,954.07 122,002.13 -97,048.06
6 29,056.89 228,855.39 -199,798.50
7 14,095.44 101,230.44 -87,135.00
8 13,385.06 105,248.17 -91,863.11
9 10,723.62 104,545.74 -93,822.11
10 30,598.52 197,999.96 -167,401.44
11 13,402.71 70,993.22 -57,590.52
12 18,198.35 72,855.85 -54,657.50
13 14,072.84 41,786.94 -27,714.10
14 13,686.36 131,098.53 -117,412.17
15 24,928.22 109,812.70 -84,884.48
16 20,803.68 42,589.56 -21,785.88
17 3,068.94 50,793.95 -47,725.01
18 11,950.81 108,707.65 -96,756.84
19 16,635.86 107,915.79 -91,279.93
20 35,699.47 136,840.93 -101,141.46
21 16,720.06 126,759.08 -110,039.02
22 10,854.50 90,326.41 -79,471.91
23 40,738.27 159,538.90 -118,800.64
24 11,822.79 78,713.71 -66,890.92
25 23,077.66 132,121.44 -109,043.78
26 24,576.64 126,060.02 -101,483.38
27 14,370.68 83,996.43 -69,625.75
28 18,179.68 124,943.69 -106,764.02
29 27,524.93 137,490.25 -109,965.32
30 121,610.16 281,563.90 -159,953.74
31 13,686.36 111,260.85 -97,574.49
32 30,046.35 214,075.65 -184,029.31
33 23,408.32 23,408.32 0.00
Table 8.3.21: Comparison of reinforcement costs in EUR for charging power with TBcharging (scenarios 1b and 5b).

D4.3 – B2 “Reinforcement Costs in LV Grids”
Page 94 of 99 GA MOVE/FP7/265499/Green eMotion
Network Net Value CAPEX1 (1b) CAPEX2 (5b) CAPEX1 - CAPEX2
1 60,369.80 22.6% 204.2% -181.6%
2 55,860.70 43.3% 273.2% -229.8%
3 48,450.00 77.1% 381.8% -304.7%
4 75,085.50 30.9% 293.9% -263.0%
5 36,075.00 69.2% 338.2% -269.0%
6 65,175.00 44.6% 351.1% -306.6%
7 33,400.50 42.2% 303.1% -260.9%
8 71,873.00 18.6% 146.4% -127.8%
9 39,053.20 27.5% 267.7% -240.2%
10 58,064.10 52.7% 341.0% -288.3%
11 38,613.00 34.7% 183.9% -149.1%
12 36,930.90 49.3% 197.3% -148.0%
13 22,982.80 61.2% 181.8% -120.6%
14 67,865.36 20.2% 193.2% -173.0%
15 47,124.00 52.9% 233.0% -180.1%
16 117,356.90 17.7% 36.3% -18.6%
17 32,325.50 9.5% 157.1% -147.6%
18 25,933.50 46.1% 419.2% -373.1%
19 41,781.75 39.8% 258.3% -218.5%
20 27,418.50 130.2% 499.1% -368.9%
21 35,208.75 47.5% 360.0% -312.5%
22 29,112.00 37.3% 310.3% -273.0%
23 30,327.60 134.3% 526.1% -391.7%
24 18,903.50 62.5% 416.4% -353.9%
25 36,175.60 63.8% 365.2% -301.4%
26 25,991.00 94.6% 485.0% -390.5%
27 25,166.90 57.1% 333.8% -276.7%
28 51,019.70 35.6% 244.9% -209.3%
29 35,772.50 76.9% 384.3% -307.4%
30 133,988.90 90.8% 210.1% -119.4%
31 27,795.60 49.2% 400.3% -351.0%
32 80,562.80 37.3% 265.7% -228.4%
33 18,000.00 130.0% 130.0% 0.0%
Table 8.3.22: Comparison of reinforcement costs in % of network value for charging powerwith TB charging (scenarios 1b and 5b). Network value is in EUR.
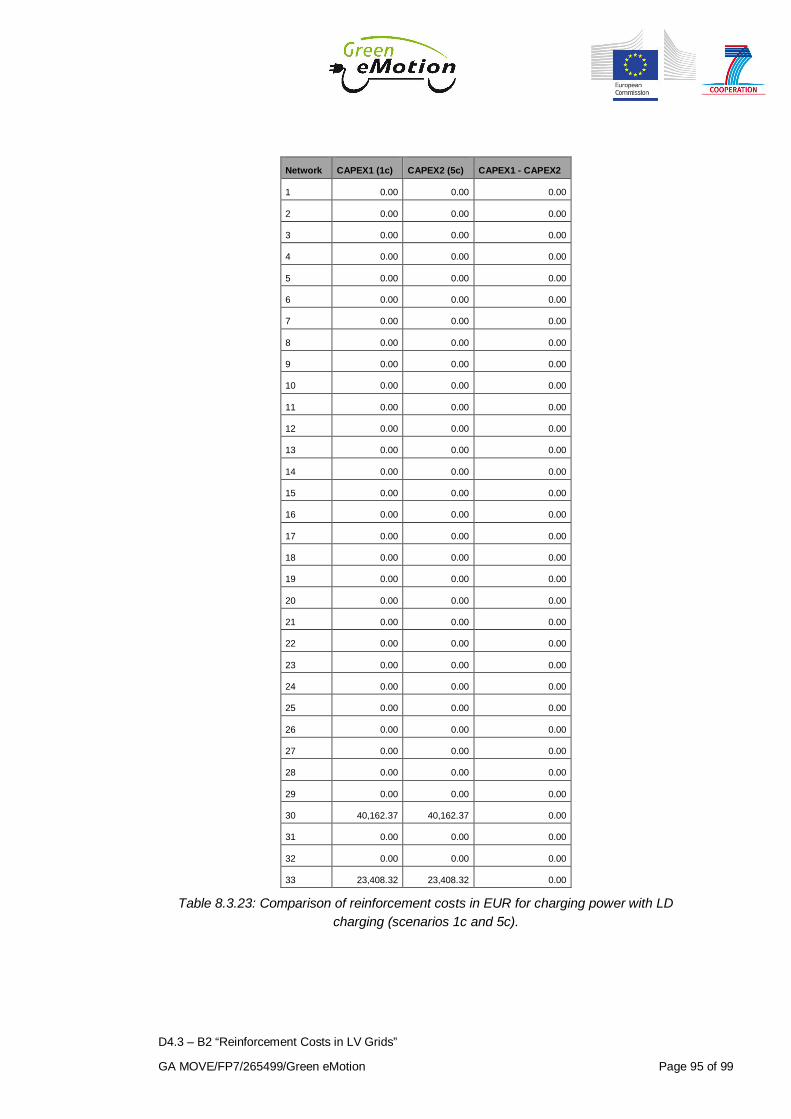
D4.3 – B2 “Reinforcement Costs in LV Grids”
GA MOVE/FP7/265499/Green eMotion Page 95 of 99
Network CAPEX1 (1c) CAPEX2 (5c) CAPEX1 - CAPEX2
1 0.00 0.00 0.00
2 0.00 0.00 0.00
3 0.00 0.00 0.00
4 0.00 0.00 0.00
5 0.00 0.00 0.00
6 0.00 0.00 0.00
7 0.00 0.00 0.00
8 0.00 0.00 0.00
9 0.00 0.00 0.00
10 0.00 0.00 0.00
11 0.00 0.00 0.00
12 0.00 0.00 0.00
13 0.00 0.00 0.00
14 0.00 0.00 0.00
15 0.00 0.00 0.00
16 0.00 0.00 0.00
17 0.00 0.00 0.00
18 0.00 0.00 0.00
19 0.00 0.00 0.00
20 0.00 0.00 0.00
21 0.00 0.00 0.00
22 0.00 0.00 0.00
23 0.00 0.00 0.00
24 0.00 0.00 0.00
25 0.00 0.00 0.00
26 0.00 0.00 0.00
27 0.00 0.00 0.00
28 0.00 0.00 0.00
29 0.00 0.00 0.00
30 40,162.37 40,162.37 0.00
31 0.00 0.00 0.00
32 0.00 0.00 0.00
33 23,408.32 23,408.32 0.00
Table 8.3.23: Comparison of reinforcement costs in EUR for charging power with LDcharging (scenarios 1c and 5c).
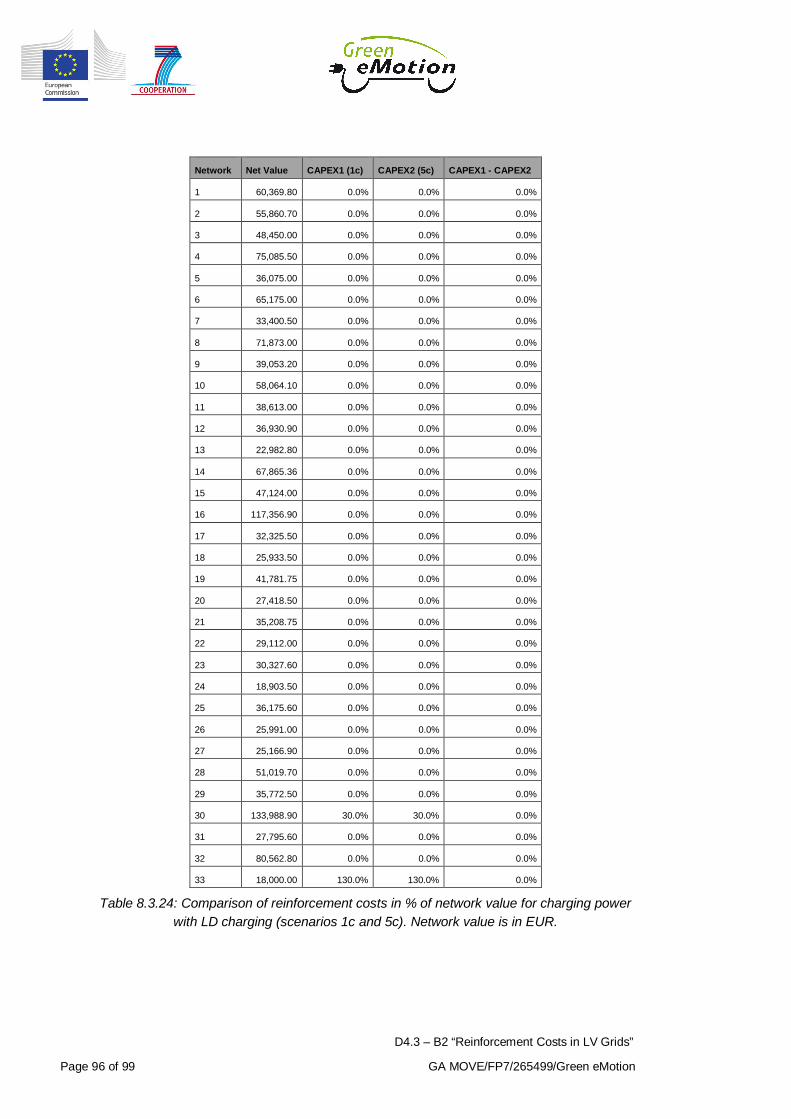
D4.3 – B2 “Reinforcement Costs in LV Grids”
Page 96 of 99 GA MOVE/FP7/265499/Green eMotion
Network Net Value CAPEX1 (1c) CAPEX2 (5c) CAPEX1 - CAPEX2
1 60,369.80 0.0% 0.0% 0.0%
2 55,860.70 0.0% 0.0% 0.0%
3 48,450.00 0.0% 0.0% 0.0%
4 75,085.50 0.0% 0.0% 0.0%
5 36,075.00 0.0% 0.0% 0.0%
6 65,175.00 0.0% 0.0% 0.0%
7 33,400.50 0.0% 0.0% 0.0%
8 71,873.00 0.0% 0.0% 0.0%
9 39,053.20 0.0% 0.0% 0.0%
10 58,064.10 0.0% 0.0% 0.0%
11 38,613.00 0.0% 0.0% 0.0%
12 36,930.90 0.0% 0.0% 0.0%
13 22,982.80 0.0% 0.0% 0.0%
14 67,865.36 0.0% 0.0% 0.0%
15 47,124.00 0.0% 0.0% 0.0%
16 117,356.90 0.0% 0.0% 0.0%
17 32,325.50 0.0% 0.0% 0.0%
18 25,933.50 0.0% 0.0% 0.0%
19 41,781.75 0.0% 0.0% 0.0%
20 27,418.50 0.0% 0.0% 0.0%
21 35,208.75 0.0% 0.0% 0.0%
22 29,112.00 0.0% 0.0% 0.0%
23 30,327.60 0.0% 0.0% 0.0%
24 18,903.50 0.0% 0.0% 0.0%
25 36,175.60 0.0% 0.0% 0.0%
26 25,991.00 0.0% 0.0% 0.0%
27 25,166.90 0.0% 0.0% 0.0%
28 51,019.70 0.0% 0.0% 0.0%
29 35,772.50 0.0% 0.0% 0.0%
30 133,988.90 30.0% 30.0% 0.0%
31 27,795.60 0.0% 0.0% 0.0%
32 80,562.80 0.0% 0.0% 0.0%
33 18,000.00 130.0% 130.0% 0.0%
Table 8.3.24: Comparison of reinforcement costs in % of network value for charging powerwith LD charging (scenarios 1c and 5c). Network value is in EUR.

D4.3 – B2 “Reinforcement Costs in LV Grids”
GA MOVE/FP7/265499/Green eMotion Page 97 of 99
8.4 Scenarios
Several scenarios were created to investigate the impact of different parameters onreinforcement and reinforcement costs.
The first three scenarios (0a, 0b and 0c) are constructed to evaluate how many EVsthe networks can facilitate with three different charging profiles. No load offset isapplied and the number of EVs increases linearly from 0% to 100% in the 25 yearreinforcement schedule. Slow chargers are used as they are representative ofcurrent home chargers. Voltage limits are set to allow 5% voltage drop and EVs areplaced according to the distributed profile.
The scenarios 1a, 1b and 1c are constructed to be the baseline for all parameterevaluation. The three scenarios are constructed to reflect the expected EVdevelopment. Load offset is then used to shift the reinforcement schedules so theeffect of different parameters can be evaluated.Apart from the charging profile, the three scenarios are identical. Distributed EVlocation is used, which is not overly pessimistic with regards to the location of theEVs. EV penetration rate is set to medium, which is the expected EV penetrationaccording to current forecasts (when the startup period is ignored). Slow chargersare used as they are representative of current home chargers and most likely alsofuture home chargers. A maximum voltage drop of 5% is allowed, which is not anuncommon value when evaluating and planning LV feeders.
Scenarios 2.1 and 2.2 are constructed to investigate the effect of voltage control.They are based on scenario 1a and vary the voltage settings to allow a largervoltage drop (10% and 15% respectively).
Scenarios 3.1 and 3.2 are constructed to investigate the effect of EV location. Theyare based on scenario 1a and only vary the EV location. Being a worst case and abest case, they are corner cases that set the boundaries which all other cases liewithin.
Scenarios 4.1 and 4.2 are constructed to investigate the effect of EV penetration.They mirror the baseline scenarios 1a to 1c, and only modify the EV penetrationrate. 4.1a to 4.1c use a low penetration rate and 4.2a to 4.2c use a high penetration

D4.3 – B2 “Reinforcement Costs in LV Grids”
Page 98 of 99 GA MOVE/FP7/265499/Green eMotion
rate. They thus represent a slow than expected and a faster than expected EVpenetration.
Scenarios 5a to 5c are constructed to investigate the effect of charging power. Theymirror the baseline scenarios 1a to 1c, and only modify the charging power.
An overview of all the scenarios is given in Table 8.4.1.

D4.3 – B2 “Reinforcement Costs in LV Grids”
GA MOVE/FP7/265499/Green eMotion Page 99 of 99
Offs
et
No
No
No
Yes
Yes
Yes
Yes
Yes
Yes
Yes
Yes
Yes
Yes
Yes
Yes
Yes
Yes
Yes
Yes
EVC
harg
ing
Pow
er
Slo
w
Slo
w
Slo
w
Slo
w
Slo
w
Slo
w
Slo
w
Slo
w
Slo
w
Slo
w
Slo
w
Slo
w
Slo
w
Slo
w
Slo
w
Slo
w
Fast
Fast
Fast
EVC
harg
ing
Prof
ile
Load
Dep
ende
nt
x x x x x
Tim
er
Bas
ed
x x x x x
Use
r
Dep
ende
nt
x x x x x x x x x
Volta
geSe
tting
s
Use
t
1 1 1 1 1 1 1 1.05
1 1 1 1 1 1 1 1 1 1 1
Um
ax
1.1
1.1
1.1
1.1
1.1
1.1
1.1
1.1
1.1
1.1
1.1
1.1
1.1
1.1
1.1
1.1
1.1
1.1
1.1
Um
in
0.95
0.95
0.95
0.95
0.95
0.95
0.9
0.9
0.95
0.95
0.95
0.95
0.95
0.95
0.95
0.95
0.95
0.95
0.95
EV Pene
trat
ion
100
100
100
Med
Med
Med
Med
Med
Med
Med
Low
Low
Low
Hig
h
Hig
h
Hig
h
Med
Med
Med
EV Loca
tion
Dis
tribu
ted
Dis
tribu
ted
Dis
tribu
ted
Dis
tribu
ted
Dis
tribu
ted
Dis
tribu
ted
Dis
tribu
ted
Dis
tribu
ted
Wor
stca
se
Bes
tcas
e
Dis
tribu
ted
Dis
tribu
ted
Dis
tribu
ted
Dis
tribu
ted
Dis
tribu
ted
Dis
tribu
ted
Dis
tribu
ted
Dis
tribu
ted
Dis
tribu
ted
Cal
cula
tion
Scen
ario
0a 0b 0c 1a 1b 1c 2.1
2.2
3.1
3.2
4.1a
4.1b
4.1c
4.2a
4.2b
4.2c
5a 5b 5c
Table 8.4.1: Overview of calculation scenarios.


![Multi-Agent Reinforcement Learning via Double Averaging ......swarm robotics [23, 8], and power grids [3, 13], which strongly motivates the development of a multi-agent RL strategy.](https://static.fdocuments.net/doc/165x107/6015ec9def6dbf19b72d1251/multi-agent-reinforcement-learning-via-double-averaging-swarm-robotics-23.jpg)