REHABILITATION ENGINEERING RESEARCH CENTER ON TECHNOLOGY TRANSFER (T 2 RERC) TRAINING MODULES ON...
24
REHABILITATION ENGINEERING RESEARCH CENTER ON TECHNOLOGY TRANSFER (T 2 RERC) TRAINING MODULES ON TECHNOLOGY TRANSFER MODULE 8: PROJECT TRACKING AND EVALUATION
-
Upload
amara-coyle -
Category
Documents
-
view
218 -
download
2
Transcript of REHABILITATION ENGINEERING RESEARCH CENTER ON TECHNOLOGY TRANSFER (T 2 RERC) TRAINING MODULES ON...

REHABILITATION ENGINEERING RESEARCH CENTER ON TECHNOLOGY TRANSFER (T2 RERC)
TRAINING MODULES ONTECHNOLOGY TRANSFER
MODULE 8:PROJECT TRACKING AND
EVALUATION

Objective of the Module:
Participants will:
• explain basic concepts and terms used in program evaluation/research;
• define indicators of effectiveness and efficiency for a project of their interest
• suggest methods to track the indicators;
• identify how the results would be used for project monitoring and evaluation

BASIC CONCEPTSAND TERMS
• Research and Evaluation• Merit and Worth• Management Orientation: Evaluation for
Development • Effectiveness and Efficiency• Formative and Summative Evaluation• Outcome and Impact

RESEARCH EVALUATIONEnd Generate knowledge that is
generalizable (crosses overtime and space); discoveruniversal truths
Generate knowledge(discover “truth” ) aboutspecific contexts; Judge Meritand Worth – of persons,products, organizations,programs…
Use Advance theory andpractice; althoughapplication may not beimmediate either in practiceor in further investigations.
Accountability; Improvementof program processes andproducts; Enlightendecisions/ actions.
Process Systematic Inquiry thatvalues both internal andexternal validity(generalizability) of results
Systematic Inquiry thatvalues “internal validity”over “external validity” ofresults
Tools Quantitative andQuantitative Measurement;Statistical and Quantitativemethods of analysis
Appropriate Research design,along with the correspondingtools.

Merit and Worth
Merit refers to • intrinsic quality of person/
product/ system • its potential, or promise to
be “valued” in its broader context.
Ex: Program inputs (resources, design, theory); processes (operations) and outcomes indicate its merit
Worth refers to• extrinsic value of
person/ product/ system • its actual “value” in the
broader contextEx: program effects/
impacts on internal and external environments indicate its worth.

Methodological Framework for Program Evaluation
EVALUATION[of Models and of Program]
Purpose: To Judge
Merit [intrinsic value](focus: processes and outcomes)
Worth [extrinsic value](focus: impacts on stakehoders)
RESEARCH METHODSgenerate knowledge
DESIGN Procedures Data Findings

Fig 2. Evaluation and the Planning Cycle
↓
←
← ← ← ← ← ←
Context Evaluation
← ← ← ← ←
←
Evaluation Cycle
↓ ↓ ↓
Planning Cycle
↑ ↑ ↑
↓ ↓ ↓ ↓
← ←
↓ ↓
What needs to be done? [Defining objective]
← ←
↑ ↑
↑ ↑ ↑ ↑
Product
Evaluation
Are we there yet? Recycle output or disseminate?
How to do it? [Defining resources]
Input
Evaluation ↓ ↓ ↓ ↓ ↓ ↓ ↓
↓ ↓
→ →
What is the optimal path to get to goal? [process improvement]
↑ ↑
→ →
↑ ↑ ↑ ↑ ↑ ↑ ↑
↓ ↓
↑ ↑ ↑ ↑
→ → → → → → → Process Evaluation
→ → → → → → → →

INPUT ---- PROCESS ---- OUTPUT↑ ↓
← ← ← ← ← ← ← FEEDBACK
Effective: gets outcome at the desiredquality/quantity level
Efficient: Maximizes effectiveness, minimizes cost
Efficiency =Output/ Input

Formative vs.Summative EvaluationFORMATIVE
• Assesses quality of outcome during the process, while outcome is taking shape
• Provides basis for improving/maintaining program actions
SUMMATIVE• Assesses quality of
outcome at the end of process when outcome is in final stage
• Provides basis for establishing program effectiveness & efficiency; [accountability]

Outcomes and Impacts
Outcomes • direct outputs or
immediate effects• assess program’s
performance- its effectiveness and efficiency; an indicator of merit
Impacts• long term effects;
benefits to staff, participants, other stakeholders and community at large
• assess program’s validity/relevance; indicator of worth

Framing program evaluation: three basic questions
• Is the program effective? - has it achieved its goals?
• Is it efficient? - did it optimize its methods, resources to achieve the goals?
• Is it valid? - are its goals relevant to the context? Is it valued by its stakeholders and
beneficiaries?

In Response: what to assess
• Effective? --- Outcome quality; outcome quantity (for duration of program)
• Efficient? -- Cost per outcome; Time per outcome
• Valid? Worth it? -- internal and external impacts; long term effects on/ benefits to stakeholders and others involved
NOTE: outcome,cost/time [merit indicators] - assessed through tracking program performance. Impact [worth indicator]: - assessed through tracking effects beyond
program period
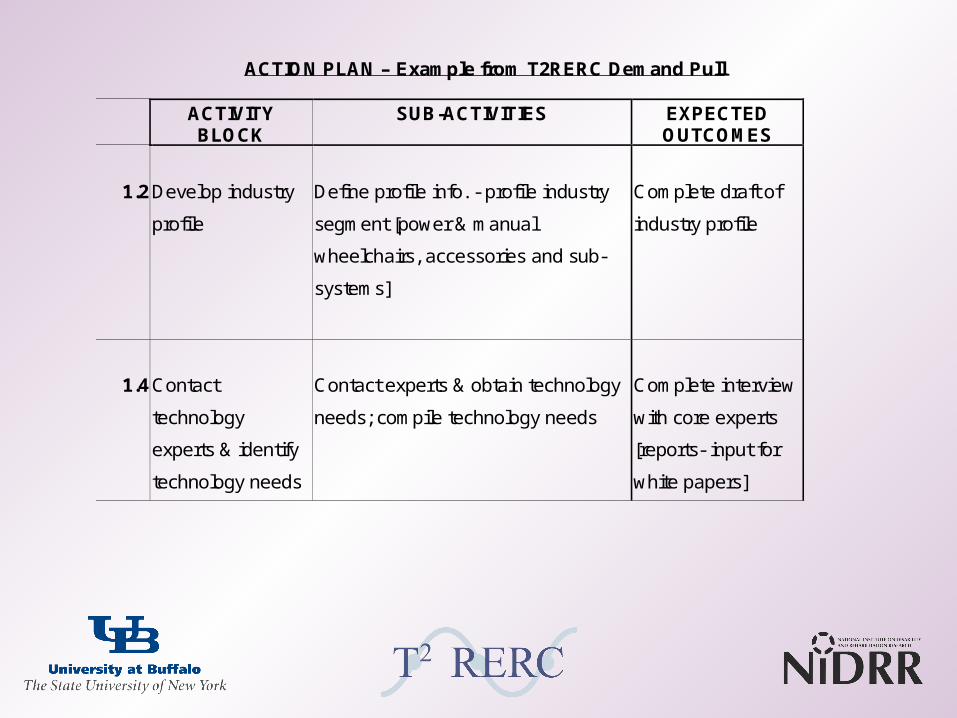
ACTION PLAN – Example from T2RERC Demand Pull
ACTIVITY BLOCK
SUB-ACTIVITIES EXPECTED OUTCOMES
1.2
Develop industry
profile
Define profile info. - profile industry
segment [power & manual
wheelchairs, accessories and sub-
systems]
Complete draft of
industry profile
1.4
Contact
technology
experts & identify
technology needs
Contact experts & obtain technology
needs; compile technology needs
Complete interview
with core experts
[reports- input for
white papers]

Name
AP1 -DP
AP2 - SP
AP3 - RES
AP4 - TA/T
AP5 -DIS
AP6 - PART
PROJ. SPT
Total Days
% FTEA 40 57 3 6 4 110 50%B 75 20 12 8 36 10 16 177 80%C 20 5 62 26 4 117 53%D 3 41 4 48 22%E 50 47 3 6 4 110 50%F 97 3 6 4 110 50%G 47 50 3 6 4 110 50%H 24 96 75 20 4 219 100%I 22 44 3 7 40 4 120 55%J 70 3 7 21 5 4 110 50%K 11 9 13 37 44 22 44 180 82%L 5 88 12 39 60 16 220 100%M 82 18 6 66 11 37 220 100%N 5 70 3 20 4 102 46%O 11 11 22 44 20%P 40 40 18%Q 8 12 3 22 45 20%R 5 5 105 23 44 16 198 90%S 31 28 13 6 35 16 129 59%Total Days 592 474 334 228 398 48 225 2299% of Total 26% 21% 15% 10% 17% 2% 10% 100%
1999-2000 T2RERC Personnel Loading Chart

Name: VS Wk ending: may 14
Activity #mon tues wed thurs fri sat sun Total8-May 9-May 10-May 11-May
0.00 project sup 6.5 4 2 0.5 131.9 Prepare for stakeholder forum 0.5 0.5 0.5 1 2.5
2.15 Preparing survey 02.16 Survey analysis 03.2 Update tracking database[data entry] 03.3 Consolidate[aggregate] tracking data 03.4 Retrieve/organize data for critical factors study 03.5 Analyze data and identify critical factors 03.6 Report/ disseminate/critical factors results 03.7 Perform effectiveness/outcome analyses for SP
model 03.8 Perform effectiveness/outcome analyses for DP
model 03.14 Report model evaluation 03.23 Project Performance Review 03.24 Evaluate signif icant project events 03.25 Update and expand consumer database 04.7 Training and professional development 1 5 6.5 5.5 185.2 Write articles for peer-review ed journals 05.5 Publish project new sletters and annual report 05.9 RERC paper/product presentations 0
5.10 Develop Ed Prog for presentation at RESNA 0Weekly Total for project 8 9.5 9 7 0 0 0 33.5
Hours spent
Time sheet for:

TIME AND PERSONNEL INFO - Hours spent by:ACTIVITY
BLOCKWk Ending
A B C D E F G H I J K L M N O P Q Total Hrs Total Hrs
33 Product Team Mting 20-Dec 0.00
27-Dec 0.002-Jan 0.009-Jan 0.00
16-Jan 1.50 2.00 2 1.75 7.2523-Jan 1.5 1.5030-Jan 1.25 1.00 1.5 2.5 1.5 7.756-Feb 3.50 3.50
13-Feb 1.00 1.5 2.5020-Feb 0.0027-Feb 1 1 2.005-Mar 1 1.00
12-Mar 1 0.75 10 1 12.7519-Mar 2.00 1 1 1 1 6.0026-Mar 0.00
2-Apr 1.00 3 14 1.5 19.50total 0.00 8.25 5.00 0.00 2.00 5.00 4.25 0.00 7.00 0.00 0.00 24.00 0.00 0.00 0.00 8.25 0.00 63.75 63.75
TOTAL 0.00 10.00 5.00 0.00 2.00 5.00 4.25 156.00 16.50 0.00 10.00 122.50 0.00 38.00 0.00 9.25 102.25 480.75 480.75
T2RERC - PERSONNEL TIME DATABASE -[S-PUSH]

Activity
Q1 Q2 Q3 Q4 Yr1-Q41.1 34 30.5 0 0 21.51.2 73.25 45.5 4.5 0 117.51.3 72 21 3.5 0 131.4 44.5 22.5 1.5 0 41.5 15.5 37.75 0 0 111.6 32.5 32.5 10.25 0 31.7 26 125 29 4 01.8 86.5 24.5 446.25 0 01.9 144.3 278 704.25 0 0
1.10 0 1 554.40 7 01.11 0 0 215.00 72 01.12 0 0 0.00 6.5 01.1 3.5 3 0 0 01.1 0 4 1.25 2 01.2 0 0 10 4 11.2 0 0 0 0 01.2 0 0 0 0 11.2 49 134.5 158 37 501.2 10 1 2 2 0
total 591.00 760.75 2139.90 134.50 total 222.00 0.00 0.00 0.00 Yr 1 total3848.15
15.4% 19.8% 55.6% 3.5% 100.0%
Person-hours spent on Demand Pull - Year One
5.8%
Demand-Pull- Wheeled Mobility
Total Hrs. Total Hrs.
3626.15 222.00
Demand-Pull- Hearing
Yr2

Planned
Q1 Q2 Q3 Q4 Total spent % Person -hrs: %
Project Support 985.5 756.8 673.3 1005.0 3420.6 19.7% 1760.0 10.0%
Demand-Pull [WhMob] 591.0 760.8 2139.9 134.5
Demand-Pull [Hearing] 222.0
Supply-Push 855.5 1810.5 1281.0 951.2 4898.1 28.2% 6408.0 36.4%
Eval/Res 519.3 429.5 514.8 530.3 1993.8 11.5% 2596.0 14.8%
Tech assistance 57.0 72.6 66.3 194.0 389.8 2.2% 832.0 4.7%
Dissemination 197.5 337.3 641.7 909.7 2086.1 12.0% 2976.0 16.9%
Strategic Partnerships 98.8 140.3 188.0 279.5 706.5 4.1% 1096.0 6.2%
Total 17343.0 100.0% 17588.0 100.0%
Table 1: Overview of Time Spent on T2RERC Activities in Yr 1:
10.9%
Person-hours spent
3848.2 22.2% 1920.0

Pro
ject S
upport
Dem
and-P
ull
[WhM
ob]
Dem
and-P
ull
[Hearing]
Supply
-Push
Eva
l/Res
Tech a
ssis
tance
Dis
sem
inatio
n
Str
ate
gic
Part
ners
hip
s Actual
Budgeted
0%
5%
10%
15%
20%
25%
30%
35%
40%
Person Hour %
Action Plans
T2RERC Personnel Time for Yr 1: Actual vs. Planned
Actual Budgeted

0%
5%
10%
15%
20%
25%
30%
35%
40%
45%
Person-hour %
Pro
ject S
upport
Dem
and-P
ull
[WhM
ob]
Dem
and-P
ull
[Hearing]
Supply
-Push
Eva
l/Res
Tech a
ssis
tance
Dis
sem
inatio
n
Str
ate
gic
Part
ners
hip
s
Action Plans
T2RERC Personnel Time Overview for Yr1-comparison between quarters
y1q1
y1q2
y1q3
y1q4

Personnel Time spent in Year 2 on the T2RERC Projects
AcPlan--> TOTAL
Person days days days days days days days days daysCum. days Obs Estim.
A 1.9 16.4 16.4 0.6 51.4 0.1 40.9 2.9 1.8 132.3 60% 50%
B 32.5 24.1 89.0 8.8 20.7 16.3 11.4 36.1 15.4 254.2 116% 100%
C 5.4 0.0 16.2 0.2 6.3 80.0 9.7 0.0 0.0 117.8 54% 53%
D 1.2 2.1 10.6 0.0 2.4 4.6 0.0 114.3 0.0 135.2 61% 22%
E 14.6 2.3 5.3 0.0 21.1 0.1 16.8 1.6 0.4 62.1 28% 50%
F 7.1 18.3 42.5 5.4 38.2 0.4 26.8 0.3 0.0 138.9 63% 50%
G 1.8 2.7 54.5 0.0 17.9 0.4 2.8 16.3 0.5 96.9 44% 50%
H 20.9 0.0 0.4 0.0 77.4 27.4 79.3 21.3 0.0 226.6 103% 100%
I 16.8 0.3 25.7 3.8 49.6 2.5 3.0 20.1 3.8 125.6 57% 55%
J 5.6 51.3 49.9 1.9 0.2 1.0 6.3 35.6 1.4 153.1 70% 50%
K 32.4 1.4 10.8 0.5 5.8 16.3 22.6 50.1 33.3 173.1 79% 82%
L 41.2 2.0 0.1 0.0 113.4 10.8 24.8 20.2 1.8 214.3 97% 100%
M 79.1 0.5 72.3 12.9 0.0 8.4 2.3 28.3 1.0 204.8 93% 100%
new 43 0.0 0.0 9.1 2.9 0.1 0.1 0.0 0.1 15.0 7% 10%
Q 40.1 1.3 17.1 0.0 0.0 2.3 8.8 4.7 0.0 74.2 34% 20%
R 45.8 0.0 10.5 0.5 2.6 69.6 28.3 27.1 0.0 184.4 84% 90%
S 10.3 0.5 39.4 10.7 16.7 1.3 0.8 40.1 0.0 119.8 54% 59%
N 14.0 1.6 18.0 0.0 46.7 1.0 1.2 16.7 0.0 99.2 45% 46%
Tot P-days373.2 124.5 478.6 54.5 473.2 242.6 285.9 435.7 59.3
STPTAT DISSP EV-RS % FTEPSP DP-Mb DP-Hg
DP-AugCom

Use of Information
• Monitoring project Performance
– Improve intermediary outcomes [quality vs. timelines]
– Improve process • re-distribute personnel
• review protocols/timelines
• Describing performance level -[effectiveness and efficiency]

Related Issues
Questions, Comments, Suggestions

Workshop Session Two
For your project, identify, or discuss applicability of:
• Goals, Protocols, Action Plan (or similar framework)
• Expected Outcomes - final [and intermediary, if applicable]
• Outcome Tracking: (a) process and (b) use- improving outcomes (formative eval.) and finding effectiveness (summative eval.)
• Tracking resource utilization (time/cost …): (a) process and (b) use for process improvement and finding efficiency (summative eval.)
• Instrument and database alternatives