A Presentation on the Regulatory Regime for Renewable Energy Projects in Andhra Pradesh
Regulatory framework and Design
of renewable Energy Tariff
Rakesh Shah
Advisor (renewable)
Central Electricity Regulatory Commission
In this presentation........
• Legal framework for promotion of RE
• RE Tariff design
• RE Tariff Regulations
2

Legal and Policy Framework for
promotion of RE
Legal Framework
Federal Structure
Electricity is a concurrent subject.
Two principal Central legislations:
Electricity Act, 2003
Basic policy and regulatory framework
Energy Conservation Act, 2001
Basic legal framework on Energy Efficiency and DSM
Regulatory Framework
Central level
Central Electricity Regulatory Commission (CERC) (inter-State issues)
Province level
State Electricity Regulatory Commission (SERCs) (intra-State issues)
Forum of Regulators - for harmonization
6/22/2010 4

The Electricity Act, 2003 :
Enabling provisions
Section 86(1)(e): Specify Renewable Purchase Obligation
(RPO) from renewable energy sources
Section 61(h): Tariff regulations to be guided by promotion of
renewable energy sources
Section 3: National Electricity Policy, Tariff Policy and Plan
Section 4: National Policy permitting stand alone systems
including renewable sources of energy for rural areas
5
The Electricity Act, 2003:
Section 86(1) (e)
The State Commission shall discharge the following functions,
namely:
“promote cogeneration and generation of electricity from renewable
sources of energy by providing suitable measures for
connectivity with the grid and sale of electricity to any person,
and also specify, for purchase of electricity from such sources, a
percentage of the total consumption of electricity in the area of a
distribution licensee;”
6
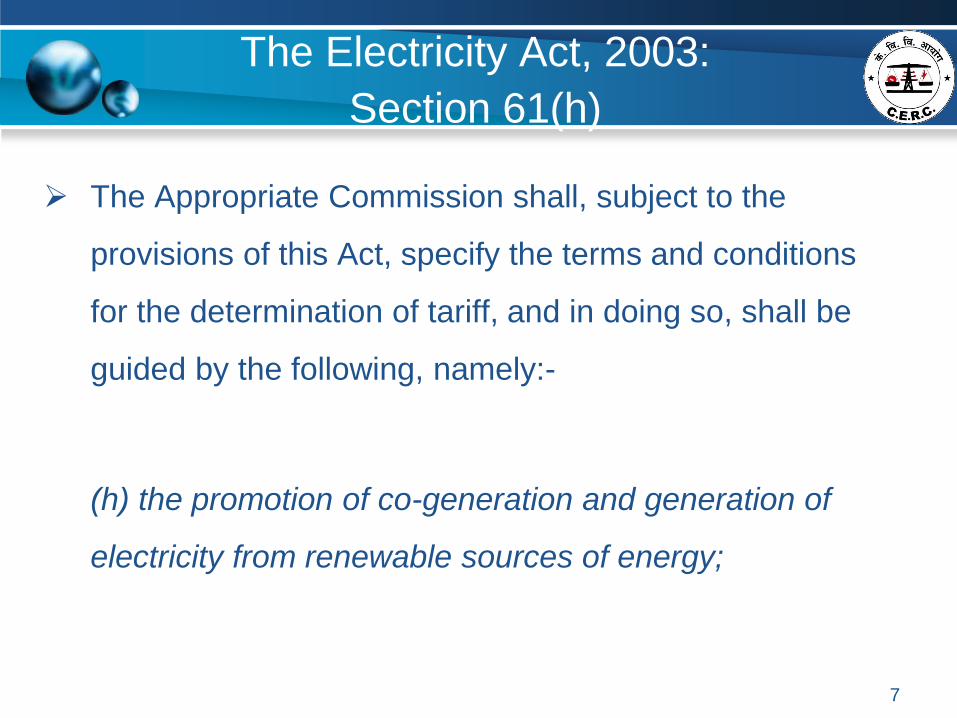
The Electricity Act, 2003:
Section 61(h)
The Appropriate Commission shall, subject to the
provisions of this Act, specify the terms and conditions
for the determination of tariff, and in doing so, shall be
guided by the following, namely:-
(h) the promotion of co-generation and generation of
electricity from renewable sources of energy;
7
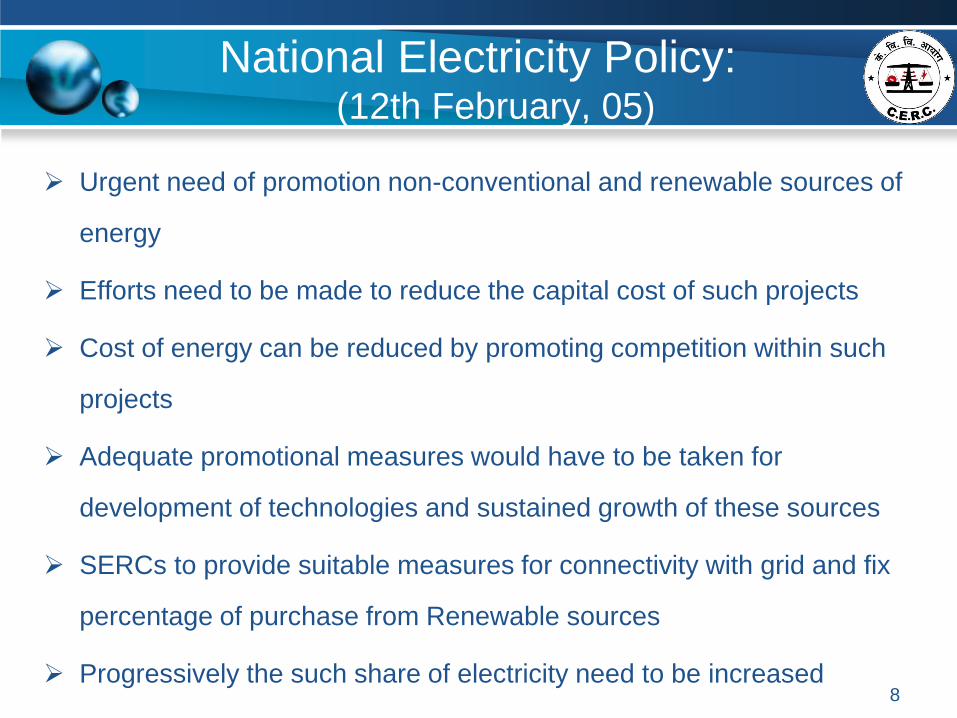
National Electricity Policy: (12th February, 05)
Urgent need of promotion non-conventional and renewable sources of
energy
Efforts need to be made to reduce the capital cost of such projects
Cost of energy can be reduced by promoting competition within such
projects
Adequate promotional measures would have to be taken for
development of technologies and sustained growth of these sources
SERCs to provide suitable measures for connectivity with grid and fix
percentage of purchase from Renewable sources
Progressively the such share of electricity need to be increased 8
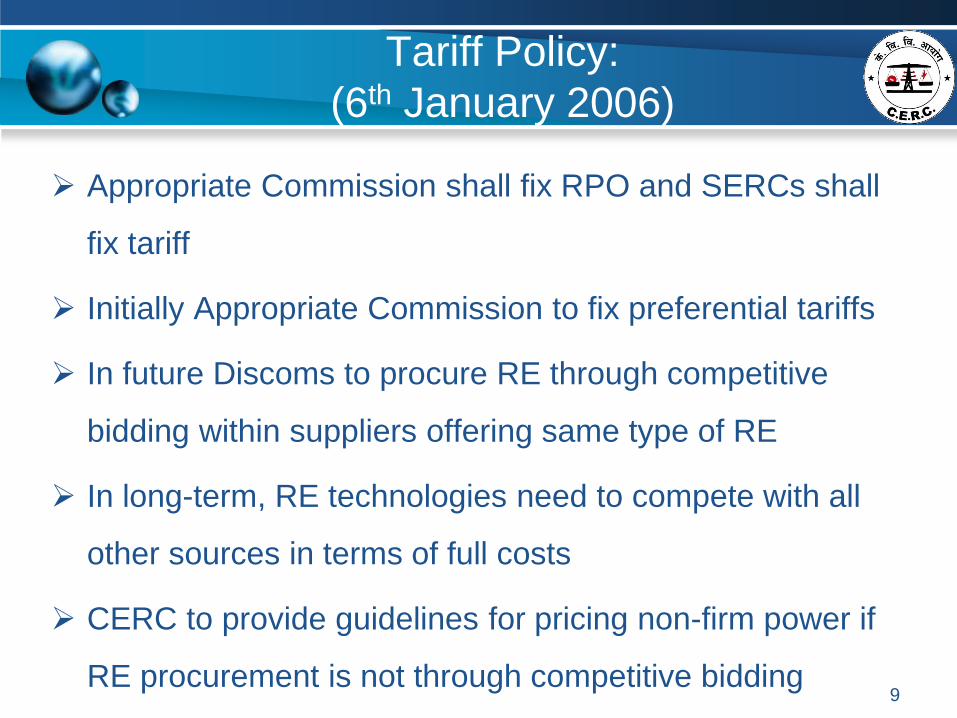
Tariff Policy:
(6th January 2006)
Appropriate Commission shall fix RPO and SERCs shall
fix tariff
Initially Appropriate Commission to fix preferential tariffs
In future Discoms to procure RE through competitive
bidding within suppliers offering same type of RE
In long-term, RE technologies need to compete with all
other sources in terms of full costs
CERC to provide guidelines for pricing non-firm power if
RE procurement is not through competitive bidding 9
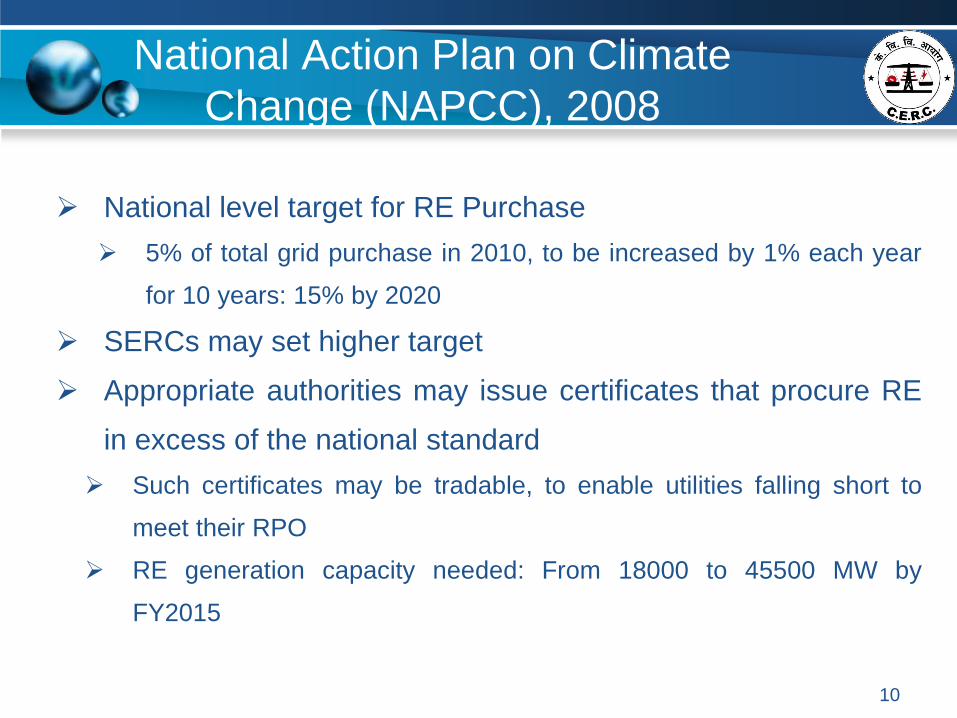
National Action Plan on Climate
Change (NAPCC), 2008
National level target for RE Purchase
5% of total grid purchase in 2010, to be increased by 1% each year
for 10 years: 15% by 2020
SERCs may set higher target
Appropriate authorities may issue certificates that procure RE
in excess of the national standard
Such certificates may be tradable, to enable utilities falling short to
meet their RPO
RE generation capacity needed: From 18000 to 45500 MW by
FY2015
10
Jawaharlal Nehru National Solar Mission
(JNNSM) 2010
One of the eight Missions under NAPCC, launched by the
Government of India in January 2010.
The objective of the JNNSM is to establish India as a global
leader in solar energy.
Mission aims to achieve grid tariff parity by 2022 through
Large scale utilization, rapid diffusion and deployment at a scale
which leads to cost reduction
R&D, Pilot Projects and Technology Demonstration
Local manufacturing and support infrastructure
0.25% SPO by 2012-13 and 3% SPO by 2022
11
Tariff Policy Amendment : 2011
Para 6.4 (1) of the Tariff Policy amended on dated 20/1/2011
SERC shall fix a minimum percentage of the total consumption
of electricity in the area of a distribution licensee
Such purchase should takes place more or less in the same
proportion in different States
SERCs shall also reserve a minimum percentage for purchase
of solar energy
Up to 0.25% by the end of 2012-2013
Further up to 3% by 2022
Renewable Energy Certificate (REC) would need to be evolved
with separate solar specific REC
12

Regulatory Intervention
Renewable Purchase Obligation (RPO)
Preferential Tariff
Facilitative Framework for Grid Connectivity
Market Development
(Tradable Renewable Energy Certificates)
13
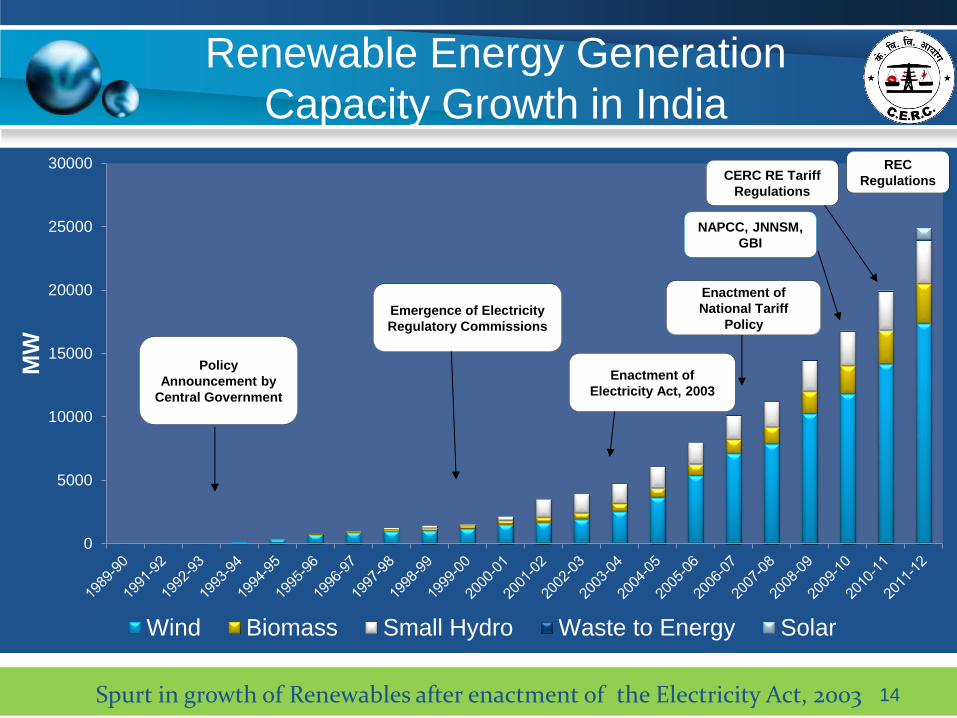
Renewable Energy Generation
Capacity Growth in India
Spurt in growth of Renewables after enactment of the Electricity Act, 2003
0
5000
10000
15000
20000
25000
30000
MW
Wind Biomass Small Hydro Waste to Energy Solar
Policy
Announcement by
Central Government
Enactment of
Electricity Act, 2003
NAPCC, JNNSM,
GBI
Emergence of Electricity
Regulatory Commissions
Enactment of
National Tariff
Policy
CERC RE Tariff
Regulations
REC
Regulations
14

Renewable Energy Tariff Design
Renewable Energy (RE) policies
Grants and Rebates
Tax Credits
Competitive Tenders and Auctions
Tradable Renewable Energy Certificates
Renewable Portfolio Standards and Quota systems
Net Metering
Feed-In Tariff (FIT)
Competing or combining policies
FITs are the most widely used policy mechanism globally 16
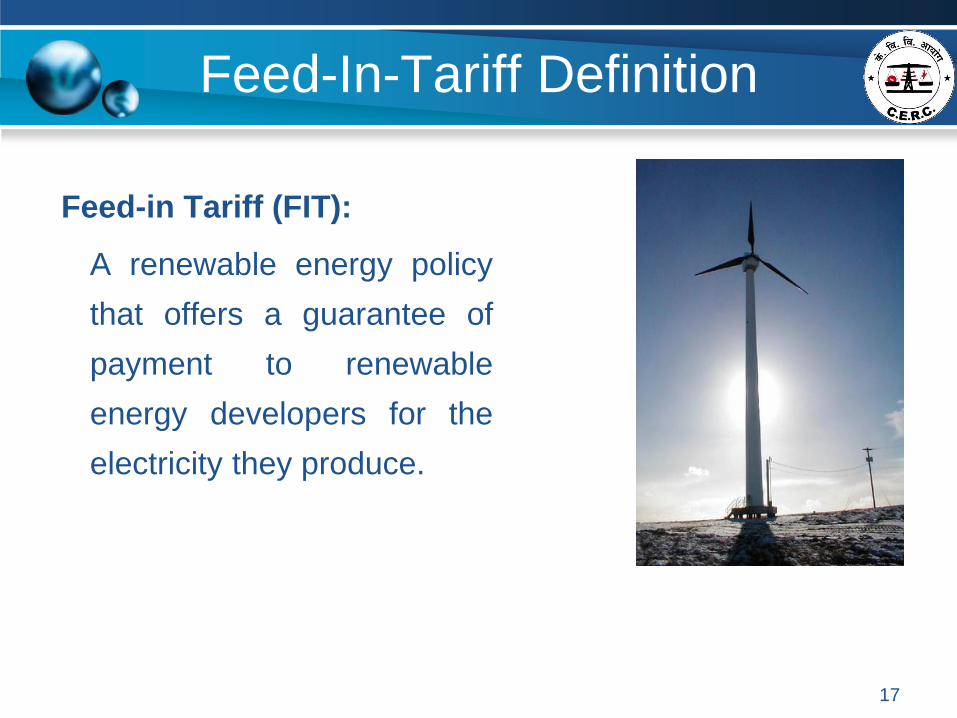
Feed-In-Tariff Definition
Feed-in Tariff (FIT):
A renewable energy policy
that offers a guarantee of
payment to renewable
energy developers for the
electricity they produce.
17
Feed-in tariffs go by many names
Advanced Renewable Tariffs
A system of feed-in tariffs (prices or payments) for different
technologies
Renewable Energy Payments
Because the “tariffs” are a payment per kilowatt-hour of electricity
generated
Standard Offer Contracts
Feed-in tariffs use “standard contracts” and “standard offers”
“offers” may differ by technology (one price for solar, another for wind)
Also called fixed-price policies, minimum price policies, feed
laws, feed-in laws, renewable and energy dividends
18
Access to the grid: Interconnection
Must be able to connect
Guarantee and priority
Connection must be simple, timely, and at
reasonable cost
19
Priority Purchase
Renewable energy must be first priority
Must run status
Take or pay contracts
Producer must be assured that the electricity they
produce is purchased
Only exception is “system emergencies”
20
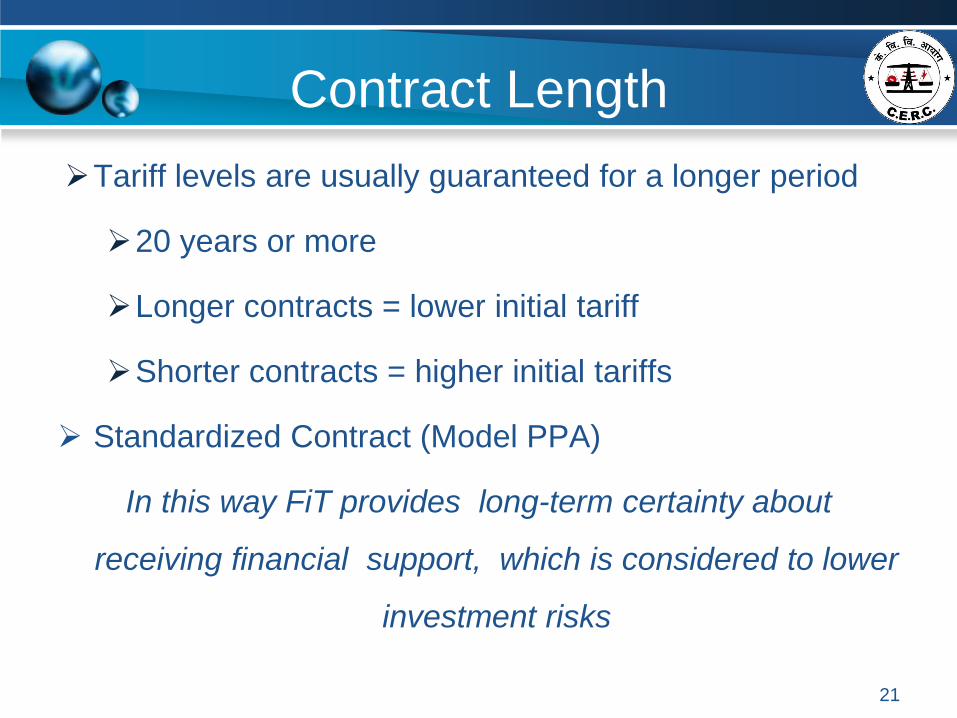
Contract Length
Tariff levels are usually guaranteed for a longer period
20 years or more
Longer contracts = lower initial tariff
Shorter contracts = higher initial tariffs
Standardized Contract (Model PPA)
In this way FiT provides long-term certainty about
receiving financial support, which is considered to lower
investment risks
21

Specific tariff design
Differentiated by technology
wind, solar, biomass, hydro, etc.
Differentiated by project size
higher prices for small projects
lower prices for large projects
Differentiated by resources qualities
Differentiated by application
higher prices for rooftop solar , BIPV
Differentiated by project location
22
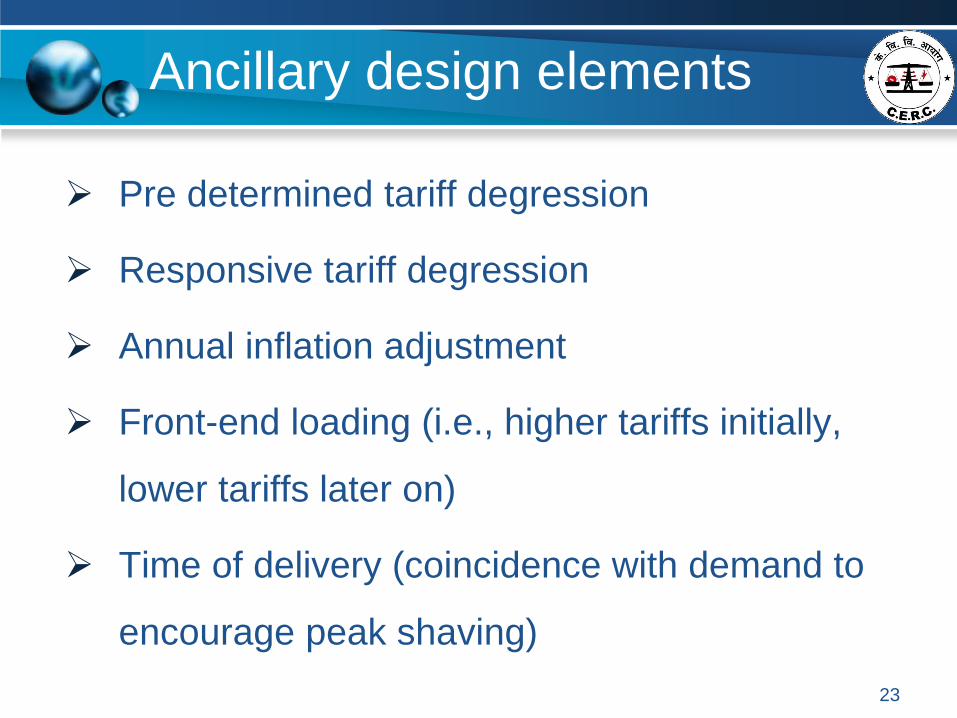
Ancillary design elements
Pre determined tariff degression
Responsive tariff degression
Annual inflation adjustment
Front-end loading (i.e., higher tariffs initially,
lower tariffs later on)
Time of delivery (coincidence with demand to
encourage peak shaving)
23
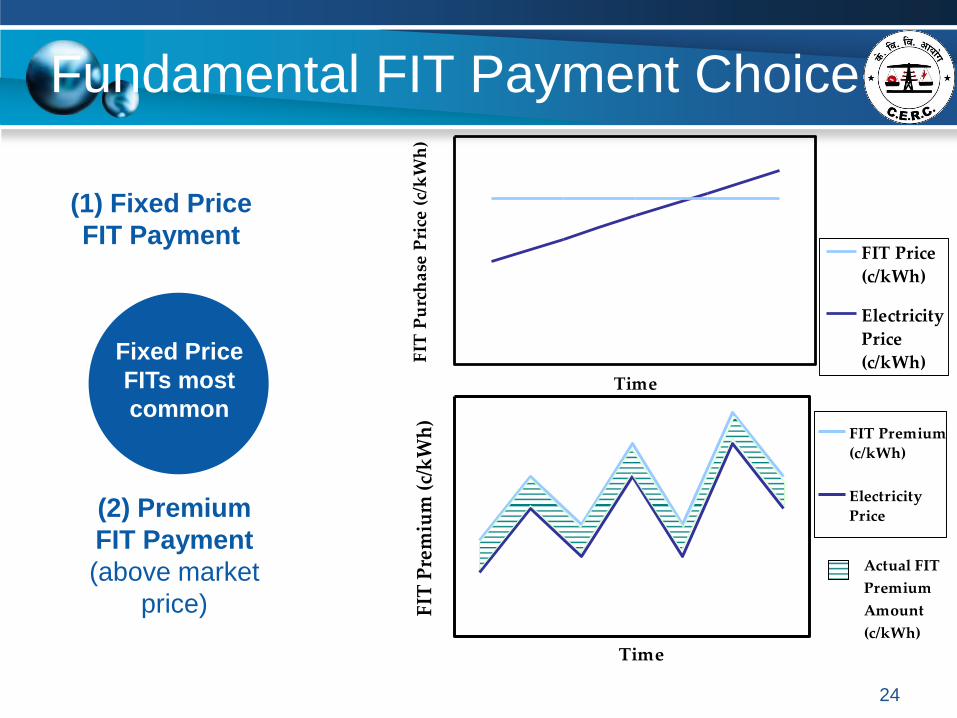
Fundamental FIT Payment Choice
Time
FIT
Pu
rch
ase
Pri
ce (
c/k
Wh
)
FIT Price
(c/kWh)
Electricity
Price
(c/kWh)
Time
FIT
Pre
miu
m (
c/k
Wh
)FIT Premium
(c/kWh)
Electricity
Price
Actual FIT
Premium
Amount
(c/kWh)
(2) Premium
FIT Payment
(above market
price)
(1) Fixed Price
FIT Payment
Fixed Price
FITs most
common
24
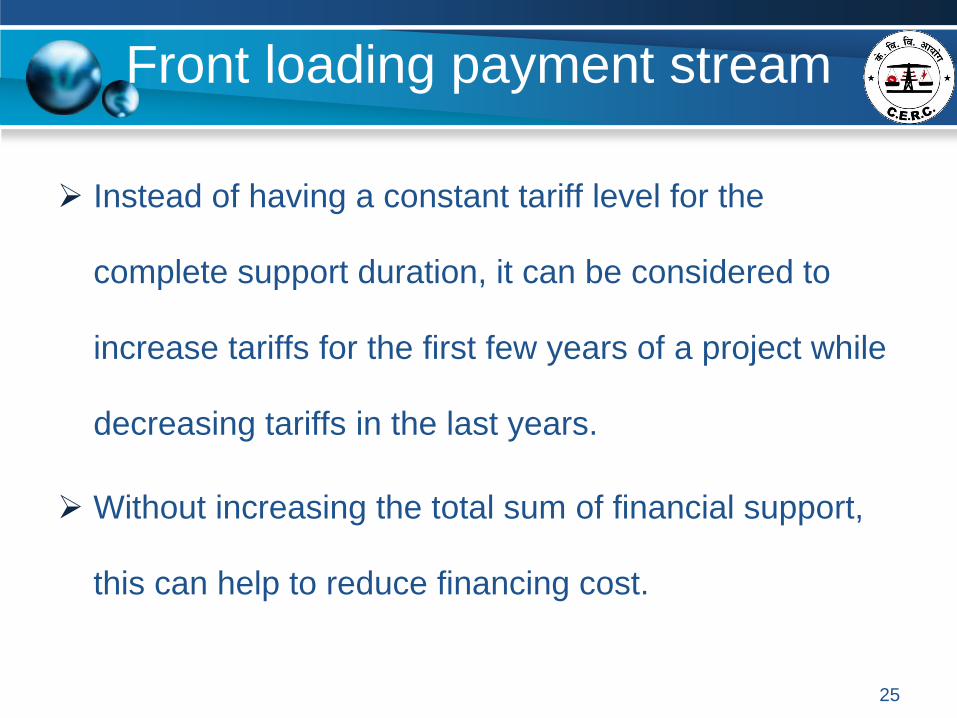
Front loading payment stream
Instead of having a constant tariff level for the
complete support duration, it can be considered to
increase tariffs for the first few years of a project while
decreasing tariffs in the last years.
Without increasing the total sum of financial support,
this can help to reduce financing cost.
25
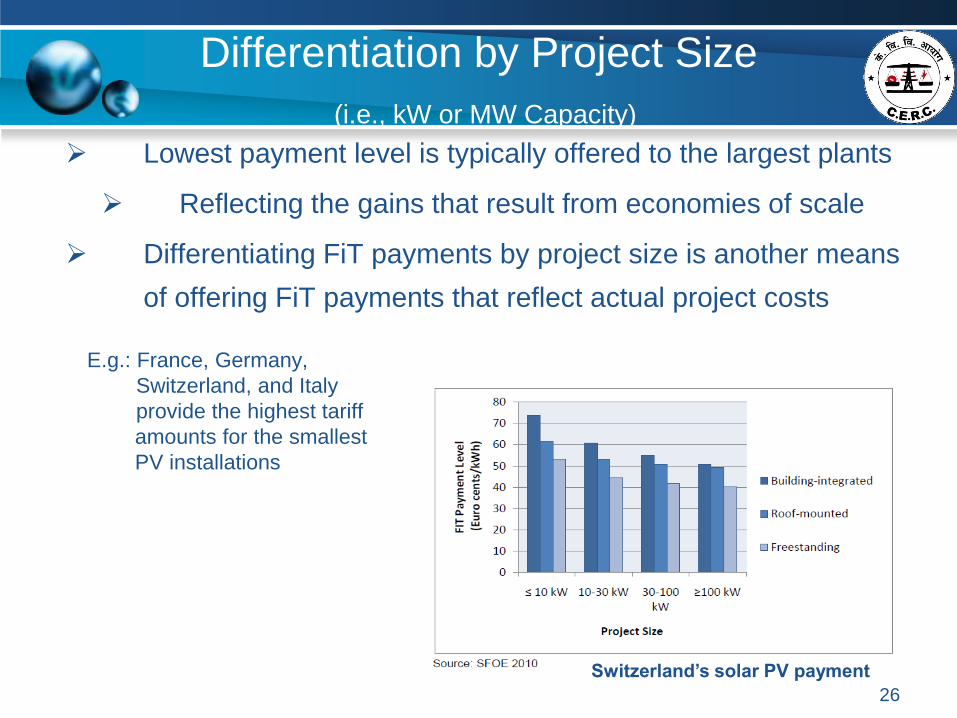
Differentiation by Project Size
(i.e., kW or MW Capacity)
Lowest payment level is typically offered to the largest plants
Reflecting the gains that result from economies of scale
Differentiating FiT payments by project size is another means
of offering FiT payments that reflect actual project costs
E.g.: France, Germany,
Switzerland, and Italy
provide the highest tariff
amounts for the smallest
PV installations
Switzerland’s solar PV payment
26

Differentiation by Resource Quality
Different payments to projects in
areas with a different cost of
production
to encourage development in a wider
variety of areas, which can bring a
number of benefits both to the grid and to
society
to match the payment levels as closely as
possible to RE generation costs
For e.g. areas with a high-quality wind
resource will produce more electricity
from the same capital investment, all else
being equal, leading to a lower levelized
cost (FIT)
Denmark, France, Germany, Portugal, and
Switzerland have implemented resource
adjusted payment levels
On Shore wind farm FIT
Payment Level
(10 to 15 Years)
Source: France 2006, NREL
2010
27
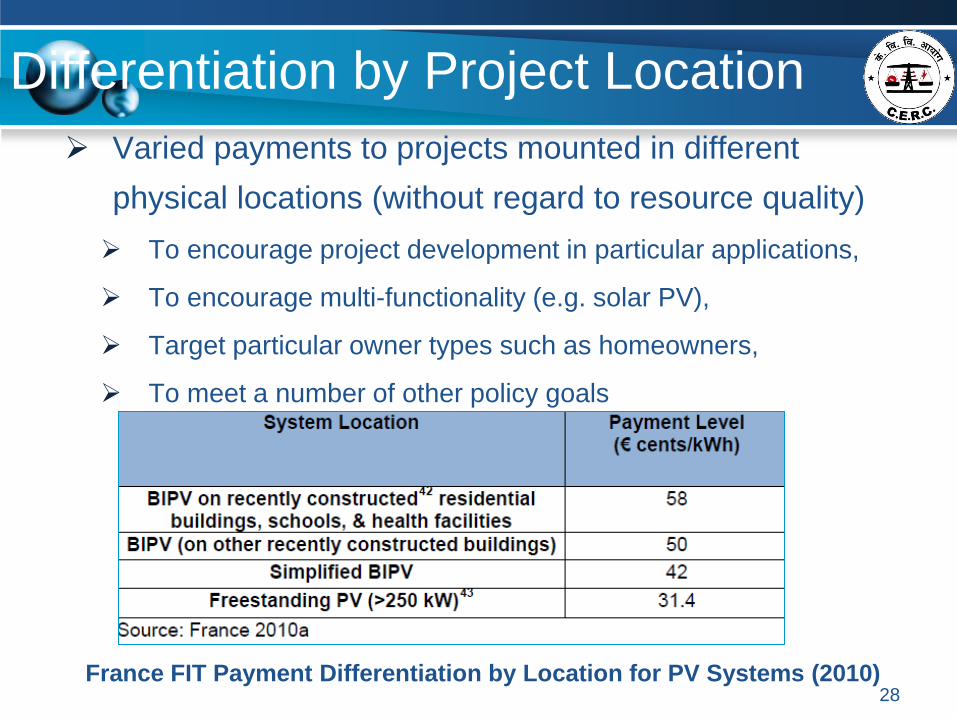
Differentiation by Project Location
Varied payments to projects mounted in different
physical locations (without regard to resource quality)
To encourage project development in particular applications,
To encourage multi-functionality (e.g. solar PV),
Target particular owner types such as homeowners,
To meet a number of other policy goals
France FIT Payment Differentiation by Location for PV Systems (2010) 28
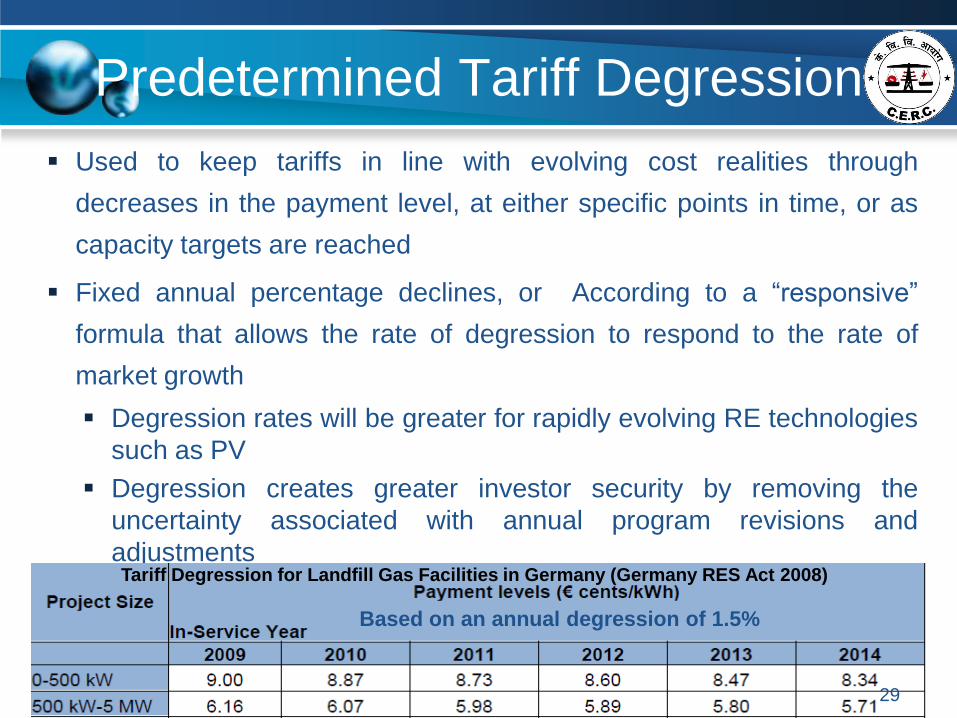
Predetermined Tariff Degression
Used to keep tariffs in line with evolving cost realities through
decreases in the payment level, at either specific points in time, or as
capacity targets are reached
Fixed annual percentage declines, or According to a “responsive”
formula that allows the rate of degression to respond to the rate of
market growth
Degression rates will be greater for rapidly evolving RE technologies
such as PV
Degression creates greater investor security by removing the
uncertainty associated with annual program revisions and
adjustments
Tariff Degression for Landfill Gas Facilities in Germany (Germany RES Act 2008)
Based on an annual degression of 1.5%
29
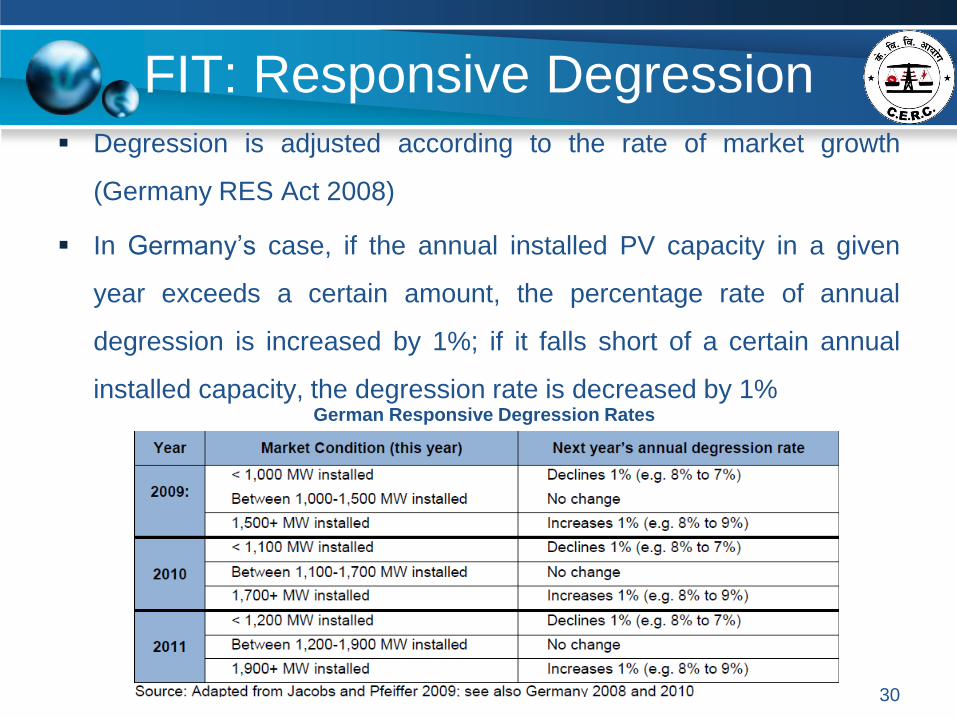
FIT: Responsive Degression Degression is adjusted according to the rate of market growth
(Germany RES Act 2008)
In Germany’s case, if the annual installed PV capacity in a given
year exceeds a certain amount, the percentage rate of annual
degression is increased by 1%; if it falls short of a certain annual
installed capacity, the degression rate is decreased by 1% German Responsive Degression Rates
30
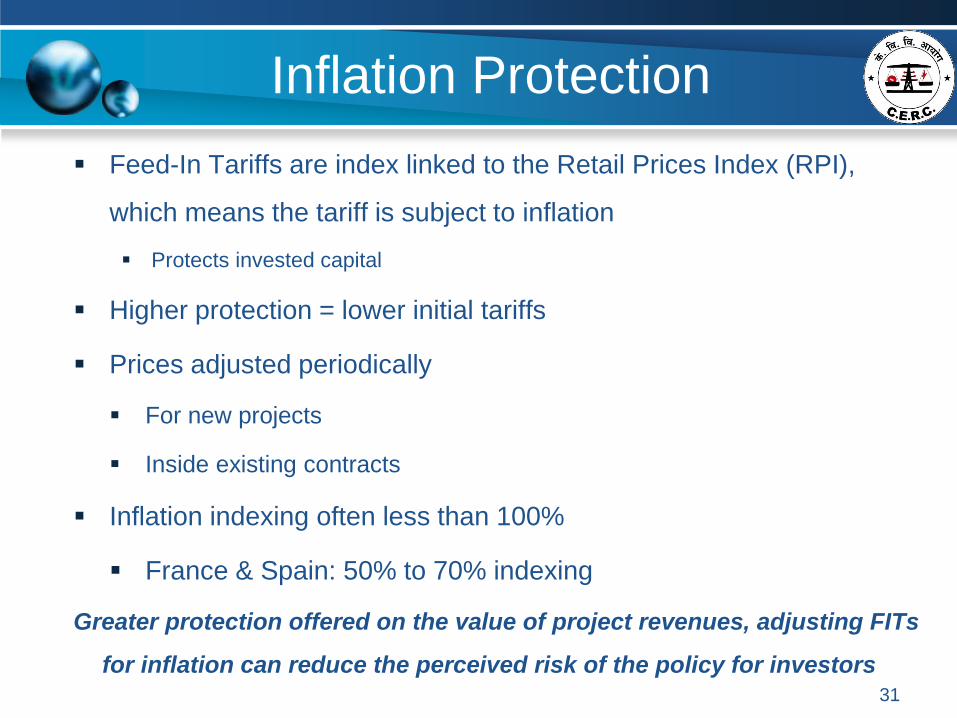
Inflation Protection
Feed-In Tariffs are index linked to the Retail Prices Index (RPI),
which means the tariff is subject to inflation
Protects invested capital
Higher protection = lower initial tariffs
Prices adjusted periodically
For new projects
Inside existing contracts
Inflation indexing often less than 100%
France & Spain: 50% to 70% indexing
Greater protection offered on the value of project revenues, adjusting FITs
for inflation can reduce the perceived risk of the policy for investors
31
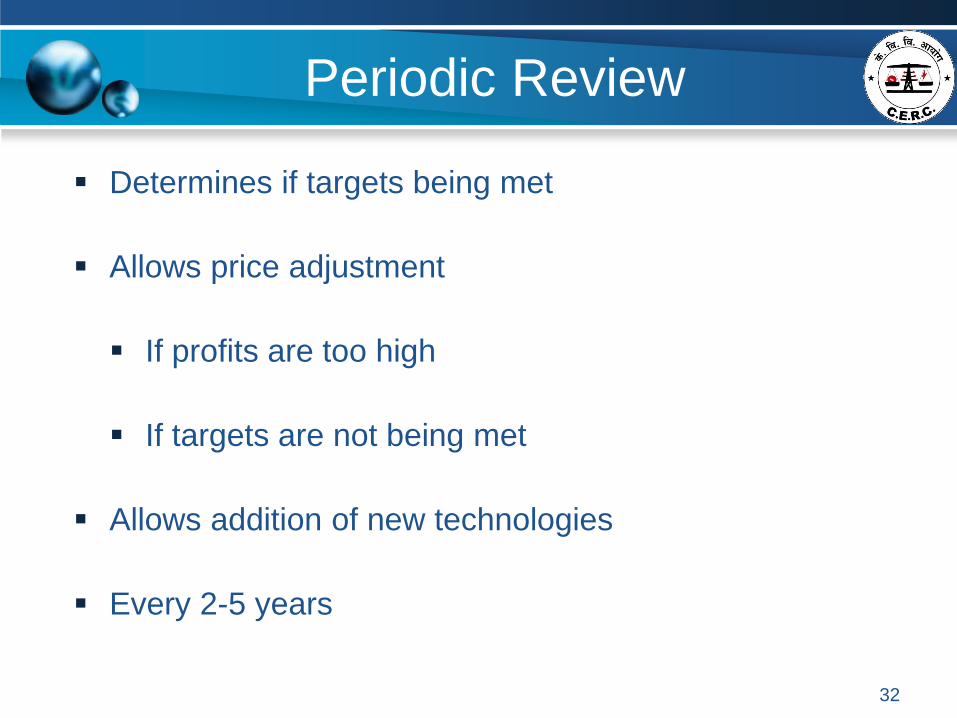
Periodic Review
Determines if targets being met
Allows price adjustment
If profits are too high
If targets are not being met
Allows addition of new technologies
Every 2-5 years
32
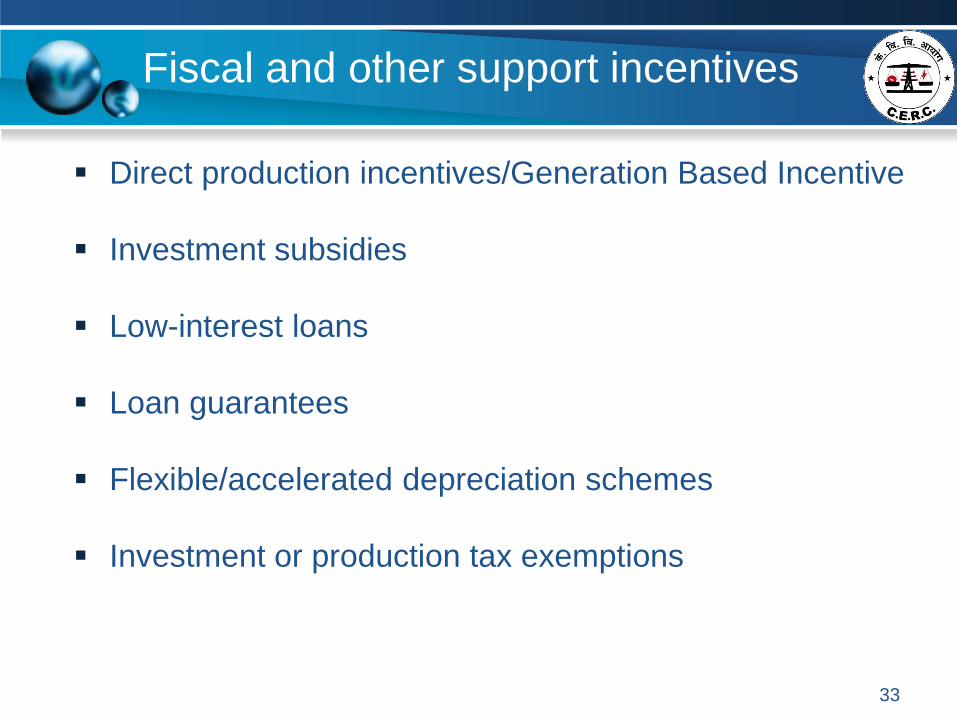
Fiscal and other support incentives
Direct production incentives/Generation Based Incentive
Investment subsidies
Low-interest loans
Loan guarantees
Flexible/accelerated depreciation schemes
Investment or production tax exemptions
33
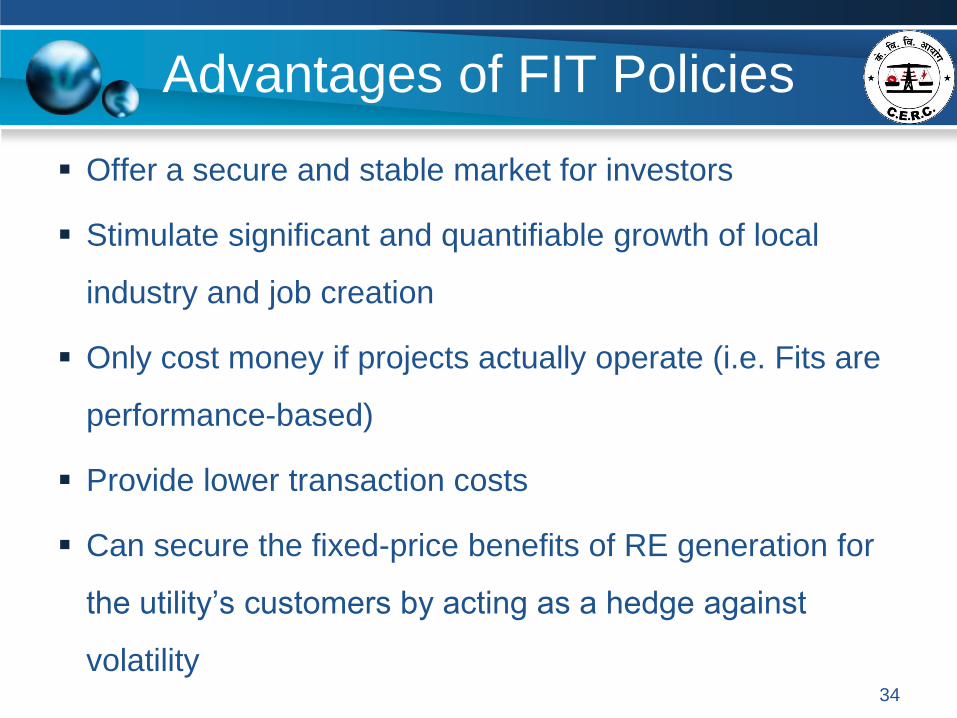
Advantages of FIT Policies
Offer a secure and stable market for investors
Stimulate significant and quantifiable growth of local
industry and job creation
Only cost money if projects actually operate (i.e. Fits are
performance-based)
Provide lower transaction costs
Can secure the fixed-price benefits of RE generation for
the utility’s customers by acting as a hedge against
volatility 34
Advantages of FIT Policies
Settle uncertainties related to grid access and
interconnection
Enhance market access for investors and participants
Predictable revenues : Enable traditional financing
Encourage technologies at different stages of maturity,
including emerging technologies
Customize the policy to support various market
conditions, including regulated and competitive markets
35
Other benefits are that FIT policies
Have a measurable impact on RE generation and capacity
Tailor the policies using a range of design elements that will
achieve a wide range of policy goals
Are compatible with RPS mandates
Can help utilities meet their RPS mandates
Can provide a purchase price to renewable energy generators
that is not linked to avoided costs
Demonstrate a flexible project-specific design that allows for
adjustments to ensure high levels of cost efficiency and
effectiveness
36
Disadvantages of FIT Policies
FITs can lead to near-term upward pressure on electricity
prices, particularly if they lead to rapid growth in
emerging (i.e., higher-cost) RE technologies
FITs may distort wholesale electricity market prices
FITs do not directly address the high up-front costs of RE
technologies – instead, they are generally designed to
offer stable revenue streams over a period of 15-25
years, which enables the high up-front costs to be
amortized over time
37
Disadvantages of FIT Policies
Due to the fact that RE investments are generally limited
to citizens with disposable (i.e., investable) income, as
well as with property on which to install RE systems,
FITs may exclude lower-income individuals from
participating Because these individuals are generally
required to share the cost burden via higher bills, this
can create or exacerbate social inequity
FITs do not encourage direct price competition between
project developers
38
Disadvantages of FIT Policies
It may be difficult to control overall policy costs under FIT policies,
because it is difficult to predict the rate of market uptake without
intermediate caps or capacity-based degression
It can be challenging to incorporate FITs within existing policy
frameworks and regulatory environments
FITs are not “market-oriented,” primarily because FITs often involve
must-take provisions for the electricity generated, and the payment
levels offered are frequently independent from market price signals
39
40
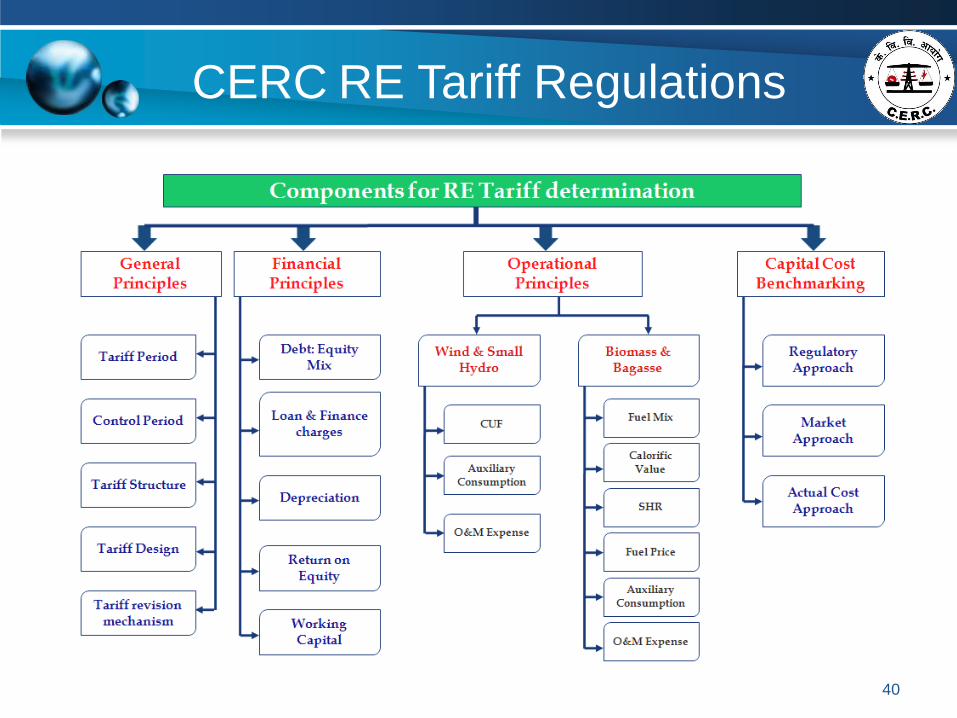
CERC RE Tariff Regulations
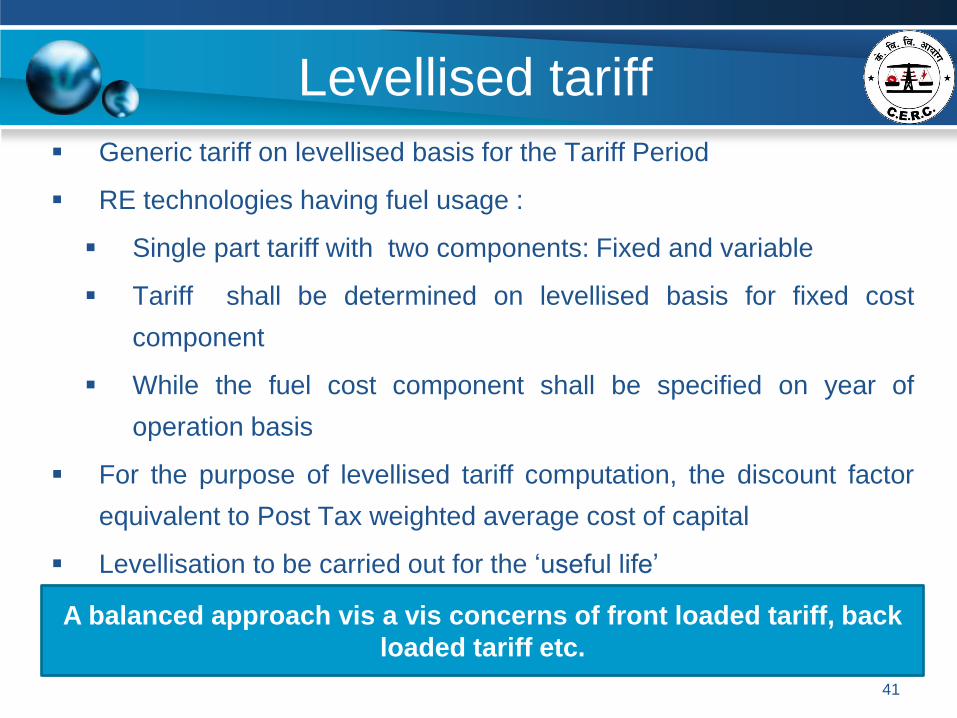
Levellised tariff
Generic tariff on levellised basis for the Tariff Period
RE technologies having fuel usage :
Single part tariff with two components: Fixed and variable
Tariff shall be determined on levellised basis for fixed cost
component
While the fuel cost component shall be specified on year of
operation basis
For the purpose of levellised tariff computation, the discount factor
equivalent to Post Tax weighted average cost of capital
Levellisation to be carried out for the ‘useful life’
41
A balanced approach vis a vis concerns of front loaded tariff, back
loaded tariff etc.
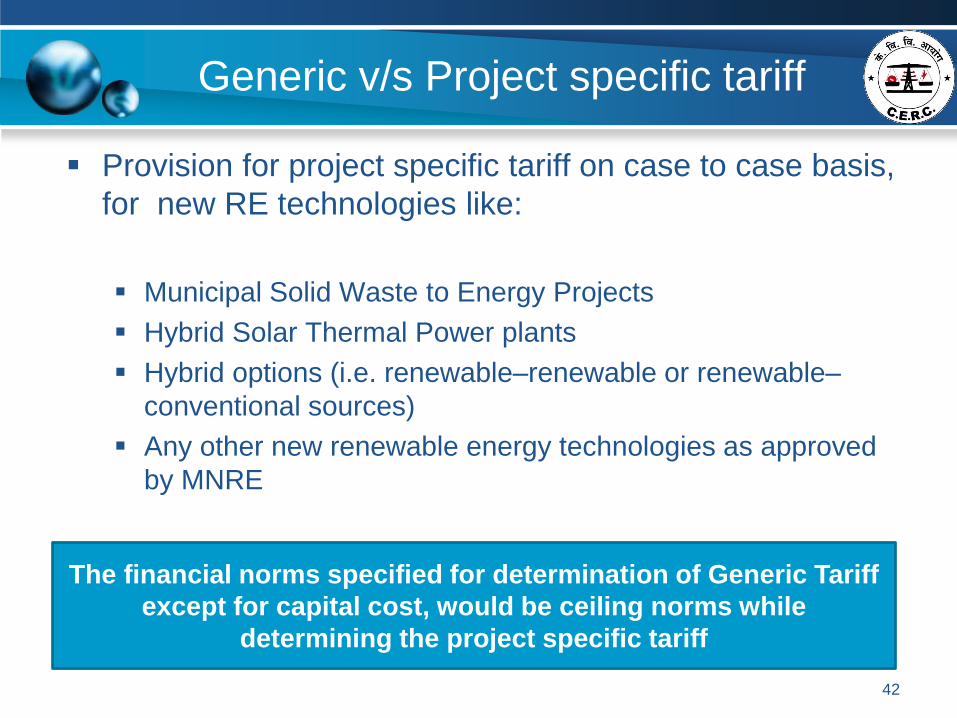
Generic v/s Project specific tariff
Provision for project specific tariff on case to case basis,
for new RE technologies like:
Municipal Solid Waste to Energy Projects
Hybrid Solar Thermal Power plants
Hybrid options (i.e. renewable–renewable or renewable–
conventional sources)
Any other new renewable energy technologies as approved
by MNRE
42
The financial norms specified for determination of Generic Tariff
except for capital cost, would be ceiling norms while
determining the project specific tariff
Tariff Period
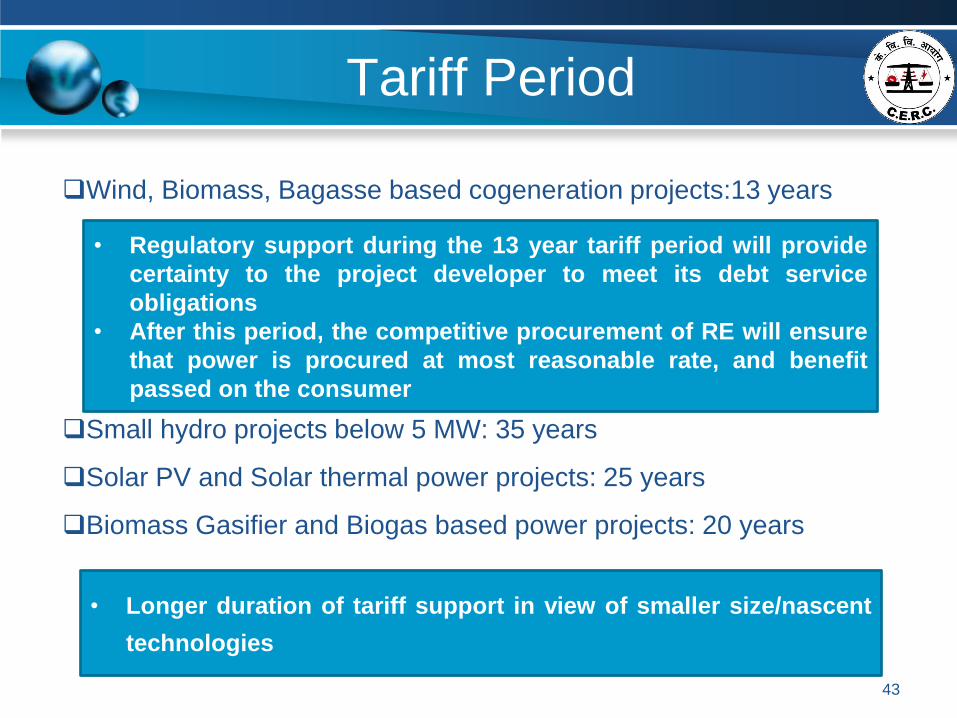
Wind, Biomass, Bagasse based cogeneration projects:13 years
Small hydro projects below 5 MW: 35 years
Solar PV and Solar thermal power projects: 25 years
Biomass Gasifier and Biogas based power projects: 20 years
43
• Longer duration of tariff support in view of smaller size/nascent
technologies
• Regulatory support during the 13 year tariff period will provide
certainty to the project developer to meet its debt service
obligations
• After this period, the competitive procurement of RE will ensure
that power is procured at most reasonable rate, and benefit
passed on the consumer

Capital Cost Benchmarking
Various approaches are evaluated for development of
benchmark capital cost for different RE technologies
Regulatory Approach: Norms as approved by various SERCs are most
simple and easy to follow
Market Based Approach: Project awarded through competitive tender
process carried out by public and private entities
Actual Project Cost Approach: Information furnished by developers
as a part of project appraisal requirements to various financial
institutions/banks to avail loan or to UNFCCC for registering the project to
avail CDM benefits
International Project Cost based Approach
44
Subsequently suitable indexation mechanism devised to
consider the year on year variation for the underlying capital
cost parameters

Financial Principles
Debt : Equity Ratio considered at 70 : 30. For project specific tariff, In case of equity funding in excess of 30%, to be treated as normative loan. In case of equity funding lower than 30%, actual equity to be considered.
Return on Equity Value base at 30% of capital cost or actual equity (whichever is lower). Pre-tax ROE: 19% p.a. for first 10 years and 24% p.a. from 11th year
onwards.
Loan Terms Tenure of loan considered as 12 years. Interest rate : SBI Base rate + 300 basis points
Depreciation ‘Differential depreciation’ approach over loan period & ‘Straight Line’
method over the remaining useful life. Allowed upto 90% of capital cost considering salvage value as 10%. On SLM basis at 5.83 % p.a. for first 12 years and remaining depreciation to
be spread over balance useful life of asset.
45
Financial Principles
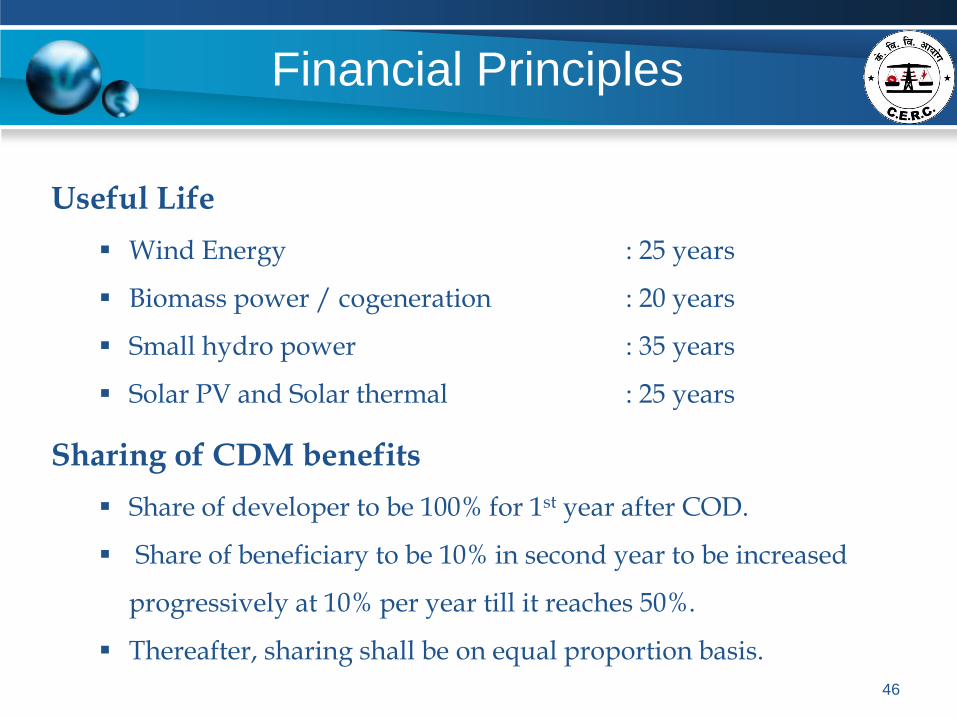
Useful Life
Wind Energy : 25 years
Biomass power / cogeneration : 20 years
Small hydro power : 35 years
Solar PV and Solar thermal : 25 years
Sharing of CDM benefits
Share of developer to be 100% for 1st year after COD.
Share of beneficiary to be 10% in second year to be increased
progressively at 10% per year till it reaches 50%.
Thereafter, sharing shall be on equal proportion basis.
46

Financial Principles
Working Capital
Interest rate equivalent to average SBI Base rate plus 350 basis points
Technology
O&M
expense Receivables
Maintenance
spares Fuel cost
Wind/ Small
Hydro/ Solar 1 Month 2 Month
15% of O&M
expense
Biomass/ Non-
fossil Fuel Co-
generation 1 Month 2 Month
15% of O&M
expense
4 months of
fuel stock at
normative PLF
47
TECHNOLOGY SPECIFIC PARAMETERS
48
Wind Energy
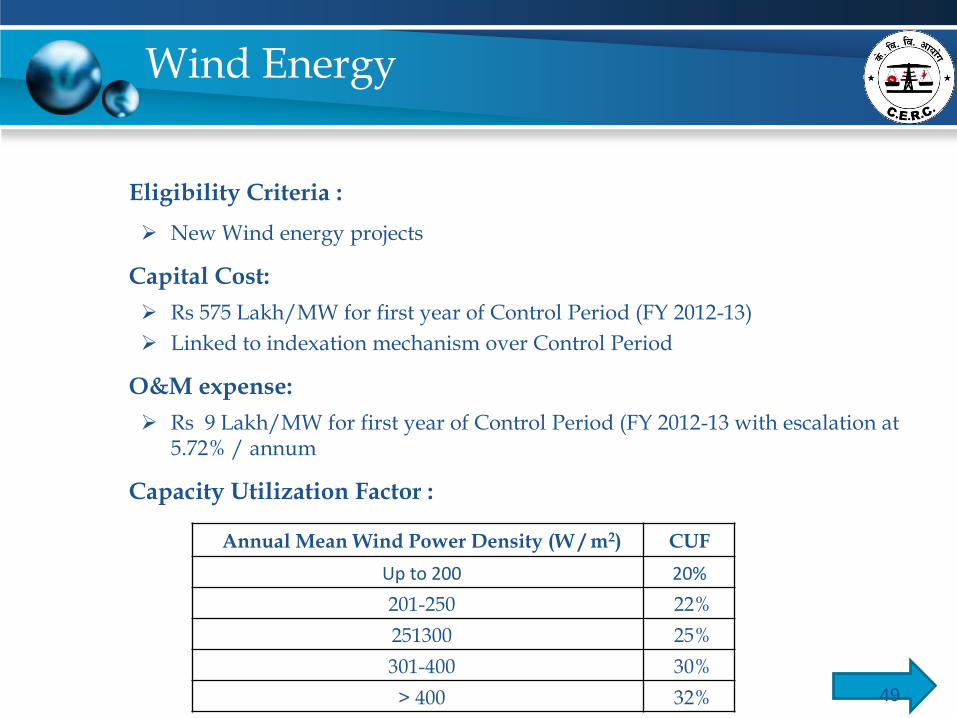
Eligibility Criteria :
New Wind energy projects
Capital Cost:
Rs 575 Lakh/MW for first year of Control Period (FY 2012-13)
Linked to indexation mechanism over Control Period
O&M expense:
Rs 9 Lakh/MW for first year of Control Period (FY 2012-13 with escalation at 5.72% / annum
Capacity Utilization Factor :
Annual Mean Wind Power Density (W / m2) CUF
Up to 200 20%
201-250 22%
251300 25%
301-400 30%
> 400 32% 49

Small Hydro Projects
S.
No. Particular Unit Description
1. Capital cost
Himanchal Pradesh and Uttarakhand (Below 5 MW) Rs Lakh/ MW 770
Himanchal Pradesh and Uttarakhand (5 MW to 25 MW) Rs Lakh/ MW 700
Other States (Below 5 MW) Rs Lakh/ MW 600
Other States (5 MW to 25 MW) Rs Lakh/ MW 550
2. Capacity Utilisation Factor (CUF)
Himanchal Pradesh and Uttarakhand % 45%
Other States % 30%
3. O&M cost
Himanchal Pradesh and Uttarakhand (Below 5 MW) Rs Lakh/ MW 25
Himanchal Pradesh and Uttarakhand (5 MW to 25 MW) Rs Lakh/ MW 18
Other States (Below 5 MW) Rs Lakh/ MW 20
Other States (5 MW to 25 MW) Rs Lakh/ MW 14
4. Auxiliary Consumption % 1% 50

Biomass Power Projects
Eligibility Criteria:
Biomass power projects based on Rankine cycle technology and using biomass fuel sources, provided use of fossil fuel is restricted only to 15% of total fuel consumption on annual basis.
S. No. Particular Unit Description
1 Capital Cost Rs Lakh/MW 450
2 Plant Load Factor
1st yr during stabilization % 60%
remaining period of the 1st yr % 70%
Next year onward % 80%
3 Auxiliary Consumption % 10
4 Station Heat Rate kCal/kWh 4000
5 O&M Expenses Rs Lakh/MW 24
51
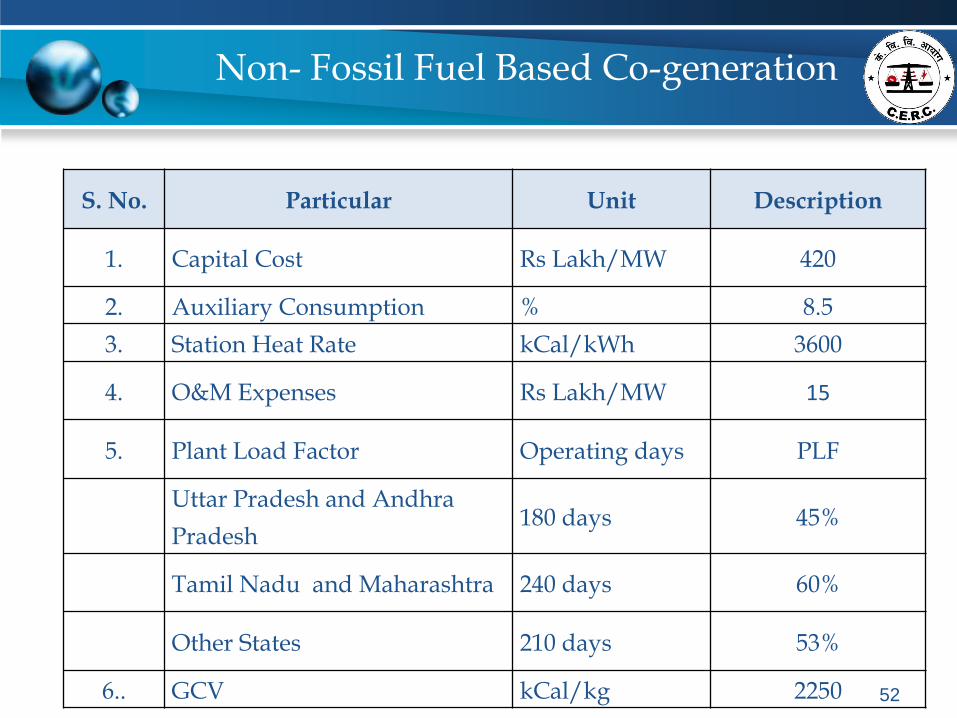
Non- Fossil Fuel Based Co-generation
S. No. Particular Unit Description
1. Capital Cost Rs Lakh/MW 420
2. Auxiliary Consumption % 8.5
3. Station Heat Rate kCal/kWh 3600
4. O&M Expenses Rs Lakh/MW 15
5. Plant Load Factor Operating days PLF
Uttar Pradesh and Andhra
Pradesh 180 days 45%
Tamil Nadu and Maharashtra 240 days 60%
Other States 210 days 53%
6.. GCV kCal/kg 2250 52
Solar PV & Solar Thermal
S.
No
.
Particular Unit Solar PV Solar Thermal
1. Technology
Aspect
crystalline
silicon or thin
film etc.
Concentrated solar power
(CSP) technologies viz. line
focusing or point focusing
2. Capital cost Rs Lakh/
MW 800 1200
3. CUF % 19% 23%
4. O&M cost Rs Lakh/
MW 9.0 13
5. Auxiliary
Consumption
%
NA 10%
53
Draft RE Tariff Order 2014-15
354/2013 (suo-moto)

Wind
Annual Mean WPD
(W/m2) at 50 mtr
HH
CUF 2009-10
` /kWh
2010-11
` /kWh
2011-12
` /kWh
Zone-1 200-250 20% 5.63 5.07 5.33
Zone-2 250-300 23% 4.90 4.41 4.63
Zone-3 300-400 27% 4.70 3.75 3.95
Zone-4 > 400 30% 3.75 3.38 3.55
WPD at 80 mtr 2012-13
` /kWh
2013-14
` /kWh
2014-15
` /kWh
Zone-1 Upto 200 20% 5.96 6.29 6.34
Zone-2 200-250 22% 5.42 5.72 5.76
Zone-3 250-300 25% 4.77 5.03 5.07
Zone-4 300-400 29% 3.97 4.19 4.23
Zone-5 > 400 32% 3.73 3.93 3.96 55
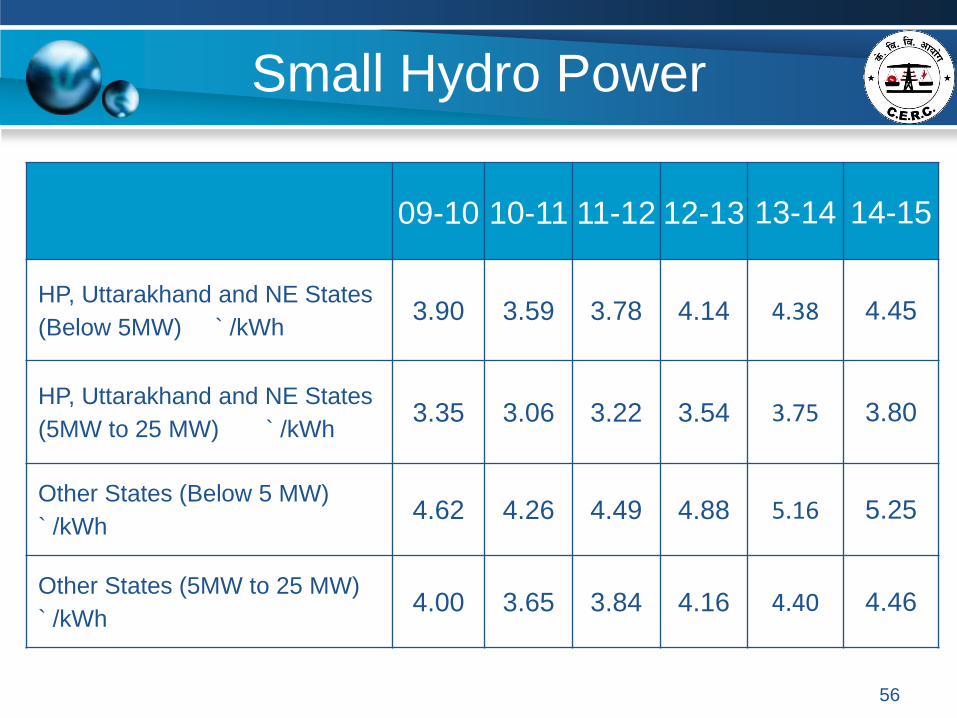
Small Hydro Power
09-10 10-11 11-12 12-13 13-14 14-15
HP, Uttarakhand and NE States
(Below 5MW) ` /kWh 3.90 3.59 3.78 4.14 4.38 4.45
HP, Uttarakhand and NE States
(5MW to 25 MW) ` /kWh 3.35 3.06 3.22 3.54 3.75 3.80
Other States (Below 5 MW)
` /kWh 4.62 4.26 4.49 4.88 5.16 5.25
Other States (5MW to 25 MW)
` /kWh 4.00 3.65 3.84 4.16 4.40 4.46
56
COMPETITIVE BIDDING
FOR
TARIFF DISCOVERY
57
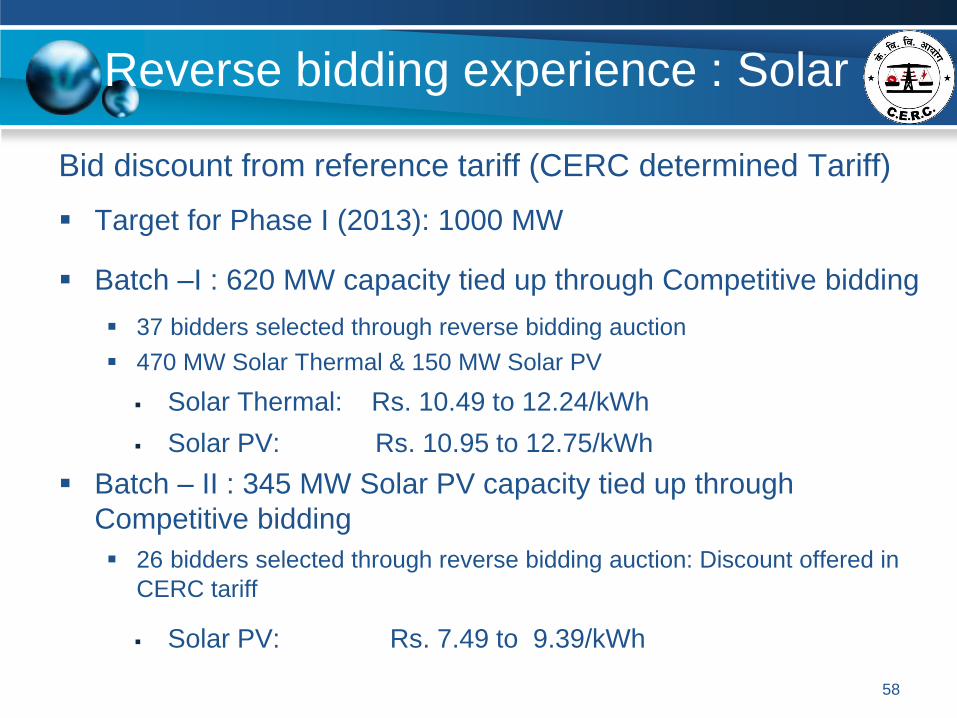
Reverse bidding experience : Solar
Bid discount from reference tariff (CERC determined Tariff)
Target for Phase I (2013): 1000 MW
Batch –I : 620 MW capacity tied up through Competitive bidding
37 bidders selected through reverse bidding auction
470 MW Solar Thermal & 150 MW Solar PV
Solar Thermal: Rs. 10.49 to 12.24/kWh
Solar PV: Rs. 10.95 to 12.75/kWh
Batch – II : 345 MW Solar PV capacity tied up through
Competitive bidding
26 bidders selected through reverse bidding auction: Discount offered in
CERC tariff
Solar PV: Rs. 7.49 to 9.39/kWh
58
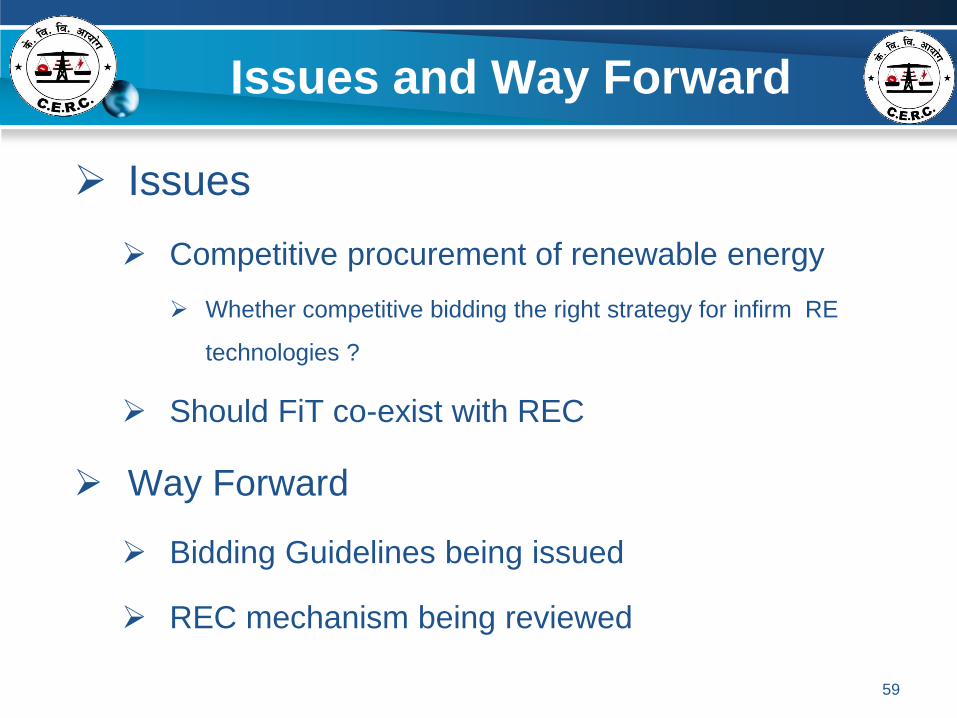
Issues and Way Forward
Issues
Competitive procurement of renewable energy
Whether competitive bidding the right strategy for infirm RE
technologies ?
Should FiT co-exist with REC
Way Forward
Bidding Guidelines being issued
REC mechanism being reviewed
59
www.cercind.gov.in
Central Electricity Regulatory Commission
3rd &4th Floor, Chanderlok Building
36, Janpath,New Delhi - 110 001
Phone : 011 2335 3503

TECHNOLOGY SPECIFIC NORMS: WIND ENERGY
61
Wind
Wind - Capital Cost
Capital Cost
O & M Cost
CUF
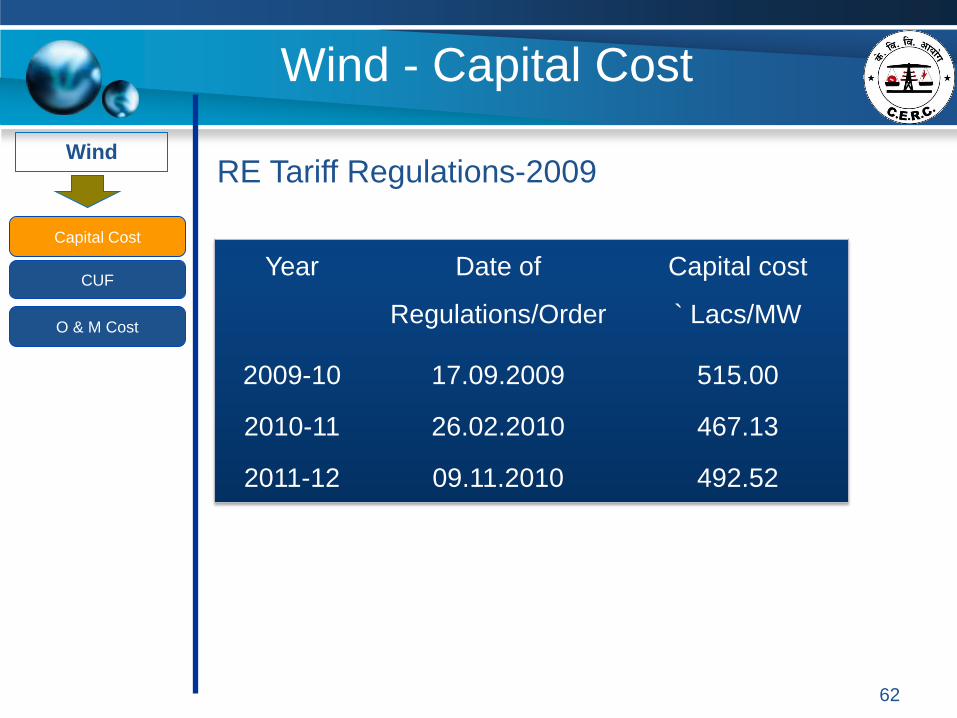
RE Tariff Regulations-2009
Year Date of
Regulations/Order
Capital cost
` Lacs/MW
2009-10 17.09.2009 515.00
2010-11 26.02.2010 467.13
2011-12 09.11.2010 492.52
62
Wind
Wind - Capital Cost
Capital Cost
O & M Cost
CUF
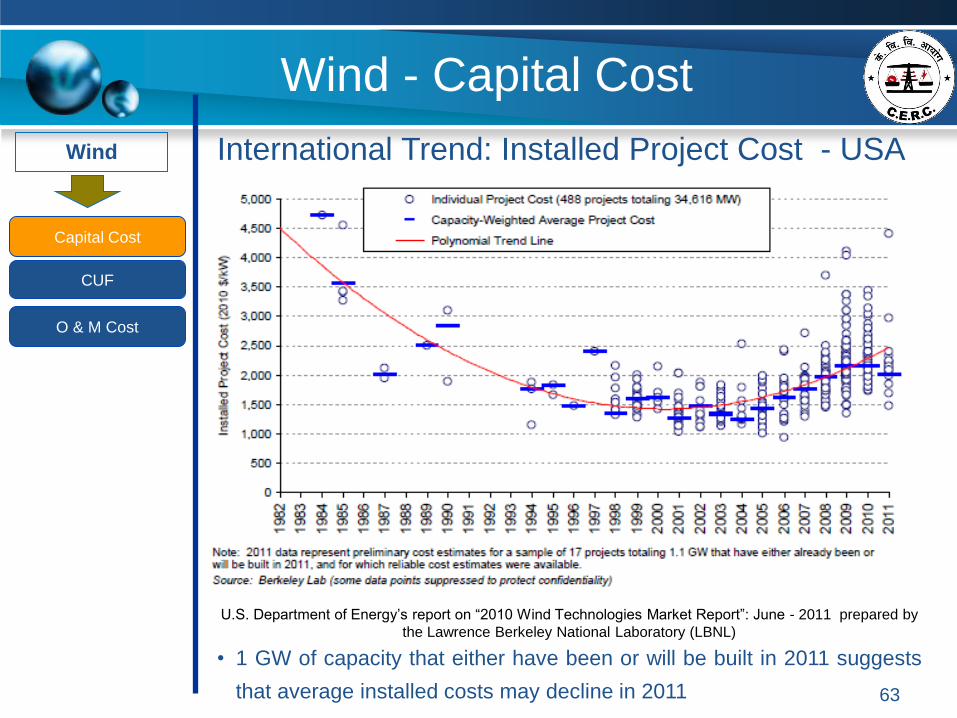
International Trend: Installed Project Cost - USA
U.S. Department of Energy’s report on “2010 Wind Technologies Market Report”: June - 2011 prepared by
the Lawrence Berkeley National Laboratory (LBNL)
• 1 GW of capacity that either have been or will be built in 2011 suggests
that average installed costs may decline in 2011 63
Wind
Wind - Capital Cost
Capital Cost
O & M Cost
CUF
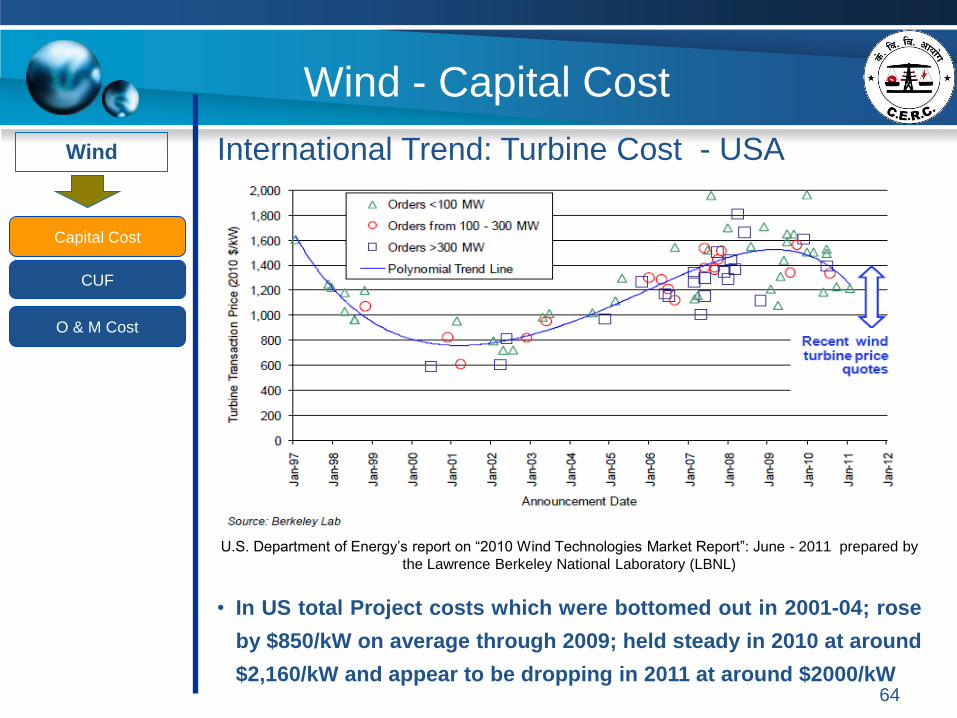
International Trend: Turbine Cost - USA
U.S. Department of Energy’s report on “2010 Wind Technologies Market Report”: June - 2011 prepared by
the Lawrence Berkeley National Laboratory (LBNL)
• In US total Project costs which were bottomed out in 2001-04; rose
by $850/kW on average through 2009; held steady in 2010 at around
$2,160/kW and appear to be dropping in 2011 at around $2000/kW 64
Wind
Wind - Capital Cost
Capital Cost
O & M Cost
CUF
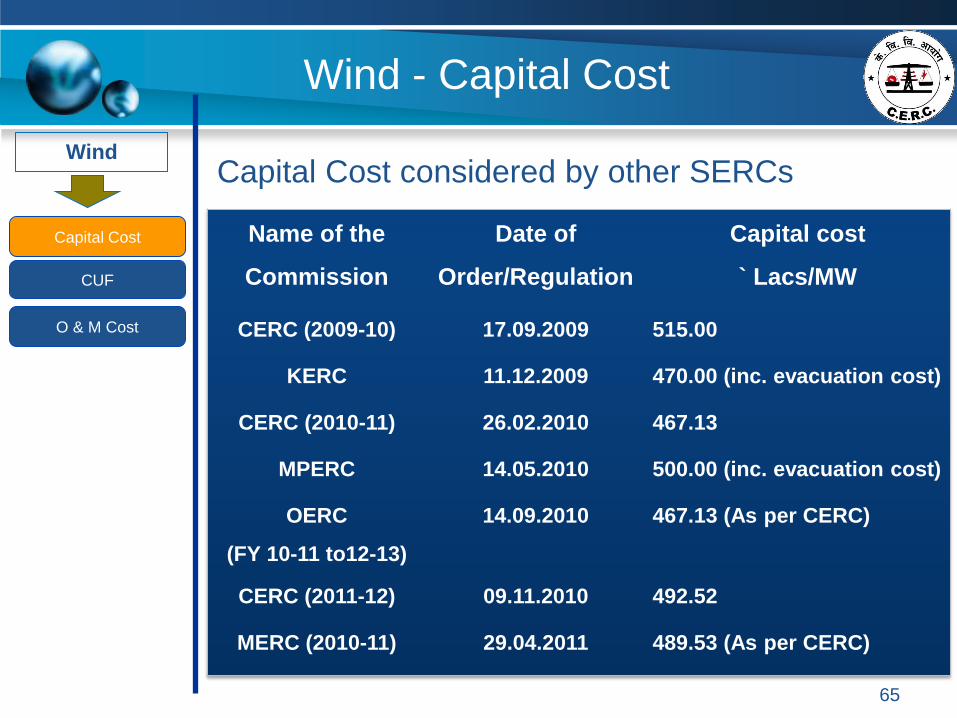
Capital Cost considered by other SERCs
Name of the
Commission
Date of
Order/Regulation
Capital cost
` Lacs/MW
CERC (2009-10) 17.09.2009 515.00
KERC 11.12.2009 470.00 (inc. evacuation cost)
CERC (2010-11) 26.02.2010 467.13
MPERC 14.05.2010 500.00 (inc. evacuation cost)
OERC
(FY 10-11 to12-13)
14.09.2010 467.13 (As per CERC)
CERC (2011-12) 09.11.2010 492.52
MERC (2010-11) 29.04.2011 489.53 (As per CERC)
65
Wind
Wind - Capital Cost
Capital Cost
O & M Cost
CUF
Capital Cost:
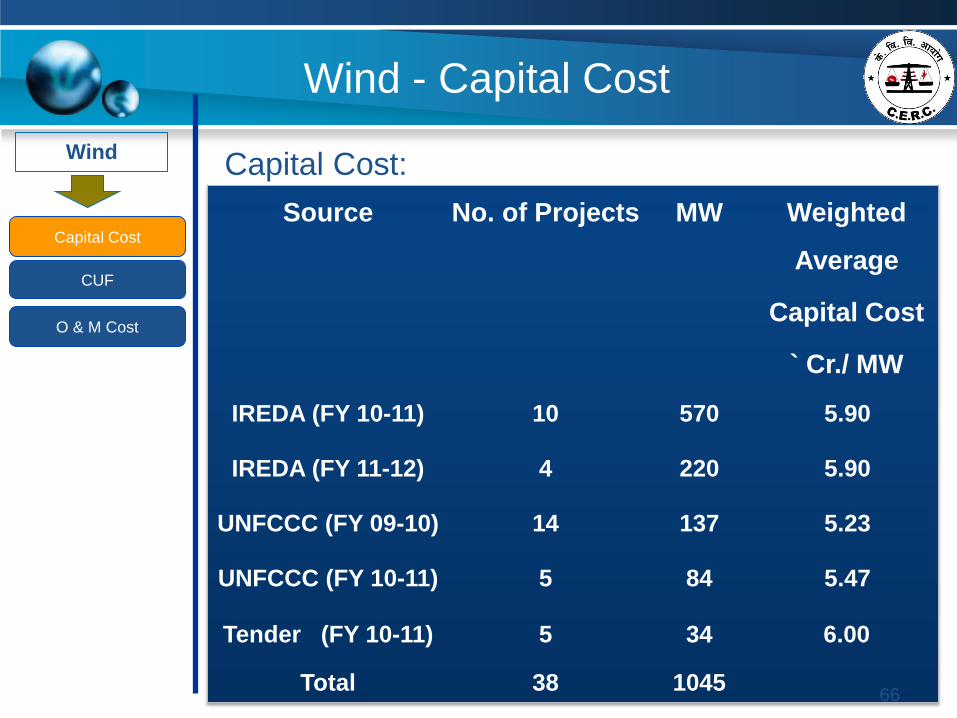
• The average project cost in the industry stands higher at around `
5.23 to 6 Cr./MW depending upon the size, capacity, sites as against
the CERC’s normative ` 4.92 Cr./MW for 2011-12
Source No. of Projects MW Weighted
Average
Capital Cost
` Cr./ MW
IREDA (FY 10-11) 10 570 5.90
IREDA (FY 11-12) 4 220 5.90
UNFCCC (FY 09-10) 14 137 5.23
UNFCCC (FY 10-11) 5 84 5.47
Tender (FY 10-11) 5 34 6.00
Total 38 1045 66
Wind
Wind - Capital Cost
Capital Cost
O & M Cost
CUF
2.1 MW-S88
Component Breakup % cost Net Cost
SUPPLY OF WTG WITHOUT TT 58% 33265546
SUPPLY OF BLADE 9% 5284916
SUPPLY OF TT 12% 6761086
SUPPLY OF TRANSFORMER 1% 751232
ERECTION 2% 974985
COMMISSIONING 0% 108272
MEDA CHARGES 1% 315517
MEDA Application Fees 0% 5259
ZP Road charges 0% 210345
CIVIL WORKS 5% 2925897
ELEC LINE & SUPPLY 4% 2299406
LAND 3% 1442365
EVACUATION 5% 3155174
100% 57,500,000
67
Wind
Wind: Capacity Utilisation Factor
Capital Cost
O & M Cost
CUF
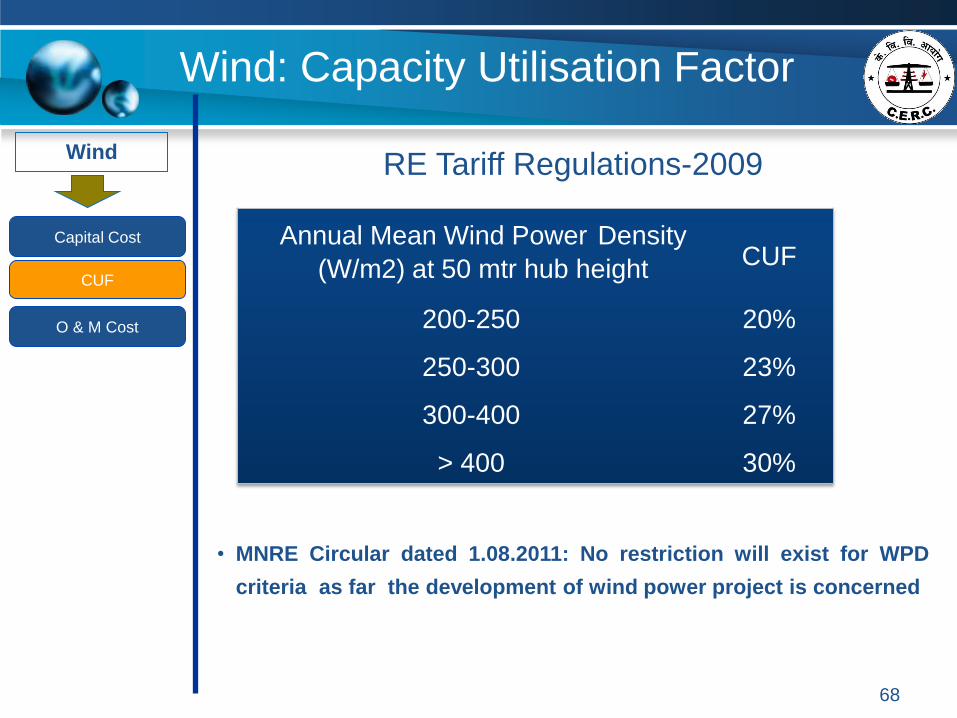
RE Tariff Regulations-2009
• Wind Atlas as and when prepared by C-WET would be basis of
categorization of wind sties
• C-WET
• Published Indian Wind Atlas in February 2010
• MNRE Circular dated 1.08.2011: No restriction will exist for WPD
criteria as far the development of wind power project is concerned
Annual Mean Wind Power Density
(W/m2) at 50 mtr hub height
CUF
200-250 20%
250-300 23%
300-400 27%
> 400 30%
68
Wind
Capital Cost
O & M Cost
CUF
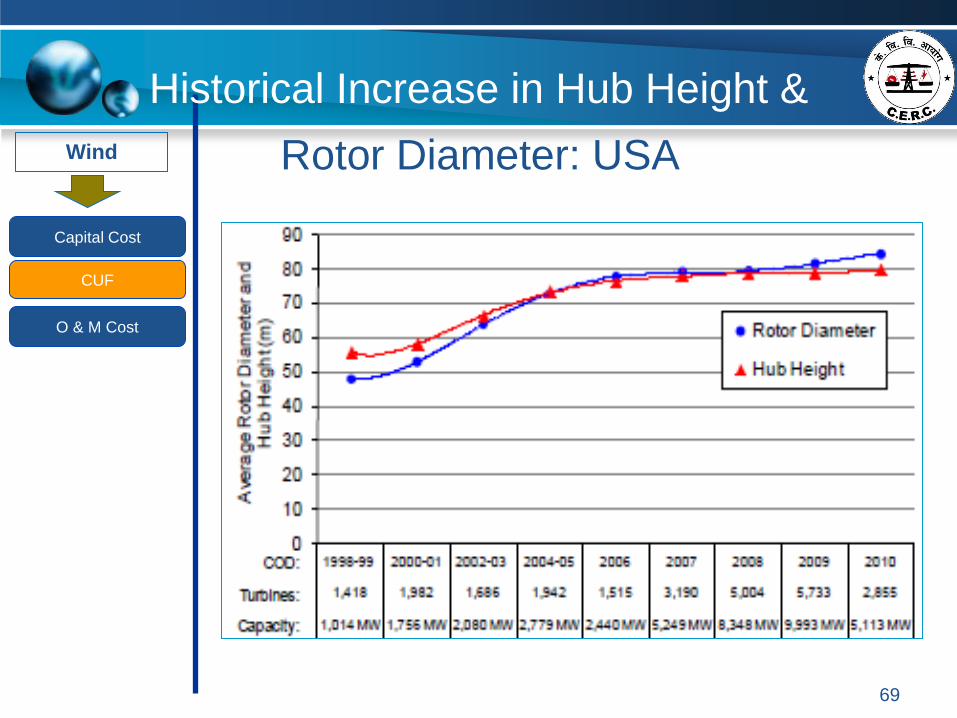
• Electricity Markets and Policy Group, Energy Analysis Department:
Lawrence Berkeley National Laboratory
Historical Increase in Hub Height &
Rotor Diameter: USA
69
Wind
Capital Cost
O & M Cost
CUF
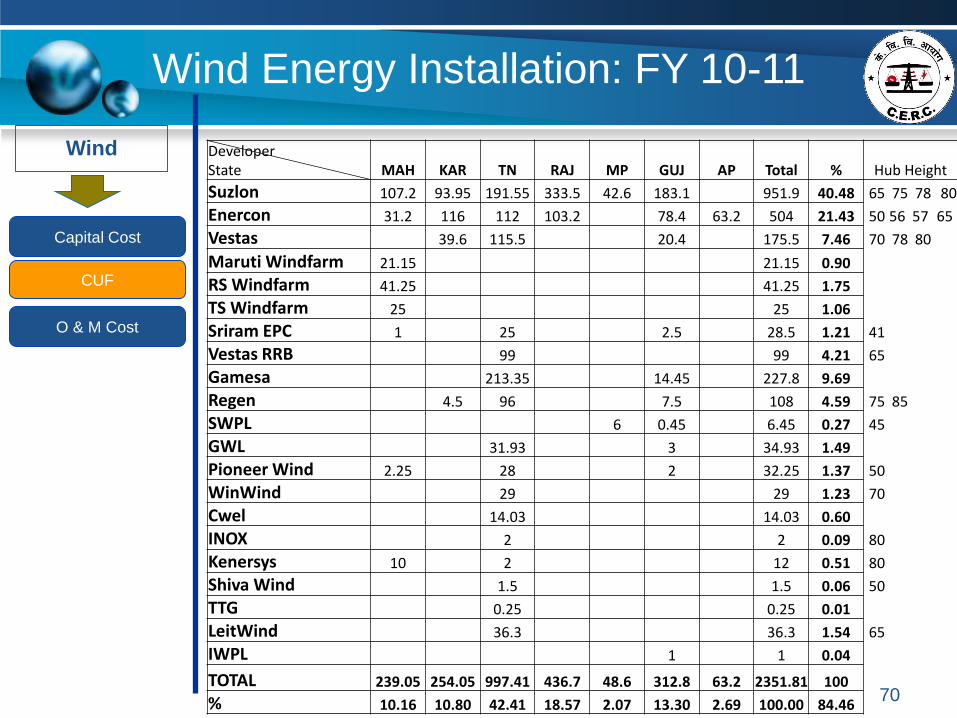
Wind Energy Installation: FY 10-11
Developer State MAH KAR TN RAJ MP GUJ AP Total % Hub Height
Suzlon 107.2 93.95 191.55 333.5 42.6 183.1 951.9 40.48 65 75 78 80
Enercon 31.2 116 112 103.2 78.4 63.2 504 21.43 50 56 57 65
Vestas 39.6 115.5 20.4 175.5 7.46 70 78 80
Maruti Windfarm 21.15 21.15 0.90
RS Windfarm 41.25 41.25 1.75
TS Windfarm 25 25 1.06
Sriram EPC 1 25 2.5 28.5 1.21 41
Vestas RRB 99 99 4.21 65
Gamesa 213.35 14.45 227.8 9.69
Regen 4.5 96 7.5 108 4.59 75 85
SWPL 6 0.45 6.45 0.27 45
GWL 31.93 3 34.93 1.49
Pioneer Wind 2.25 28 2 32.25 1.37 50
WinWind 29 29 1.23 70
Cwel 14.03 14.03 0.60
INOX 2 2 0.09 80
Kenersys 10 2 12 0.51 80
Shiva Wind 1.5 1.5 0.06 50
TTG 0.25 0.25 0.01
LeitWind 36.3 36.3 1.54 65
IWPL 1 1 0.04
TOTAL 239.05 254.05 997.41 436.7 48.6 312.8 63.2 2351.81 100
% 10.16 10.80 42.41 18.57 2.07 13.30 2.69 100.00 84.46 70
Wind
Capital Cost
O & M Cost
CUF
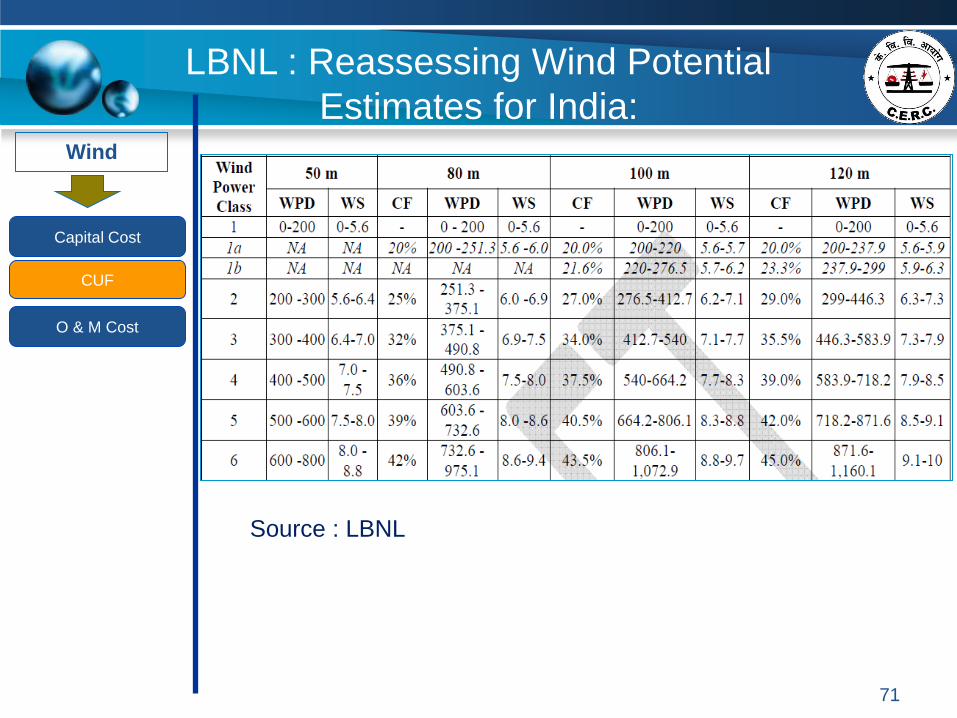
LBNL : Reassessing Wind Potential
Estimates for India:
Source : LBNL
71
Wind
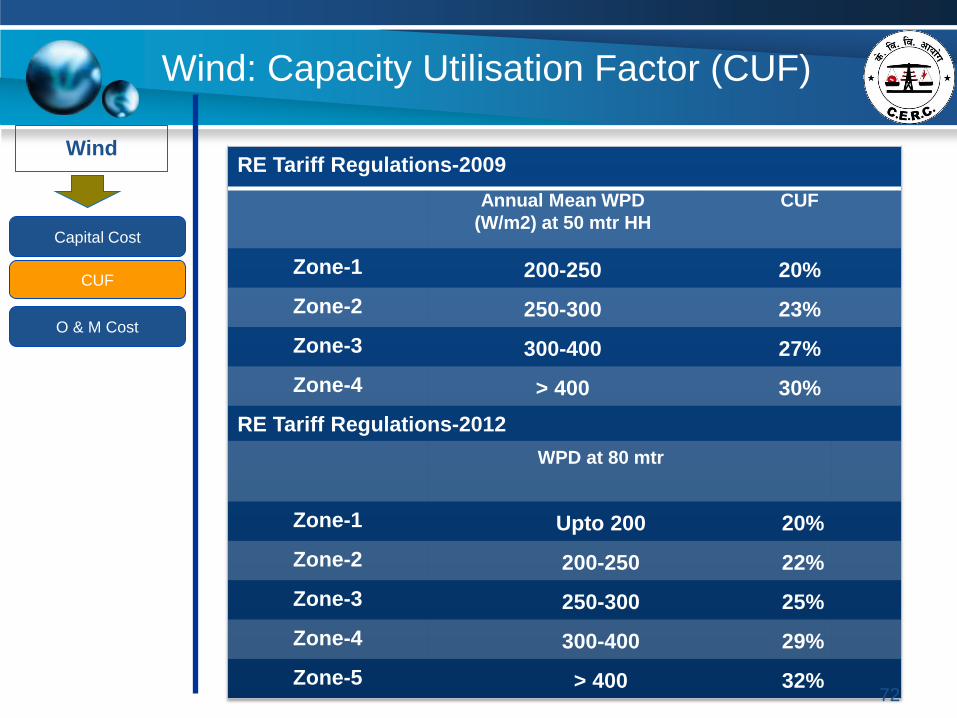
Wind: Capacity Utilisation Factor (CUF)
Capital Cost
O & M Cost
CUF
RE Tariff Regulations-2009
Annual Mean WPD
(W/m2) at 50 mtr HH
CUF
Zone-1 200-250 20%
Zone-2 250-300 23%
Zone-3 300-400 27%
Zone-4 > 400 30%
RE Tariff Regulations-2012
WPD at 80 mtr
Zone-1 Upto 200 20%
Zone-2 200-250 22%
Zone-3 250-300 25%
Zone-4 300-400 29%
Zone-5 > 400 32% 72
Wind
Wind: Operation & Maintenance Cost
Capital Cost
O & M Cost
CUF
RE Tariff Regulations-2009
• Normative O&M expenses for the first year of the Control Period
(i.e. FY 2009-10) : ` 6.5 Lakh/ MW.
• Escalation Rate: 5.72% per annum over the tariff period to
compute the levellised tariff.
• FY 2010-11: ` 6.87 Lakh/ MW, FY 2011-12: ` 7.26 Lakh/ MW
O&M agreement being signed between the wind farm
developers and investors are in the range of ` 7 to 10
lakh/MW.
Now Forecasting cost would be additional cost
RE Tariff Regulations-2012
• Commission considered 5.72% annual escalation over the
normative Operation and Maintenance Cost allowed for FY 11-12 along
with additional insurance cost was considered at 0.25% of capital cost as
well as forecasting cost: FY 2012-13 Rs. 9 Lakh/MW with 5.72% Esc.
73
REN 2013: Global Status report
• Most policies to support renewable energy target the
power sector, with feed-in tariffs (FITs) and
renewable portfolio standards (RPSs) used most
frequently.
• During 2012, FIT policies were enacted in five
countries, all in Africa and the Middle East; the
majority of FIT-related changes involved reduced
support.
• New RPS policies were enacted in two countries.
• An increasing number of countries turned to public
competitive bidding, or tendering, to deploy
renewables.
74