Regression discontinuity designs: an approach to the ... · Regression discontinuity designs: an...
5
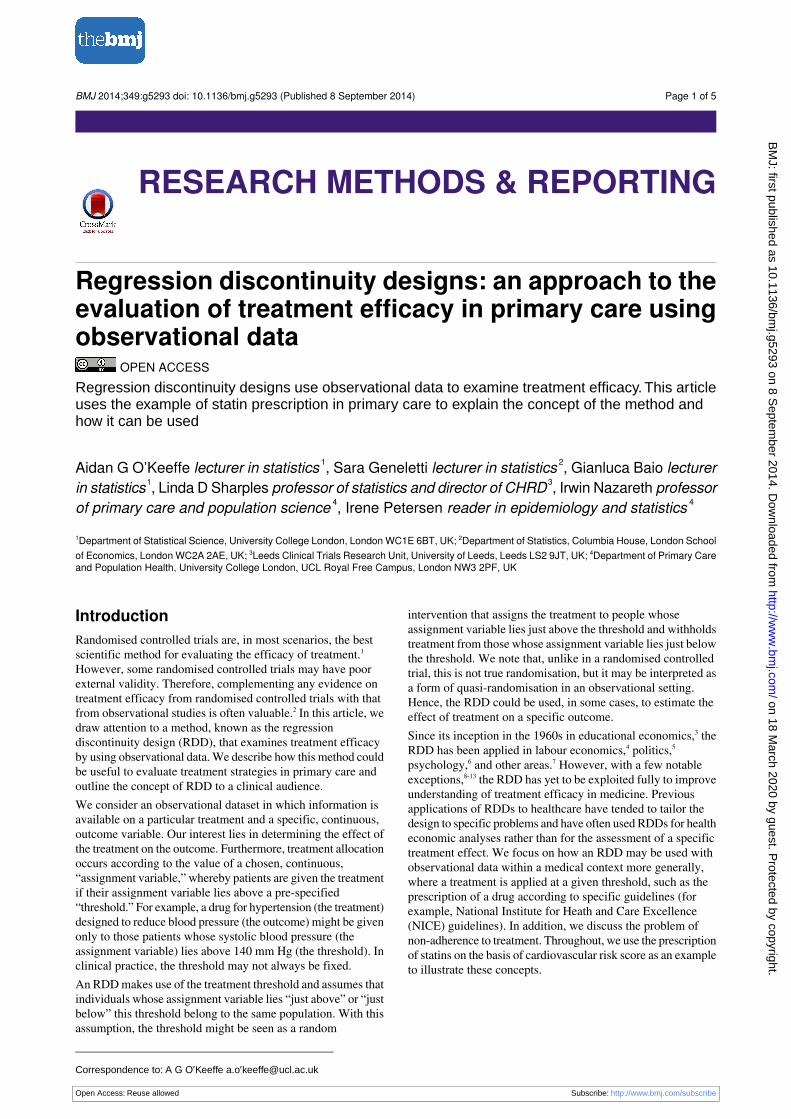
Regression discontinuity designs: an approach to the evaluation of treatment efficacy in primary care using observational data OPEN ACCESS Regression discontinuity designs use observational data to examine treatment efficacy.This article uses the example of statin prescription in primary care to explain the concept of the method and how it can be used Aidan G O’Keeffe lecturer in statistics 1 , Sara Geneletti lecturer in statistics 2 , Gianluca Baio lecturer in statistics 1 , Linda D Sharples professor of statistics and director of CHRD 3 , Irwin Nazareth professor of primary care and population science 4 , Irene Petersen reader in epidemiology and statistics 4 1 Department of Statistical Science, University College London, London WC1E 6BT, UK; 2 Department of Statistics, Columbia House, London School of Economics, London WC2A 2AE, UK; 3 Leeds Clinical Trials Research Unit, University of Leeds, Leeds LS2 9JT, UK; 4 Department of Primary Care and Population Health, University College London, UCL Royal Free Campus, London NW3 2PF, UK Introduction Randomised controlled trials are, in most scenarios, the best scientific method for evaluating the efficacy of treatment. 1 However, some randomised controlled trials may have poor external validity. Therefore, complementing any evidence on treatment efficacy from randomised controlled trials with that from observational studies is often valuable. 2 In this article, we draw attention to a method, known as the regression discontinuity design (RDD), that examines treatment efficacy by using observational data. We describe how this method could be useful to evaluate treatment strategies in primary care and outline the concept of RDD to a clinical audience. We consider an observational dataset in which information is available on a particular treatment and a specific, continuous, outcome variable. Our interest lies in determining the effect of the treatment on the outcome. Furthermore, treatment allocation occurs according to the value of a chosen, continuous, “assignment variable,” whereby patients are given the treatment if their assignment variable lies above a pre-specified “threshold.” For example, a drug for hypertension (the treatment) designed to reduce blood pressure (the outcome) might be given only to those patients whose systolic blood pressure (the assignment variable) lies above 140 mm Hg (the threshold). In clinical practice, the threshold may not always be fixed. An RDD makes use of the treatment threshold and assumes that individuals whose assignment variable lies “just above” or “just below” this threshold belong to the same population. With this assumption, the threshold might be seen as a random intervention that assigns the treatment to people whose assignment variable lies just above the threshold and withholds treatment from those whose assignment variable lies just below the threshold. We note that, unlike in a randomised controlled trial, this is not true randomisation, but it may be interpreted as a form of quasi-randomisation in an observational setting. Hence, the RDD could be used, in some cases, to estimate the effect of treatment on a specific outcome. Since its inception in the 1960s in educational economics, 3 the RDD has been applied in labour economics, 4 politics, 5 psychology, 6 and other areas. 7 However, with a few notable exceptions, 8-13 the RDD has yet to be exploited fully to improve understanding of treatment efficacy in medicine. Previous applications of RDDs to healthcare have tended to tailor the design to specific problems and have often used RDDs for health economic analyses rather than for the assessment of a specific treatment effect. We focus on how an RDD may be used with observational data within a medical context more generally, where a treatment is applied at a given threshold, such as the prescription of a drug according to specific guidelines (for example, National Institute for Heath and Care Excellence (NICE) guidelines). In addition, we discuss the problem of non-adherence to treatment. Throughout, we use the prescription of statins on the basis of cardiovascular risk score as an example to illustrate these concepts. Correspondence to: A G O’Keeffe a.o’[email protected] Open Access: Reuse allowed Subscribe: http://www.bmj.com/subscribe BMJ 2014;349:g5293 doi: 10.1136/bmj.g5293 (Published 8 September 2014) Page 1 of 5 Research Methods & Reporting RESEARCH METHODS & REPORTING on 18 March 2020 by guest. Protected by copyright. http://www.bmj.com/ BMJ: first published as 10.1136/bmj.g5293 on 8 September 2014. Downloaded from
Transcript of Regression discontinuity designs: an approach to the ... · Regression discontinuity designs: an...
Regression discontinuity designs: an approach to theevaluation of treatment efficacy in primary care usingobservational data
OPEN ACCESSRegression discontinuity designs use observational data to examine treatment efficacy. This articleuses the example of statin prescription in primary care to explain the concept of the method andhow it can be used
Aidan G O’Keeffe lecturer in statistics 1, Sara Geneletti lecturer in statistics 2, Gianluca Baio lecturerin statistics1, Linda D Sharples professor of statistics and director of CHRD3, Irwin Nazareth professorof primary care and population science 4, Irene Petersen reader in epidemiology and statistics 4
1Department of Statistical Science, University College London, London WC1E 6BT, UK; 2Department of Statistics, Columbia House, London Schoolof Economics, London WC2A 2AE, UK; 3Leeds Clinical Trials Research Unit, University of Leeds, Leeds LS2 9JT, UK; 4Department of Primary Careand Population Health, University College London, UCL Royal Free Campus, London NW3 2PF, UK
IntroductionRandomised controlled trials are, in most scenarios, the bestscientific method for evaluating the efficacy of treatment.1However, some randomised controlled trials may have poorexternal validity. Therefore, complementing any evidence ontreatment efficacy from randomised controlled trials with thatfrom observational studies is often valuable.2 In this article, wedraw attention to a method, known as the regressiondiscontinuity design (RDD), that examines treatment efficacyby using observational data.We describe how this method couldbe useful to evaluate treatment strategies in primary care andoutline the concept of RDD to a clinical audience.We consider an observational dataset in which information isavailable on a particular treatment and a specific, continuous,outcome variable. Our interest lies in determining the effect ofthe treatment on the outcome. Furthermore, treatment allocationoccurs according to the value of a chosen, continuous,“assignment variable,” whereby patients are given the treatmentif their assignment variable lies above a pre-specified“threshold.” For example, a drug for hypertension (the treatment)designed to reduce blood pressure (the outcome) might be givenonly to those patients whose systolic blood pressure (theassignment variable) lies above 140 mm Hg (the threshold). Inclinical practice, the threshold may not always be fixed.An RDDmakes use of the treatment threshold and assumes thatindividuals whose assignment variable lies “just above” or “justbelow” this threshold belong to the same population. With thisassumption, the threshold might be seen as a random
intervention that assigns the treatment to people whoseassignment variable lies just above the threshold and withholdstreatment from those whose assignment variable lies just belowthe threshold. We note that, unlike in a randomised controlledtrial, this is not true randomisation, but it may be interpreted asa form of quasi-randomisation in an observational setting.Hence, the RDD could be used, in some cases, to estimate theeffect of treatment on a specific outcome.Since its inception in the 1960s in educational economics,3 theRDD has been applied in labour economics,4 politics,5psychology,6 and other areas.7 However, with a few notableexceptions,8-13 the RDD has yet to be exploited fully to improveunderstanding of treatment efficacy in medicine. Previousapplications of RDDs to healthcare have tended to tailor thedesign to specific problems and have often used RDDs for healtheconomic analyses rather than for the assessment of a specifictreatment effect. We focus on how an RDD may be used withobservational data within a medical context more generally,where a treatment is applied at a given threshold, such as theprescription of a drug according to specific guidelines (forexample, National Institute for Heath and Care Excellence(NICE) guidelines). In addition, we discuss the problem ofnon-adherence to treatment. Throughout, we use the prescriptionof statins on the basis of cardiovascular risk score as an exampleto illustrate these concepts.
Correspondence to: A G O’Keeffe a.o’[email protected]
Open Access: Reuse allowed Subscribe: http://www.bmj.com/subscribe
BMJ 2014;349:g5293 doi: 10.1136/bmj.g5293 (Published 8 September 2014) Page 1 of 5
Research Methods & Reporting
RESEARCH METHODS & REPORTING
on 18 March 2020 by guest. P
rotected by copyright.http://w
ww
.bmj.com
/B
MJ: first published as 10.1136/bm
j.g5293 on 8 Septem
ber 2014. Dow
nloaded from
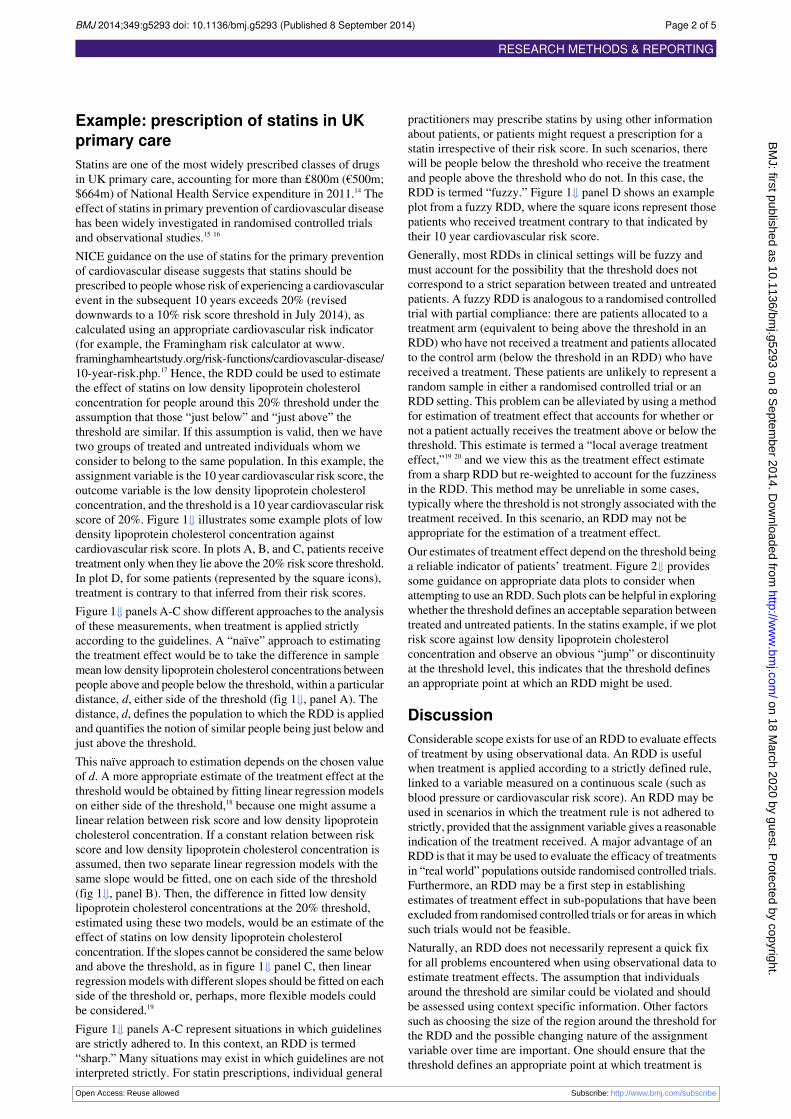
Example: prescription of statins in UKprimary careStatins are one of the most widely prescribed classes of drugsin UK primary care, accounting for more than £800m (€500m;$664m) of National Health Service expenditure in 2011.14 Theeffect of statins in primary prevention of cardiovascular diseasehas been widely investigated in randomised controlled trialsand observational studies.15 16
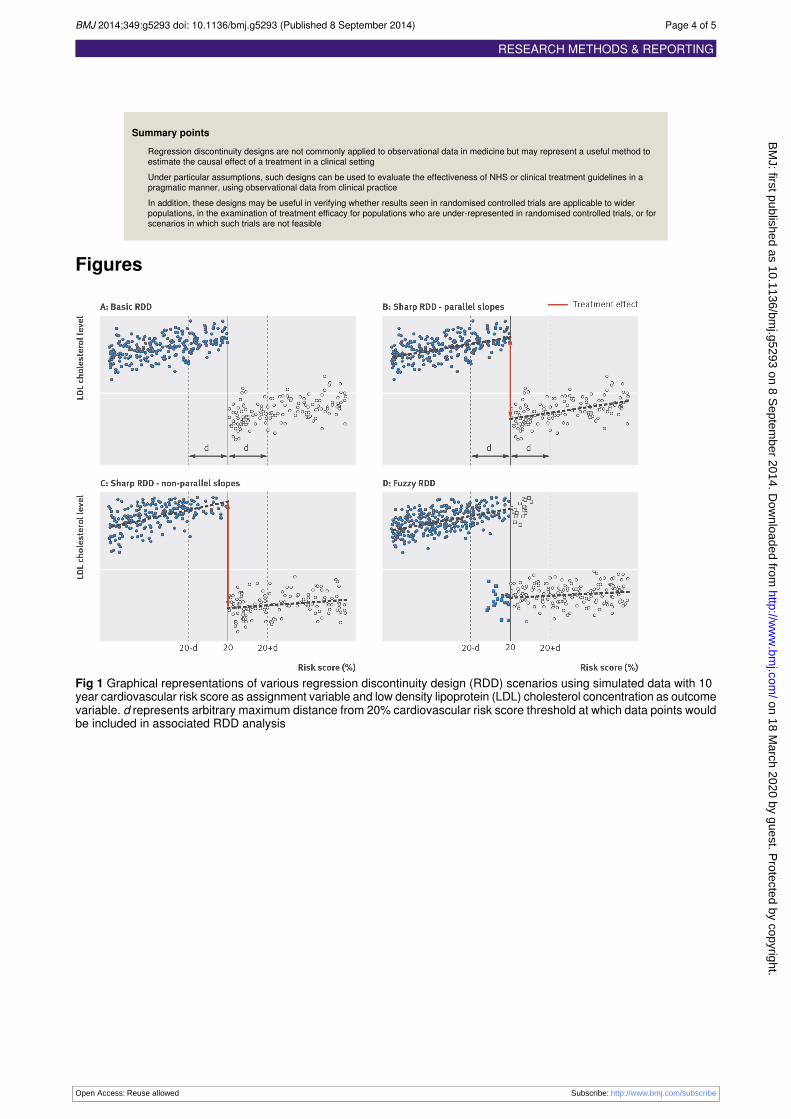
NICE guidance on the use of statins for the primary preventionof cardiovascular disease suggests that statins should beprescribed to people whose risk of experiencing a cardiovascularevent in the subsequent 10 years exceeds 20% (reviseddownwards to a 10% risk score threshold in July 2014), ascalculated using an appropriate cardiovascular risk indicator(for example, the Framingham risk calculator at www.framinghamheartstudy.org/risk-functions/cardiovascular-disease/10-year-risk.php.17 Hence, the RDD could be used to estimatethe effect of statins on low density lipoprotein cholesterolconcentration for people around this 20% threshold under theassumption that those “just below” and “just above” thethreshold are similar. If this assumption is valid, then we havetwo groups of treated and untreated individuals whom weconsider to belong to the same population. In this example, theassignment variable is the 10 year cardiovascular risk score, theoutcome variable is the low density lipoprotein cholesterolconcentration, and the threshold is a 10 year cardiovascular riskscore of 20%. Figure 1⇓ illustrates some example plots of lowdensity lipoprotein cholesterol concentration againstcardiovascular risk score. In plots A, B, and C, patients receivetreatment only when they lie above the 20% risk score threshold.In plot D, for some patients (represented by the square icons),treatment is contrary to that inferred from their risk scores.Figure 1⇓ panels A-C show different approaches to the analysisof these measurements, when treatment is applied strictlyaccording to the guidelines. A “naïve” approach to estimatingthe treatment effect would be to take the difference in samplemean low density lipoprotein cholesterol concentrations betweenpeople above and people below the threshold, within a particulardistance, d, either side of the threshold (fig 1⇓, panel A). Thedistance, d, defines the population to which the RDD is appliedand quantifies the notion of similar people being just below andjust above the threshold.This naïve approach to estimation depends on the chosen valueof d. A more appropriate estimate of the treatment effect at thethreshold would be obtained by fitting linear regression modelson either side of the threshold,18 because one might assume alinear relation between risk score and low density lipoproteincholesterol concentration. If a constant relation between riskscore and low density lipoprotein cholesterol concentration isassumed, then two separate linear regression models with thesame slope would be fitted, one on each side of the threshold(fig 1⇓, panel B). Then, the difference in fitted low densitylipoprotein cholesterol concentrations at the 20% threshold,estimated using these two models, would be an estimate of theeffect of statins on low density lipoprotein cholesterolconcentration. If the slopes cannot be considered the same belowand above the threshold, as in figure 1⇓ panel C, then linearregressionmodels with different slopes should be fitted on eachside of the threshold or, perhaps, more flexible models couldbe considered.19
Figure 1⇓ panels A-C represent situations in which guidelinesare strictly adhered to. In this context, an RDD is termed“sharp.” Many situations may exist in which guidelines are notinterpreted strictly. For statin prescriptions, individual general
practitioners may prescribe statins by using other informationabout patients, or patients might request a prescription for astatin irrespective of their risk score. In such scenarios, therewill be people below the threshold who receive the treatmentand people above the threshold who do not. In this case, theRDD is termed “fuzzy.” Figure 1⇓ panel D shows an exampleplot from a fuzzy RDD, where the square icons represent thosepatients who received treatment contrary to that indicated bytheir 10 year cardiovascular risk score.Generally, most RDDs in clinical settings will be fuzzy andmust account for the possibility that the threshold does notcorrespond to a strict separation between treated and untreatedpatients. A fuzzy RDD is analogous to a randomised controlledtrial with partial compliance: there are patients allocated to atreatment arm (equivalent to being above the threshold in anRDD) who have not received a treatment and patients allocatedto the control arm (below the threshold in an RDD) who havereceived a treatment. These patients are unlikely to represent arandom sample in either a randomised controlled trial or anRDD setting. This problem can be alleviated by using a methodfor estimation of treatment effect that accounts for whether ornot a patient actually receives the treatment above or below thethreshold. This estimate is termed a “local average treatmenteffect,”19 20 and we view this as the treatment effect estimatefrom a sharp RDD but re-weighted to account for the fuzzinessin the RDD. This method may be unreliable in some cases,typically where the threshold is not strongly associated with thetreatment received. In this scenario, an RDD may not beappropriate for the estimation of a treatment effect.Our estimates of treatment effect depend on the threshold beinga reliable indicator of patients’ treatment. Figure 2⇓ providessome guidance on appropriate data plots to consider whenattempting to use an RDD. Such plots can be helpful in exploringwhether the threshold defines an acceptable separation betweentreated and untreated patients. In the statins example, if we plotrisk score against low density lipoprotein cholesterolconcentration and observe an obvious “jump” or discontinuityat the threshold level, this indicates that the threshold definesan appropriate point at which an RDD might be used.
DiscussionConsiderable scope exists for use of an RDD to evaluate effectsof treatment by using observational data. An RDD is usefulwhen treatment is applied according to a strictly defined rule,linked to a variable measured on a continuous scale (such asblood pressure or cardiovascular risk score). An RDD may beused in scenarios in which the treatment rule is not adhered tostrictly, provided that the assignment variable gives a reasonableindication of the treatment received. A major advantage of anRDD is that it may be used to evaluate the efficacy of treatmentsin “real world” populations outside randomised controlled trials.Furthermore, an RDD may be a first step in establishingestimates of treatment effect in sub-populations that have beenexcluded from randomised controlled trials or for areas in whichsuch trials would not be feasible.Naturally, an RDD does not necessarily represent a quick fixfor all problems encountered when using observational data toestimate treatment effects. The assumption that individualsaround the threshold are similar could be violated and shouldbe assessed using context specific information. Other factorssuch as choosing the size of the region around the threshold forthe RDD and the possible changing nature of the assignmentvariable over time are important. One should ensure that thethreshold defines an appropriate point at which treatment is
Open Access: Reuse allowed Subscribe: http://www.bmj.com/subscribe
BMJ 2014;349:g5293 doi: 10.1136/bmj.g5293 (Published 8 September 2014) Page 2 of 5
RESEARCH METHODS & REPORTING
on 18 March 2020 by guest. P
rotected by copyright.http://w
ww
.bmj.com
/B
MJ: first published as 10.1136/bm
j.g5293 on 8 Septem
ber 2014. Dow
nloaded from
started. Plots of the assignment variable against the outcomevariable, such as those in figure 2⇓, would help to establish this.Finally, as with most observational studies, the problems ofpossible unobserved confounding andmissing data usually needcareful consideration.Overall, an RDD applied to observational data represents apragmatic approach to estimation of treatment effect in clinicalpractice. The rich data available from electronic health records,if used appropriately, may allow the effectiveness of NHS orgovernment defined prescription rules to be evaluated.
We thank Philip Dawid, Nick Freemantle, Richard Morris, and SylviaRichardson for insightful discussions.Contributors: AGO’K led on writing the manuscript; all other authorscontributed to the final version. AGO’K is the guarantor.Competing interests: All authors have completed the ICMJE uniformdisclosure form at www.icmje.org/coi_disclosure.pdf (available onrequest from the corresponding author) and declare: all authors receivesupport through grant MR/K014838/1 from the Medical ResearchCouncil; no financial relationships with any organisations that mighthave an interest in the submitted work in the previous three years; noother relationships or activities that could appear to have influenced thesubmitted workProvenance and peer review: Not commissioned; not externally peerreviewed.
1 Pringle M, Churchill R. Randomised controlled trials in general practice. BMJ1995;311:1382-3.
2 Black N. Why we need observational studies to evaluate the effectiveness of health care.BMJ 1996;312:1215-8.
3 Thistlethwaite DL, Campbell DT. Regression discontinuity analysis: an alternative to theex post facto experiment. J Educ Psychol 1960;51:309-17.
4 Lalive R. How do extended benefits affect unemployment duration? A regressiondiscontinuity approach. J Econom 2008;142:785-806.
5 Lee DS. Randomized experiments from non-random selection in U.S. House elections.J Econom 2008;142:675-97.
6 Imbens GW, Lemieux T. Regression discontinuity designs: a guide to practice. J Econom2008;142:615-35.
7 Berk RA, de Leeuw J. An evaluation of California’s inmate classification system using ageneralized regression discontinuity design. J Am Stat Assoc 1999;94:1045-52.
8 Linden A, Adams JL, Roberts N. Evaluating disease management programmeeffectiveness: an introduction to the regression discontinuity design. J Eval Clin Pract2006;12:124-31.
9 Linden A, Adams JL. Combining the regression discontinuity design and propensityscore-based weighting to improve causal inference in program evaluation. J Eval ClinPract 2012;18:317-25.
10 Almond D, Doyle JJ, Kowalski AE, Williams H. Estimating marginal returns to medicalcare: evidence from at-risk newborns. Q J Econ 2010;125:591-634.
11 Almond D, Doyle JJ. After midnight: a regression discontinuity design in length ofpostpartum hospital stays. Am Econ J Econ Policy 2011;3(3):1-34.
12 Koch TG. Using RD design to understand heterogeneity in health insurance crowd-out.J Health Econ 2013;32:599-611.
13 Card D, Dobkin C, Maestas N. The impact of nearly universal insurance coverage onhealth care utilization: evidence from Medicare. Am Econ Rev 2008;98:2242-58.
14 Trusler D. Statin prescriptions in UK now total a million each week. BMJ 2011;343:d4350.15 Law MR, Wald NJ, Rudnicka AR. Quantifying effect of statins on low density lipoprotein
cholesterol, ischaemic heart disease, and stroke: systematic review and meta-analysis.BMJ 2003;326:1423.
16 Brugts JJ, Yetgin T, Hoeks SE, Gotto AM, Shepherd J, Westendorp RG, et al. The benefitsof statins in people without established cardiovascular disease but with cardiovascularrisk factors: meta-analysis of randomised controlled trials. BMJ 2009;338:b2376.
17 National Institute for Health and Clinical Excellence. Lipid modification: cardiovascularrisk assessment and the modification of blood lipids for the primary and secondaryprevention of cardiovascular diseases. NICE, 2008 (Clinical Guideline 67, replaced byCG181).
18 Sedgwick P. Simple linear regression. BMJ 2013;346:f2340.19 Lee DS, Lemieux T. Regression discontinuity designs in economics. J Econ Lit
2010:281-355.20 Angrist JD, Imbens GW, Rubin DB. Identification of causal effects using instrumental
variables. J Am Stat Assoc 1996;91:444-55.
Accepted: 6 June 2014
Cite this as: BMJ 2014;339:g5293This is an Open Access article distributed in accordance with the terms of the CreativeCommons Attribution (CC BY 4.0) license, which permits others to distribute, remix, adapt,build upon this work, for commercial use, provided the original work is properly cited. See:http://creativecommons.org/licenses/by/4.0/
Open Access: Reuse allowed Subscribe: http://www.bmj.com/subscribe
BMJ 2014;349:g5293 doi: 10.1136/bmj.g5293 (Published 8 September 2014) Page 3 of 5
RESEARCH METHODS & REPORTING
on 18 March 2020 by guest. P
rotected by copyright.http://w
ww
.bmj.com
/B
MJ: first published as 10.1136/bm
j.g5293 on 8 Septem
ber 2014. Dow
nloaded from
Summary points
Regression discontinuity designs are not commonly applied to observational data in medicine but may represent a useful method toestimate the causal effect of a treatment in a clinical settingUnder particular assumptions, such designs can be used to evaluate the effectiveness of NHS or clinical treatment guidelines in apragmatic manner, using observational data from clinical practiceIn addition, these designs may be useful in verifying whether results seen in randomised controlled trials are applicable to widerpopulations, in the examination of treatment efficacy for populations who are under-represented in randomised controlled trials, or forscenarios in which such trials are not feasible
Figures
Fig 1 Graphical representations of various regression discontinuity design (RDD) scenarios using simulated data with 10year cardiovascular risk score as assignment variable and low density lipoprotein (LDL) cholesterol concentration as outcomevariable. d represents arbitrary maximum distance from 20% cardiovascular risk score threshold at which data points wouldbe included in associated RDD analysis
Open Access: Reuse allowed Subscribe: http://www.bmj.com/subscribe
BMJ 2014;349:g5293 doi: 10.1136/bmj.g5293 (Published 8 September 2014) Page 4 of 5
RESEARCH METHODS & REPORTING
on 18 March 2020 by guest. P
rotected by copyright.http://w
ww
.bmj.com
/B
MJ: first published as 10.1136/bm
j.g5293 on 8 Septem
ber 2014. Dow
nloaded from
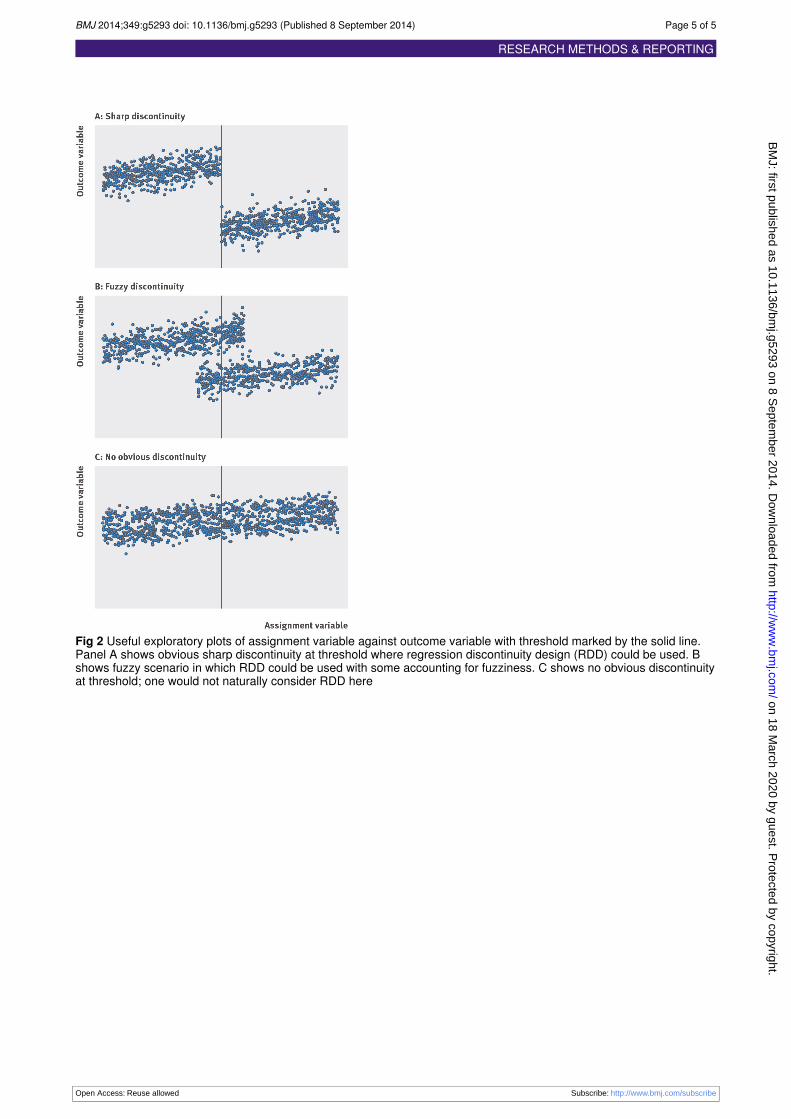
Fig 2 Useful exploratory plots of assignment variable against outcome variable with threshold marked by the solid line.Panel A shows obvious sharp discontinuity at threshold where regression discontinuity design (RDD) could be used. Bshows fuzzy scenario in which RDD could be used with some accounting for fuzziness. C shows no obvious discontinuityat threshold; one would not naturally consider RDD here
Open Access: Reuse allowed Subscribe: http://www.bmj.com/subscribe
BMJ 2014;349:g5293 doi: 10.1136/bmj.g5293 (Published 8 September 2014) Page 5 of 5
RESEARCH METHODS & REPORTING
on 18 March 2020 by guest. P
rotected by copyright.http://w
ww
.bmj.com
/B
MJ: first published as 10.1136/bm
j.g5293 on 8 Septem
ber 2014. Dow
nloaded from