Registration and Voting Participation Differences · PDF fileRegistration and Voting...
14
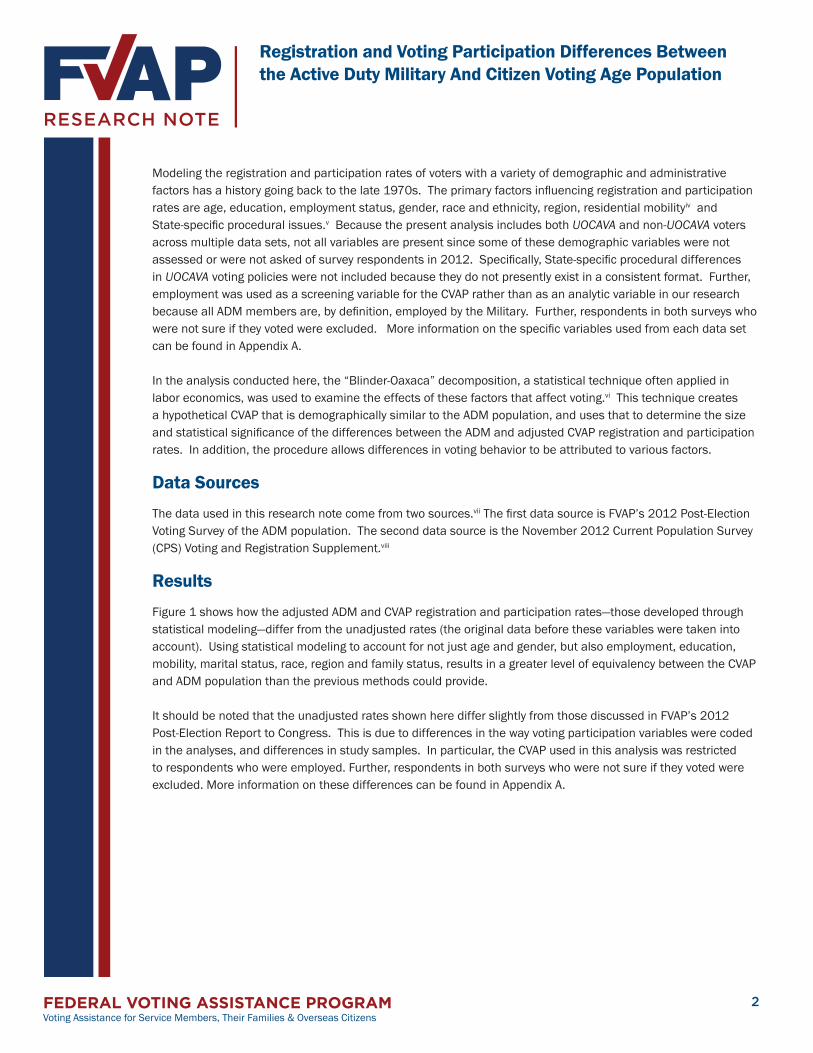
Registration and Voting Participation Differences Between the Active Duty Military And Citizen Voting Age Population Introduction The Federal Voting Assistance Program’s (FVAP’s) 2012 Post-Election Report to Congress stated that many voting observers, including FVAP, compare active duty military (ADM) voter registration and participation rates with those of the citizen voting age population (CVAP; see page 5 of Report). These comparisons help monitor the rate at which absent military voters are able to vote, and help FVAP evaluate its effectiveness administering the Uniformed and Overseas Citizens Absentee Voting Act (UOCAVA). Specifically, these comparisons identify the extent to which military voters who exercise their right to vote have an equivalent opportunity to have their vote counted. i However, the ADM population differs from the CVAP in a wide variety of ways, making past comparisons misleading, as they lack the full contrast between these populations. In recent reports to Congress, FVAP has used “industry standard statistical methods to normalize the active duty military population to be demographically similar to the CVAP” (FVAP’s 2012 Post-Election Report to Congress, page 4). This involves adjusting the ADM survey data to CVAP estimates of age and gender. However, FVAP has noted that this may not be sufficient, because “research shows that the military and civilian populations are significantly dissimilar regarding two additional characteristics, education and mobility” (FVAP’s 2012 Post- Election Report to Congress, page 4). This research note discusses how the comparison between ADM and CVAP registration and voter participation rates ii has been made in the past, and then describes how a statistical modeling approach, used in the current analysis, can make a more appropriate and useful comparison. Methodology The goal of the current effort described in this Research Note is to develop an approach to better compare the CVAP and ADM population in a way that accounts for age, gender, education, mobility and any other characteristics that have been found to be associated with voting participation. iii Statistical modeling is ideally suited for this problem because it can help answer the basic research question of how the registration and participation rates of the ADM compare with that part of the CVAP that most closely resembles the ADM. This method differs from the one used in FVAP’s 2012 Post-Election Report to Congress, which essentially modifies the composition of the ADM to resemble the CVAP. The modeling approach, therefore, provides greater insight into how the ADM population as a whole compares with a similar CVAP, while explicitly highlighting the potential causes of registration and participation differences. FEDERAL VOTING ASSISTANCE PROGRAM Voting Assistance for Service Members, Their Families & Overseas Citizens 1 The primary factors influencing registration and participation rates are age, education, employment status, gender, race and ethnicity, region, residential mobility and State-specific procedural issues.
Transcript of Registration and Voting Participation Differences · PDF fileRegistration and Voting...
Registration and Voting Participation Differences Between the Active Duty Military And Citizen Voting Age Population
Introduction
The Federal Voting Assistance Program’s (FVAP’s) 2012 Post-Election Report to Congress stated that many voting observers, including FVAP, compare active duty military (ADM) voter registration and participation rates with those of the citizen voting age population (CVAP; see page 5 of Report). These comparisons help monitor the rate at which absent military voters are able to vote, and help FVAP evaluate its effectiveness administering the Uniformed and Overseas Citizens Absentee Voting Act (UOCAVA). Specifically, these comparisons identify the extent to which military voters who exercise their right to vote have an equivalent opportunity to have their vote counted.i However, the ADM population differs from the CVAP in a wide variety of ways, making past comparisons misleading, as they lack the full contrast between these populations.
In recent reports to Congress, FVAP has used “industry standard statistical methods to normalize the active duty military population to be demographically similar to the CVAP” (FVAP’s 2012 Post-Election Report to Congress, page 4). This involves adjusting the ADM survey data to CVAP estimates of age and gender. However, FVAP has noted that this may not be sufficient, because “research shows that the military and civilian populations are significantly dissimilar regarding two additional characteristics, education and mobility” (FVAP’s 2012 Post-Election Report to Congress, page 4).
This research note discusses how the comparison between ADM and CVAP registration and voter participation ratesii has been made in the past, and then describes how a statistical modeling approach, used in the current analysis, can make a more appropriate and useful comparison.
Methodology
The goal of the current effort described in this Research Note is to develop an approach to better compare the CVAP and ADM population in a way that accounts for age, gender, education, mobility and any other characteristics that have been found to be associated with voting participation.iii Statistical modeling is ideally suited for this problem because it can help answer the basic research question of how the registration and participation rates of the ADM compare with that part of the CVAP that most closely resembles the ADM. This method differs from the one used in FVAP’s 2012 Post-Election Report to Congress, which essentially modifies the composition of the ADM to resemble the CVAP. The modeling approach, therefore, provides greater insight into how the ADM population as a whole compares with a similar CVAP, while explicitly highlighting the potential causes of registration and participation differences.
FEDERAL VOTING ASSISTANCE PROGRAMVoting Assistance for Service Members, Their Families & Overseas Citizens
1
The primary factors influencing registration and participation rates are age, education, employment status, gender, race and ethnicity, region, residential mobility and State-specific procedural issues.
Registration and Voting Participation Differences Between the Active Duty Military And Citizen Voting Age Population
FEDERAL VOTING ASSISTANCE PROGRAMVoting Assistance for Service Members, Their Families & Overseas Citizens
2
Modeling the registration and participation rates of voters with a variety of demographic and administrative factors has a history going back to the late 1970s. The primary factors influencing registration and participation rates are age, education, employment status, gender, race and ethnicity, region, residential mobilityiv and State-specific procedural issues.v Because the present analysis includes both UOCAVA and non-UOCAVA voters across multiple data sets, not all variables are present since some of these demographic variables were not assessed or were not asked of survey respondents in 2012. Specifically, State-specific procedural differences in UOCAVA voting policies were not included because they do not presently exist in a consistent format. Further, employment was used as a screening variable for the CVAP rather than as an analytic variable in our research because all ADM members are, by definition, employed by the Military. Further, respondents in both surveys who were not sure if they voted were excluded. More information on the specific variables used from each data set can be found in Appendix A.
In the analysis conducted here, the “Blinder-Oaxaca” decomposition, a statistical technique often applied in labor economics, was used to examine the effects of these factors that affect voting.vi This technique creates a hypothetical CVAP that is demographically similar to the ADM population, and uses that to determine the size and statistical significance of the differences between the ADM and adjusted CVAP registration and participation rates. In addition, the procedure allows differences in voting behavior to be attributed to various factors.
Data Sources
The data used in this research note come from two sources.vii The first data source is FVAP’s 2012 Post-Election Voting Survey of the ADM population. The second data source is the November 2012 Current Population Survey (CPS) Voting and Registration Supplement.viii
Results
Figure 1 shows how the adjusted ADM and CVAP registration and participation rates—those developed through statistical modeling—differ from the unadjusted rates (the original data before these variables were taken into account). Using statistical modeling to account for not just age and gender, but also employment, education, mobility, marital status, race, region and family status, results in a greater level of equivalency between the CVAP and ADM population than the previous methods could provide.
It should be noted that the unadjusted rates shown here differ slightly from those discussed in FVAP’s 2012 Post-Election Report to Congress. This is due to differences in the way voting participation variables were coded in the analyses, and differences in study samples. In particular, the CVAP used in this analysis was restricted to respondents who were employed. Further, respondents in both surveys who were not sure if they voted were excluded. More information on these differences can be found in Appendix A.
100%
90%
80%
70%
60%
50%
40%
30%
20%
10%
0%ADM ADM*CVAP CVAP*ADM (Adjusted
to CVAP)CVAP (Adjusted
to ADM)
79%
Prior FVAPWeighting Method
Newly ProposedModeling Method
80%
71%
84%86%
72%
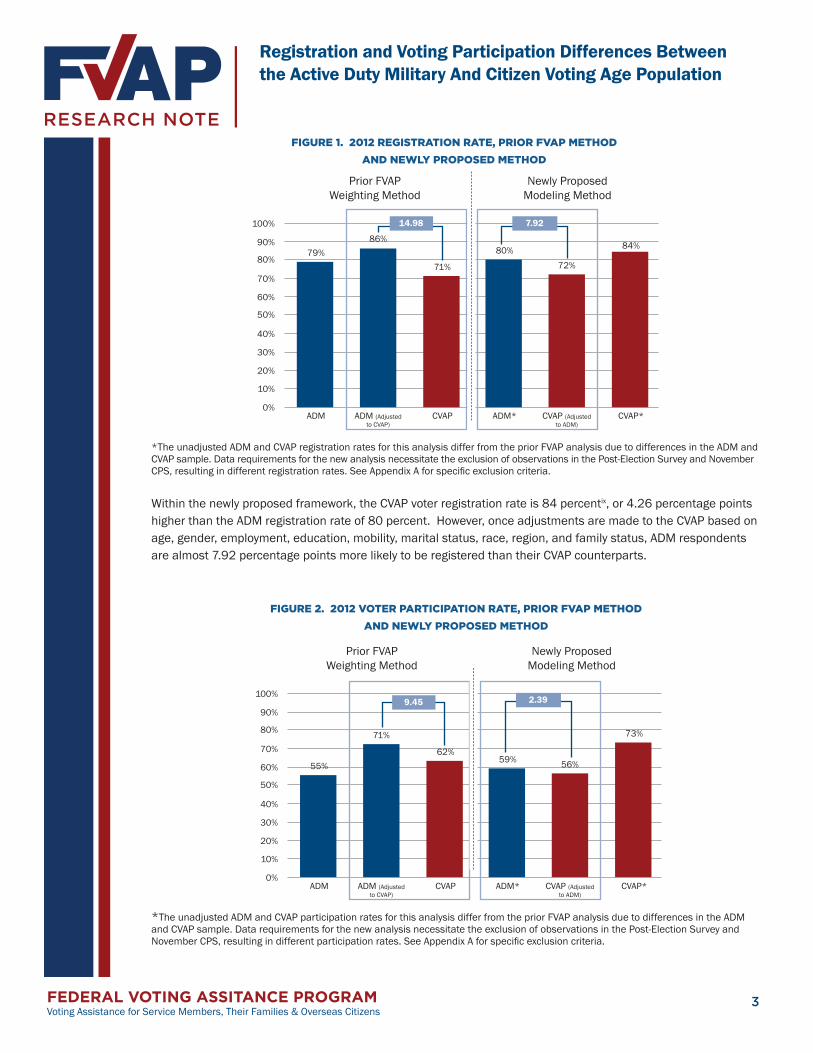
Figure 1. 2012 registration rate, Prior FVaP Method
and newly ProPosed Method
Registration and Voting Participation Differences Between the Active Duty Military And Citizen Voting Age Population
FEDERAL VOTING ASSITANCE PROGRAMVoting Assistance for Service Members, Their Families & Overseas Citizens
3
*The unadjusted ADM and CVAP registration rates for this analysis differ from the prior FVAP analysis due to differences in the ADM and CVAP sample. Data requirements for the new analysis necessitate the exclusion of observations in the Post-Election Survey and November CPS, resulting in different registration rates. See Appendix A for specific exclusion criteria.
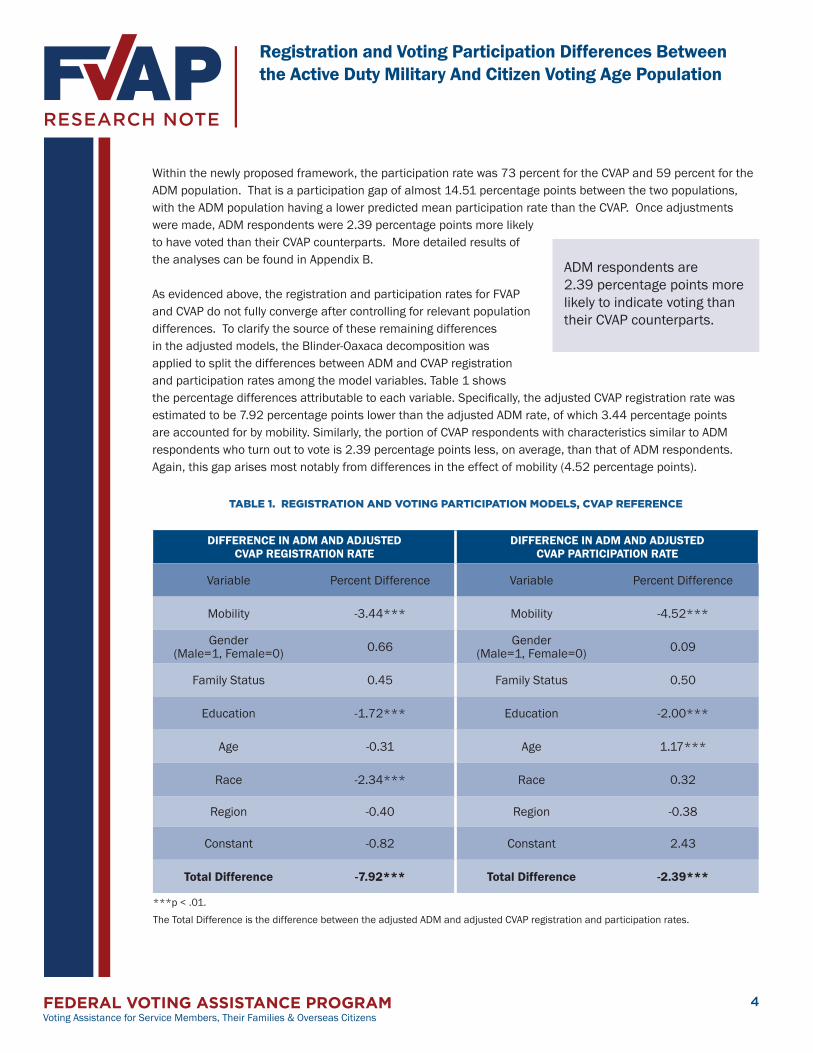
*The unadjusted ADM and CVAP participation rates for this analysis differ from the prior FVAP analysis due to differences in the ADM and CVAP sample. Data requirements for the new analysis necessitate the exclusion of observations in the Post-Election Survey and November CPS, resulting in different participation rates. See Appendix A for specific exclusion criteria.
Within the newly proposed framework, the CVAP voter registration rate is 84 percentix, or 4.26 percentage points higher than the ADM registration rate of 80 percent. However, once adjustments are made to the CVAP based on age, gender, employment, education, mobility, marital status, race, region, and family status, ADM respondents are almost 7.92 percentage points more likely to be registered than their CVAP counterparts.
Figure 2. 2012 Voter ParticiPation rate, Prior FVaP Method
and newly ProPosed Method
100%
90%
80%
70%
60%
50%
40%
30%
20%
10%
0%ADM ADM*CVAP CVAP*ADM (Adjusted
to CVAP)CVAP (Adjusted
to ADM)
55%
Prior FVAPWeighting Method
Newly Proposed Modeling Method
59%62%
73%71%
56%
2.399.45
7.9214.98
Registration and Voting Participation Differences Between the Active Duty Military And Citizen Voting Age Population
FEDERAL VOTING ASSISTANCE PROGRAMVoting Assistance for Service Members, Their Families & Overseas Citizens
4
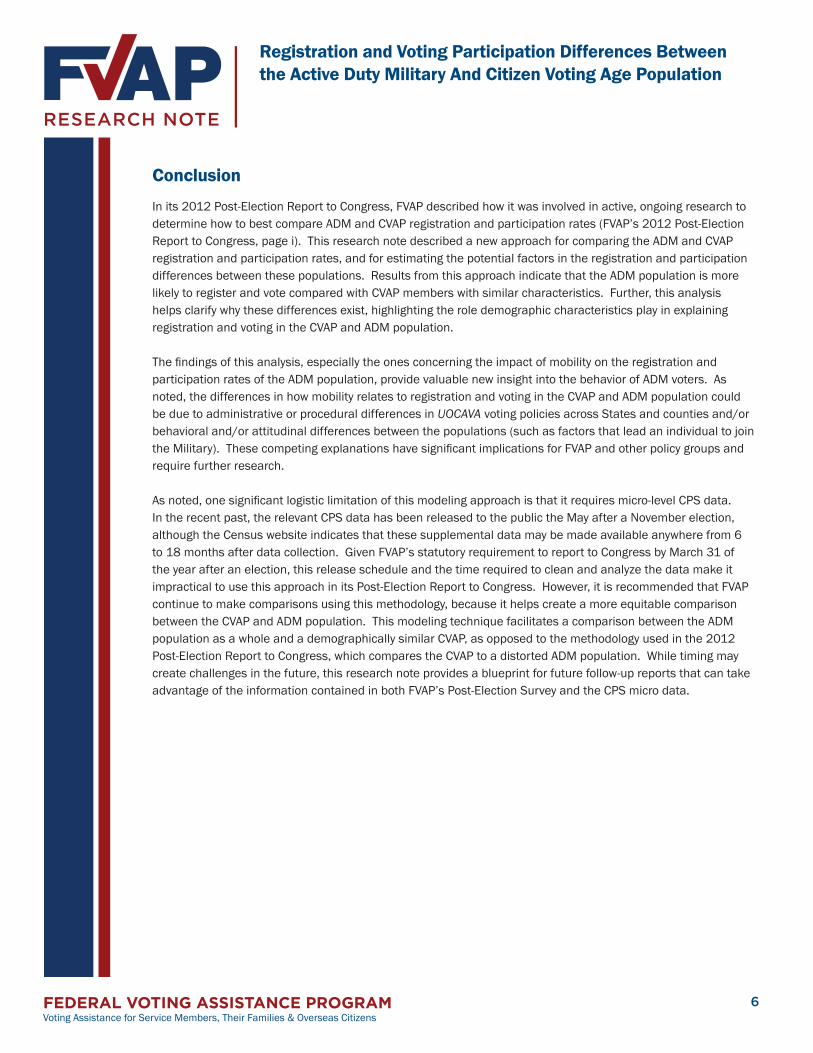
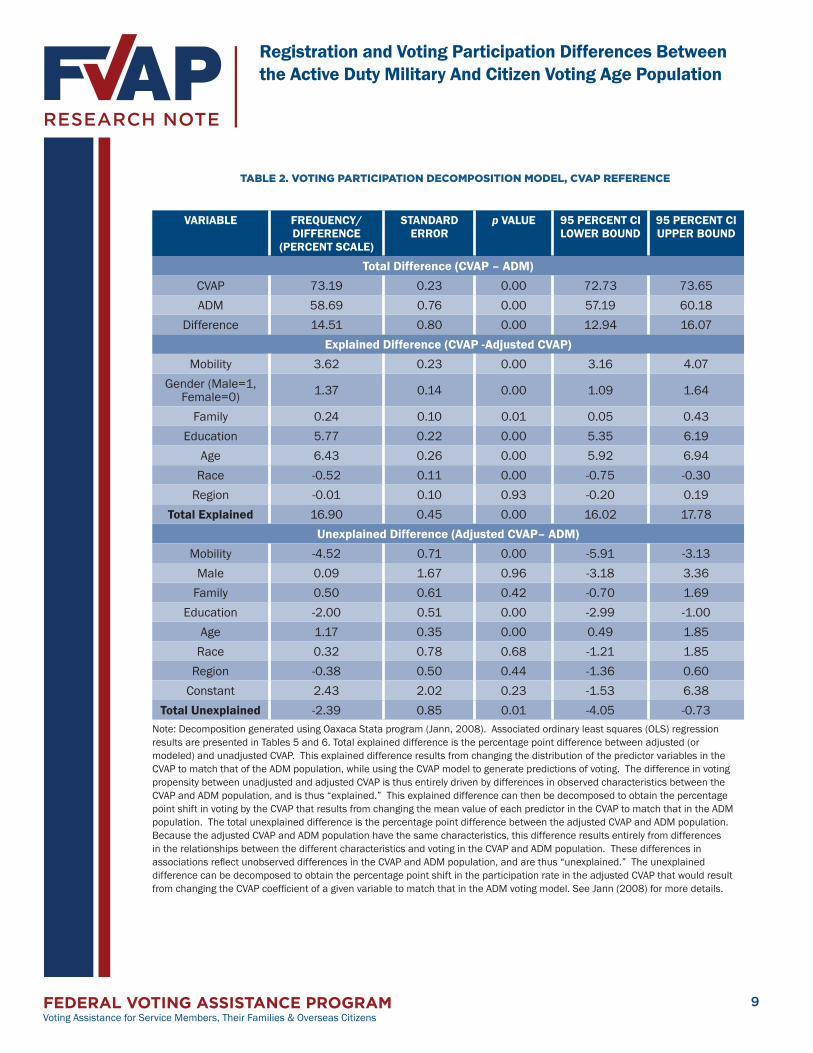
Within the newly proposed framework, the participation rate was 73 percent for the CVAP and 59 percent for the ADM population. That is a participation gap of almost 14.51 percentage points between the two populations, with the ADM population having a lower predicted mean participation rate than the CVAP. Once adjustments were made, ADM respondents were 2.39 percentage points more likely to have voted than their CVAP counterparts. More detailed results of the analyses can be found in Appendix B.
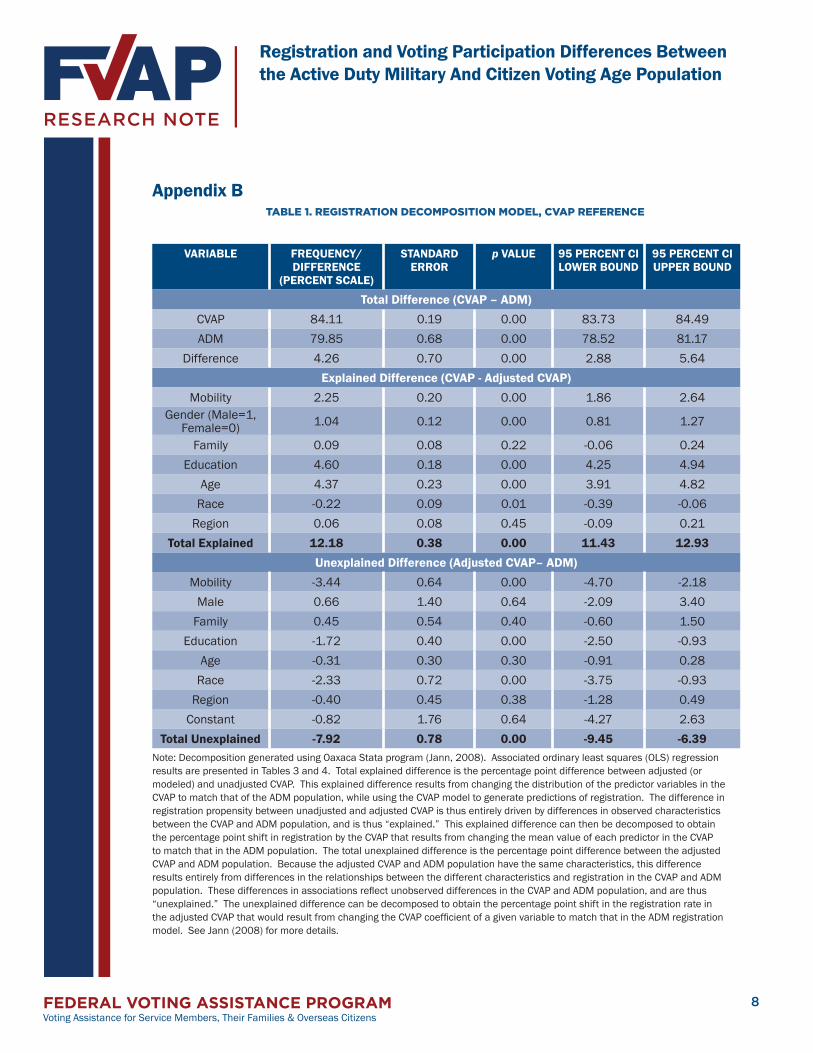
As evidenced above, the registration and participation rates for FVAP and CVAP do not fully converge after controlling for relevant population differences. To clarify the source of these remaining differences in the adjusted models, the Blinder-Oaxaca decomposition was applied to split the differences between ADM and CVAP registration and participation rates among the model variables. Table 1 shows the percentage differences attributable to each variable. Specifically, the adjusted CVAP registration rate was estimated to be 7.92 percentage points lower than the adjusted ADM rate, of which 3.44 percentage points are accounted for by mobility. Similarly, the portion of CVAP respondents with characteristics similar to ADM respondents who turn out to vote is 2.39 percentage points less, on average, than that of ADM respondents. Again, this gap arises most notably from differences in the effect of mobility (4.52 percentage points).
table 1. registration and Voting ParticiPation Models, cVaP reFerence
DIffeRenCe In ADM AnD ADjuSteD CVAP RegIStRAtIon RAte
DIffeRenCe In ADM AnD ADjuSteD CVAP PARtICIPAtIon RAte
Variable Percent Difference Variable Percent Difference
Mobility -3.44*** Mobility -4.52***
Gender (Male=1, Female=0) 0.66 Gender
(Male=1, Female=0) 0.09
Family Status 0.45 Family Status 0.50
Education -1.72*** Education -2.00***
Age -0.31 Age 1.17***
Race -2.34*** Race 0.32
Region -0.40 Region -0.38
Constant -0.82 Constant 2.43
total Difference -7.92*** total Difference -2.39***
***p < .01.
The Total Difference is the difference between the adjusted ADM and adjusted CVAP registration and participation rates.
ADM respondents are 2.39 percentage points more likely to indicate voting than their CVAP counterparts.

Registration and Voting Participation Differences Between the Active Duty Military And Citizen Voting Age Population
FEDERAL VOTING ASSISTANCE PROGRAMVoting Assistance for Service Members, Their Families & Overseas Citizens
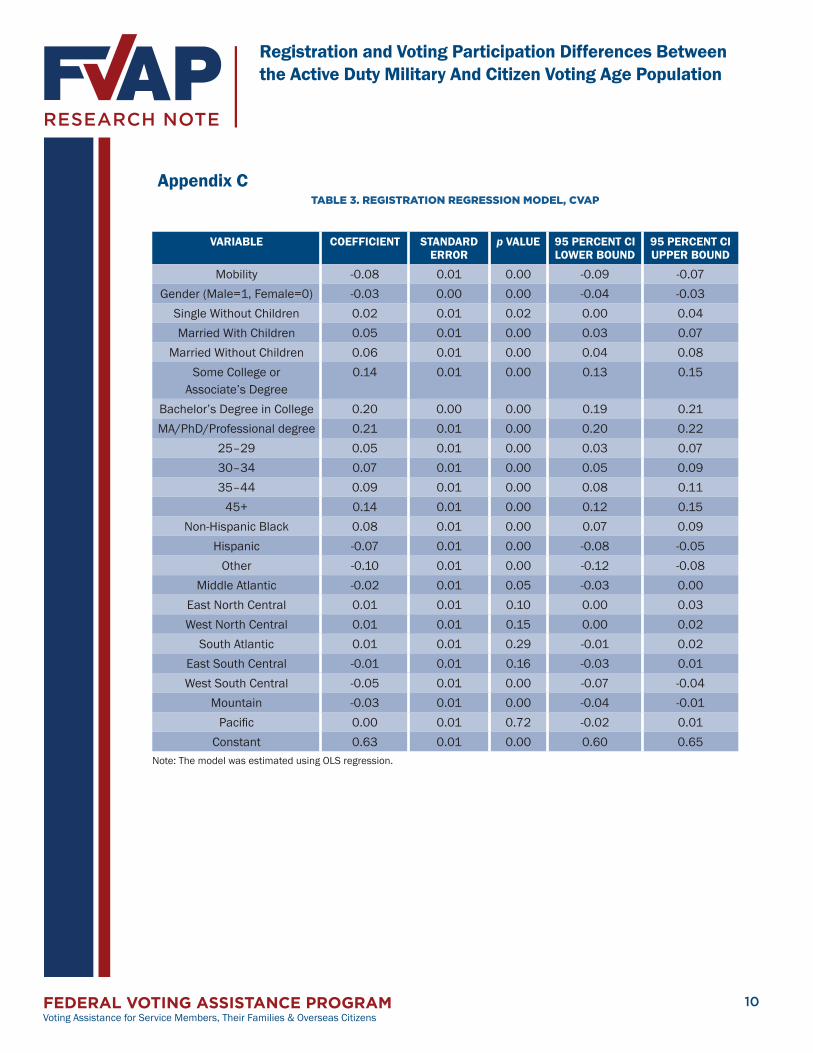
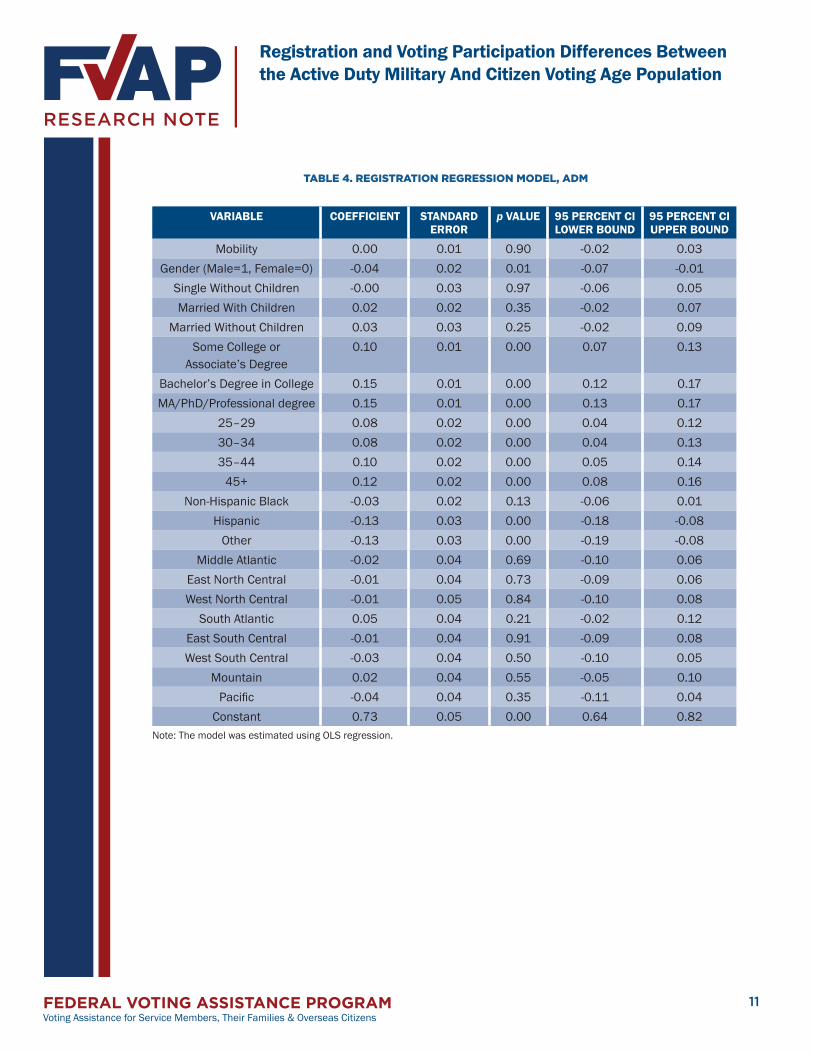
The difference in how these variables function in the CVAP and ADM population is detailed in the regression results provided in Appendix C. For example, in the CVAP, respondents who changed residences in the last 12 months were significantly less likely to register. By contrast, for the ADM population, changing duty station within the last 12 months had almost no association with registering to vote. These results help explain why even after controlling for many of the differences between the CVAP and the ADM population, the registration and participation rates are not equivalent.
There are multiple potential explanations for the difference in the relationship between mobility and registration/participation in the CVAP and ADM population. One explanation is that mobile ADM individuals have access to FVAP and DoD voting assistance resources, including the FVAP.gov website, Unit Voting Assistance Officers (UVAOs), and Installation Voter Assistance (IVA) Offices that are specifically intended to facilitate voting and registration for deployed ADM members. The CVAP has access to voting services in their jurisdictions, but those services may not be equivalent to FVAP’s voting assistance resources. Another explanation for the difference in the role of mobility is that the immobile CVAP members have likely registered to vote in the jurisdiction in which they live, lowering the opportunity costs to voting. By contrast, immobile ADM members may not have changed location recently, but may be on a long-term deployment far from their place of legal voting residence. Consequently, mobile and immobile ADM members may face similar obstacles in registration and voting, because they may both be far from their place of legal residence; this would result in mobile and immobile ADM members showing little difference in registration and participation probabilities.
Finally, it is also possible that the circumstances under which CVAP and ADM members move are different. Movement by civilians is likely to be largely voluntary, and there may be differences between mobile and immobile CVAP members in attitudes toward voting. By contrast movement in the ADM population is likely rather involuntary, so there may be few differences between ADM members who do and do not change duty stations with respect to characteristics that are related to voting. Determining which, if any, of these factors explain the difference in the relationship between mobility and registration/participation in the CVAP and ADMpopulations may be a fruitful direction for future research.
This analysis does have several limitations that should be kept in mind.
• First, both the FVAP and CVAP surveys rely on self-reports of voting behavior. Research in survey methodology and political behavior has shown that self-reports of participation in CVAP data are overreported; the same may be true of the ADM survey data, although this has not been systematically studied.
• Second, the ADM and CVAP data are derived from very different survey approaches. The sampling designs, the methods of respondent contact and response, the questionnaire, and other aspects of survey methodology are quite different between the two studies. These differences in design and methodology are not explicitly known, and are therefore not easily accounted for in an analysis such as this one.
• Third, this analysis requires micro-level CPS data that is likely not released in time for FVAP’s congressionally mandated annual report.
5
Registration and Voting Participation Differences Between the Active Duty Military And Citizen Voting Age Population
FEDERAL VOTING ASSISTANCE PROGRAMVoting Assistance for Service Members, Their Families & Overseas Citizens
Conclusion
In its 2012 Post-Election Report to Congress, FVAP described how it was involved in active, ongoing research to determine how to best compare ADM and CVAP registration and participation rates (FVAP’s 2012 Post-Election Report to Congress, page i). This research note described a new approach for comparing the ADM and CVAP registration and participation rates, and for estimating the potential factors in the registration and participation differences between these populations. Results from this approach indicate that the ADM population is more likely to register and vote compared with CVAP members with similar characteristics. Further, this analysis helps clarify why these differences exist, highlighting the role demographic characteristics play in explaining registration and voting in the CVAP and ADM population.
The findings of this analysis, especially the ones concerning the impact of mobility on the registration and participation rates of the ADM population, provide valuable new insight into the behavior of ADM voters. As noted, the differences in how mobility relates to registration and voting in the CVAP and ADM population could be due to administrative or procedural differences in UOCAVA voting policies across States and counties and/or behavioral and/or attitudinal differences between the populations (such as factors that lead an individual to join the Military). These competing explanations have significant implications for FVAP and other policy groups and require further research.
As noted, one significant logistic limitation of this modeling approach is that it requires micro-level CPS data. In the recent past, the relevant CPS data has been released to the public the May after a November election, although the Census website indicates that these supplemental data may be made available anywhere from 6 to 18 months after data collection. Given FVAP’s statutory requirement to report to Congress by March 31 of the year after an election, this release schedule and the time required to clean and analyze the data make it impractical to use this approach in its Post-Election Report to Congress. However, it is recommended that FVAP continue to make comparisons using this methodology, because it helps create a more equitable comparison between the CVAP and ADM population. This modeling technique facilitates a comparison between the ADM population as a whole and a demographically similar CVAP, as opposed to the methodology used in the 2012 Post-Election Report to Congress, which compares the CVAP to a distorted ADM population. While timing may create challenges in the future, this research note provides a blueprint for future follow-up reports that can take advantage of the information contained in both FVAP’s Post-Election Survey and the CPS micro data.
6
Registration and Voting Participation Differences Between the Active Duty Military And Citizen Voting Age Population
FEDERAL VOTING ASSISTANCE PROGRAMVoting Assistance for Service Members, Their Families & Overseas Citizens
Appendix A
The specific variables used in the model for the CVAP are listed below. • VOTE_recode (1 if stated voted in 2012, 0 if did not vote)• REGVOTE_recode (1 if voted in 2012 or didn’t vote but stated registration, 0 if not registered)• MALE (1 for males, 0 for females)• CHANGERESIDENCE_recode (1 if changed residential address in past year, 0 if in residential address 1
year or longer)• FAMSTAT (1 if single with children, 2 if single without children, 3 if married with children, 4 if married
without children)• CEDUC (1 if less than high school or no education, 2 if some college or associate’s degree, 3 if bachelor’s
degree in college, 4 if MA/PhD/professional degree)• AGE_5 (1 is 18–24, 2 is 25–29, 3 is 30–34, 4 is 35–44, 5 is older than 45)• EMPLOYED (1 if employed and working, 0 if unemployed or not in labor force)• CRACE_ETH (1 for non-minority, 2 for non-Hispanic Black, 3 for Hispanic, 4 for all others)• REGION
Similar variables were included for the ADM; the primary difference between the CVAP and ADM variables was the measurement of mobility. In the ADM, “mobility” indicated if the individual had been redeployed in the past year or not.
In the analysis used in FVAP’s 2012 Report to Congress, respondents who reported being unsure about voting were included with non-voters; in this analysis, such respondents were not included in the samples for both the CVAP and ADM population. This was done because the theory used to justify the included covariates addresses the distinctions between voters and non-voters, but has little to say about the distinction between known voters and those who are unsure about whether they voted.
In addition, because employment is an important covariate for understanding political participation and all ADM members are, by definition, employed in the Military, CVAP respondents who were not employed were excluded from the model.
Finally, for both ADM and CVAP, the sample was restricted to those respondents who had data for all relevant variables. Specifically, a total of 45,907 (53 percent) and 901 observations (8.5 percent) were dropped from the CPS and ADM samples respectively.
7
Registration and Voting Participation Differences Between the Active Duty Military And Citizen Voting Age Population
FEDERAL VOTING ASSISTANCE PROGRAMVoting Assistance for Service Members, Their Families & Overseas Citizens
Appendix Btable 1. registration decoMPosition Model, cVaP reFerence
VARIABle fRequenCy/ DIffeRenCe
(PeRCent SCAle)
StAnDARD eRRoR
p VAlue 95 PeRCent CI loweR BounD
95 PeRCent CI uPPeR BounD
total Difference (CVAP – ADM)CVAP 84.11 0.19 0.00 83.73 84.49ADM 79.85 0.68 0.00 78.52 81.17
Difference 4.26 0.70 0.00 2.88 5.64explained Difference (CVAP - Adjusted CVAP)
Mobility 2.25 0.20 0.00 1.86 2.64Gender (Male=1,
Female=0) 1.04 0.12 0.00 0.81 1.27
Family 0.09 0.08 0.22 -0.06 0.24Education 4.60 0.18 0.00 4.25 4.94
Age 4.37 0.23 0.00 3.91 4.82Race -0.22 0.09 0.01 -0.39 -0.06
Region 0.06 0.08 0.45 -0.09 0.21total explained 12.18 0.38 0.00 11.43 12.93
unexplained Difference (Adjusted CVAP– ADM)Mobility -3.44 0.64 0.00 -4.70 -2.18
Male 0.66 1.40 0.64 -2.09 3.40Family 0.45 0.54 0.40 -0.60 1.50
Education -1.72 0.40 0.00 -2.50 -0.93Age -0.31 0.30 0.30 -0.91 0.28
Race -2.33 0.72 0.00 -3.75 -0.93Region -0.40 0.45 0.38 -1.28 0.49
Constant -0.82 1.76 0.64 -4.27 2.63total unexplained -7.92 0.78 0.00 -9.45 -6.39
Note: Decomposition generated using Oaxaca Stata program (Jann, 2008). Associated ordinary least squares (OLS) regression results are presented in Tables 3 and 4. Total explained difference is the percentage point difference between adjusted (or modeled) and unadjusted CVAP. This explained difference results from changing the distribution of the predictor variables in the CVAP to match that of the ADM population, while using the CVAP model to generate predictions of registration. The difference in registration propensity between unadjusted and adjusted CVAP is thus entirely driven by differences in observed characteristics between the CVAP and ADM population, and is thus “explained.” This explained difference can then be decomposed to obtain the percentage point shift in registration by the CVAP that results from changing the mean value of each predictor in the CVAP to match that in the ADM population. The total unexplained difference is the percentage point difference between the adjusted CVAP and ADM population. Because the adjusted CVAP and ADM population have the same characteristics, this difference results entirely from differences in the relationships between the different characteristics and registration in the CVAP and ADM population. These differences in associations reflect unobserved differences in the CVAP and ADM population, and are thus “unexplained.” The unexplained difference can be decomposed to obtain the percentage point shift in the registration rate in the adjusted CVAP that would result from changing the CVAP coefficient of a given variable to match that in the ADM registration model. See Jann (2008) for more details.
8
Registration and Voting Participation Differences Between the Active Duty Military And Citizen Voting Age Population
FEDERAL VOTING ASSISTANCE PROGRAMVoting Assistance for Service Members, Their Families & Overseas Citizens
table 2. Voting ParticiPation decoMPosition Model, cVaP reFerence
VARIABle fRequenCy/ DIffeRenCe
(PeRCent SCAle)
StAnDARD eRRoR
p VAlue 95 PeRCent CI loweR BounD
95 PeRCent CI uPPeR BounD
total Difference (CVAP – ADM)CVAP 73.19 0.23 0.00 72.73 73.65ADM 58.69 0.76 0.00 57.19 60.18
Difference 14.51 0.80 0.00 12.94 16.07explained Difference (CVAP -Adjusted CVAP)
Mobility 3.62 0.23 0.00 3.16 4.07Gender (Male=1,
Female=0) 1.37 0.14 0.00 1.09 1.64
Family 0.24 0.10 0.01 0.05 0.43Education 5.77 0.22 0.00 5.35 6.19
Age 6.43 0.26 0.00 5.92 6.94Race -0.52 0.11 0.00 -0.75 -0.30
Region -0.01 0.10 0.93 -0.20 0.19total explained 16.90 0.45 0.00 16.02 17.78
unexplained Difference (Adjusted CVAP– ADM)Mobility -4.52 0.71 0.00 -5.91 -3.13
Male 0.09 1.67 0.96 -3.18 3.36Family 0.50 0.61 0.42 -0.70 1.69
Education -2.00 0.51 0.00 -2.99 -1.00Age 1.17 0.35 0.00 0.49 1.85
Race 0.32 0.78 0.68 -1.21 1.85Region -0.38 0.50 0.44 -1.36 0.60
Constant 2.43 2.02 0.23 -1.53 6.38total unexplained -2.39 0.85 0.01 -4.05 -0.73
Note: Decomposition generated using Oaxaca Stata program (Jann, 2008). Associated ordinary least squares (OLS) regression results are presented in Tables 5 and 6. Total explained difference is the percentage point difference between adjusted (or modeled) and unadjusted CVAP. This explained difference results from changing the distribution of the predictor variables in the CVAP to match that of the ADM population, while using the CVAP model to generate predictions of voting. The difference in voting propensity between unadjusted and adjusted CVAP is thus entirely driven by differences in observed characteristics between the CVAP and ADM population, and is thus “explained.” This explained difference can then be decomposed to obtain the percentage point shift in voting by the CVAP that results from changing the mean value of each predictor in the CVAP to match that in the ADM population. The total unexplained difference is the percentage point difference between the adjusted CVAP and ADM population. Because the adjusted CVAP and ADM population have the same characteristics, this difference results entirely from differences in the relationships between the different characteristics and voting in the CVAP and ADM population. These differences in associations reflect unobserved differences in the CVAP and ADM population, and are thus “unexplained.” The unexplained difference can be decomposed to obtain the percentage point shift in the participation rate in the adjusted CVAP that would result from changing the CVAP coefficient of a given variable to match that in the ADM voting model. See Jann (2008) for more details.
9
Registration and Voting Participation Differences Between the Active Duty Military And Citizen Voting Age Population
FEDERAL VOTING ASSISTANCE PROGRAMVoting Assistance for Service Members, Their Families & Overseas Citizens
Appendix Ctable 3. registration regression Model, cVaP
VARIABle CoeffICIent StAnDARD eRRoR
p VAlue 95 PeRCent CI loweR BounD
95 PeRCent CI uPPeR BounD
Mobility -0.08 0.01 0.00 -0.09 -0.07Gender (Male=1, Female=0) -0.03 0.00 0.00 -0.04 -0.03
Single Without Children 0.02 0.01 0.02 0.00 0.04Married With Children 0.05 0.01 0.00 0.03 0.07
Married Without Children 0.06 0.01 0.00 0.04 0.08Some College or
Associate’s Degree0.14 0.01 0.00 0.13 0.15
Bachelor’s Degree in College 0.20 0.00 0.00 0.19 0.21MA/PhD/Professional degree 0.21 0.01 0.00 0.20 0.22
25–29 0.05 0.01 0.00 0.03 0.0730–34 0.07 0.01 0.00 0.05 0.0935–44 0.09 0.01 0.00 0.08 0.11
45+ 0.14 0.01 0.00 0.12 0.15Non-Hispanic Black 0.08 0.01 0.00 0.07 0.09
Hispanic -0.07 0.01 0.00 -0.08 -0.05Other -0.10 0.01 0.00 -0.12 -0.08
Middle Atlantic -0.02 0.01 0.05 -0.03 0.00East North Central 0.01 0.01 0.10 0.00 0.03West North Central 0.01 0.01 0.15 0.00 0.02
South Atlantic 0.01 0.01 0.29 -0.01 0.02East South Central -0.01 0.01 0.16 -0.03 0.01West South Central -0.05 0.01 0.00 -0.07 -0.04
Mountain -0.03 0.01 0.00 -0.04 -0.01Pacific 0.00 0.01 0.72 -0.02 0.01
Constant 0.63 0.01 0.00 0.60 0.65Note: The model was estimated using OLS regression.
10
Registration and Voting Participation Differences Between the Active Duty Military And Citizen Voting Age Population
FEDERAL VOTING ASSISTANCE PROGRAMVoting Assistance for Service Members, Their Families & Overseas Citizens
table 4. registration regression Model, adM
VARIABle CoeffICIent StAnDARD eRRoR
p VAlue 95 PeRCent CI loweR BounD
95 PeRCent CI uPPeR BounD
Mobility 0.00 0.01 0.90 -0.02 0.03Gender (Male=1, Female=0) -0.04 0.02 0.01 -0.07 -0.01
Single Without Children -0.00 0.03 0.97 -0.06 0.05Married With Children 0.02 0.02 0.35 -0.02 0.07
Married Without Children 0.03 0.03 0.25 -0.02 0.09Some College or
Associate’s Degree0.10 0.01 0.00 0.07 0.13
Bachelor’s Degree in College 0.15 0.01 0.00 0.12 0.17MA/PhD/Professional degree 0.15 0.01 0.00 0.13 0.17
25–29 0.08 0.02 0.00 0.04 0.1230–34 0.08 0.02 0.00 0.04 0.1335–44 0.10 0.02 0.00 0.05 0.14
45+ 0.12 0.02 0.00 0.08 0.16Non-Hispanic Black -0.03 0.02 0.13 -0.06 0.01
Hispanic -0.13 0.03 0.00 -0.18 -0.08Other -0.13 0.03 0.00 -0.19 -0.08
Middle Atlantic -0.02 0.04 0.69 -0.10 0.06East North Central -0.01 0.04 0.73 -0.09 0.06West North Central -0.01 0.05 0.84 -0.10 0.08
South Atlantic 0.05 0.04 0.21 -0.02 0.12East South Central -0.01 0.04 0.91 -0.09 0.08West South Central -0.03 0.04 0.50 -0.10 0.05
Mountain 0.02 0.04 0.55 -0.05 0.10Pacific -0.04 0.04 0.35 -0.11 0.04
Constant 0.73 0.05 0.00 0.64 0.82Note: The model was estimated using OLS regression.
11

Registration and Voting Participation Differences Between the Active Duty Military And Citizen Voting Age Population
FEDERAL VOTING ASSISTANCE PROGRAMVoting Assistance for Service Members, Their Families & Overseas Citizens
table 5. Voting ParticiPation regression Model, cVaP
VARIABle CoeffICIent StAnDARD eRRoR
p VAlue 95 PeRCent CI loweR BounD
95 PeRCent CI uPPeR BounD
Mobility -0.13 0.01 0.00 -0.14 -0.11Gender (Male=1, Female=0) -0.04 0.00 0.00 -0.05 -0.03
Single Without Children 0.04 0.01 0.00 0.02 0.06Married With Children 0.08 0.01 0.00 0.06 0.09
Married Without Children 0.11 0.01 0.00 0.09 0.13Some College or
Associate’s Degree0.17 0.01 0.00 0.16 0.18
Bachelor’s Degree in College 0.27 0.01 0.00 0.25 0.28MA/PhD/Professional degree 0.29 0.01 0.00 0.28 0.31
25–29 0.03 0.01 0.00 0.01 0.0530–34 0.07 0.01 0.00 0.04 0.0935–44 0.11 0.01 0.00 0.09 0.13
45+ 0.18 0.01 0.00 0.17 0.20Non-Hispanic Black 0.14 0.01 0.00 0.12 0.15
Hispanic -0.06 0.01 0.00 -0.08 -0.05Other -0.12 0.01 0.00 -0.15 -0.10
Middle Atlantic -0.04 0.01 0.00 -0.05 -0.02East North Central 0.00 0.01 0.98 -0.02 0.02West North Central 0.00 0.01 0.79 -0.02 0.02
South Atlantic 0.00 0.01 0.72 -0.01 0.02East South Central -0.05 0.01 0.00 -0.07 -0.02West South Central -0.10 0.01 0.00 -0.12 -0.08
Mountain -0.02 0.01 0.11 -0.03 0.00Pacific -0.01 0.01 0.57 -0.02 0.01
Constant 0.45 0.01 0.00 0.43 0.48Note: The model was estimated using OLS regression.
12

Registration and Voting Participation Differences Between the Active Duty Military And Citizen Voting Age Population
FEDERAL VOTING ASSISTANCE PROGRAMVoting Assistance for Service Members, Their Families & Overseas Citizens
table 6. Voting ParticiPation regression Model, adM
VARIABle CoeffICIent StAnDARD eRRoR
p VAlue 95 PeRCent CI loweR BounD
95 PeRCent CI uPPeR BounD
Mobility -0.02 0.01 0.16 -0.05 0.01Gender (Male=1, Female=0) -0.04 0.02 0.02 -0.08 -0.01
Single Without Children 0.02 0.03 0.60 -0.04 0.08Married With Children 0.05 0.03 0.07 -0.00 0.10
Married Without Children 0.08 0.03 0.01 0.02 0.14Some College or
Associate’s Degree0.12 0.02 0.00 0.09 0.16
Bachelor’s Degree in College 0.21 0.02 0.00 0.17 0.24MA/PhD/Professional degree 0.23 0.02 0.00 0.20 0.26
25–29 0.13 0.02 0.00 0.09 0.1830–34 0.17 0.03 0.00 0.12 0.2135–44 0.22 0.02 0.00 0.17 0.27
45+ 0.29 0.03 0.00 0.24 0.35Non-Hispanic Black 0.05 0.02 0.02 0.01 0.09
Hispanic -0.08 0.03 0.00 -0.13 -0.03Other -0.04 0.03 0.14 -0.10 0.01
Middle Atlantic -0.09 0.05 0.06 -0.18 0.00East North Central -0.02 0.04 0.72 -0.10 0.07West North Central 0.01 0.05 0.86 -0.09 0.11
South Atlantic 0.02 0.04 0.53 -0.05 0.10East South Central -0.03 0.05 0.59 -0.12 0.07West South Central -0.06 0.04 0.15 -0.14 0.02
Mountain -0.01 0.05 0.75 -0.10 0.07Pacific -0.03 0.04 0.50 -0.11 0.05
Constant 0.41 0.05 0.00 0.31 0.51Note: The model was estimated using OLS regression.
13
Registration and Voting Participation Differences Between the Active Duty Military And Citizen Voting Age Population
FEDERAL VOTING ASSISTANCE PROGRAMVoting Assistance for Service Members, Their Families & Overseas Citizens
notes
i Voters covered under the Uniformed and Overseas Citizens Absentee Voting Act (UOCAVA) include U.S. citizens who are active members of the Uniformed Services, the Merchant Marine, and the commissioned corps of the Public Health Service and the National Oceanic and Atmospheric Administration, their family members, and U.S. citizens residing outside the United States.
ii In this analysis, “voter participation” is used to refer specifically to voter turnout.iii Wolfinger, R. E., & Rosenstone, S. J. (1980). Who votes? (Vol. 22). Yale University Press. Leighley, J. E., &
Nagler, J. (2013). Who votes now?: Demographics, issues, inequality, and turnout in the United States. Princeton University Press.
iv There are important differences in how mobility is measured in both surveys. In the ADM survey, mobility was measured by whether the individual experienced a change in deployment. In the CVAP survey, it was measured by whether there was a change in residential address. These are the best measures currently available for mobility in the two surveys, but the observed group differences could be artifacts of using different measures in each group. However, it is important to note that for both registration and voting, mobility was a relatively significant difference in both the explained and unexplained components of the models.
v Wolfinger, R. E., & Rosenstone, S. J. (1980). Who votes? (Vol. 22). Yale University Press.vi The specific methodology is commonly referred to as the Blinder-Oaxaca decomposition, a methodology widely
used in labor economics to study group differences in a variety of economic settings—most commonly, differences in wage rates. For more information, see the following: Oaxaca, R. (1973). Male-female wage differentials in urban labor markets. International Economic Review, 14(3), 693–709. Blinder, A. S. (1973). Wage discrimination: Reduced form and structural estimates. The Journal of Human Resources, 8(4), 436–455. A discussion of the decomposition methods incorporated into the statistical framework used in this analysis can be found in the following: Jann, B. (2008). The Blinder-Oaxaca decomposition for linear regression models. The Stata Journal, 8(4), 453–479. Retrieved from http://www.stata-journal.com/sjpdf.html?articlenum=st0151. Jann’s procedure is contained in the STATA procedure oaxaca.
vii This analysis used a version of the 2012 FVAP ADM Post-Election Survey data set obtained from the Department of Defense. Details on FVAP’s 2012 Post-Election Voting Survey can be found at http://www.fvap.gov/info/reports-surveys.
viii More information on the CPS and the Voting and Registration Supplement can be found at http://www.census.gov/hhes/www/socdemo/voting/. The version of the 2012 CPS used in this analysis was provided by Unicon Research Corporation, which provides the various CPS products on standard media and in easy-to-access formats. See www.unicon.com for more details.
ix The difference between this “unadjusted” CVAP score of 84 percent and that reported by CPS and FVAP in the 2012 report to Congress is largely due to the removal of individuals not identified as employed, which was responsible for a loss of 29,932 total respondents.
14