Regional variation in the particulate organic carbon to nitrogen ratio ...
9
Regional variation in the particulate organic carbon to nitrogen ratio in the surface ocean A. C. Martiny, 1,2 Jasper A. Vrugt, 1,3 Francois W. Primeau, 1 and Michael W. Lomas 4 Received 22 March 2013; revised 25 June 2013; accepted 30 June 2013. [1] The concept of constant elemental ratios in plankton communities—the Redfield ratio —is of central importance to ocean biogeochemistry. Recently, several studies have demonstrated regional differences in the plankton C:P and N:P ratio. However, less is known about potential systematic variations in the C:N ratio. Here we present an analysis of the particulate organic carbon to nitrogen ratio of 40,482 globally distributed samples from the upper 200 m of the ocean water column. Particulate organic carbon and nitrogen concentrations are highly correlated (R 2 = 0.86) with a median value of 6.5. Using an artificial neural network analysis, we find regional variations in the C:N ratio linked to differences in environmental conditions. The ratio is lower in upper latitude cold water as well as upwelling regions in comparison to the warm oligotrophic gyres. We find substantial differences between ocean gyres that might be associated with differences in the nutrient supply ratio. Using cell sorting, we also quantified the C:N ratio of Prochlorococcus, Synechococcus, and picoeukaryotic field populations. The analysis demonstrates that picophytoplankton lineages exhibit a significantly higher ratio than the bulk particulate material but are only marginally significantly different from each other. Thus, the dominance of picophytoplankton in ocean gyres may contribute to the elevated ratios observed in these regions. Overall, the median C:N ratio derived from 40,482 samples is close to the canonical Redfield ratio, but significant regional deviations from this value are observed. These differences could be important for marine biogeochemistry and the regional coupling between the ocean's carbon and nitrogen cycles. Citation: Martiny, A. C., J. A. Vrugt, F. W. Primeau, and M. W. Lomas (2013), Regional variation in the particulate organic carbon to nitrogen ratio in the surface ocean, Global Biogeochem. Cycles, 27, doi:10.1002/gbc.20061. 1. Introduction [2] Nearly 80 years ago, Alfred Redfield observed that ocean surface plankton and deep dissolved nutrient concen- trations shared similar C:N:P ratios [Redfield, 1934]. This “Redfield ratio” has later become a central tenet for ocean biogeochemistry and underlies our understanding of the linkages between the nutrient cycles, conditions for nutrient limitation, extent of nitrogen fixation or loss, and other important oceanographic processes [Deutsch and Weber, 2012; Mills and Arrigo, 2010]. Recently, several studies have demonstrated that the N:P and C:P ratios vary in different ocean regions [Martiny et al., 2013; Weber and Deutsch, 2010]. This variation in N:P and C:P is attributed to regional variations in environmental conditions and plankton biodi- versity. Despite the importance of elemental ratios in many biogeochemistry and modeling studies, not much is known about systematic regional variations in the C:N ratio. [3] The particulate organic carbon to nitrogen ratio (referred to as the C:N ratio) is important for linking the carbon and nitrogen cycles [Oschlies et al., 2008; Schneider et al., 2004; Tagliabue et al., 2011] as well as trophic processing of material [Sterner et al., 1992] and is a basic assumption for many concepts in ocean biogeochemistry like the f-ratio and new production [Dugdale, 1967]. Several reviews have reported variations in the C:N ratio but with means above the “canonical Redfield ratio” of 6.63 [Fleming, 1940; Geider and La Roche, 2002; Schneider et al., 2003; Sterner et al., 2008]. Part of this variation can be linked to an elevated C:N ratio in the deep ocean compared to surface water—possibly due to a preferential remineralization of organic N over C [Schneider et al., 2003]. Moreover, some variation in the C: N ratio has been observed in regional studies. For example, Körtzinger and colleagues observed a ratio ~5 in eutrophic compared to ~7 in nitrogen depleted regions along a North Atlantic transect [Kortzinger et al., 2001]. In contrast, others found little regional variation [Copin-Montegut and Copin- Montegut, 1983]. Additional supporting information may be found in the online version of this article. 1 Department of Earth System Science, University of California, Irvine, California, USA. 2 Department of Ecology and Evolutionary Biology, University of California, Irvine, California, USA. 3 Department of Civil and Environmental Engineering, University of California, Irvine, California, USA. 4 Bigelow Laboratory for Ocean Sciences, East Boothbay, Maine, USA. Corresponding author: A. C. Martiny, Department of Earth System Science, University of California, 3208 Croul Hall, Irvine, CA 92697, USA. ([email protected]) ©2013. American Geophysical Union. All Rights Reserved. 0886-6236/13/10.1002/gbc.20061 1 GLOBAL BIOGEOCHEMICAL CYCLES, VOL. 27, 1–9, doi:10.1002/gbc.20061, 2013
Transcript of Regional variation in the particulate organic carbon to nitrogen ratio ...
Regional variation in the particulate organic carbon to nitrogenratio in the surface ocean
A. C. Martiny,1,2 Jasper A. Vrugt,1,3 Francois W. Primeau,1 and Michael W. Lomas4
Received 22 March 2013; revised 25 June 2013; accepted 30 June 2013.
[1] The concept of constant elemental ratios in plankton communities—the Redfield ratio—is of central importance to ocean biogeochemistry. Recently, several studies havedemonstrated regional differences in the plankton C:P and N:P ratio. However, less isknown about potential systematic variations in the C:N ratio. Here we present an analysisof the particulate organic carbon to nitrogen ratio of 40,482 globally distributed samplesfrom the upper 200m of the ocean water column. Particulate organic carbon and nitrogenconcentrations are highly correlated (R2 = 0.86) with a median value of 6.5. Using anartificial neural network analysis, we find regional variations in the C:N ratio linked todifferences in environmental conditions. The ratio is lower in upper latitude cold water aswell as upwelling regions in comparison to the warm oligotrophic gyres. We findsubstantial differences between ocean gyres that might be associated with differences inthe nutrient supply ratio. Using cell sorting, we also quantified the C:N ratio ofProchlorococcus, Synechococcus, and picoeukaryotic field populations. The analysisdemonstrates that picophytoplankton lineages exhibit a significantly higher ratio than thebulk particulate material but are only marginally significantly different from each other.Thus, the dominance of picophytoplankton in ocean gyres may contribute to the elevatedratios observed in these regions. Overall, the median C:N ratio derived from 40,482samples is close to the canonical Redfield ratio, but significant regional deviations fromthis value are observed. These differences could be important for marine biogeochemistryand the regional coupling between the ocean's carbon and nitrogen cycles.
Citation: Martiny, A. C., J. A. Vrugt, F. W. Primeau, and M. W. Lomas (2013), Regional variation in the particulateorganic carbon to nitrogen ratio in the surface ocean, Global Biogeochem. Cycles, 27, doi:10.1002/gbc.20061.
1. Introduction
[2] Nearly 80 years ago, Alfred Redfield observed thatocean surface plankton and deep dissolved nutrient concen-trations shared similar C:N:P ratios [Redfield, 1934]. This“Redfield ratio” has later become a central tenet for oceanbiogeochemistry and underlies our understanding of thelinkages between the nutrient cycles, conditions for nutrientlimitation, extent of nitrogen fixation or loss, and otherimportant oceanographic processes [Deutsch and Weber,2012;Mills and Arrigo, 2010]. Recently, several studies havedemonstrated that the N:P and C:P ratios vary in different
ocean regions [Martiny et al., 2013; Weber and Deutsch,2010]. This variation in N:P and C:P is attributed to regionalvariations in environmental conditions and plankton biodi-versity. Despite the importance of elemental ratios in manybiogeochemistry and modeling studies, not much is knownabout systematic regional variations in the C:N ratio.[3] The particulate organic carbon to nitrogen ratio
(referred to as the C:N ratio) is important for linking the carbonand nitrogen cycles [Oschlies et al., 2008; Schneider et al.,2004; Tagliabue et al., 2011] as well as trophic processingof material [Sterner et al., 1992] and is a basic assumptionfor many concepts in ocean biogeochemistry like the f-ratioand new production [Dugdale, 1967]. Several reviews havereported variations in the C:N ratio but with means above the“canonical Redfield ratio” of 6.63 [Fleming, 1940; Geiderand La Roche, 2002; Schneider et al., 2003; Sterner et al.,2008]. Part of this variation can be linked to an elevated C:Nratio in the deep ocean compared to surface water—possiblydue to a preferential remineralization of organic N over C[Schneider et al., 2003]. Moreover, some variation in the C:N ratio has been observed in regional studies. For example,Körtzinger and colleagues observed a ratio ~5 in eutrophiccompared to ~7 in nitrogen depleted regions along a NorthAtlantic transect [Kortzinger et al., 2001]. In contrast, othersfound little regional variation [Copin-Montegut and Copin-Montegut, 1983].
Additional supporting information may be found in the online version ofthis article.
1Department of Earth System Science, University of California, Irvine,California, USA.
2Department of Ecology and Evolutionary Biology,University ofCalifornia, Irvine, California, USA.
3Department of Civil and Environmental Engineering, University ofCalifornia, Irvine, California, USA.
4Bigelow Laboratory for Ocean Sciences, East Boothbay, Maine, USA.
Corresponding author: A. C. Martiny, Department of Earth SystemScience, University of California, 3208 Croul Hall, Irvine, CA 92697,USA. ([email protected])
©2013. American Geophysical Union. All Rights Reserved.0886-6236/13/10.1002/gbc.20061
1
GLOBAL BIOGEOCHEMICAL CYCLES, VOL. 27, 1–9, doi:10.1002/gbc.20061, 2013
[4] Despite the progress made, relatively little is yet knownabout any systematic regional variations in the C:N ratio. Theexistence of such variations should not be surprising. Ingeneral, protein and nucleic acids are both rich in N comparedto C (C:N~4). In contrast, lipids in the cell membrane andwall, carbohydrates, and storage molecules like glycogen orpolyhydroxy-butyrate are rich in C. Thus, the relativebiochemical allocation to different biopolymers can influencethe cellular stoichiometry and result in variations in C:Nbetween plankton lineages and environments [Geider and LaRoche, 2002; Sterner and Elser, 2002]. Indeed, at least fivedifferent mechanisms can induce variations in the particulateC:N ratio. As a first mechanism, the N cell quota declineswhen cells are N limited [Droop, 1983]. Thus, N limitationcommonly results in an increased cellular C:N ratio[Goldman and Peavey, 1979; Vrede et al., 2002]. The secondmechanism links light limitation with a lower cellular C:Nratio as phytoplankton growing under low light irradiancemay accumulate less carbon storage polymers [Chalup andLaws, 1990; Cronin and Lodge, 2003]. The third mechanismis based on a negative relationship between cellular C:N ratioand growth rate [Chalup and Laws, 1990]. This is particularlythe case if the growth rate is controlled by nutrient availability[Bertilsson et al., 2003; Goldman and Peavey, 1979; Vredeet al., 2002]. Although the exact mechanism for this relation-ship is unknown, it is likely due to an increase in the concen-tration of both proteins and nucleic acids compared to othercellular components as well as an increase in nutrient storagein fast-growing cells. The fourth mechanism suggests phylo-genetically constrained elemental ratios derived from differ-ences in the structural biochemical composition of the cell.This mechanism has been invoked as contributing to regionaldifferences in the C:P and N:P ratios, whereby coexisting phy-toplankton taxa have unique elemental stoichiometries[Martiny et al., 2013]. Phylogenetic differences in the C:N ratiohave not been studied in detail. Generally, it is plausible thatsmaller cells can have a higher C:N ratio compared to largecells—i.e., more skin to flesh [Kroer, 1994]. The fifth mecha-nism is that dead plankton material or detritus can influencethe observed particulate elemental ratios. Recently, we ob-served that living cells constituted the majority of particulatematerial in open ocean waters [Martiny et al., 2013] but detritusis likely a nontrivial component of the particulate pools in someregions. However, our quantitative knowledge of detritus con-centration [Jackson and Williams, 1985] and elemental compo-sition [Verity et al., 2000] in the ocean is rather limited.Furthermore, both heterotrophs and autotrophs can preferen-tially scavenge specific elements from this pool. Thus, processesof both detritus formation and degradation can influence the el-emental ratio of marine particles [Loh and Bauer, 2000].[5] While these mechanisms can lead to deviations from
the canonical Redfield value of 6.63 among ocean planktonand communities, variations in the global ocean C:N ratiohave hitherto not been studied in detail. To address this, weask the following questions for the global upper ocean: (i)What are the median and (ii) global variation in the C:Nelemental ratio?
2. Data Set
[6] To assess the variation in the particulate C:N ratio inthe top 200m of the water column, we compiled a data set
of particulate organic carbon (POC) and nitrogen (PON)measurements from 72 previously published and publiclyavailable cruises or time series (Table S1 in the supportinginformation). Unless otherwise stated, all mathematicaloperations were done in Matlab (Mathworks, Natick,MA). Our combined dataset contained 40,482 paired sam-ples of POC and PON covering both open-ocean and coastalsamples. We combined this information with data on longi-tude, latitude, temperature, sampling and absolute watercolumn depths, as well as nitrate, phosphate, and chloro-phyll concentrations. Missing temperature, nitrate, or phos-phate data were estimated from the World Ocean Atlas[Boyer et al., 2006]. The water column depth was estimatedbased on the ETOPO2v2 bathymetry (National GeophysicalData Center, 2006). Samples with a C:N ratio below 2 andabove 20 were excluded from our data set. Based on empir-ical observations and the ratios of plankton, such valueswere deemed unrealistically small or large and could cor-rupt the observed mean ratios and further analysis. We de-fined a station as a unique depth profile in time (±1 day)and space (within a 1° × 1° box). This resulted in 5383 sta-tions. We purposely defined this margin to allow for mea-surements of different environmental parameters onseparate casts at the same station. Note that we assumedour samples to be independent and hence did not correctour data set for spatial autocorrelation.
2.1. Data Analysis
[7] The statistical distribution of POC:PON ratios in ourdata set is not easily characterized by any standard parametricprobability density function (pdf). We therefore used one- andtwo-dimensional kernel density estimation procedures toconstruct a density distribution for the POC and PON dataand their ratio [Azzalini and Bowman, 1997; Botev et al.,2010]. To account for nonsymmetry of the resulting densitydistribution of the C:N ratio, we computed the mean, mode,and median values. Note that we tested the dependence of thesemoments on the choice of the kernel bandwidth of the densityestimator and found consistent estimates of their values. Wealso estimated the mean bulk C:N ratio, which was defined asthe mean POC to mean PON concentration ratio.[8] A feed-forward back-propagation artificial neural net-
work (ANN) was used to determine the functional relation-ships between the various environmental factors (predictors)and the measured C:N ratio. The training data set was createdusing split sampling and consisted of 50% of the total data set.The remaining data not used for network calibration were usedas an evaluation data set. A network with three hidden nodeswas found to provide stable performance for both data sets.We evaluated the mean variance described by the model (R2)for 10 independent ANN calibration trials across all possiblecombinations of explanatory factors (ranging from individualfactors to all eight combined; Table S2). Based on this analy-sis, we found that longitude, temperature, phosphate, chloro-phyll, and absolute depth are the most informative predictorsfor the C:N ratio. To provide insights into the importance ofeach input variable for the ANN performance, we calculatedthe ANN response functions by varying one predictor at atime, while keeping the others at the mean values of thecalibration data set.[9] We found the depth-dependent change in C:N ratio at
each station with a minimum of four depth-specific
MARTINY ET AL.: UPPER OCEAN C:N RATIO
2
measurements. The slope for each station was then calculated bynon-linear regression using the relatively simple relationship C:N=b1× exp(b2×depth). We evaluated the overall regionalinfluence on the C:N ratio in the gyres using a one-way analysisof variance (ANOVA) and compared the individual gyres usingTukey's honestly significant difference criterion.
2.2. Taxon-Specific Particulate Carbon and NitrogenMeasurements Using Cell Sorting
[10] In addition to bulk samples, we also collected samplesfor taxon-specific elemental measurements from the westernNorth Atlantic Ocean at three depths (<5, 30, and 100m) at15 stations (total of 277 discrete samples; Table S3). Sampleswere collected in an acid-cleaned Niskin bottle. From thesame Niskin bottle, subsamples were taken for taxon-specificelemental content and for community elemental content. For
taxon-specific elemental content, seawater samples (1–2L )were gently concentrated on 0.4μm polycarbonate filters andkept at 4°C until they could be sorted, within several hours.From the concentrated samples, replicate Prochlorococcus,Synechococcus, and combined pico/nanoeukaryote populationswere sorted using standard protocols [Casey et al., 2007].Sorted Synechococcus and Prochlorococcus populations wereimmediately filtered onto 0.2μm silver filters, and sortedpico/nanoeukaryote populations and bulk POC/PON sampleswere filtered on precombusted (450°C, 4 h) Whatman GF/Ffilters. All samples were frozen at �20°C until elementalanalysis [Lomas et al., 2013; Steinberg et al., 2001].Samples were analyzed on a Control Equipment 240-XAor 440-XA elemental analyzer standardized to acetanilide.The POC analysis included an acidification step to removeinorganic carbonate.
< 5 < 6.6 < 8 > 8C C:N ratio:
< 4 < 8 < 20 > 20
B PON (µM):
A POC (µM):
< 0.6 < 1.2 < 2.5 > 2.5
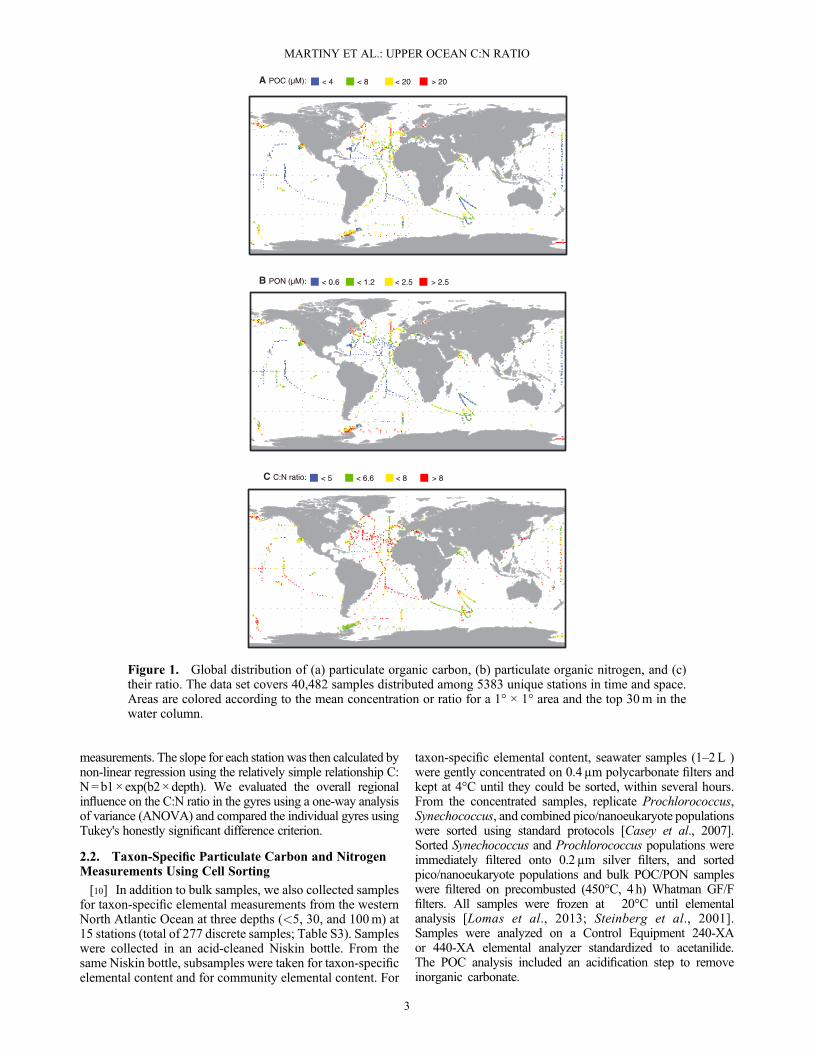
Figure 1. Global distribution of (a) particulate organic carbon, (b) particulate organic nitrogen, and (c)their ratio. The data set covers 40,482 samples distributed among 5383 unique stations in time and space.Areas are colored according to the mean concentration or ratio for a 1° × 1° area and the top 30m in thewater column.
MARTINY ET AL.: UPPER OCEAN C:N RATIO
3
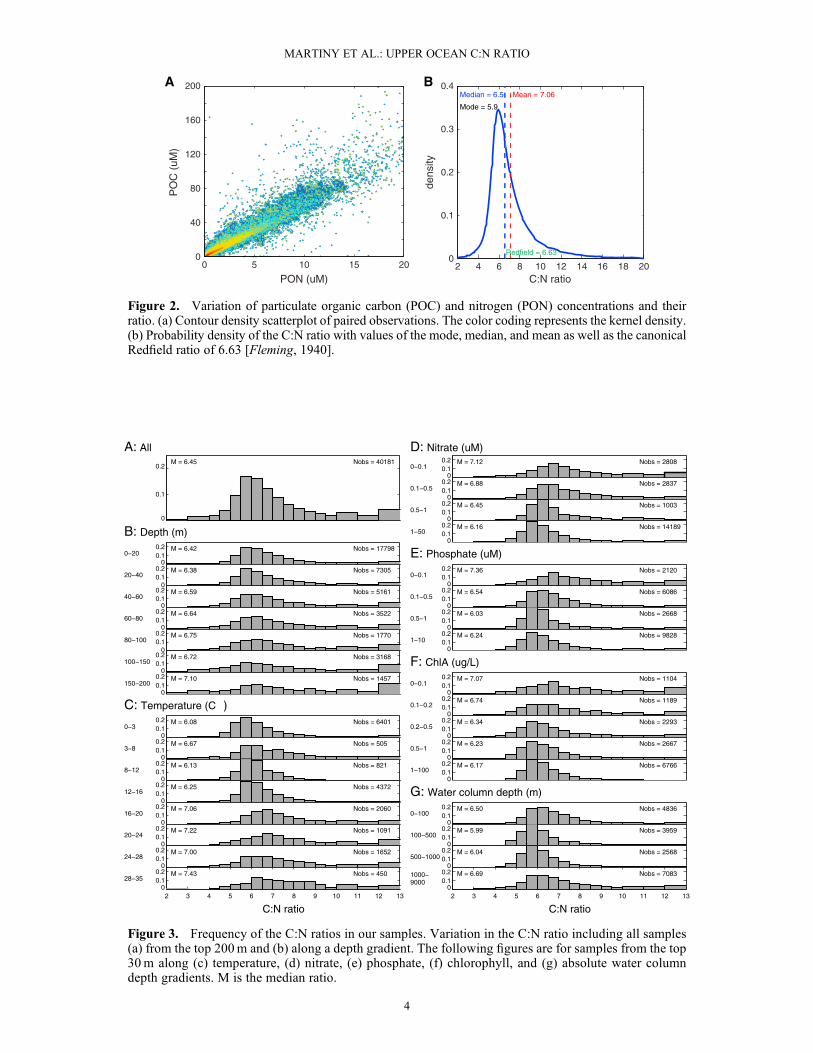
Figure 2. Variation of particulate organic carbon (POC) and nitrogen (PON) concentrations and theirratio. (a) Contour density scatterplot of paired observations. The color coding represents the kernel density.(b) Probability density of the C:N ratio with values of the mode, median, and mean as well as the canonicalRedfield ratio of 6.63 [Fleming, 1940].
Figure 3. Frequency of the C:N ratios in our samples. Variation in the C:N ratio including all samples(a) from the top 200m and (b) along a depth gradient. The following figures are for samples from the top30m along (c) temperature, (d) nitrate, (e) phosphate, (f) chlorophyll, and (g) absolute water columndepth gradients. M is the median ratio.
MARTINY ET AL.: UPPER OCEAN C:N RATIO
4
3. Results
[11] To identify the global surface ocean variation of POCand PON and their ratio, we analyzed globally distributedpaired observations from the upper 200m of the water col-umn (Figure 1). The data were compiled from 72 cruises ortime series (Table S1). The POC concentration followed aclear regional pattern with concentrations above 8μM athigher latitudes and in coastal upwelling regions and concen-trations below 4μM in the oligotrophic gyres. The PON con-centration showed a similar regional pattern withconcentrations above 1.2 μM in coastal and higher-latitudeareas and mainly below 0.6μM in the oligotrophic gyres.Consequently, POC and PON were highly correlated glob-ally with an R2 of 0.86 (Figure 2a). We next used a kerneldensity estimation procedure to construct a normalizedsmoothed histogram of the ratio of POC:PON (Figure 2b).The nonsymmetrical shape of the pdf made it impossible todefine a single C:N ratio that adequately characterized thecentral tendency of the entire distribution. Indeed, the modeof the pdf of the C:N ratio equals 5.90, whereas the median(6.5) and mean (7.1) are considerably larger. We also esti-mated a mean bulk C:N ratio (i.e., the mean POC to meanPON ratio) of 6.75.
3.1. Global Variation in the C:N Ratio
[12] Despite the striking global agreement between POCand PON, a considerable range in the measured C:N ratiowas also detected (Figure 2b). About half of the data set(19,788 samples) exhibited a C:N ratio that differed morethan one unit from the canonical Redfield ratio. This included
8656 samples (~21%) with values smaller than 5.6 and11,132 samples (~27%) with a C:N ratio larger than 7.6.Part of this variation could be attributed to a positive depthdependence of the C:N ratio. A lower C:N ratio was observednear the ocean surface (median C:N0m = 6.4) compared to200m depth (C:N200m = 7.1) (Figure 3b). However, this find-ing was not universal. In low-temperature, high-nutrient
0 100 200 3006
6.5
7
7.5
8
8.5
9
9.5
10
10.5
Longitude
Pre
dict
ed C
:N
0 10 20 306
6.5
7
7.5
8
8.5
9
9.5
Temperature (C)
Pre
dict
ed C
:N
0 1 2 3 4 56
7
8
9
10
11
12
Phosphate (uM)
Pre
dict
ed C
:N
0 10 20 30 40 506.2
6.3
6.4
6.5
6.6
6.7
6.8
6.9
7
Chlorophyll (ug/L)
Pre
dict
ed C
:N
6.2
6.4
6.6
6.8
7
7.2
7.4
7.6
Water column depth (m)
Pre
dict
ed C
:N
1001000 310
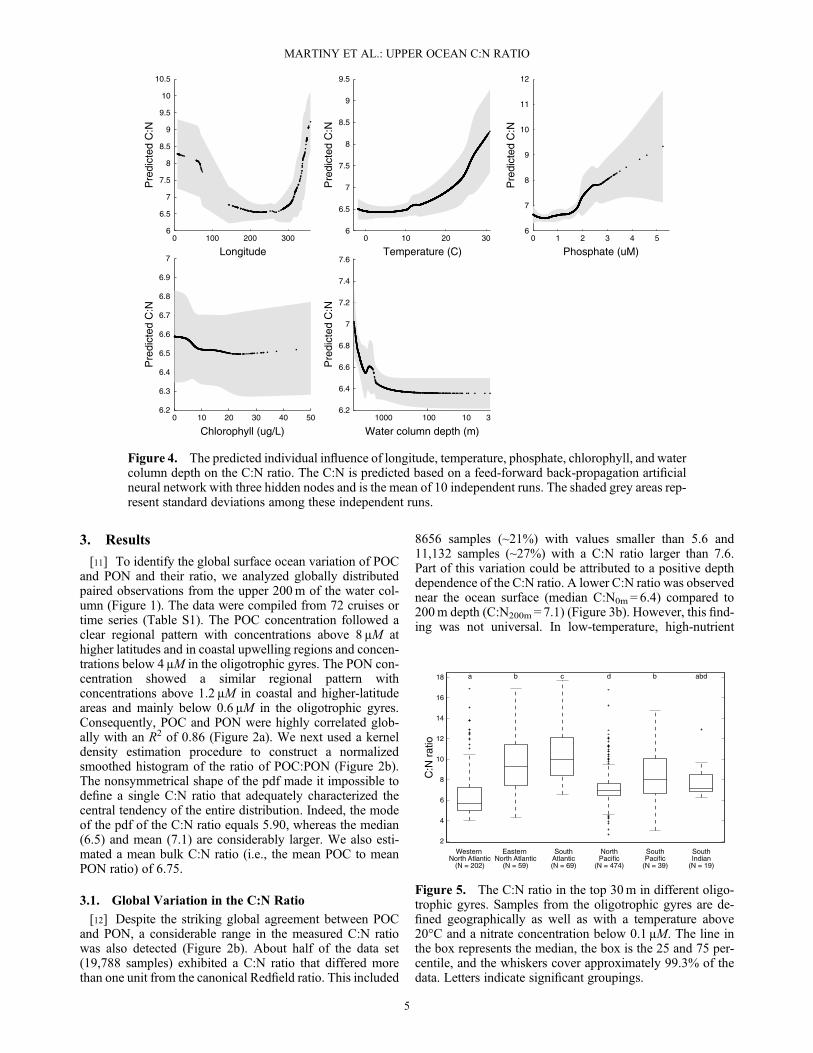
Figure 4. The predicted individual influence of longitude, temperature, phosphate, chlorophyll, and watercolumn depth on the C:N ratio. The C:N is predicted based on a feed-forward back-propagation artificialneural network with three hidden nodes and is the mean of 10 independent runs. The shaded grey areas rep-resent standard deviations among these independent runs.
Figure 5. The C:N ratio in the top 30m in different oligo-trophic gyres. Samples from the oligotrophic gyres are de-fined geographically as well as with a temperature above20°C and a nitrate concentration below 0.1μM. The line inthe box represents the median, the box is the 25 and 75 per-centile, and the whiskers cover approximately 99.3% of thedata. Letters indicate significant groupings.
MARTINY ET AL.: UPPER OCEAN C:N RATIO
5
ocean regions, the C:N ratio tended to increase with depthdown to 200m. In contrast, the ratio was either constant ordecreased with depth in oligotrophic gyres. Finally, up-welling regions had either constant or increasing ratios.Indeed, surface temperature influenced whether the C:Nratio increases or decreases with depth (linear regression,P ~ 6 × 10�15).[13] To filter out this depth dependence, we summarized
our findings for the top 30 m of the ocean water column alonggradients of temperature, nutrient and chlorophyll concentra-tions, and water column depth (i.e., a proxy for coastal andbenthic influence; Figures 3c–3g). The median C:N ratiowas lower in low-temperature, high-nutrient waters (~6)and higher in elevated temperature and low-nutrient waters(>7). Furthermore, the C:N ratio was higher in low comparedto high chlorophyll waters. We then tested if we could ex-plain the observed variation in the observed C:N valuesbased on these environmental factors using feed-forwardback-propagation artificial neural networks (ANNs; TableS2). We also added latitude and longitude as proxies to testfor relevant yet unknown biological or ecological factors.In the first step, we analyzed the predictive power of all com-binations of the environmental factors described above andwere seeking an ANN with a minimum number of input vari-ables, and hence computational complexity, but maximumpredictive performance. Our analysis convincingly demon-strated that the longitude of measurement contained the mostinformation to explain the observed C:N ratios with a R2 of0.08. With a more complex network, repeated trialssuggested that a model with five predictors including longi-tude, chlorophyll and phosphate concentration, temperature,and the absolute depth of the water column provided a net-work with a R2 of 0.21 (Table S2). In contrast, a model withany other combination of five predictors (i.e., latitude, depth,chlorophyll and nitrate concentrations, and absolute watercolumn depth) reduced the R2 to 0.05. Thus, it appeared thatthis combination best explained the observed C:N ratios. Wethen identified the individual quantitative effect of each pre-dictor (Figure 4). The relationship between longitude and
C:N showed a generally higher ratio in the Eastern AtlanticOcean and Indian Ocean (longitude: 300°–80°) in compari-son to the Pacific and Western Atlantic Ocean (longitude:120°–300°; Figure 4a). As seen in Figure 3, we also founda clear positive relationship with temperature and a higher ra-tio in open compared to coastal ocean samples (Figure 4b and4e). When this temperature effect was included, there was noadditional influence of nutrients at low concentration (i.e.,due to a strong covariance of the two factors). However, thepresence of very high nutrient concentrations had an addi-tional positive influence on the ratio. Finally, we also saw anegative relationship to chlorophyll concentration.[14] The regional variation in C:N ratio at different longi-
tudes could be observed in the difference in ratio betweenthe oligotrophic gyres. For example, the Sargasso Seaappeared to have a lower C:N ratio compared to other re-gions. To address this, we identified the C:N ratio in eachgyre but split the North Atlantic gyre into eastern and westernparts (Figure 5). As observed in the earlier analyses, mostgyres had a ratio above Redfield (with the notable exceptionof the western North Atlantic). A significant effect of regionwas apparent (one-way ANOVA, P ~ 1 × 10�53).Furthermore, most regions displayed unique C:N ratios(Tukey's honestly significant difference criterion, P< 0.05).For example, we found a C:N ratio in the western NorthAtlantic Ocean significant lower than that of most other re-gions (the only exception was the South Indian Ocean gyre,which could be due to a relatively low sample size for this re-gion). In contrast, the C:N ratio was significantly higher inthe South Atlantic Ocean gyre compared to all other regions.
3.2. C:N Ratio of Plankton Communities
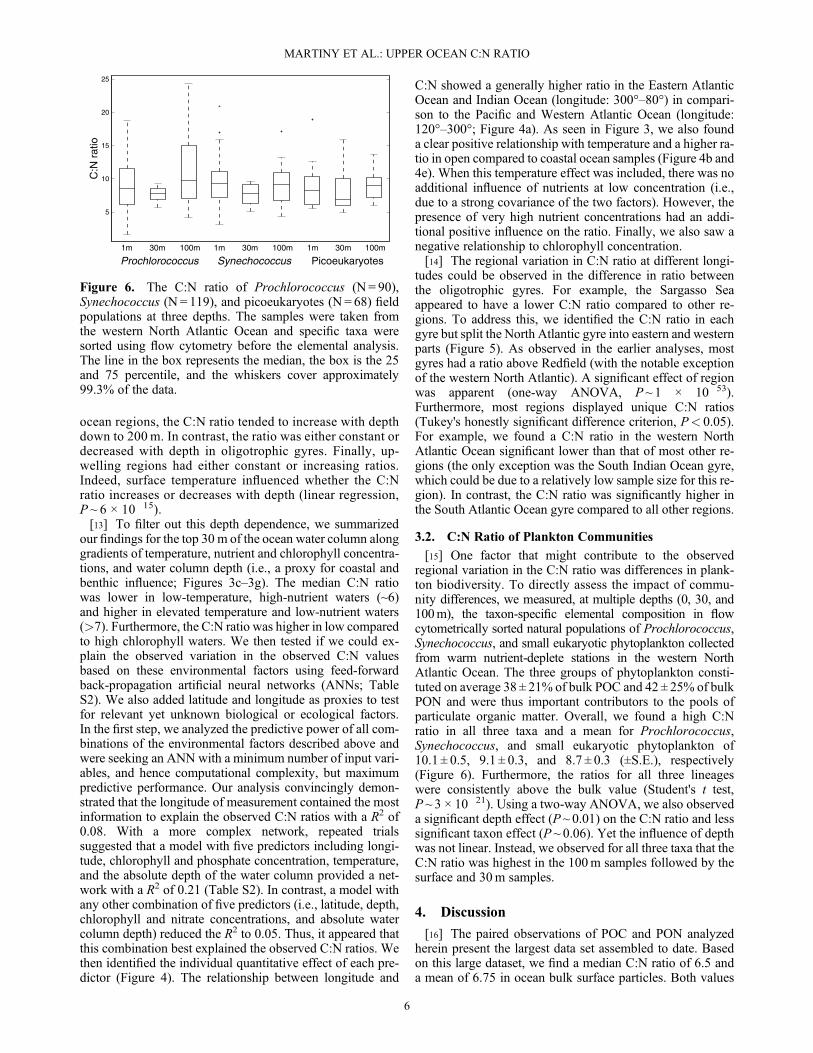
[15] One factor that might contribute to the observedregional variation in the C:N ratio was differences in plank-ton biodiversity. To directly assess the impact of commu-nity differences, we measured, at multiple depths (0, 30, and100m), the taxon-specific elemental composition in flowcytometrically sorted natural populations of Prochlorococcus,Synechococcus, and small eukaryotic phytoplankton collectedfrom warm nutrient-deplete stations in the western NorthAtlantic Ocean. The three groups of phytoplankton consti-tuted on average 38 ± 21% of bulk POC and 42 ± 25% of bulkPON and were thus important contributors to the pools ofparticulate organic matter. Overall, we found a high C:Nratio in all three taxa and a mean for Prochlorococcus,Synechococcus, and small eukaryotic phytoplankton of10.1 ± 0.5, 9.1 ± 0.3, and 8.7 ± 0.3 (±S.E.), respectively(Figure 6). Furthermore, the ratios for all three lineageswere consistently above the bulk value (Student's t test,P ~ 3 × 10�21). Using a two-way ANOVA, we also observeda significant depth effect (P ~ 0.01) on the C:N ratio and lesssignificant taxon effect (P ~ 0.06). Yet the influence of depthwas not linear. Instead, we observed for all three taxa that theC:N ratio was highest in the 100m samples followed by thesurface and 30m samples.
4. Discussion
[16] The paired observations of POC and PON analyzedherein present the largest data set assembled to date. Basedon this large dataset, we find a median C:N ratio of 6.5 anda mean of 6.75 in ocean bulk surface particles. Both values
Figure 6. The C:N ratio of Prochlorococcus (N = 90),Synechococcus (N = 119), and picoeukaryotes (N = 68) fieldpopulations at three depths. The samples were taken fromthe western North Atlantic Ocean and specific taxa weresorted using flow cytometry before the elemental analysis.The line in the box represents the median, the box is the 25and 75 percentile, and the whiskers cover approximately99.3% of the data.
MARTINY ET AL.: UPPER OCEAN C:N RATIO
6
are remarkably close to the canonical Redfield ratio of 6.63but lower than derived in previous studies using smaller datasets [Geider and La Roche, 2002; Schneider et al., 2003]. Weattribute at least part of this difference to the statistical ap-proach applied including a more accurate characterizationof the nonsymmetrical (non-Gaussian) shape of the pdf ofthe C:N ratio. Indeed, simple averaging of the observedC:N ratios gives a mean ratio above 7 due to a skew of its un-derlying probability distribution at higher values. This skew isparticularly pronounced for samples with low PON concentra-tions and thus can be biased due measurement uncertainty.[17] We find a correlation between environmental condi-
tions and the C:N ratio in surface populations. Does this var-iation in C:N ratio constitute systematic regional differences?In the Pacific Ocean, the C:N ratio is commonly near or be-low the canonical Redfield value in upper latitude cold, nutri-ent-rich waters like the Bering Sea (Figure 1c). The ratio isalso low in upwelling systems like the California Current orthe Eastern Equatorial provinces. In contrast, the ratio is gen-erally above Redfield in both the North and South PacificOcean gyres. These trends are also present in the IndianOcean, where an increase in the C:N ratio is clearly visiblewhen moving from higher latitudes into the gyre. We also de-tect a relatively low C:N ratio in the Arabian Sea upwellingsystem. However, we observe more variation in the NorthAtlantic Ocean region. In the western part (including theSargasso Sea), the ratio appears near or below Redfield,whereas the eastern part exhibits higher ratios. In the SouthAtlantic gyre, the ratio is generally above Redfield. Finally,the ratio is higher in the Southern Ocean. Thus, globally cold,nutrient-rich upper latitude waters as well as upwelling re-gions are characterized by a lower C:N ratio than warm, nu-trient-depleted gyres. This pattern is analogous to what wehave previously observed for the N:P and C:P ratios[Martiny et al., 2013], yet the magnitude of change is muchsmaller for the C:N ratio.[18] In this study, we have analyzed only the spatial varia-
tion of the C:N ratio but the dependence of this ratio on theenvironmental conditions suggests a presence of temporalvariations. Thus, we hypothesize that open-ocean middleand upper latitude surface waters are characterized by a sea-sonal succession in the C:N ratio. Here the ratio may below in winter and spring but increases as the water columngets more stratified and the surface waters more nutrient de-pleted during the summer and early fall. Future studiesshould focus on a more detailed assessment of the temporalvariations in the C:N ratio.[19] There are at least five mechanisms that can lead to this
regional variation in the C:N ratio. As a first mechanism, Nlimitation often leads to a low N cell quota and resulting highC:N ratio. In support of this, we see a clear difference be-tween the eastern and western part of North Atlantic Ocean.The plankton community in this region of the AtlanticOcean receives an influx of water with a dissolved N:P ratiomuch greater than the canonical Redfield ratio, whereas mostother gyres as well as the eastern Atlantic Ocean have a lowerdissolved N:P ratio [Gruber and Sarmiento, 1997; Wu et al.,2000]. Thus, the lower N stress in the western North Atlanticmay result in a lower C:N ratio and thus provide a link be-tween the observed C:N ratio and the nutrient supply ratio.We also find that the North Pacific has a significantly lowerC:N ratio than the South Pacific Ocean, a finding which is
consistent with a much lower input of iron and associated ni-trogen fixation [Moutin et al., 2008]. This limited input offixed nitrogen may cause the observed difference in the C:N ratio between the two gyres in the Pacific Ocean.Overall, differences in the supply of N and P including fromN fixation and the resulting degree of N stress may affect theelemental stoichiometry in the oligotrophic gyres and con-tribute to a regional variation in the C:N ratio in the gyres.[20] The second mechanism links light limitation with a
lower cellular C:N ratio. Based on this mechanism, weshould expect to find a decline in the C:N ratio with depth.Our analysis also suggests a depth-dependent variation inboth bulk and picophytoplankton C:N ratio. However, wefind regional differences in the sign of the depth dependenceand see the highest C:N ratio in sorted phytoplanktonpopulations at the base of the euphotic zone. This suggeststhat light limitation may play an important role but that themechanisms controlling the observed vertical variation inthe C:N ratio are complex, warranting further studyand observation.[21] The third mechanism is based on a negative relation-
ship between the cellular C:N ratio, growth rate, and nutrientstress. This mechanism may be important for the identifiedlatitudinal change in the C:N range, whereby the ratio is gen-erally higher in the warm, nutrient-depleted gyres and lowerin upper latitude as well as in upwelling regions. Cells grow-ing in nutrient depleted compared to rich environments mayhave a higher C:N ratio. This may not directly be a growthrate effect as plankton can have growth rates in the gyres thatare comparable to or greater than in cold, nutrient-rich envi-ronments [Doney et al., 2009]. Instead, the higher C:N ratiocan broadly be related to the nutrient level and correspondingdegree of nutrient stress as found in various phytoplanktonculture experiments [Bertilsson et al., 2003; Goldman andPeavey, 1979; Vrede et al., 2002].[22] In support of the fourth mechanism, we find that re-
gional differences in the C:P and N:P ratios are at least in partdriven by changes in phytoplankton community composition[Martiny et al., 2013]. Cyanobacteria have higher C:P and N:P ratios compared to eukaryotic phytoplankton co-occurringin the same sample. Thus, can differences in communitycomposition also explain the regional variation we observein the C:N ratio? Our taxon-specific elemental analyses showthat the C:N ratio in all three small phytoplankton populationare significantly higher than the canonical Redfield ratiowhich is consistent with phytoplankton culture studies[Bertilsson et al., 2003; Heldal et al., 2003]. In contrast, weonly observe slight differences between Prochlorococcus,Synechococcus, and small eukaryotic phytoplankton. Thissuggests that the overall presence of small phytoplankton,as opposed to large phytoplankton like diatoms and dinofla-gellates, leads to a higher ratio in the gyres. It further suggeststhat other plankton groups or detrital material has a muchlower ratio in the western North Atlantic in order for the bulkto reach the observed value. However, the distribution of in-dividual taxa among the picophytoplankton groups will nothave much impact on the C:N ratio. Presently, we do nothave data for diatom and other large plankton populations.However, it is known that diatoms can store large amountsof N [Lomas and Glibert, 2000] and this may contribute tothe low C:N ratio in nutrient replete environments. Thus, amore detailed understanding of the elemental ratios of large
MARTINY ET AL.: UPPER OCEAN C:N RATIO
7
phytoplankton will be important to elucidate the impact ofchanges in plankton community on the regional C:N ratio.[23] Not all particulate nitrogen and carbon are of marine
origin so it is possible that carbon-enriched terrestrial mate-rial delivered from rivers or dust could influence the observedC:N ratio, particularly in coastal regions [Kononova, 1966].We do not observe a high C:N ratio in coastal samples (i.e.,a low absolute water column depth; Figure 3g) where the ter-restrial impact presumably will be largest. Schneider et al.[2003] examined this issue but found that lithogenic materialwith a high carbon content was a minor component of mostopen ocean samples. Finally, we observed that small phyto-plankton represent nearly half the biomass in open oceannear-surface samples. Combined with other plankton groups,for example heterotrophic bacteria and protistan grazers, it islikely that living cells constitute most of the POC and PON inopen ocean surface environments. Thus, it appears that non-marine particles are not the drivers of the observed mean andvariation in the C:N ratio.[24] It is worth noting that we were unable to explain ap-
proximately 80% of the observed variation in the C:N ratiousing longitude, temperature, phosphate, chlorophyll, andwater column depth as predictive factors. This suggests thatfactors beyond the common oceanographic or geographicfactors tested here can influence the linkages between the or-ganic carbon and nitrogen content. This may include iron orother trace metal concentrations, nutrient fluxes rather thannutrient stocks, differences in plankton biodiversity includ-ing the ratio of autotrophs to heterotrophs, or biotic/trophicinteractions. Also, currently we do not understand the mech-anism(s) driving the depth dependence of the C:N ratio.Previous work found a depth dependent increase of the C:Nratio, whereby the ratio rose from 8.3 in the upper surface(< 500m) to above 9 in the deep ocean [Schneider et al.,2003]. Schneider and colleagues attributed these depth dif-ferences to preferential remineralization of nitrogen over car-bon. This can possibly also explain some of the changes inthe upper 200m of the ocean water column but our data sug-gest that the depth dependence is much more complex. Thus,it appears that other, yet unexplored factors may influence theC:N ratio in different ocean environments.[25] Our results have important biogeochemical implica-
tions. We identify a very high correlation between POC andPON, which indicates that a constant C:N ratio remains a rea-sonable approximation for global ocean biogeochemicalstudies. However, there are also systematic regional differ-ences in this ratio. These regional differences could influencethe link between the nitrogen and carbon cycle [Oschlieset al., 2008; Schneider et al., 2004; Tagliabue et al., 2011].Biogeochemical models can possibly be improved byallowing for a cellular stoichiometry that varies in responseto the overall nutrient and temperature level (i.e., high C:Nin low-nutrient, high-temperature environments), the nutrientsupply ratio (i.e., higher in P versus N stressed environmentsin the gyres), and taxonomic differences (i.e., high ratio insmall phytoplankton). In summary, we have here identifiedboth a substantial congruence between the concentration ofPOC and PON but also significant variation in the C:N ratioin different ocean environments. This variation in the cou-pling between the carbon and nitrogen cycles can in part bedescribed by known mechanisms but it is also clear that addi-tional factors are likely influencing the observed C:N ratio.
Considering the importance of this ratio in the formulationof global ocean carbon-cycle models, elucidating these addi-tional factors should be an important goal of the oceano-graphic research community.
[26] Acknowledgments. We would like to thank the NSF Dimensionsof Biodiversity and Biological Oceanography programs (ACM and MWL),the DOE office of biological research (FP), and the UCI EnvironmentInstitute (ACM and JAV) for supporting our research.
ReferencesAzzalini, A., and A. W. Bowman (1997), Applied Smoothing Techniques forData Analysis, Oxford Univ. Press, Oxford, U. K.
Bertilsson, S., O. Berglund, D. Karl, and S. Chisholm (2003), Elementalcomposition of marine Prochlorococcus and Synechococcus:Implications for the ecological stoichiometry of the sea, Limnol.Oceanogr., 48(5), 1721–1731, doi:10.4319/lo.2003.48.5.1721.
Botev, Z. I., J. F. Grotowski, and D. P. Kroese (2010), Kernel density estima-tion via diffusion, Ann. Stat., 38(5), 2916–2957, doi:10.1214/10-AOS799.
Boyer, T. P., J. I. Antonov, H. E. Garcia, D. R. Johnson, R. A. Locarnini,A. V. Mishonov, M. T. Pitcher, O. K. Baranova, and I. V. Smolyar(2006), World Ocean Database 2005, U.S. Government Printing Office,Washington, D.C., pp. 190.
Casey, J. R., M. W. Lomas, J. Mandecki, and D. E. Walker (2007),Prochlorococcus contributes to new production in the Sargasso Sea deepchlorophyll maximum, Geophys. Res. Lett., 34, L10604, doi:10.1029/2006GL028725.
Chalup, M. S., and E. A. Laws (1990), A test of the assumptions and predic-tions of recent microalgal growth models with the marine phytoplankterPavlova lutheri, Limnol. Oceanogr., 35(3), 583–596, doi:10.4319/lo.1990.35.3.0583.
Copin-Montegut, C., and G. Copin-Montegut (1983), Stoichiometry of car-bon, nitrogen, and phosphorus in marine particulate matter, Deep SeaRes. Part I, 30(1), 31–46, doi:10.1016/0198-0149(83)90031-6.
Cronin, G., and D. M. Lodge (2003), Effects of light and nutrient availabilityon the growth, allocation, carbon/nitrogen balance, phenolic chemistry,and resistance to herbivory of two freshwater macrophytes, Oecologia,137(1), 32–41, doi:10.1007/s00442-003-1315-3.
Deutsch, C., and T. Weber (2012), Nutrient ratios as a tracer and driver ofocean biogeochemistry, Ann. Rev. Mar. Sci., 4, 113–141, doi:10.1146/annurev-marine-120709-142821.
Doney, S. C., I. Lima, J. K. Moore, K. Lindsay, M. J. Behrenfeld,T. K. Westberry, N. Ma–howald, D. M. Glover, and T. Takahashi(2009), Skill metrics for confronting global upper ocean ecosystem-biogeochemistry models against field and remote sensing data, J. Mar.Syst., 76(1-2), 95–112, doi:10.1016/j.jmarsys.2008.05.015.
Droop, M. R. (1983), 25 years of algal growth kinetics—A personal view,Bot. Mar., 26(3), 99–112, doi:10.1515/botm.1983.26.3.99.
Dugdale, R. C. (1967), Nutrient limitation in the sea: Dynamics, identifica-tion and significance, Limnol. Oceanogr., 12(4), 685–695, doi:10.4319/lo.1967.12.4.0685.
Fleming, R. H. (1940), The composition of plankton and units for reportingpopulation and production, Proc. Sixth Pac. Sci. Cong. Calif, 1939, 3,535–540.
Geider, R. J., and J. La Roche (2002), Redfield revisited: variability of C:N:Pin marine microalgae and its biochemical basis, Eur. J. Phycol., 37(1),1–17, doi:10.1017/S0967026201003456.
Goldman, J. C., and D. G. Peavey (1979), Steady-state growth andchemical composition of the marine chlorophyte Dunaliella tertiolectain nitrogen-limited continuous cultures, Appl. Environ. Microbiol.,38(5), 894–901.
Gruber, N., and J. L. Sarmiento (1997), Global patterns of marine nitrogenfixation and denitrification, Global Biogeochem. Cycles, 11(2), 235–266,doi:10.1029/97GB00077.
Heldal, M., D. Scanlan, S. Norland, F. Thingstad, and N. Mann (2003),Elemental composition of single cells of various strains of marineProchlorococcus and Synechococcus using X-ray microanalysis, Limnol.Oceanogr., 48(5), 1732–1743, doi:10.4319/lo.2003.48.5.1732.
Jackson, G. A., and P. M. Williams (1985), Importance of dissolved organicnitrogen and phosphorus to biological nutrient cycling,Deep Sea Res. PartI, 32(2), 223–235, doi:10.1016/0198-0149(85)90030-5.
Kononova, M. (1966), Soil Organic Matter, Pergamon, New York.Kortzinger, A.,W. Koeve,W. Kähler, and L. J. Mintrop (2001), C:N ratios inthe mixed layer during the productive season in the northeast AtlanticOcean, Deep Sea Res. Part I, 48(3), 661–688, doi:10.1016/S0967-0637(00)00051-0.
MARTINY ET AL.: UPPER OCEAN C:N RATIO
8
Kroer, N. (1994), Relationships between biovolume and carbon and nitrogencontent of bacterioplankton, FEMS Microbiol. Ecol., 13(3), 217–223,doi:10.1016/0168-6496(94)90015-9.
Loh, A. N., and J. E. Bauer (2000), Distribution, partitioning and fluxes ofdissolved and particulate organic C, N and P in the eastern North Pacificand Southern Oceans, Deep Sea Res. Part I, 47(12), 2287–2316,doi:10.1016/S0967-0637(00)00027-3.
Lomas, M. W., and P. M. Glibert (2000), Comparisons of nitrate uptake,storage, and reduction in marine diatoms and flagellates, J. Phycol.,36(5), 903–913, doi:10.1046/j.1529-8817.2000.99029.x.
Lomas, M. W., N. R. Bates, R. J. Johnson, A. H. Knap, D. K. Steinberg, andC. A. Carlson (2013), Two decades and counting: 24 years of sustainedopen ocean biogeochemical measurements in the Sargasso Sea, DeepSea Res. Part II, (0), doi:10.1016/j.dsr2.2013.01.008.
Martiny, A. C., C. T. A. Pham, F. W. Primeau, J. A. Vrugt, J. K. Moore,S. A. Levin, and M.W. Lomas (2013), Strong latitudinal patterns in the el-emental ratios of marine plankton and organic matter, Nat. Geosci., 6(4),279–283, doi:10.1038/ngeo1757.
Mills, M. M., and K. R. Arrigo (2010), Magnitude of oceanic nitrogen fixa-tion influenced by the nutrient uptake ratio of phytoplankton, Nat. Geosci.,3(6), 412–416, doi:10.1038/ngeo856.
Moutin, T., D. M. Karl, S. Duhamel, P. Rimmelin, P. Raimbault,B. A. S. Van Mooy, and H. Claustre (2008), Phosphate availability andthe ultimate control of new nitrogen input by nitrogen fixation in the tropicalPacific Ocean, Biogeosciences, 5(1), 95–109, doi:10.5194/bg-5-95-2008.
Oschlies, A., K. G. Schulz, U. Riebesell, and A. Schmittner (2008),Simulated 21st century's increase in oceanic suboxia by CO2-enhanced bi-otic carbon export, Global Biogeochem. Cycles, 22, GB4008,doi:10.1029/2007GB003147.
Redfield, A. C. (1934), On the proportions of organic derivatives in sea waterand their relation to the composition of plankton, in James JohnstoneMemorial Volume, Liverpool Univ. Press, Liverpool, U.K., pp. 176–192 .
Schneider, B., R. Schlitzer, G. Fischer, and E.M. Nothig (2003), Depth-depen-dent elemental compositions of particulate organic matter (POM) in theocean, Global Biogeochem. Cycles, 17, 1032, doi:10.1029/2002GB001871.
Schneider, B., A. Engel, and R. Schlitzer (2004), Effects of depth- and CO2-dependent C:N ratios of particulate organic matter (POM) on the marinecarbon cycle, Global Biogeochem. Cycles, 18, GB2015, doi:10.1029/2003GB002184.
Steinberg, D. K., C. A. Carlson, N. R. Bates, R. J. Johnson, A. F. Michaels,and A. H. Knap (2001), Overview of the US JGOFS Bermuda AtlanticTime-series Study (BATS): A decade-scale look at ocean biology and bio-geochemistry, Deep Sea Res. Pt. II, 48(8-9), 1405–1447, doi:10.1016/S0967-0645(00)00148-X.
Sterner, R. W., and J. J. Elser (2002), Ecological Stoichiometry: TheBiology of Elements From Molecules to the Biosphere, Princeton Univ.Press, Princeton, N.J.
Sterner, R. W., J. J. Elser, and D. O. Hessen (1992), Stoichiometric relation-ships among producers, consumers and nutrient cycling in pelagic ecosys-tems, Biogeochemistry, 17(1), 49–67, doi:10.1007/BF00002759.
Sterner, R. W., T. Anderson, J. J. Elser, D. O. Hessen, J. M. Hood,E. McCauley, and J. Urabe (2008), Scale-dependent carbon: nitrogen:phosphorus seston stoichiometry in marine and freshwaters, Limnol.Oceanogr., 53(3), 1169–1180, doi:10.4319/lo.2008.53.3.1169.
Tagliabue, A., L. Bopp, and M. Gehlen (2011), The response of marine car-bon and nutrient cycles to ocean acidification: Large uncertainties relatedto phytoplankton physiological assumptions, Global Biogeochem.Cycles, 25, GB3017, doi:10.1029/2010GB003929.
Verity, P. G., S. C. Williams, and Y. Hong (2000), Formation, degradation,and mass: Volume ratios of detritus derived from decaying phytoplankton,Mar. Ecol. Prog. Ser., 207, 53–68, doi:10.3354/meps207053.
Vrede, K., M. Heldal, S. Norland, and G. Bratbak (2002), Elemental compo-sition (C, N, P) and cell volume of exponentially growing and nutrient-limited bacterioplankton, Appl. Environ. Microbiol., 68(6), 2965–2971,doi:10.1128/AEM.68.6.2965-2971.2002.
Weber, T. S., and C. Deutsch (2010), Ocean nutrient ratios governed by planktonbiogeography, Nature, 467(7315), 550–554, doi:10.1038/nature09403.
Wu, J., W. Sunda, E. A. Boyle, and D. M. Karl (2000), Phosphate depletionin the western North Atlantic Ocean, Science, 289(5480), 759–762,doi:10.1126/science.289.5480.759.
MARTINY ET AL.: UPPER OCEAN C:N RATIO
9