REIU (Regional Economic Intelligence Unit) Patrick Bowes Regional Economic Intelligence Unit.

Regional Training Unit (RTU)
School Leadership Survey - Northern IrelandReport of findingsSeptember 2007
Page 2
PricewaterhouseCoopers LLP
Outline
Part A
• Introduction and Background
• Summary of findings
Part B
• Methodology
• Responses to survey questions

Page 3
PricewaterhouseCoopers LLP
Part A
• Introduction and Background
• Summary of findings

Introduction andBackground

PricewaterhouseCoopers LLP
Page 5
The Regional Training Unit (RTU) commissionedPricewaterhouseCoopers LLP (PwC) to undertake a survey of all schoolPrincipals in Northern Ireland in May 2007.
The overall aim of the survey was to investigate existing and emergingcharacteristics of school leadership in Northern Ireland.
PwC undertook a similar survey of Headteachers in England and Walesin 2007 as part of a comprehensive and independent review of schoolleadership - a copy of the Main Report is available at:http://www.dfes.gov.uk/research/data/uploadfiles/RR818A.pdf.
The survey was designed in collaboration with the RTU. The survey hasbeen the subject of consultation across a range of stakeholders includingthe Department of Education (DE), the Employing Authorities andTeacher Unions represented on the Northern Ireland Teachers Council(NITC).
Introduction and Background

Summary offindings
PricewaterhouseCoopers LLP
Page 7
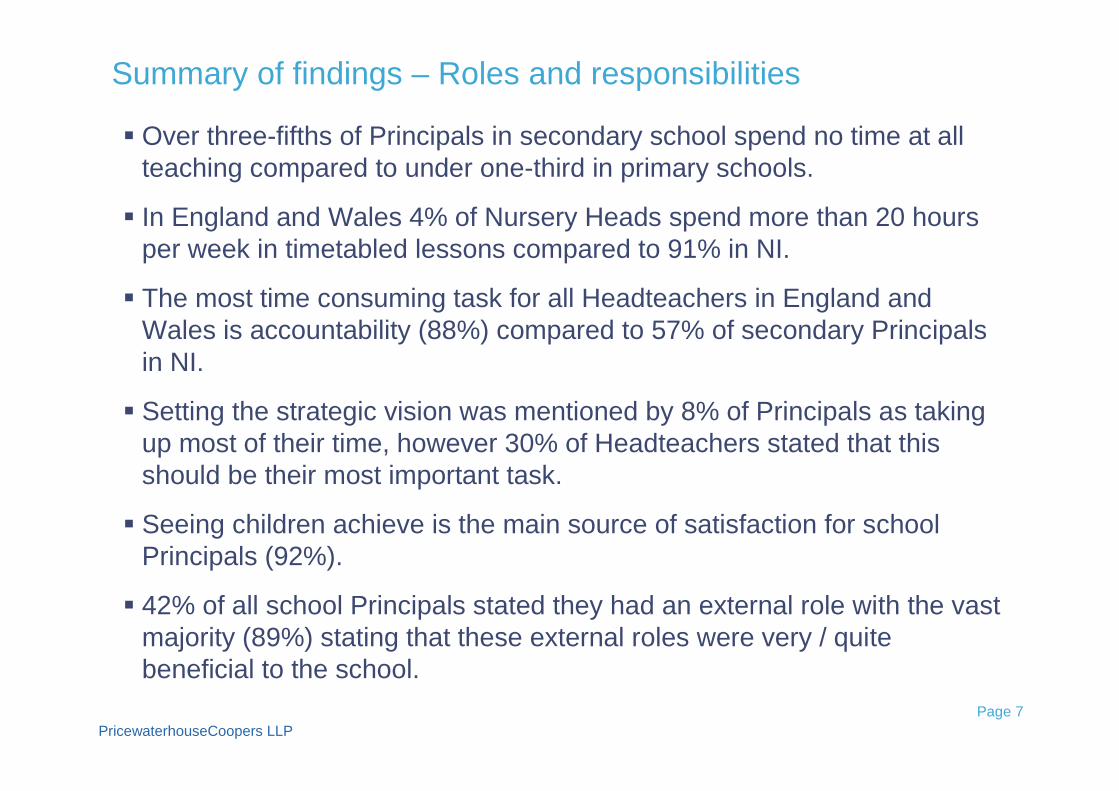
Over three-fifths of Principals in secondary school spend no time at allteaching compared to under one-third in primary schools.
In England and Wales 4% of Nursery Heads spend more than 20 hoursper week in timetabled lessons compared to 91% in NI.
The most time consuming task for all Headteachers in England andWales is accountability (88%) compared to 57% of secondary Principalsin NI.
Setting the strategic vision was mentioned by 8% of Principals as takingup most of their time, however 30% of Headteachers stated that thisshould be their most important task.
Seeing children achieve is the main source of satisfaction for schoolPrincipals (92%).
42% of all school Principals stated they had an external role with the vastmajority (89%) stating that these external roles were very / quitebeneficial to the school.
Summary of findings – Roles and responsibilities

PricewaterhouseCoopers LLP
Page 8
73% of secondary schools have 5 or more members of staff on theSenior Leadership Team.
In primary schools, the Principal is mostly responsible for the curriculum,PRSD, the school budget and extended services. Responsibility insecondary schools is more distributed e.g. the Vice Principal takes ongreater responsibility for the curriculum on a day-to-day basis.
33% of Principals stated that leadership in their school is “very” or“totally” distributed. 66% of Nursery school Principals in NI regardleadership as “not at all” or “not very” distributed compared to 27% ofNursery Headteachers in England and Wales.
All respondents, regardless of sector, status or gender, have identifiedsimilar gaps in expertise in the Senior Leadership Team. Changemanagement was ranked highest with 19% of Principals stating this asthe main gap in expertise in their school.
The majority of Principals (54%) believed that there should be somechange to the composition of their Senior Leadership Team in the next 5-10 years.
Summary of findings – Staffing structures

PricewaterhouseCoopers LLP
Page 9
49% of male Principals earn more than £50,000 per annum compared to25% of female Principals. Over one-half of secondary headteachers inEngland and Wales earn more than £70,000 per annum compared to17% of secondary Headteachers in Northern Ireland.
Over one-half of Principals (57%) stated that the current rewardstructures and other terms and conditions in their school as very inflexible/ inflexible.
Almost two-thirds (64%) of Principals surveyed believed their work-lifebalance was poor or very poor.
The top three tasks/responsibilities that Principals would delegate, ifpossible, include management of support staff, finance and directingextended schools. Over one-third (34%) of Principals stated they couldnot delegate management of support staff because of a lack of skilled /trained staff.
The majority of Principals (59%) felt quite / completely supported fromtheir personal support network, whilst just over one-quarter (26%) feltquite / completely supported from their professional support network.
Summary of findings – Pay and conditions

PricewaterhouseCoopers LLP
Page 10
44% of primary Principals in Northern Ireland offer extended services,whilst 42% of secondary Principals stated the same. This compares to74% of Headteachers in primary and 74% of Headteachers in secondaryschool in England and Wales.
The majority of Principals (56%) stated that their school has looseinformal collaborations with other schools. The biggest benefit forsecondary schools of their collaboration with other schools was ensuringbetter entitlement for 14-19 year olds. For primary schools, the biggestbenefit was more sports and arts activities.
Schools also collaborated with other external agencies, the mostfrequently chosen was health and social care providers / professionals.Headteachers in secondary schools in England were much more likely tohave collaborations with the Business Community (65%) in comparisonto secondary Principals in Northern Ireland (41%).
Summary of findings – Extended service provision andcollaboration

PricewaterhouseCoopers LLP
Page 11
Part B
• Methodology
• Responses to survey questions

Methodology

PricewaterhouseCoopers LLP
Page 13
A copy of the survey was posted to all school Principals (n=1,289) inNorthern Ireland in early June 2007.
A reminder letter (with a further copy of the survey) was sent out twoweeks after the initial distribution of questionnaires which generated alarge number of additional responses.
Topics included in the questionnaire were as follows:
Roles and responsibilities;
Staffing structures;
Pay and conditions;
Extended service provision; and
Collaboration.
Methodology

PricewaterhouseCoopers LLP
Page 14
The table below indicates the number of questionnaires distributed toschool Principals (by school type) against the number returned and theassociated response rates.
* Although 1,289 surveys were distributed, 36 school Principals contacted the research team citing a variety of reasons for not
completing the questionnaire. For the purposes of calculating overall response rates, these have been excluded.
We have analysed all questions using SPSS and have producedfrequencies and counts for each question and have provided directcomparisons with similar questions from the Headteacher surveyundertaken in England and Wales in 2007.
Where interesting patterns/responses have emerged, we haveundertaken more detailed exploratory analysis.
Methodology (cont.)
65%3351Special
725
150
488
53
No. of surveysreturned
57%1,263*Total
64%233Secondary
55%881Primary
54%98Nursery
Response rateNo. of surveys distributedSchool type

PricewaterhouseCoopers LLP
Page 15
Methodology (cont.)
ProfileBy school phase: the largest number of returns were from primary school Principals (488). A
total of 150 returns were from secondary school Principals, followed by 53 from nursery and 33from special schools.
By gender: There were a slightly larger number of returns from male Principals(358) incomparison to female (352).
By school sector: Over one-half of the returns were from Controlled schools (386), followed byMaintained (255); Voluntary (39); Integrated (29) and; Other Maintained (10).
Breakdown of sample by school phase
Secondary
(21%)
Primary (67%)
Nursery (7%)
Special (5%)
Breakdown of sample by gender
Not Known (2%)
Male (49%)
Female (49%)
Breakdown of sample by school sector
Controlled (54%)
Intergrated (4%)
Other
maintained (1%)
Not Known (1%)Voluntary (5%)
Maintained
(35%)
PricewaterhouseCoopers LLP
Page 16
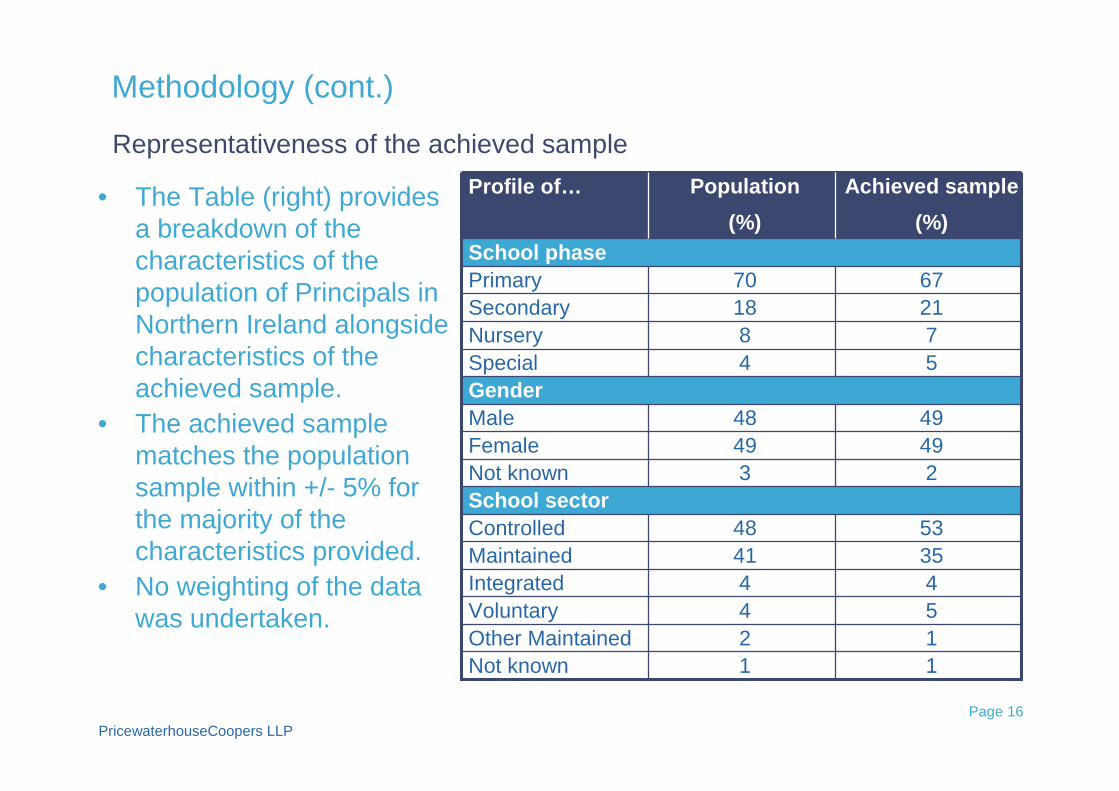
Representativeness of the achieved sample
• The Table (right) providesa breakdown of thecharacteristics of thepopulation of Principals inNorthern Ireland alongsidecharacteristics of theachieved sample.
• The achieved samplematches the populationsample within +/- 5% forthe majority of thecharacteristics provided.
• No weighting of the datawas undertaken.
Methodology (cont.)
54Voluntary
12Other Maintained
11Not known
5348Controlled
3541Maintained
44Integrated
4948Male
4949Female
23Not known
School sector
Gender
54Special
78Nursery
2118Secondary
6770Primary
School phase
Achieved sample
(%)
Population
(%)
Profile of…

PricewaterhouseCoopers LLP
Page 17
Technical notes1. Our analysis by school phase includes primary, secondary, special and nursery.
Responses from grammar schools have been included under ‘secondary’.
2. The total number of surveys distributed was 1,263. This figure excludes a total of26 responses which, for various reasons (e.g. retirement of the school Principal),were returned incomplete.
3. A response from one of the schools did not correspond to one category of schoolphase or school sector. The frequencies and analysis by school phase and schoolsector, therefore, exclude this response.
4. Totals may not sum to exactly 100% in the Tables and Figures illustrated in thisreport, due to rounding.
5. The base provided in each of the Tables and/or Figures refers to the total numberof responses to that particular question.
6. Based on the number of responses achieved (725), the confidence interval at 95%level is calculated to be +/-2.44%. This means if, in our sample of headteachers,for example, 57% felt that they had adequate opportunities for professionaldevelopment, we can be 95% certain that the true percentage of headteacherswho had adequate opportunities for professional development would lie between54.56% and 59.44%. The confidence interval in this study is therefore narrow (lessthan +/-5%) suggesting that the results are reliable and robust.

Responses tosurvey
questions
a. Roles & Responsibilities
b. Staffing Structures
c. Pay & Conditions
d. Extended Service Provision &
Collaboration

a. Roles and Responsibilities

PricewaterhouseCoopers LLP
Page 20
As of 1st September 2006, how many years have you been a Principal in thisschool?
•11% of respondents inSecondary schools havebeen Principal of thesame school for over tenyears, compared to anoverall average of 27%for Special and 40% forNursery schools.
•8% of respondents inVoluntary schools havebeen Principal of thesame school for over tenyears in comparison to31% in Controlledschools.
2-5 years (29%)
11-20 years
(21%)
6-10 years
(27%)
Less than 2
years (18%)
Base: 725
More than 20 years
(6%)

PricewaterhouseCoopers LLP
Page 21
As of 1st September 2006, how many years have you been a Principal in total?
•Nursery schools havethe most experiencedPrincipals: 44% havebeen Principal for overten years, compared to16% of SecondaryPrincipals.
•55% of Voluntaryschools respondentshave spent between sixand ten years as aPrincipal, compared toan average of 26%.
2-5 years (24%)
11-20 years
(26%)
More than 20
years (9%)
Less than 2
years (14%)
Base: 725 6-10 years (26%)

PricewaterhouseCoopers LLP
Page 22
As of 1st September 2006, how many years in total have you been teaching?
•Although Secondaryrespondents have theleast Principalexperience comparedwith other sectors, theyhave the most teachingexperience.
•69% of all respondentshave been teaching forover 20 years; thisfigure increases to 89%for SecondaryPrincipals.
More than 20
years (69%)
11-20 years
(27%)
6-10 years
(3%)
Base: 725
Less than 2 years
(1%)

PricewaterhouseCoopers LLP
Page 23
On average, how many hours, if any, do you spend teaching per week intimetabled lessons?
•44% of female Principals teach more than 20 hours per week in timetabled lessons,compared to 19% of their male counterparts.
•In England and Wales, 4% of Nursery Heads spend more than 20 hours per week intimetabled lessons, compared to 91% in NI.
4
31
63
37
10
6
14
31
31
7
5
17
38
0 10 20 30 40 50 60 70
More than 20 hours
11-20 hours
5-10 hours
Few er than 5 hours
No time at all
% of Principals
Overall
Primary
Secondary
Overall n = 725, Primary n = 488, Secondary n = 150

PricewaterhouseCoopers LLP
Page 24
On average, how many hours, if any, do you spend teaching per week coveringlessons?
0
1
49
51
6
0
7
36
50
5
0
5
36
54
0 10 20 30 40 50 60
More than 20 hours
11-20 hours
5-10 hours
Few er than 5 hours
No time at all
% of Principals
Overall
Primary
Secondary
Overall n = 725, Primary n = 488, Secondary n = 150
* Norespondents
selected 11-20hours

PricewaterhouseCoopers LLP
Page 25
•The most time-consuming task for all Headteachers in England and Wales isaccountability; e.g.88% for Secondary Heads compared to 57% in NI.
•17% of Nursery Heads in England and Wales spend a lot of time teaching, comparedto 81% in NI.
On average, which five tasks take up most of your time as a Principal over theschool year?
Primary Secondary Overall
Responsibility for pupils w ellbeing 58% 58% 56%
Leading teaching and learning 51% 51% 52%
Accountability 48% 57% 49%
Implementing new ideas/initiatives 43% 47% 42%
Curriculum implementation 42% 35% 40%
Monitoring and evaluation 33% 47% 39%
Management of teachers 33% 66% 39%
Teaching 47% 1% 38%
Finance 38% 27% 34%
School improvement planning 20% 35% 23%
SEN 20% 3% 19%
Management of support staff 17% 8% 16%
Liaising w ith my Employing Authority 17% 11% 16%
Directing extended services 16% 5% 13%
Strategic vision 4% 22% 8%
Staff recruitment and retention 4% 20% 8%
Timetabling 0% 3% 1%
Overall n = 724, Primary n = 488, Secondary n = 150

PricewaterhouseCoopers LLP
Page 26
•53% of Nursery school Principals regard teaching as an important activity, comparedto 15% overall.
•Headteachers is England and Wales are more concerned about strategic vision thantheir NI counterparts; e.g.72% of Secondary Heads in England and Wales consider itas an important task, compared to 41% in NI.
In your opinion, which three tasks should be your most important activities as aPrincipal over the school year?
Primary Secondary Overall
Leading teaching and learning 76% 77% 75%
Responsibility for pupils w ellbeing 40% 29% 37%
Monitoring and evaluation 35% 41% 36%
Strategic vision 28% 41% 30%
Curriculum implementation 27% 9% 23%
School improvement planning 23% 29% 22%
Accountability 16% 31% 20%
Teaching 17% 0% 15%
Implementing new ideas/initiatives 14% 16% 15%
Management of teachers 10% 13% 10%
Finance 6% 4% 5%
SEN 2% 0% 3%
Other 2% 1% 3%
Staff recruitment and retention 0% 5% 1%
Overall n = 724, Primary n = 488, Secondary n = 150

PricewaterhouseCoopers LLP
Page 27
•Pupils’ achievement is the main source of satisfaction for all respondents.
•Setting strategic vision provides greater satisfaction to Nursery Heads inEngland and Wales than to their NI equivalent; 41% and 13% respectively.
Which three aspects of your role as school Principal give you the mostsatisfaction?
Primary Secondary Overall
Seeing children achieve 92% 91% 92%
Developing staff 57% 70% 60%
Introducing new ideas 33% 25% 32%
Setting strategic vision 23% 35% 25%
Improving results 24% 30% 23%
Meeting school improvement targets 20% 22% 21%
Regular teaching commitment 23% 2% 19%
Working w ith individual pupils 11% 12% 12%
Involvement in extra curricular activities 9% 5% 7%
Happiness/contentment of children 2% 1% 3%
Helping other schools improve 2% 1% 2%
Overall n = 724, Primary n = 488, Secondary n = 150

PricewaterhouseCoopers LLP
Page 28
•38% of Integrated school Principals regard managing change as theirbiggest challenge.
In the first term of the 2006/07 academic year, what was the biggest challengeyou faced in improving your school?
Primary Secondary Overall
Managing staff, parents and pupils 25% 23% 24%
Implementation of Revised Curriculum 20% 20% 19%
Managing Change 14% 24% 17%
Resourcing 11% 4% 9%
Extended Schools 8% 2% 8%
Other 5% 12% 7%
Strategic Direction 6% 8% 7%
School Finances 6% 4% 5%
School Inspection 3% 3% 3%
Bureaucracy 3% 1% 2%
Overall n = 678, Primary n = 453, Secondary n = 142

PricewaterhouseCoopers LLP
Page 29
No (58%)
Yes (42%)
Base: 725
•52% of Special school Principals haveexternal roles.
•62% of Voluntary school Principals haveexternal roles.
As a Principal do you currently have any external roles?
18
13
14
13
33
7
28
15
11
13
18
16
31
20
17
10
14
17
21
22
23
0 5 10 15 20 25 30 35
Other
Involvement in religious organisations
Involvement in an inspection/ assessment organisation
Involvement in local clubs/ the local community
Involvement in initiatives and associations for Principals/ Leaders
Involvement in school board/school committees/other school activities
Involvement w ith DE and other education partners
% of Principals
Overall
Primary
Secondary
Overall n = 302, Primary n = 188, Secondary n = 72
•38% of Integrated respondentsare involved in Principal initiativesand associations.
•25% of Maintained Principalshave external roles in religiousorganisations.
Others include:
•Union Representative: 9respondents
•Early Years Team: 8 respondents
If yes, what are they?

PricewaterhouseCoopers LLP
Page 30
•Nursery school Principals are the most positive about the benefits of external roles;68% regard them as “very beneficial” for their school.
•67% of female Principals regard external roles as “very beneficial”, compared to 48%of their male counterparts.
How much do these external roles benefit your school?
1
3
6
35
55
1
4
8
32
55
1
3
6
33
56
0 10 20 30 40 50 60
Not at all beneficial
Not very beneficial
Neither/Nor
Quite beneficial
Very beneficial
% of Principals
Overall
Primary
Secondary
Base: 298

b. Staffing Structures

PricewaterhouseCoopers LLP
Page 32
•73% of Secondary school Principals have 5 or more members of staff on theirSLT, compared to an average of 28%.
Including you, how many members of staff are on your senior leadership team?
1
1
1
2
4
8
11
16
22
15
13
7
0 5 10 15 20 25
More than ten
Ten
Nine
Eight
Seven
Six
Five
Four
Three
Two
One
None
% of PrincipalsBase: 703

PricewaterhouseCoopers LLP
Page 33
•16% of Secondary school Principals have one member of the SLT who does not haveQualified Teacher Status.
•Integrated school Principals (27%) and Voluntary school Principals (26%) are the mostlikely to have at least one SLT member who does not have Qualified Teacher Status.
How many members of the senior leadership team do not have QualifiedTeacher Status?
0
16
84
0
1
98
1
5
93
0 20 40 60 80 100
Two
One
None
%of Principals
Overall
Primary
Secondary
Base: 673

PricewaterhouseCoopers LLP
Page 34
What is the position of the person who mostly manages the …
...curriculum on a day-to-day basis?
1
9
66
23
5
4
16
76
4
5
27
65
0 20 40 60 80 100
Others
Senior Teacher
Vice Principal
Principal
% of Principals
Overall
Primary
Secondary
Overall n = 714, Primary n = 480, Secondary n = 149
...performance reviews and staff development of teachers on a day-
to-day basis?
5
14
26
55
1
1
3
94
2
4
8
86
0 20 40 60 80 100
Others
Senior Teacher
Vice Principal
Principal
% of Principals
Overall
Primary
Secondary
Overall n = 715, Primary n = 482, Secondary n = 148

PricewaterhouseCoopers LLP
Page 35
What is the position of the person who mostly manages the…
...performace reviews and staff development of support staff on a
day-to-day basis?
6
15
17
13
18
31
12
1
4
10
73
10
4
4
6
12
64
0 20 40 60 80
Not applicable
Others
Bursar
Senior Teacher
Vice Principal
Principal
% of Principals
Overall
Primary
Secondary
Overall n = 706, Primary n = 479, Secondary n = 144
...SEN on a day-to-day basis?
79
12
7
2
58
4
13
25
1
57
5
11
26
0 20 40 60 80 100
Others
SENCO
Senior Teacher
Vice Principal
Principal
% of Principals
Overall
Primary
Secondary
Overall n = 716, Primary n = 483, Secondary n = 149

PricewaterhouseCoopers LLP
Page 36
What is the position of the person who mostly manages the…
...school budget on a day-to-day basis?
9
34
14
43
1
2
1
95
3
8
5
83
0 20 40 60 80 100
Others
Bursar
Vice Principal
Principal
% of Principals
Overall
Primary
Secondary
Overall n = 718, Primary n = 484, Secondary n = 149
...extended services on a day-to-day basis?
36
8
1
12
14
29
21
7
3
4
64
23
6
5
7
58
0 10 20 30 40 50 60 70
Not currently offering extended
services
Others
No one in particular
Senior Teacher
Vice Principal
Principal
% of Principals
Overall
Primary
Secondary
Overall n = 707, Primary n = 477, Secondary n = 146

PricewaterhouseCoopers LLP
Page 37
•75% of Voluntary school Principals believe that leadership is “very” or “totally”distributed, compared to an average of 33%.
•66% of Nursery school Principals in NI regard leadership as “not at all” or “not very”distributed”, compared to 27% of Nursery Heads in England and Wales.
To what extent is leadership distributed in your school?
5
50
40
4
1
2
25
48
17
7
4
29
44
15
8
0 10 20 30 40 50 60
Totally distributed
Very distributed
Somewhat
distributed
Not very distributed
Not at all distributed
% of Principals
Overall
Primary
Secondary
Overall n = 716, Primary n = 482, Secondary n = 149

PricewaterhouseCoopers LLP
Page 38
•98% of Voluntary school Principals consider distributed leadership in their schools as“effective” or “very effective”, compared to an overall average of 76%.
How effective is distributed leadership in your school?
21
68
5
5
1
16
56
13
12
3
19
57
11
10
2
0 20 40 60 80
Very effective
Quite effective
Neither
Quite ineffective
Not at all
effective
% of Principals
Overall
Primary
Secondary
Overall n = 647, Primary n = 440, Secondary n = 146

PricewaterhouseCoopers LLP
Page 39
•Voluntary Schools Principalsare the most satisfied with theexpertise of their SLT: 62%have identified no gaps.
Have you identified any gaps in terms of expertise in your school leadershipteam?
Yes (59%)
No (41%)
Base: 715

PricewaterhouseCoopers LLP
Page 40
•All respondents, regardless of sector, status or gender, have identified similar gaps in expertise inthe SLT.
•All respondents in England and Wales identify the development and management of extendedservices as the main gap; e.g. 32% of Secondary Heads compared to 16% of NI SecondaryPrincipals.
What is the main gap that you have identified?
6
6
6
6
9
10
13
16
19
0 5 10 15 20
Others
Lack of time and resources
SENCO (Special Educational Needs Coordinator)
Management of teachers
Curriculum
Business development
Development and management of extended services
Finance
Change management
% of PrincipalsBase: 416
Others include:
Management ofsupport staff: 5%
Communication skills:4%

PricewaterhouseCoopers LLP
Page 41
•37% of female Principals intend to provide additional training for the SLT, compared to 59% ofmale Principals.
•14% of Nursery Heads in England and Wales consider that the DfES should be addressing thegap, compared to 38% of NI Nursery Principals who identify this as a task for DE.
How will you address or how have you addressed this gap?
13
21
28
32
32
48
0 10 20 30 40 50 60
Additional recruitment of staff
The Department of Education should be addressing these gaps
for us
Do not have the financial resources to do anything
Additional training for yourself
Additional training for other staff
Additional training for members of the Senior Leadership Team
% of PrincipalsBase: 420

PricewaterhouseCoopers LLP
Page 42
•Special school Principals are the most likely to advocate a complete changein structure of their SLT.
In your opinion, what should the composition of your senior leadership team looklike in 5 -10 years?
19
67
13
32
51
17
30
54
16
0 20 40 60 80
Same as it is
now
Some changes
required
Complete
change instructure
% of Principals
Overall
Primary
Secondary
Overall n = 715, Primary n = 482, Secondary n = 149

PricewaterhouseCoopers LLP
Page 43
•43% of Special school Principals consider renegotiation and redistribution ofresponsibilities as the most important change.
What is the most important change you could make in terms of personnel orimproving your teams skills to achieve this new composition?
8
10
11
21
24
24
0 5 10 15 20 25 30
Don't know
Other
Extend/amend structure
of SMT
Development/training of
existing staff
Extra staff with new
skills/ new position
Renegotiate/ re-distribute
roles & responsibilities
% of PrincipalsBase: 501
Other includes:
Become a non-teachingPrincipal: 16 respondents
More time for SLT onstrategic issues: 9respondents

c. Pay and Conditions

PricewaterhouseCoopers LLP
Page 45
•49% of male Principals earn more than £50,000 per annum, compared to 25% offemale Principals.
•51% of Secondary Heads in England and Wales earn more than £70,000 p.a.compared to 17% of NI Secondary Principals.
Can you please indicate your current salary band?
17
34
38
9
0
0
2
22
66
4
25
54
7
9
9
0 10 20 30 40 50 60 70
£70,000 or greater
£60,000-£69,999
£50,000-£59,999
£40,000-£49,999
Less than £40,000
% of Principals
Overall
Primary
Secondary
Overall n = 724, Primary n = 488, Secondary n = 150
PricewaterhouseCoopers LLP
Page 46
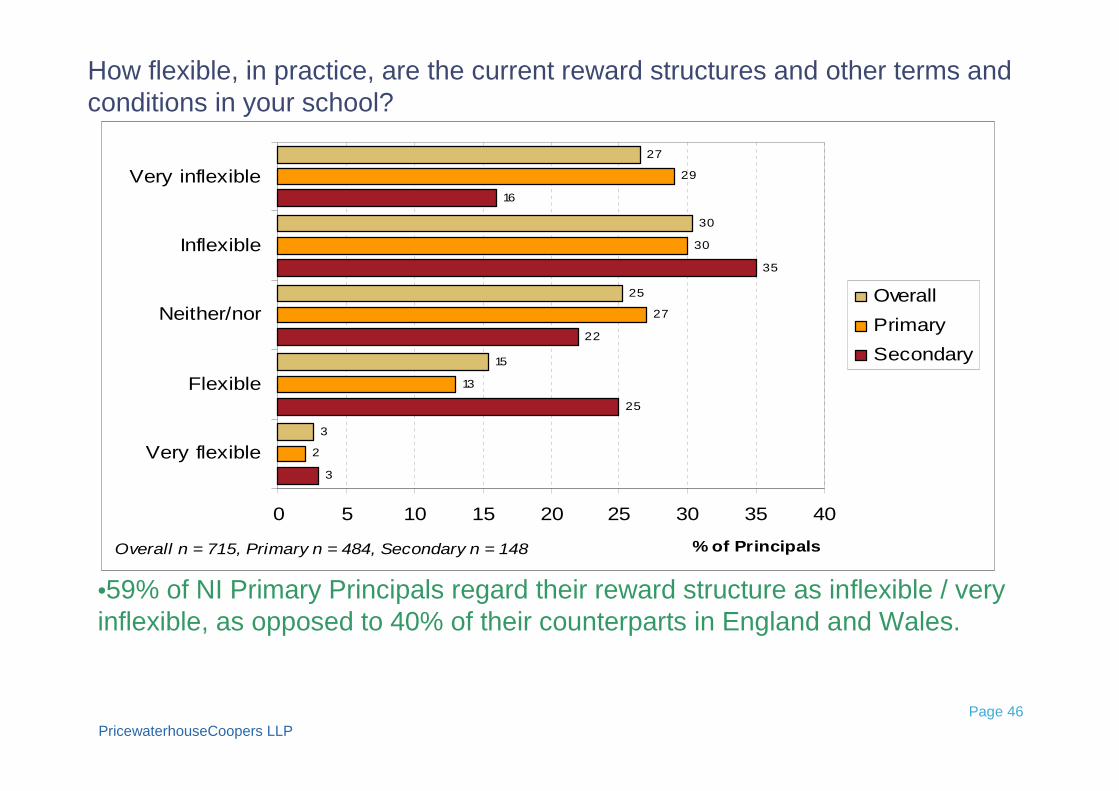
•59% of NI Primary Principals regard their reward structure as inflexible / veryinflexible, as opposed to 40% of their counterparts in England and Wales.
How flexible, in practice, are the current reward structures and other terms andconditions in your school?
3
25
22
35
16
2
13
27
30
29
3
15
25
30
27
0 5 10 15 20 25 30 35 40
Very flexible
Flexible
Neither/nor
Inflexible
Very inflexible
% of Principals
Overall
Primary
Secondary
Overall n = 715, Primary n = 484, Secondary n = 148

PricewaterhouseCoopers LLP
Page 47
•69% of Secondary Heads in England and Wales describe their work-life balance as(very) poor, compared with 56% of Secondary Principals in Northern Ireland.
How would you describe your work-life balance?
2
17
25
38
18
1
14
18
40
27
2
15
20
39
25
0 10 20 30 40 50
Very Good
Good
Neither/nor
Poor
Very poor
% of Principals
Overall
Primary
Secondary
Base: 723

PricewaterhouseCoopers LLP
Page 48
•Nursery school Principals are the least enthusiastic about delegating themanagement of support staff.
Thinking about the work you have undertaken in the last year, whatresponsibilities currently in your job description would you delegate if possible?
Primary Secondary Overall
Management of support staff 38% 35% 36%
Finance 33% 36% 35%
Directing extended services 33% 29% 33%
Curriculum implementation 25% 28% 25%
SEN 26% 9% 24%
Monitoring and evaluation 23% 21% 21%
Teaching 23% 5% 19%
Implementing new ideas/initiatives 15% 14% 14%
Timetabling 11% 17% 12%
Leading teaching and learning 11% 11% 11%
Responsibility for pupils w ellbeing 8% 10% 8%
Accountability 8% 7% 8%
Liaising w ith my Employing Authority 7% 7% 7%
Staff recruitment and retention 7% 3% 6%
School improvement planning 5% 9% 5%
Management of teachers 3% 6% 4%
Strategic vision 0% 1% 1%
Overall n = 724, Primary n = 488, Secondary n = 150

PricewaterhouseCoopers LLP
Page 49
•46% of Secondary school Principals regard lack of skilled / trained staff as abarrier.
What are the barriers, if any, to delegating these responsibilities?
(All who would delegate management of support staff if possible)
1
6
8
26
32
33
34
0 5 10 15 20 25 30 35 40
Nothing in particular
Other
Lack of support from the
Governing Body
Small school so delegation
is not a realistic option
Cannot match reward to
delegation
Legal requirements on
Principal
Lack of skilled/trained staff
% of PrincipalsBase: 262

PricewaterhouseCoopers LLP
Page 50
•50% of Secondary school Principals identify the lack of skilled / trained staff as abarrier.
•19% of Maintained school Principals identify the lack of skilled / trained staff as abarrier.
What are the barriers, if any, to delegating these responsibilities?
(All who would delegate finance if possible)
4
5
26
28
33
35
0 5 10 15 20 25 30 35 40
Other
Lack of support from the
Governing Body
Cannot match reward to
delegation
Lack of skilled/trained staff
Legal requirements on
Principal
Small school so delegation
is not a realistic option
% of PrincipalsBase: 251

PricewaterhouseCoopers LLP
Page 51
•42% of Secondary school Principals cite lack of skilled / trained staff as abarrier.
What are the barriers, if any, to delegating these responsibilities?
(All who would delegate directing extended services if possible)
1
10
5
31
31
32
34
0 5 10 15 20 25 30 35 40
Nothing in particular
Other
Lack of support from the Governing Body
Lack of skilled/trained staff
Legal requirements on Principal
Small school so delegation is not a realistic option
Cannot match reward to delegation
% of PrincipalsBase: 238

PricewaterhouseCoopers LLP
Page 52
•48% of Secondary school Principals regard the legal requirements on thePrincipal as a barrier.
What are the barriers, if any, to delegating these responsibilities?
(All who would delegate curriculum implementation if possible)
1
5
10
28
29
30
31
0 5 10 15 20 25 30 35
Nothing in particular
Other
Lack of support from the
Governing Body
Lack of skilled/trained staff
Small school so delegation
is not a realistic option
Legal requirements on
Principal
Cannot match reward to
delegation
% of PrincipalsBase: 181
PricewaterhouseCoopers LLP
Page 53
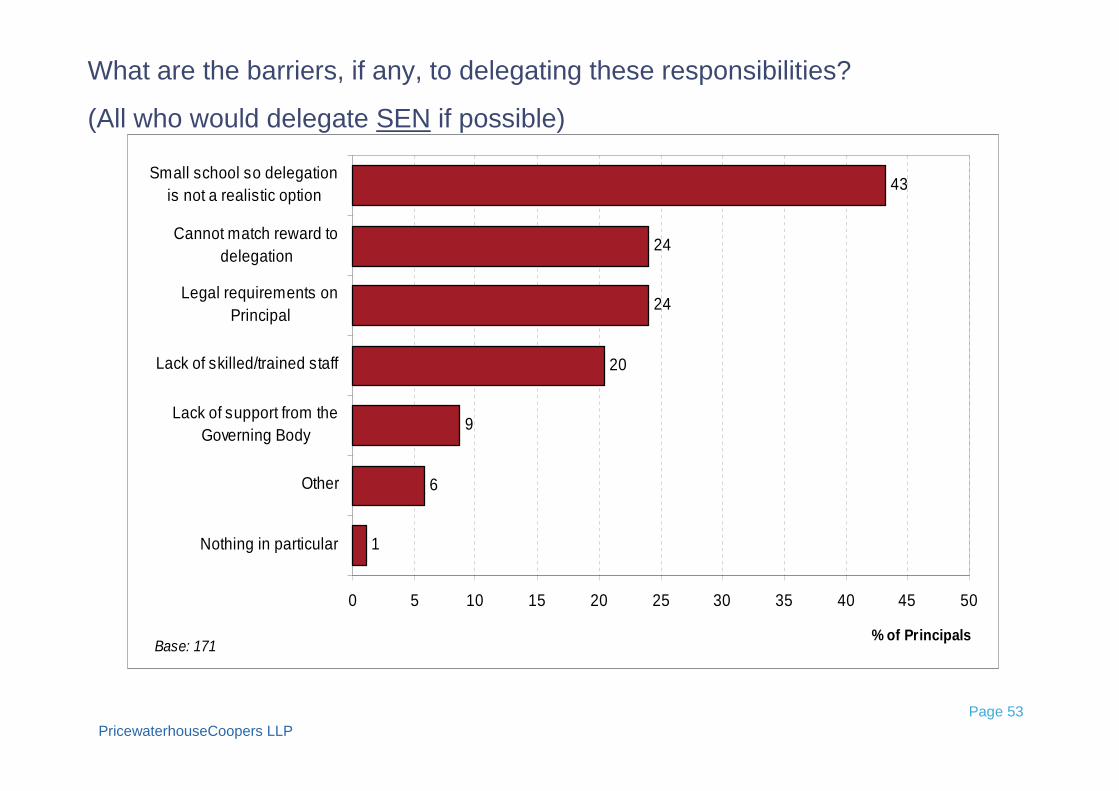
What are the barriers, if any, to delegating these responsibilities?
(All who would delegate SEN if possible)
1
6
9
20
24
24
43
0 5 10 15 20 25 30 35 40 45 50
Nothing in particular
Other
Lack of support from the
Governing Body
Lack of skilled/trained staff
Legal requirements on
Principal
Cannot match reward to
delegation
Small school so delegation
is not a realistic option
% of PrincipalsBase: 171
PricewaterhouseCoopers LLP
Page 54
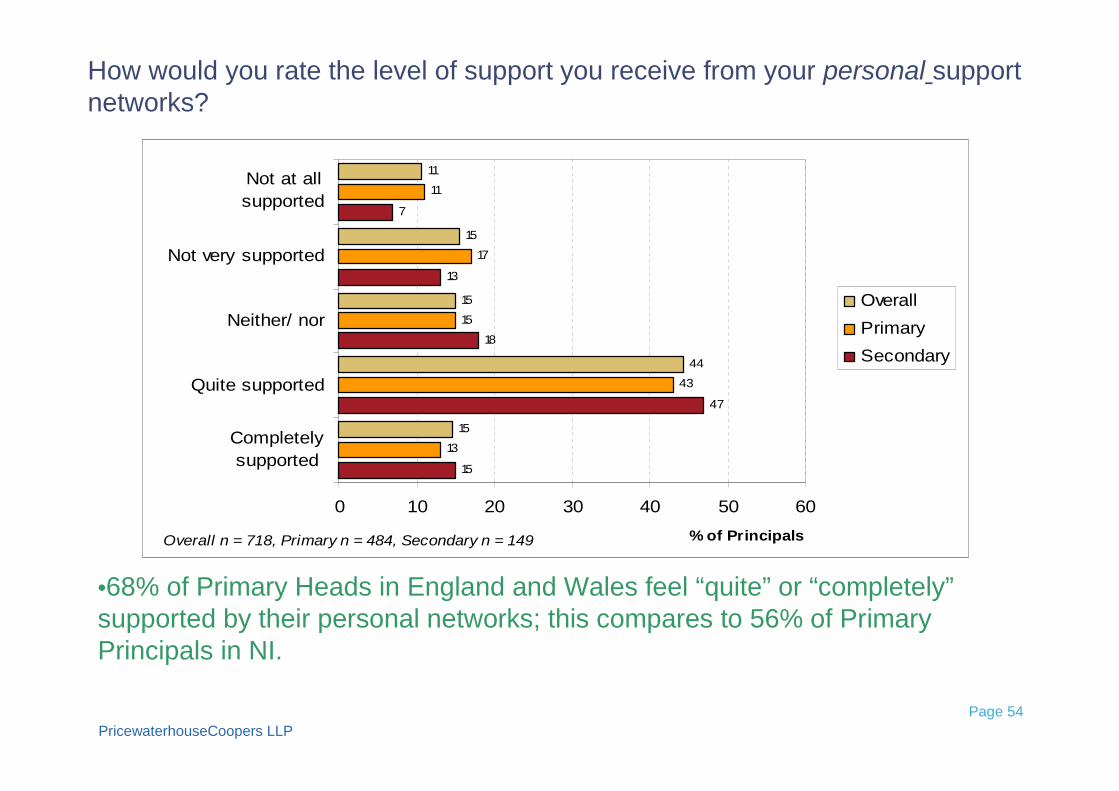
•68% of Primary Heads in England and Wales feel “quite” or “completely”supported by their personal networks; this compares to 56% of PrimaryPrincipals in NI.
How would you rate the level of support you receive from your personal supportnetworks?
15
47
18
13
7
13
43
15
17
11
15
44
15
15
11
0 10 20 30 40 50 60
Completely
supported
Quite supported
Neither/ nor
Not very supported
Not at all
supported
% of Principals
Overall
Primary
Secondary
Overall n = 718, Primary n = 484, Secondary n = 149
PricewaterhouseCoopers LLP
Page 55
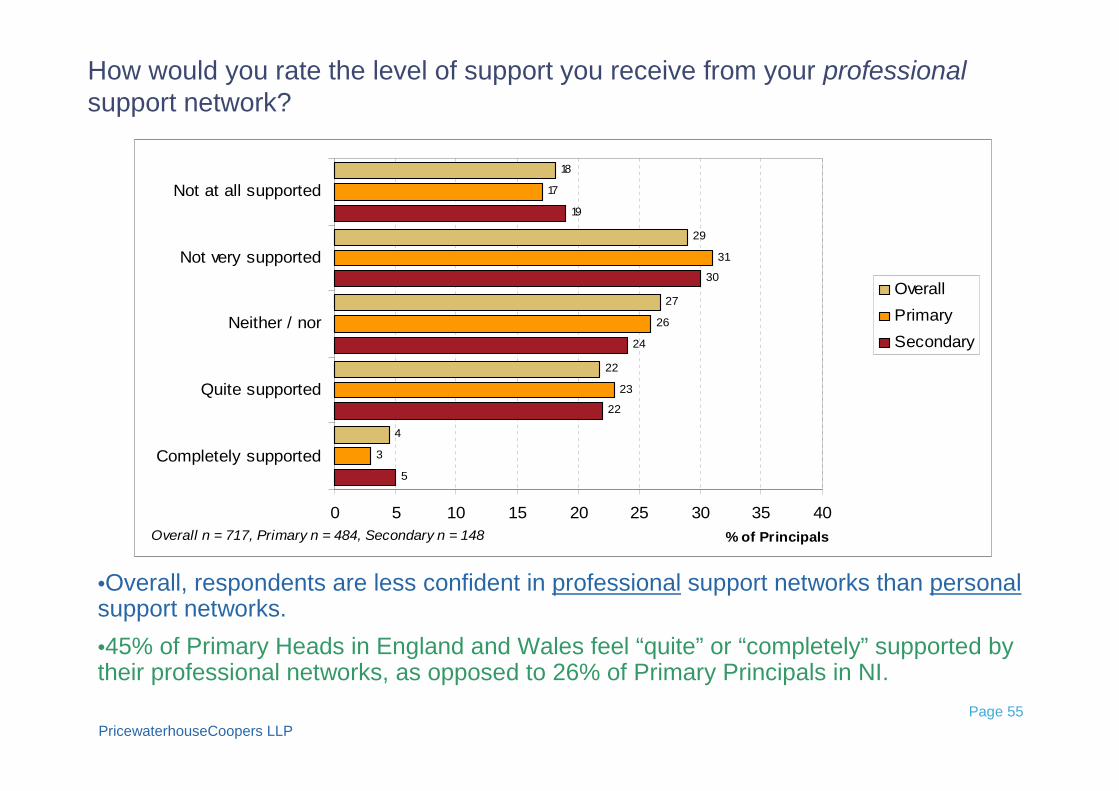
•Overall, respondents are less confident in professional support networks than personalsupport networks.
•45% of Primary Heads in England and Wales feel “quite” or “completely” supported bytheir professional networks, as opposed to 26% of Primary Principals in NI.
How would you rate the level of support you receive from your professionalsupport network?
5
22
24
30
19
3
23
26
31
17
4
22
27
29
18
0 5 10 15 20 25 30 35 40
Completely supported
Quite supported
Neither / nor
Not very supported
Not at all supported
% of Principals
Overall
Primary
Secondary
Overall n = 717, Primary n = 484, Secondary n = 148

PricewaterhouseCoopers LLP
Page 56
•55% of Principals responded that they had received Leadership /Management training over the past 3 years.
•20% of Principals stated ‘Nothing in particular’ to training they hadreceived , therefore 80% have received some form of training.
List the training you have received over the past three years
21
7
3
7
13
25
67
20
9
8
19
17
38
54
20
8
8
15
17
34
55
0 10 20 30 40 50 60 70
Nothing in particular
Financial management /
budgeting
Special Educational Needs
ICT (incl C2K)
Pupil Welfare (incl Child
Protection)
Revised Curriculum
Leadership / Management
training
% of Principals
Overall
Primary
Secondary
Overall n = 724, Primary n = 488, Secondary n = 150

PricewaterhouseCoopers LLP
Page 57
•28% of Integrated school Principals remain in their post for the success of the school.
•27% of Nursery Heads in England and Wales mention making a contribution to thecommunity as a factor; this compares to 13% of NI Nursery Principals.
Which one factor has the most influence on keeping you in your post?
Primary Secondary Overall
Contact w ith pupils 21% 17% 21%
Personal challenge 19% 25% 19%
Success of the school 16% 19% 17%
Making a contribution to the community 13% 15% 13%
Relationship w ith colleagues 6% 5% 6%
Other 5% 6% 5%
Rew ard 5% 3% 5%
Reputation of the school 3% 4% 3%
Job satisfaction 3% 2% 3%
Content of w ork 2% 1% 2%
Nothing in particular 2% 3% 2%
Regular teaching commitment 2% 0% 2%
Location of the school 2% 1% 2%
Personal autonomy 1% 0% 1%
Overall n = 720, Primary n = 486, Secondary n = 149

d. Extended Service Provision and Collaboration

PricewaterhouseCoopers LLP
Page 59
•74% of Primary Heads in England and Wales offer “some” extended services,compared 44% of their NI counterparts.
•74% of Secondary Heads in England and Wales offer “some” extended services,compared 42% of their NI counterparts.
Does your school offer extended services?
46
42
12
41
44
15
40
46
14
0 10 20 30 40 50
No
Yes we provide
some services
Yes we provide a
full range of
extended services
% of Principals
Overall
Primary
Secondary
Overall n = 719, Primary n = 485, Secondary n = 149

PricewaterhouseCoopers LLP
Page 60
How effective do you think extended services will be in terms of pupils…
4
3
2
1
2
1
16
12
11
7
5
3
42
32
33
21
15
14
31
40
43
51
56
55
7
13
11
21
22
27
0% 20% 40% 60% 80% 100%
...experiencing economic and
environmental w ellbeing?
...living in a society w hich
respects their rights?
...living in safety and w ith
stability?
...contributing positively to
community and society?
...being healthy?
...enjoying, learning and
achieving?
Not at all effective Not very effective Neither/ nor Quite effective Very effectiveBase: 409 - 426

PricewaterhouseCoopers LLP
Page 61
Which of the following collaboration arrangements best describes your schoolslinks with other schools?
7
40
52
6
61
32
6
56
38
0 10 20 30 40 50 60 70
No collaboration
Loose informal
collaboration
Formal
collaboration
% of Principals
Overall
Primary
Secondary
Overall n = 719, Primary n = 485, Secondary n = 148

PricewaterhouseCoopers LLP
Page 62
What is the biggest benefit for your school from this collaboration?
Primary Secondary Overall
Smoother transition of pupils from feeder schools 17% 8% 17%
Better entitlement for 14-19 year olds 0% 57% 14%
More sports and arts activities 19% 2% 13%
More extended services 14% 4% 11%
Improved curriculum 11% 14% 11%
Training and development for staff 10% 5% 8%
Development of ow n staff from supporting other schools 8% 2% 7%
Other 6% 1% 6%
Better strategic leadership 5% 2% 5%
There are no benefits 4% 3% 4%
Improved community relations/cross community relations 4% 2% 4%
Overall n = 665, Primary n = 448, Secondary n = 136
PricewaterhouseCoopers LLP
Page 63
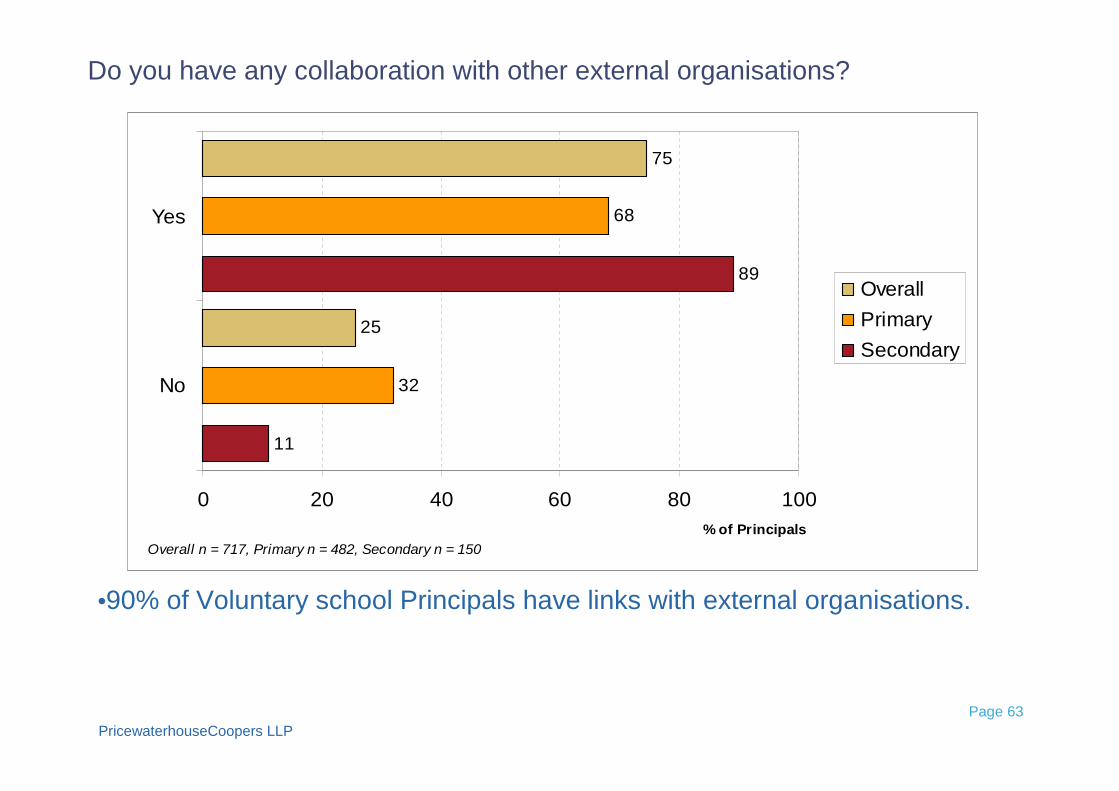
•90% of Voluntary school Principals have links with external organisations.
Do you have any collaboration with other external organisations?
11
89
32
68
25
75
0 20 40 60 80 100
No
Yes
% of Principals
Overall
Primary
Secondary
Overall n = 717, Primary n = 482, Secondary n = 150

PricewaterhouseCoopers LLP
Page 64
•73% of female Principals collaborate with Health and Social Care providers /professionals; this compares with 59% of male Principals.
•65% of Secondary Heads in England and Wales have links with the BusinessCommunity, as opposed to 41% of Secondary Principals in NI.
What are these collaborations?
Primary Secondary Overall
Health and social care providers/professionals 66% 50% 65%
Further Education 37% 79% 51%
Other training providers 39% 36% 39%
The business community 41% 41% 38%
The voluntary sector/not-for-profit organisations 40% 22% 34%
Higher Education 26% 43% 32%
Childcare providers 34% 9% 28%
Career services 6% 78% 28%
Others 12% 4% 9%
Overall n = 534, Primary n = 326, Secondary n = 133

PricewaterhouseCoopers LLP
Page 65
Are there any other comments you would like to make regarding the future ofschool leadership in Northern Ireland?
Primary Secondary Nursery Special Overall
Excessive w orkload / poor w orklife balance 43% 21% 30% 21% 37%
Improved access to training / more support from
government parents and staff 20% 19% 13% 24% 20%
Insufficient resources to implement change 15% 3% 11% 6% 12%
The pace / uncertainty of change is having an impact
on school leadership 8% 11% 2% 12% 8%
Need high quality leadership w hich is involved more in
decision making 6% 13% 4% 6% 8%
Salaries should be improved 3% 5% 8% 3% 3%
All schools/pupils should be treated equally 3% 3% 2% 3% 3%
Other 4% 8% 0% 0% 4%
Overall n 488 150 53 33 725

This Report has been prepared for and only for the Regional Training Unit (RTU) in accordance with our letter of engagement dated 21st May 2007and for no other party and/or purpose. We do not accept or assume any liability or duty of care for any other purpose or to any other person to whomthis Report is shown or into whose hands it may come save where expressly agreed by our prior consent in writing. Proposals, tenders, reportstogether with working papers and similar documents, whether interim or final and other deliverables submitted by PricewaterhouseCoopers LLP,contain methodologies, models, pricing information and other materials and work product, which are proprietary and confidential toPricewaterhouseCoopers LLP, or which have been provided to PricewaterhouseCoopers LLP by third parties who may have made such informationavailable on foot of confidentiality agreements, either written, implied, or under the law of confidence. PricewaterhouseCoopers LLP clearly identifiesall such proposals, tenders, reports and other deliverables as protected under the copyright laws of the United Kingdom and other countries. Suchdocuments, presentations and materials are submitted on the condition that they shall not be disclosed outside the recipient’s organisation, orduplicated, used or disclosed in whole or in part by the recipient for any purpose other than that for which they were specifically procured, pursuant toour engagement letter. In the event that, pursuant to a request which the RTU has received under the Freedom of Information Act 2000, it is requiredto disclose any information contained in the proposal or any deliverable prepared by us, it will notify PwC promptly and consult with PwC prior todisclosing such information. The RTU agrees to pay due regard to any representations which PwC may make in connection with such disclosures andthe RTU shall apply any relevant exemptions which may exist under the Act to such information.
© 2007 PricewaterhouseCoopers LLP. All rights reserved. 'PricewaterhouseCoopers' refers to PricewaterhouseCoopers LLP (a limited liabilitypartnership in the United Kingdom) or, as the context requires, other member firms of PricewaterhouseCoopers International Limited, each of which isa separate and independent legal entity.