Regional School District - New Jersey · 2019. 2. 6. · Certificate of Excellence FINANCIAL...
154
Hopewell Valley Regional School District Hopewell Valley Regional Board of Education Pennington, New Jersey 08534 Comprehensive Annual Financial Report For the Fiscal Year Ended June 30, 2018
Transcript of Regional School District - New Jersey · 2019. 2. 6. · Certificate of Excellence FINANCIAL...

Hopewell Valley Regional School District
Hopewell Valley Regional Board of Education Pennington, New Jersey 08534
Comprehensive Annual Financial Report For the Fiscal Year Ended June 30, 2018

Hopewell Valley Regional School District
Comprehensive Annual Financial Report For the Fiscal Year Ended June 30, 2018
Hopewell Valley Regional School District Pennington, New Jersey
Prepared by Hopewell Valley Regional School District Business Office Robert Colavita
Business Administrator, Board Secretary

INTRODUCTORY SECTION
Letter of Transmittal Organizational Chart Roster of Officials
Table of Contents
Independent Auditors and Advisors Certificate of Excellence
FINANCIAL SECTION
Independent Auditors' Report
Required Supplementary Information - Part I Management's Discussion and Analysis
Basic Financial Statements Government-wide Financial Statements:
A-1 Statement of Net Position A-2 Statement of Activities
Fund Financial Statements:
Governmental Funds:
Page
1 7 8 9
10
11
14
22 23
B-1 Balance Sheet 24 B-2 Statement of Revenues, Expenditures, and Changes in Fund Balances 25 B-3 Reconciliation of the Statement of Revenues, Expenditures and Changes
in Fund Balances of Governmental Funds to the Statement of Activities 26 Proprietary Funds:
B-4 Combining Statement of Net Position 27 B-5 Combining Statement of Revenues, Expenses and Changes in Fund Net
Position 28 B-6 Combining Statement of Cash Flows 29
Fiduciary Funds: B-7 Statement of Fiduciary Net Position 30 B-8 Statement of Changes in Fiduciary Net Position 31
Notes to the Basic Financial Statements 32'
(i)
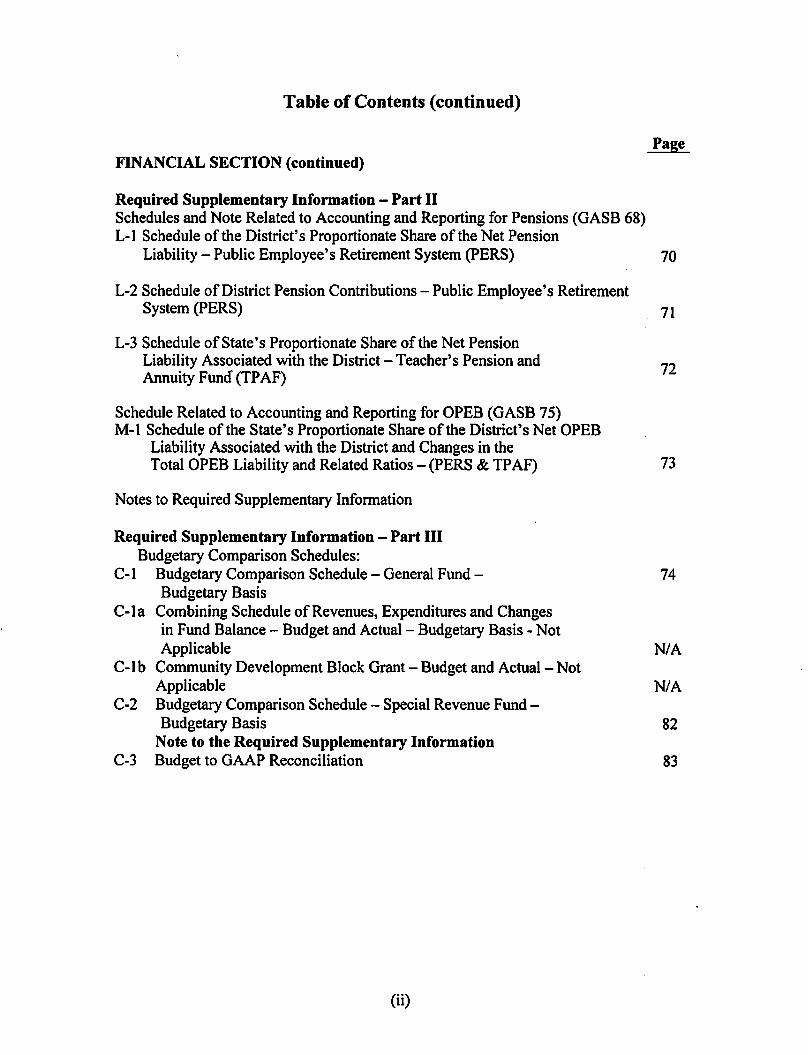
Table of Contents (continued)
FINANCIAL SECTION (continued)
Required Supplementary Information - Part II Schedules and Note Related to Accounting and Reporting for Pensions (GASB 68) L-1 Schedule of the District's Proportionate Share of the Net Pension
Liability - Public Employee's Retirement System (PERS)
L-2 Schedule of District Pension Contributions-Public Employee's Retirement System (PERS)
L-3 Schedule of State's Proportionate Share of the Net Pension Liability Associated with the District -Teacher's Pension and Annuity Fund (TP AF)
Schedule Related to Accounting and Reporting for OPEB (GASB 75) M-1 Schedule of the State's Proportionate Share of the District's Net OPEB
Liability Associated with the District and Changes in the Total OPEB Liability and Related Ratios - (PERS & TP AF)
Notes to Required Supplementary Information
Required Supplementary Information - Part III Budgetary Comparison Schedules:
Page
70
71
72
73
C-1 Budgetary Comparison Schedule - General Fund - 74 Budgetary Basis
C-1 a Combining Schedule of Revenues, Expenditures and Changes in Fund Balance - Budget and Actual - Budgetary Basis - Not Applicable NI A
C-1 b Community Development Block Grant - Budget and Actual - Not Applicable NI A
C-2 Budgetary Comparison Schedule - Special Revenue Fund -Budgetary Basis 82
Note to the Required Supplementary Information C-3 Budget to GAAP Reconciliation 83
(ii)

Table of Contents (continued)
FINANCIAL SECTION (continued)
Supplementary Information
D School Based Budget Schedules - Not Applicable
Special Revenue Fund: E-1 Combining Schedule of Program Revenues and Expenditures -
Budgetary Basis E-2 Schedule of Preschool Education Aid Expenditures -
Budgetary Basis- Not Applicable
Capital Projects Fund: F-1 Summary Schedule of Project Revenues, Expenditures, Project
Balance and Project Status - Budgetary Basis F-la Schedule of Project Revenues, Expenditures, Project Balance and
Project Status - Budgetary Basis F-2 Summary Schedule of Project Expenditures - Not Applicable
Fiduciary Funds: H-1 Combining Statement of Fiduciary Net Position H-2 Combining Statement of Changes in Fiduciary Net Position H-3 Schedule of Receipts and Disbursements -
Student Activity Agency Fund H-4 Schedule of Changes in Assets and Liabilities -
Payroll Agency Fund Long-Term Debt:
1-1 Schedule of Serial Bonds Payable 1-2 Schedule of Obligations Under Capital Leases 1-3 Budgetary Comparison Schedule -Debt Service Fund
STATISTICAL SECTION - OTHER INFORMATION
Financial Trends: J-1 Net Position by Component J-2 Changes in Net Position J-3 Fund Balances, Governmental Funds J-4 Changes in Fund Balances - Governmental Funds J-5 General Fund Other Local Revenues by Source
Revenue Capacity: J-6 Assessed Value and Actual Value of Taxable Property J-7 Property Tax Rates - Direct and Overlapping Governments J-8 Principal Property Tax Payers
J-9 Property Tax Levies and Collections
(iii)
Page NIA
84
NIA
86
87 NIA
88 89
90
91
92 93 94
95 96 97 98 99
100 101 102
103

Table of Contents ( continued)
STATISTICAL SECTION-OTHER INFORMATION (continued)
Debt Capacity: J-10 Ratios of Outstanding Debt by Type J-11 Ratios ofNet General Bonded Debt Outstanding J-12 Ratios of Overlapping Governmental Activities Debt J-13 Legal Debt Margin Information
Demographic and Economic Information: J-14 Demographic and Economic Statistics J-15 Principal Employers
Operating Information: J-16 Full-Time Equivalent District Employees by Function/Program J-17 Operating Statistics J-18 School Building Information J-19 Schedule of Required Maintenance for School Facilities J-20 Insurance Schedule
(iv)
Page 104 105 105 106
107 108
109 110 111 112 113

Table of Contents (continued)
SINGLE AUDIT SECTION
K-1 Report on Internal Control Over Financial Reporting and on Compliance and Other Matters Based on an Audit of Financial Statements Performed in Accordance with Government Auditing Standards 114
K-2 Report on Compliance For Each Major Federal and State Program and Report on Internal Control Over Compliance Required by the Uniform Guidance and New Jersey 0MB 15-08 116
K-3 Schedule A- Schedule of Expenditures of Federal Awards-Supplementary Information 119
K-4 Schedule 8- Schedule of Expenditures of State Financial Assistance-Supplementary Information 120
K-5 Notes to Schedules of Expenditures of Federal Awards and State Financial Assistance 121
K-6 Schedule of Findings and Questioned Costs-Part I- Summary of Auditors' Results 124
K-7 Schedule of Findings and Questioned Costs - Parts II and III -Schedule of Financial Statement Findings and Schedule of Federal Awards and State Financial Assistance Findings and Questioned Costs 126
K-8 Summary Schedule of Prior Year Audit Findings 128
(v)

Introductory Section

Hopewell Valley Regional School District Administrative Offices 425 South Main Street Pennington, NJ 08534 www.hvrsd.org
February 4, 2019
Honorable President and Members of the Board of Education and Constituents
Hopewell Valley Regional School District Pennington, New Jersey County of Mercer
Dear Board Members and Constituents:
The Comprehensive Annual Financial Report (CAFR) of the Hopewell Valley Regional School District 01ereinafter, the Dist:Jict) as of and for the year ended June 30, 2018, is hereby submitted. Responsibility for both the accuracy of the data and completeness and fairness of the presentation, including all disclosw-es, rests with the management of the Board of Education (Board). To the best of our knowledge and belief, the data presented in this report is accurate in all material respects and is reported in a manner designed to present fai rly the financial position of the govenunental activities, the business-type activities, each major fund and the aggregate remaining fund info1m~tion at June 30, 2018, and the respective changes in financial position and cash flows, where applicable, for the year then ended. All disclosures necessary to enable the reader to gain an understanding of the District's financial activities have been included.
The CAFR is presented in fow- sections: introductory, financial , statistical, and single audit. The introductory section includes this transmittal letter (designed to complement Management's Discussion and Analysis and should be read in conjunction with it), the District' s organizational chart, a roster of officials, independent auditors and advisors and the certificate of excellence in financial repo11ing. The financial section includes Management's Discussion and Analysis, basic financial statements, required supplementary infom1ation and other supplementary information, as well as the auditors' report therein. The statistical section includes selected financial and demographic information, generally presented on a multi-year basis and is w1audited. The District is required to undergo an annual single audit in confomuty with the provisions of the Title 2 U.S. Code of Federal regulations (CFR) Part 200 Uniform Administrative Requirements, Cost Principles and Audit Requirements for Federal Awards (Uniform Guidance) and the New Jersey 0MB Circular 15-08, Single Audit Policy for Recipients of Federal Grants, State Grants, and State Aid Payments. Information related to this single audit, including the independent auditors' reports on internal control and compliance with applicable major progran1s are included in the single audit section of this report.
Vision u Values u Discovery 1

1. Reporting Entity and Its Services
The Hopewell Valley Regional School District is an independent reporting entity within the criteria adopted by the Governmental Accounting Standards Board (GASB). All funds and the governmentwide financial statements of the District are included in this report. The Hopewell Valley Regional School District Board of Education and all its schools constitute the District's reporting entity.
The District provides a full range of educational services appropriate to grade levels PK through 12. These include regular education as well as special education for handicapped students. The District sends its vocational students to county vocational schools, which are more suited to provide that type of educational program. The District completed the 2017-18 fiscal year with an average daily enrollment of 3,516 students, which is 87 students less than the previous year's average daily enrollment. The following chart details the changes in the average daily student enrollment of the District over the last five years:
Average Daily Enrollment
Fiscal Student Percent Year Enrollment Change
2017-18 3,516 (2.41)% 2016-17 3,603 (1.40) 2015-16 3,654 (0.51) 2014-15 3,673 (0.41) 2013-14 3,688 (1.05)
2. Economic Condition and Outlook
Hopewell Valley serves the two boroughs of Pennington and Hopewell and the much larger Hopewell Township, a sending area of nearly 60 square miles with a population exceeding 20,000. Six schools comprise the district -- four elementary schools, a middle school and a high school ranging in age from 16 years to 92 years old . Average daily enrollment for the 2017-18 year was 3,516, a slight decline from 2016-17. The economy in the Hopewell Valley communities is reflective of the national economy and shows signs of growth with a slight increase in ratables. Most of the undeveloped land in the Valley is in Hopewell Township. There is an understanding that there is little room for additional development in either commercial or residential projects within the Boroughs. It is believed that there may be some commercial and residential growth potential in Hopewell Township. Janssen Pharmaceuticals, a large employer, is expecting an increase of approximately 600 employees at the Hopewell Township campus in the coming year. As we understand it, new housing subdivisions are being considered in Hopewell Township that will likely bring additional students into the District's schools, but not in the upcoming school year. ·
2

3. Maior Initiatives
Facilities Improvement Plan
The Board budgets funds for minor maintenance work throughout the District in each budget year. The District's annual budget cannot afford the expense of any large maintenance projects without negatively impacting the educational program. Through aggressive planning, the Board has been able to build its capital reserve fund balance over the past several years. As a result, the Board was able to address many needed capital maintenance projects in 2017-18 including roof repairs and district-wide paving and concrete work. Additional projects are planned for 2018-19 and beyond. Projects related to the $35.8 million referendum passed by the community on September 27, 2016, are nearing completion and have addressed more extensive capital needs and infrastructure upgrades in the areas of HV AC, lighting, building-envelope, life-safety, and ADA accessibility. The list of projects completed were approved by the New Jersey Department of Education as well as included in the District's Long Range Facility Plan.
Personnel Management
The Human Resources Department continued to use an established protocol to ensure that all candidates were properly credentialed and certified. To find the best possible candidates, District staff attended job fairs across the mid-Atlantic region. Additionally, a software program, AppliTrack, was used successfully, again this past year, to manage job applications. Human Resources handbooks are used by administrators to provide better oversight of the supervision/evaluation process; by new hires to aid in their orientation to District policies, procedures, and expectations; and by mentors to improve upon the State's process for initiating new hires to the teaching profession. In collaboration with the Curriculum and Instruction Office, Human Resources provided professional development activities so that teachers and support staff could meet District and State requirements (20 hours and Professional Improvement Plans). Personnel policies and specified job descriptions were reviewed and revised as necessary. The Danielson Model of supervision and evaluation has been implemented as the evaluation tool for teachers and the Strange model is being used for administrators. The District has kept abreast of all new regulations related to the new laws regarding evaluation and acquisition of tenure.
Educational Program
The mission of the Hopewell Valley Regional School District is to provide a comprehensive, caring educational experience which nurtures the unique talents of each individual; creates fulfilled, socially responsible, lifelong learners; develops confidence and capabilities to face the challenges of a rapidly changing world; and promotes a culture of respect that values diversity. We pursue this mission through a strong and varied curriculum, superb teaching staff and an array of extracurricular opportunities designed to enrich the learning experience of all students.
In preparing our students for success, we offer a diverse and innovative curriculum guided by the Common Core Standards as well as the New Jersey Student Learning Standards and supplemented with a wide variety of courses designed to prepare our youth to compete successfully in their postgraduate years. Eligible students, who exhaust the extensive course offerings at Central High School, can take classes at nearby universities including Princeton and Rider, and for those interested in niche subjects, online learning is available through several web providers. Students are also experiencing a one to one learning environment using chromebooks to enhance our inquiry-based learning approach. A video projection system, linking all classrooms at Central High School and Timberlane Middle School,
3

provides teachers with fresh opportunities to strengthen instruction with web-based resources and gives students new capabilities to create multimedia presentations.
Our commitment to STEM education is evidenced by our elementary STEM magnet program open to in-district students as well as selected out of district students through the New Jersey Choice program. This concentrated studies program provides interested students an opportunity to participate in a dynamic learning environment that complements their learning style.
A longstanding and important element of our curriculum is our visual and performing· arts program. Hopewell Valley's extraordinary commitment to music education continues to be recognized by the nation's foremost music educators and advocates; including the American Music Conference, which has saluted Hopewell Valley as among the 100 Best Communities in America for music education. Our student musicians and vocalists continue to collect trophies through a wide variety of national competitions, as well as win distinction as selected members of highly competitive regional chorus, band, and orchestra ensembles. We most recently added a performing arts concentration which will result in a specialized diploma for students who chose to take performing arts credits beyond the graduation requirements.
Student success in Hopewell Valley is measured in a variety of ways. While they represent just one measure of student learning; SAT Reasoning test scores of Hopewell Valley students exceed state and national averages, as do the results of the SAT Subject Tests. Average scores in HopeweH Valley remain solidly higher than those of comparable, high achieving suburban districts in New Jersey. In 2018, CHS students achieved mean scores on the SAT of 610 in Reading/Writing and 615 in Mathematics. These scores were significantly higher than state and national mean scores. Each year, more and more students are also choosing to take the ACT. This policy of inclusion is proudly upheld throughout the district, which strives to help every student learn optimally, regardless of ability or special need.
In the consistently popular Advanced Placement Program, 20+ courses are offered in subjects ranging from Latin to Studio Art, making it one of the largest high school menus in New Jersey. Student performance on AP exams continues to track upward at a remarkable pace. Of the 656 tests taken last year, more than 92 percent scored a 3 or better -- enough to win college credit. Hopewell Valley's high overall achievement is annually recognized by the College Board, which continues to honor dozens of students every year as AP Scholars and the National Merit Scholarship Corporation, which named 13 CHS students as Commended Scholars in 2018.
Professional development continues to be a high priority in Hopewell Valley where rigorous standards, an extensive offering of workshops, and a mentoring system for our newest teachers reflect the district's belief that good teaching is the single largest factor in students' classroom success. The high caliber of the faculty is demonstrated in other ways as well. Teachers have collected regional and national honors, including being published in professional journals and authoring textbooks.
4. Internal Control
District administration is responsible for establishing and maintaining internal control de&igned to ensure that the assets of the District are protected from loss, theft, or misuse and to ensure that adequate accounting data is compiled to allow for the preparation of financial statements in conformity with accounting principles generally accepted in the United States (GAAP). Internal control is designed to provide reasonable, but not absolute, assurance that these objectives are met. The concept ofreasonable
4

assurance recognizes that: (I) the cost of a control should not exceed the benefits likely to be derived; and (2) the valuation of costs and benefits requires estimates and judgments by administration.
As a recipient of federal awards and state financial assistance, the District is also responsible for ensuring that adequate internal control is in place to ensure compliance with applicable laws and regulations related to those programs. Internal control is also subject to periodic evaluation by District administration.
As part of the District's single audit described earlier, tests are made to determine the adequacy of internal control, including that portion related to federal awards and state financial assistance, as well as to determine that the District has complied with applicable laws, regulations, contracts, and grants.
5. Budgetary Controls
In addition to internal control, the District maintains budgetary controls. The legal level of budgetary control is established at line item accounts within each fund. The objective of these budgetary controls is to ensure compliance with legal provisions embodied in the annual appropriated budget approved by the voters and State Department of Education. Annual appropriated budgets are adopted for the general fund, the special revenue fund, and the debt service fund. Project-length budgets are approved for the capital improvements accounted for in the capital projects fund. The final budget amount as amended for the fiscal year is reflected in the financial section. The over-expenditure in the general fund is due to the inclusion of the non-budgeted on-behalf payments made by the State of New Jersey as District expenditures. These amounts are offset by related revenues and, as such; do not represent overexpenditures in this budget.
An encumbrance accounting system is used to record outstanding purchase commitments on a line item basis. Open encumbrances at year-end are either canceled or are included as re-appropriations of fund balance in the subsequent year. Those amounts to be re-appropriated are reported as assigned fund balance at year-end.
6. Accounting System and Reports
The District's accounting records reflect accounting principles generally accepted in the United States, as promulgated by the Governmental Accounting Standards Board (GASB). The accounting system of the District is organized on the basis of funds and a government-wide presentation is also included. These funds and government-wide statements are explained in "Notes to the Basic Financial Statements," Note 1.
7. Other Information
Independent Audit: State statutes require an annual audit by independent certified public accountants or registered municipal accountants. The accounting firm of Wiss and Company, LLP was selected by the Board of Education to perform auditing services. In addition to meeting the requirem~nts set forth in state statutes, the audit also was designed to meet the requirements of the Federal Uniform Guidance and New Jersey 0MB Circular 15-08. The auditors' report on the basic financial statements, required supplementary information, and other supplementary information are included in the financial section of this report. The auditors' reports related specifically to the single audit are included in the single audit section of this report.
5

Awards: The District had applied to the Association of School Business Officials (ASBO) International for the "Certificate of Excellence in Financial Reporting" for its comprehensive annual financial report for the fiscal year ended June 30, 2017, and was granted the award. In order to be awarded this certificate, the District published an easily readable and efficiently organized comprehensive annual financial report and satisfied both generally accepted accounting principles and applicable legal requirements. This is the sixth year the District has received this award.
We believe that our current comprehensive annual financial report continues to meet the Program's rigorous requirements, and we are submitting it to ASBO to determine its eligibility for the fiscal year 2017-18 award. ·
8. Acknowledgments
We would like to express our appreciation to the members of the Hopewell Valley Regional School District Board of Education for its concern in providing fiscal accountability to the citizens and taxpayers of the District and thereby contributing full support to the development and maintenance of our financial operation. The preparation of this report could not have been accomplished without the efficient and dedicated services of our financial and accounting staff.
Respectfully submitted,
Dr. Thomas A. Smith Superintendent
Robert Colavita Business Administrator/Board Secretary
6

opewell Valley Regional H Sc hool District
I I
Assistant Business
Board of Education
/
Board Attorney Board Secretary
I I Superintendent Treasurer of
of Schools School Monies
I I I
Director of Director of Superintendent Administrator Pupil Services Curriculum & lnstru.1
- Human Resources - Business Office - Pupil Services ..._ C&I Office Staff Staff Staff Staff
- '
- Admin of - Director of - Special Education ..._ District Technology Transportation Staff Supervisors
-
...._ Campus Safety - Director of Officers Facilities
- Comptroller
I
Principals
- Vice Principals
-·
- Certificated Staff
C
- Support Staff
-

Hopewell Valley Regional School District Pennington, New Jersey
Roster of Officials
Members of the Board of Education
Alyce Murray, President
Lisa Wolff, Vice President
Peter DiDonato
Joanna Long
Michael Markulec
Leigh Ann Peterson
Susan Pollara
Adam J. Sawicki, Jr.
Sarah Tracey
Other Officials
June 30, 2018
Dr. Thomas Smith, Superintendent of Schools
Robert Colavita, Business Administrator/Board Secretary
James Bartolomei, Treasurer
Mr. Paul Green, Esq., Solicitor
Term Expires
2018
2018
2019
2018
2019
2018
2019
2020
2020
8

Hopewell Valley Regional School District Pennington, New Jersey
Independent Auditors and Advisors
Independent Auditors
Wiss and Company, LLP 354 Eisenhower Parkway, Suite 1850
Livingston, New Jersey 07039
Attorney
Schenck, Price, Smith, & King, LLP 220 Park Avenue
Post Office Box 991 Florham Park, New Jersey 07932
Architect
Fraytak, Veisz, Hopkins~ Duthie P.C. 1515 Lower Ferry Road Post Office Box 73 71
Trenton, New Jersey 08628
Fiscal Agents
Depository Trust Company Seven Hanover Street
New York, New York 10004
Official Depository
Northfield Bank 4 Route 31 South
Pennington, New Jersey 08534
9

The Certificate of Excellence in Financial Reporting Award
is presented to
HOPEWELL VALLEY REGIONAL SCHOOL DISTRICT for its Comprehensive Annual Financial Report (CAFR)
for the Fiscal Year Ended June 30, 2017.
The CAFR has been reviewed and met or exceeded
ASBO lnternational's Certificate of Excellence standards.
Brenda R. Burkett, CPA, CSBA, SFO President
John D. Musso, CAE, RSBA Executive Director
10

Financial Section ·

WISS A Partner to Grow With
Independent Auditors' Report
Honorable President and Members of the Board of Education
Hopewell Valley Regional School District Pennington, New Jersey County of Mercer
Report on the Financial Statements
We have audited the accompanying financial statements of the governmental act1v1t1es, the business-type activities, each major fund, and the aggregate remaining fund information of the Hopewell Valley Regional School District, County of Mercer, New Jersey (the "District"), as of and for the year ended June 30, 2018, and the related notes to the financial statements, which collectively comprise the District's basic financial statements as listed in the table of contents.
Management's Responsibility for the Fi11a11cial Statements
Management is responsible for the preparation and fair presentation of these financial statements in accordance with accounting principles generally accepted in the United States of America; this includes the design, implementation, and maintenance of internal control relevant to the preparation and fair presentation of financial statements that are free from material misstatement, whether due to fraud or error.
Auditors' Responsibility
Our responsibility is to express opinions on these financial statements based on our audit. We conducted our audit in accordance with auditing standards generally accepted in the United States of America; audit requirements as prescribed by the Office of School Finance, Department of Education, State of New Jersey; and the standards applicable to financial audits contained in Government Auditing Standards, issued by the Comptroller General of the United States. Those standards and requirements require that we plan and perform the audit to obtain reasonable assurance about whether the financial statements are free from material misstatement.
An audit involves performing procedures to obtain audit evidence about the amounts and disclosures in the financial statements. The procedures selected depend on the auditors' judgment, including the assessment of the risks of material misstatement of the financial statements, whether due to fraud or error. In making those risk assessments, the auditor considers internal control relevant to the District's preparation and fair presentation of the financial statements in order to design audit procedures that are appropriate in the circumstances, but not for the purpose of expressing an opinion on the effectiveness of the District's internal control. Accordingly, we express
14 Penn Plilza. Su1tr 1010 N0w York NY 10122
212 594.8155
354 E10:,enhowcr Parkway, Slllte 1850 Uvinqston. NJ 07039
973.99..\.9<l00
11
5 Barill'"> Corner Road r em1ncl'on. NJ 08822
908.782.7300

no such opinion. An audit also includes evaluating the appropriateness of accounting policies used and the reasonableness of significant accounting estimates made by management, as well as evaluating the overall presentation of the financial statements.
We believe that the audit evidence we have obtained is sufficient and appropriate to provide a basis for our audit opinions.
Opinions
In our opinion, the financial statements referred to above present fairly, in all material respects, the respective financial position of the governmental activities, the business-type activities, each major fund, and the aggregate remaining fund information of the District as of June 30, 2018, and the respective changes in financial position and, where applicable, cash flows, thereof for- the year then ended in accordance with accounting principles generally accepted in the United States of America.
Other Matters
Required Supplementary Information
Accounting principles generally accepted in the United States of America require that management's discussion and analysis, schedule of the District's proportionate share of the net pension liability-PERS, schedule of District pension contributions-PERS, schedule of the State's proportionate share of the net pension State's liability associated with the District-TPAF, schedule of the State's proportionate share of the net OPEB liability associated with the District and changes in the total OPEB liability and related ratios-PERS and TPAF, and budgetary comparison information as identified in the table of contents be presented to supplement the basic financial statements. Such information, although not a part of the basic financial statements, is required by the Governmental Accounting Standards Board, who considers it to be an essential part of financial reporting for placing the basic financial statements in an appropriate operational, economic, or historical context. We have applied certain limited procedures to the· required supplementary information in accordance with auditing standards generally accepted in the United States of America, which consisted of inquiries of management about the methods of preparing the information and comparing the information for consistency with management's responses to our inquiries, the basic financial statements, and other knowledge we obtained during our audit of the basic financial statements. We do not express an opinion or provide any assurance on the information because the limited procedures do not provide us with sufficient evidence to express an opinion or provide any assurance.
Other Information
Our audit was conducted for the purpose of forming opinions on the financial statements that collectively comprise the District's basic financial statements. The accompanying supplementary information such as the combining and individual fund financial statements, long-term debt schedules and the schedules of expenditures of federal awards and state financial assistance, as required by Title 2 U.S. Code of Federal Regulations (CFR) Part 200 Uniform Administrative Requirements, Cost Principles and Audit Requirements for Federal Awards (Uniform Guidance) and New Jersey 0MB Circular 15-08, Single Audit Policy for Recipients of Federal Grants, State Grants and State Aid, respectively, and the other information, such as the introductory and statistical section are presented for purposes of additional analysis and are not a required part of the basic financial statements.
12

The combining and individual fund financial statements, long-tenn debt schedules and the schedules of expenditures of federal awards and state financial assistance are the responsibility of management and were derived from and relate directly to the underlying accounting and other records used to prepare the basic financial statements. Such infonnation has been subjected to the auditing procedures applied in the audit of the basic financial statements and certain additional procedures, including comparing and reconciling such infonnation directly to the underlying accounting and other records used to prepare the basic financial statements or to the basic financial statements themselves, and other additional procedures in accordance with auditing standards generally accepted in the United States of America. In our opinion, the combining ~d individual fund financial statements, long-tenn debt schedules and the schedules of expenditures for federal awards and state financial assistance are fairly stated, in all material respects, in relation to the basic financial statements as a whole.
The introductory and statistical sections have not been subjected to the auditing procedures applied in the audit of the basic financial statements and, accordingly, we do not express an opinion or provide any assurance on them.
Other Reporting Required by Government Auditing Standards
In accordance with Government Auditing Standards, we have also issued our report dated February 4, 2019 on our consideration of the District's internal control over financial reporting and on our tests of its compliance with certain provisions of laws, regulations, contracts and grant agreements and other matters. The purpose of that report is solely to describe the scope of our testing of internal control over financial reporting and compliance and the results of that testing, and not to provide an opinion on the effectiveness of the District's internal control over financial reporting or on compliance. That report is an integral part of an audit perfonned in accordance with Government Auditing Standards in considering the District's internal control over financial reporting and compliance.
February 4, 2019 Livingston, New Jersey
Scott A. Clelland Licensed Public School Accountant
No. 1049
u/MN~~ WISS & COMPANY, LLP
13

Required Supplementary Information Part I
Management's Discussion and Analysis

Hopewell Valley Regional School District Management's Discussion and Analysis
Year ended June 30, 2018
As management of the Hopewell Valley Regional School District (District), we offer readers of the District's financial statements this narrative discussion, overview, and analysis of the financial activities of the District for the year ended June 30, 2018. We encourage readers to consider the information presented, in conjunction with additional information that we have furnished in our letter of transmittal.
Management's Discussion and Analysis (MD&A) is Required Supplementary Information specified in the Governmental Accounting Standard Board's (GASB) Statement No. 34, Basic Financial Statements - and Management's Discussion and Analysis - for State and Local Governments. Certain comparative information between the current fiscal year and the prior fiscal year is presented in the MD&A as required by GASB Statement No. 34.
Overview of the Financial Statements
This discussion and analysis is intended to serve as an introduction to the District's basic financial statements. The District's basic financial statements comprise three components: 1) government-wide financial statements, 2) fund financial statements, and 3) notes to the basic financial statements. This document also contains required supplementary information, supplementary information and other information in addition to the basic financial statements themselves.
Government-wide financial statements. The government-wide financial statements are designed to provide readers with a broad overview of the District's finances, in a manner similar to a private-sector business.
The statement of net position presents information on all of the assets, deferred Ol,ltflows ofresources, deferred inflows of resources and liabilities of the District, with the difference rep·orted as net position. Over time, increases or decreases in net position may serve as a useful indicator of whether the financial position of the District is improving or deteriorating.
The statement of activities presents information showing how the net position ·of the District changed during the most recent fiscal year. All changes in net position are reported as soon as the underlying event giving rise to the change occurs, regardless of the timing of related cash flows. Thus, revenues and expenses are reported in this statement for some items that will only result in cash flows in future fiscal periods ( e.g., earned but unused vacation and sick leave).
The government-wide financial statements can be found on pages 22-23 of this report.
14

Fund financial statements. A fund is a group of related accounts that is used to maintain control over resources that have been segregated for specific activities or objectives. The District, like other state and local governments, uses fund accounting to ensure and demonstrate compliance with finance-related legal requirements. All of the funds of the District can be divided into three categories: governmental funds, proprietary funds, and fiduciary funds.
Governmental funds. Governmental funds are used to account for essentially the same functions reported as governmental activities in the government-wide financial statements. However, unlike the government-wide financial statements, governmental fund financial statements focus on nearterm inflows and outflows of spendable resources, as well as on balances of spendable resources available at the end of the fiscal year. Such information may be useful in evaluating government's near-term financing requirements.
Because the focus of governmental funds is narrower than that of the government-wide financial statements, it is useful to compare the information presented for governmental funds with similar information presented for governmental activities in the government-wide financial statements. By doing so, readers may better understand the long-term impact of the government's near-term financing decisions. Both the governmental fund balance sheet and the governm~ntal fund statement of revenues, expenditures, and changes in fund balance provide a reconciliation to facilitate this comparison between governmental funds and governmental activities.
The District maintains four individual governmental funds. Information is presented separately in the governmental fund balance sheet and in the governmental fund statement of revenues, expenditures, and changes in fund balance for the general fund, special revenue fund, capital projects fund and debt service fund, all of which are considered to be major funds.
The District adopts an annual appropriated budget for its general fund, special revenue fund and debt service fund. Budgetary comparison statements have been provided as required supplementary information for the general fund and special revenue fund and as supplementary information for the debt service fund to demonstrate compliance with this budget. ·
The basic governmental fund financial statements can be found on pages 24-26 of this report.
Proprietary funds. The District maintains one proprietary fund type as enterprise funds. Enterprise funds are used to report the same functions presented as business-type activities in the government-wide financial statements. The District uses enterprise funds to account for the operations of its food service, driver education, and kindergarten extension programs. The basic enterprise fund financial statements can be found on pages 27-29 of this report.
Fiduciary funds. Fiduciary funds are used to account for resources held for the benefit of parties outside the governmental entity. Fiduciary funds are not reflected in the government-wide financial statements because the resources of those funds are not available to support the District's own programs. The District uses trust funds to account for the activity of the private-pwpose scholarship fund and unemployment compensation trust fund The District uses agency funds to account for resources held for student activities and groups, and payroll related liabilities. The basic fiduciary fund financial statements can be found on pages 30-31 of this report.
15

Notes to the basic financial statements. The notes provide additional information that is essential for a full understanding of the data provided in the government-wide and fund financial statements. The notes to the basic financial statements can be found on pages 32-69 of this report.
Other information. The required supplementary information and the individual and combining statements referred to earlier in connection with governmental funds are presented immediately following the notes to the financial statements. Required supplementary information and combining and individual fund statements and schedules can be found on pages 70-94 of this report.
Financial Highlights
Government-wide Financial Analysis
As noted earlier, net position may serve over time as a useful indicator of a government's financial position. In the case of the District, assets and deferred outflows of resources exceeded liabilities and deferred inflows of resources by $24,658,823 (net position) at the close of 2018 and our overall net position increased in the current year, primarily as a result of the decrease in the District's net pension liability. The following table provides a summary of net position relating to the District's governmental and business-type activities at June 30, 2018 and 2017:
2018 2017
Business- Business-Governmental type Governmental type
Activities Activities Total Activities Activities Total
Current and other assets $31,674,036 $448,974 $32,123,010 $47,314,919 $399,595 $47,714,514 Capital assets, net 7716141835 95,525 771710,360 62,459,173 1161213 62,5751386
Total assets I 09,288,871 544,499 109,833,370 109,774,092 515,808 110,289,900
Deferred outflows of resources 8.155.245 811551245 111158:572 11:158:572
Current liabilities 9,474,910 48,066 9,522,976 9,572,955 147,958 9,720,913 Long-term liabilities
outstanding 52,335,049 52,335,049 57,071,242 57,071,242
Net pension liability 25,734,206 25,7341206 32,908,916 32,908,916 Total liabilities 8715441165 48,066 8715921231 99,5531113 1471958 9917011071
Deferred inflows of resources 5:737:561 5:7371561 317.374 3171374
Net position:
Net investment in capital assets 38,466,350 95,525 38,561,875 35,803,648 116,213 35,919,861
Restricted 8,624,034 8,624,034 7,137,070 7,137,070 Unrestricted (Deficit) (221927.994} 400.908 {22,527.086} (21:8781541} 2511637 (211626:904}
Total net position $24,162.390 $496.433 $24,658,823 $21,062:177 $367,850 $21,430,027
The largest portion of the District's net position is its net investment in capital assets. The increase in the District's net investment in capital assets is due to ongoing capital projects combined with the paying down of related debt. Restricted net position includes assets that are subject to external restrictions (e.g., for capital reserve, maintenance reserve, excess fund balance and debt service).
16

The (deficit) unrestricted net position in the governmental funds increased, mainly attributable to the increase in the District's restricted net position. The unrestricted net position increased in the business-type activities due to the positive results of operations in the food service fund. Capital assets increased in the current year as a result of asset additions, consisting mainly of construction in progress additions, exceeding current year depreciation expense.
Deferred outflows of resources represent deferred losses on refunded debt associated with the District's outstanding debt issuances and deferred pension costs associated with the District's net pension liability. Deferred inflows of resources represent the District's proportionate share of earnings and assumptions associated with the District's net pension liability and deferred gains on refunded debt. Deferred inflows increased substantially, mainly due to a change in the assumptions related to pensions. Long-term liabilities decreased due to the current year bond repayments. The net pension liability decreased due to the State contributing a greater percentage of their obligation in the current year.
Government-wide activities. The key elements of the District's changes in net position for the years ended June 30, 2018 and 2017 are as follows:
Year ended June 30,
2018 2017 Business- Business-
Governmental type Governmental type Activities Activities Total Activities Activities Total
Revenues: Program revenues: Charges for services $ 416,144 $1,433,926 $ 1,850,070 $ 425,238 $ 1,526,791 $ 1,952,029 Operating grants and contributions 1,176,744 156,546 1,333,290 1,175,450 152,467 1,327,917
General revenues: Property taxes 76,452,806 76,452,806 74,150,252 74,150,252 Federal and state aid not restricted to specific purposes 33,768,539 33,768,539 30,570,815 30,570,815
Investment earnings 445,844 445,844 109,524 109,524 Miscellaneous 479.537 479,537 6291236 629,236
Total revenues 112,739,614 1,590,472 114,330,086 107,060,515 1,679,258 108,739,773
Expenses: Instructional services 65,617,976 65,617,976 65,703,410 65,703,410 Support services 42,021,275 1,461,889 43,483,164 39,794,995 1,608,642 41,403,637 Special schools 360,753 360,753 337,955 337,955 lnterest/chgs. on long-tenn debt 1,639,397 1,639,397 2,037,136 2,037,136
Total expenses 109,639.401 1,461,889 I l l,101,290 107,873,496 1,608,642 I 091482, 138
Change in net position 3,100,213 128,583 3,228,796 (812,981) 70,616 (742,365)
Net position-beginning of year 21:062:177 3671850 21:4301027 21,875:158 2971234 221172:392
Net position - end of year $24,162.390 $ 496.433 $24.658,823 $21,062,177 $ 367,850 $21.430,027
Property tax revenue increased due to an increase in the current year property tax levy.
Federal and state aid not restricted for a specific purpose increased due to the implementation of GASB Statement No. 75 related to post-employment health benefits offset by a decrease in the onbehalf TPAF pension contributions associated with the GASB Statement Nos. 68 and 71.
17

Governmental instructional expenses were comparable to the prior year and governmental support services decreased because of a decrease in pension expense allocated to these functions as required by GASB Statement Nos. 68 and 71.
Business-type activities revenues decreased because of decreases in revenues in the food service, driver education and after school programs.
Financial Analysis of the District's Funds
As noted earlier, the District uses fund accounting to ensure and demonstrate compliance with finance-related legal requirements.
Governmental funds. The focus of the Districfs governmental funds is to provide information on near-term inflows, outflows, and balances of spendable resources. Such information is useful in assessing the District's financing requirements.
The general fund is the chief operating fund of the District. At the end of the current fiscal year, unassigned fund balance of the general fund was $1,846,840, while total fund balance was $13,186,647. As a measure of the general fund's liquidity, it may be useful to compare both unassigned fund balance and total fund balance to total fund expenditures. Unassigned fund balance represents 2.2% of the total general fund expenditures while total fund balance represents 15.5% of that same amount.
The fund balance of the District's general fund increased by $1,128,899 during the current fiscal year. Factors in this increase include the impact fiscal conservatism had on expenditures mainly in the areas of instruction, tuition, general administration and operation and maintenance of plant.
The Capital Projects fund was active once again during the fiscal year. Fund balance restricted for capital projects decreased by $16,892,548 to $15,510,451 which represents the unspent and uncommitted balance of the bond proceeds. The decrease is attributed to the expenditures related to the ongoing capital projects.
The Debt Service Fund has a total fund balance of $643,404, all of which is restricted for the payment of debt service and $331,075 of which has been anticipated in the District's 2018-19 budget. The net increase in fund balance during the current year was $303,520, which is mainly attributable to the earnings on the unspent bond referendum transaction. The District received $5,742,494 from the local tax levy and $340,286 in state aid and paid $3,960,000 and $2,131,589 in principal and interest on bonds, respectively.
As demonstrated by the various statements and schedules included in the financial section of this report, the District continues to meet its responsibility for sound financial management. The following schedule presents a summary of the General Fund, Special Revenue Fund and Debt Service Fund revenues for the fiscal year ended June 30, 2018, and the increases in relation to the prior year.
Revenue
Local sources State sources Federal sources Total
Amount
$ 77,519,000 14,495,253
985,901 $ 93,000,154
Percent of Total
83.3% 15.6
1.1 100.0%
Increase/ (Decrease) from 2017
$ 2,223,230 2,186,387 (111,578)
$ 4,298,039
Percent of Increase/
(Decrease)
2.9% 17.8
(10.2) 4.6%
18
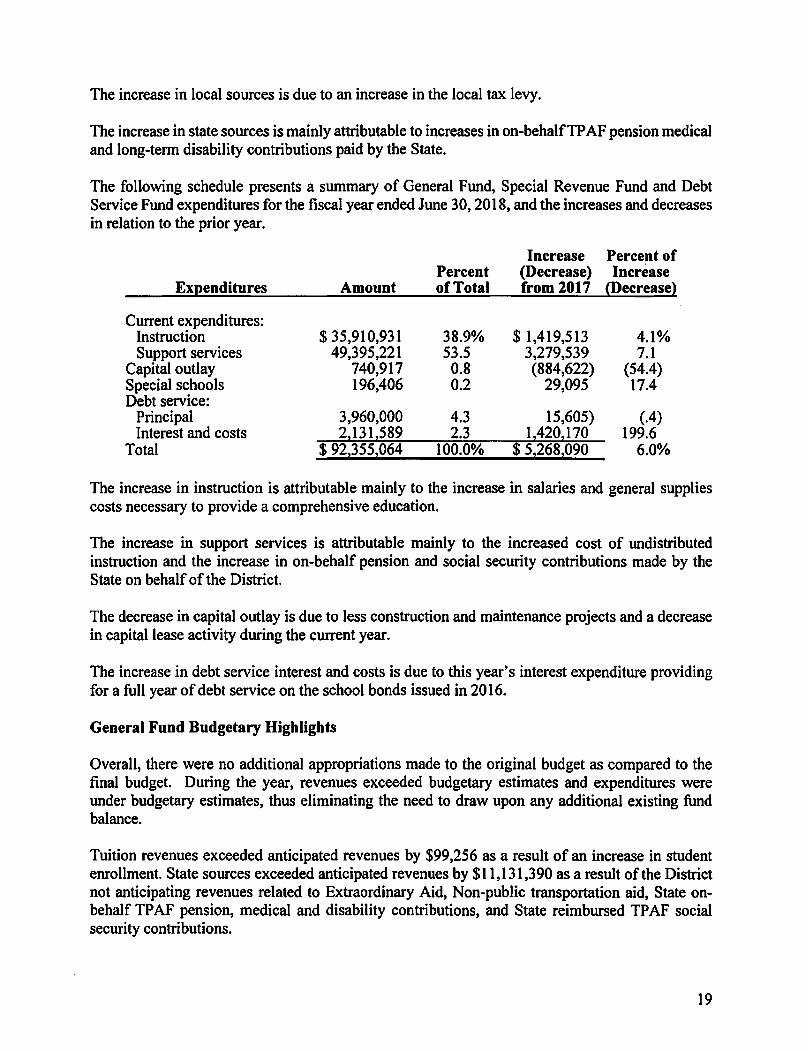
The increase in local sources is due to an increase in the local tax levy.
The increase in state sources is mainly attributable to increases in on-behalf TP AF pension medical and long-term disability contributions paid by the State.
The following schedule presents a summary of General Fund, Special Revenue Fund and Debt Service Fund expenditures for the fiscal year ended June 30, 2018, and the increases and decreases in relation to the prior year.
Increase Percent of Percent (Decrease) Increase
Ex2enditures Amount of Total from 2017 (Decrease}
Current expenditures: Instruction $35,910,931 38.9% $1,419,513 4.1% Support services 49,395,221 53.5 3,279,539 7.1
Capital outlay 740,917 0.8 (884,622) (54.4) Special schools 196,406 0.2 29,095 17.4 Debt service:
Principal 3,960,000 4.3 15,605) (.4) Interest and costs 221312589 2.3 124202170 199.6
Total $ 9223552064 100.0% $ 522682090 6.0%
The increase in instruction is attributable mainly to the increase in salaries and general supplies costs necessary to provide a comprehensive education.
The increase in support services is attributable mainly to the increased cost of undistributed instruction and the increase in on-behalf pension and social security contributions made by the State on behalf of the District.
The decrease in capital outlay is due to less construction and maintenance projects and a decrease in capital lease activity during the current year.
The increase in debt service interest and costs is due to this year's interest expenditure providing for a full year of debt service on the school bonds issued in 2016.
General Fund Budgetary Highlights
Overall, there were no additional appropriations made to the original budget as compared to the final budget. During the year, revenues exceeded budgetary estimates and expenditures were under budgetary estimates, thus eliminating the need to draw upon any additional existing fund balance.
Tuition revenues exceeded anticipated revenues by $99,256 as a result of an increase in student enrollment. State sources exceeded anticipated revenues by $11,131,390 as a result of the District not anticipating revenues related to Extraordinary Aid, Non-public transportation aid, State onbehalf TP AF pension, medical and disability contributions, and State reimbursed TP AF social security contributions.
19

Budgetary transfers were made between budgetary line items and approved by the .Board for various reasons including:
• Instruction - regular programs - a decrease of $921,370 occurred in the budget mainly due to decreases in grades 1-5 salaries of teachers and in other purchased services ..
• Autism ""'." special education - an increase of $274,216 occurred in the budget due to increases in salaries, other salaries for instruction and general supplies.
• Undistributed expenditures - other support services - students - extraordinary services - a decrease of $281,280 occurred in the budget due to fewer students requiring extraordinary services than anticipated.
• Undistributed expenditures - employee benefits - health benefits -a decrease of $247,681, mainly due to actual premium increases being less than budgeted.
The District also experienced significant variations between the final amended budget and the actual expenditures for various reasons including:
• Instruction - regular programs - a remaining balance of $580,886. Fiscal restraint with respect to other purchased services and general supplies resulted in a favorable balance.
• Undistributed expenditures - other support services- extraordinary services - a remaining balance of $281,316. Fiscal restraint with respect to purchased professional educational services.
• Undistributed expenditures - support services - general administration - a remaining balance of $334,926. Fiscal restraint with respect to legal and architectural services and fewer judgements against the district resulted in a favorable balance.
• Undistributed expenditures - student transportation services - a remaining balance of $284,158. Fiscal restraint with respect to legal fees and architectural and engineering services resulted in a favorable balance.
• Undistributed expenditures - unallocated benefits - a remaining balance of $250,751. Lower than anticipated premium increases resulted in a favorable balance.
Capital Assets
At the end of the fiscal years ended June 30, 2018 and 2017, the District had $77,710,360 and $62,575,386, respectively, invested in land, construction in progress, land improvements, building and building improvements and machinery and equipment, net of accumulated depreciation or amortization.
20

Capital Assets (Net of Depreciation) Governmental Activities Business-type Activities
2018 2017 2018 2017
Land $2,546,691 $2,546,691 Construction in progress 20,344,550 3,452,001 Land improvements 2,805,485 3,019,528 Building and building
improvements 50,544,000 52,263,768 Machinery and equipment 123742109 1,1772185 $952525 $116,213 Total $77,614,835 $62,459,173 $95,525 $116,213
The increase in governmental activities capital assets is due the current year additions related to construction in progress exceeding depreciation expense. The decrease in business-type activities is due to the current years' depreciation expense exceeding the current year addition. For more detailed information, please refer to Note 4 to the basic financial statements.
Debt Administration
At June 30, 2018, the District had $83,446,672 of outstanding long-term liabilities. Of this amount, $25,734,206 represents the District's net pension liability, $2,238,082 is for compensated absences; $1,698,200 for capital leases; $51,135,000 of serial bonds; $575,000 has been accrued to pay for legal settlements and $2,066,184 is for the unamortized premium on bonds. For more detailed information, refer to Note 5 of the basic financial statements.
Economic Factors and Next Year's Budget
• Local and State aid has remained relatively flat.
• The cost of providing employee health benefits are expected to continue to increase.
• The District budgeted $4,557,244 of its 2018 fund balance to partially fund the 2018-19 operations, an increase of$1,567,854 from the prior year.
All of the above factors were considered in preparing the District's 2018-19 fiscal year budget.
Requests for Information
This financial report is designed to provide a general overview of the Hopewell Valley Regional School District's finances for all those with an interest in the government's fmances. Questions concerning any of the information provided in this report or requests for additional financial information should be addressed to the Office of the School Business Administrator, 425 South Main Street, Pennington, New Jersey 08534.
21

Basic Financial Statements

Government-wide Financial Statements
The government-wide financial statements provide a financial overview of the District's operations. These financial statements present the financial position and operating results of all governmental activities and business-type activities as of and for the year ended June 30, 2018.

A-1
Hopewell Valley Regional School District
Statement of Net Position
June 30, 2018
Governmental Business-type Activities Activities Total
Assets Cash and cash equivalents $ 15,778,450 $ 425,845 $ 16,204,295 Investments 10,196,408 10,196,408 Accounts receivable 702,495 10,781 713,276 Inventories 12,348 12,348 Restricted assets:
Cash and cash equivalents 4,996,683 4,996,683 Capital assets, non-depreciable 22,891,241 22,891,241 Capital assets, depreciable, net 54,723,594 95,525 54,819,119 Total assets I 09 ,288,871 544,499 109,833,370
Deferred Outflows of Resources Pension deferrals 7,832,945 7,832,945 Deferred loss on refunding of debt 322,300 322,300 Total Deferred Outflows of Resources 8,155,245 8,155,245
Liabilities Accounts payable 3,190,613 2,310 3,192,923 Accrued interest payable 847,893 847,893 Intergovernmental payables:
State 7,787 7,787 Unearned revenue 51,200 45,756 96,956 Net pension liability 25,734,206 25,734,206 Current portion of long-tenn obligations 5,377,417 5,377,417 Noncurrent portion of long-tenn obligations 52,335,049 52,335,049 Total liabilities 87,544,165 48,066 87,592,231
Deferred Inflows of Resources Pension deferrals 5,429,737 5,429,737 Deferred gain on refunding of debt 81,852 81,852 Deferred tax levy 225,972 2251972 Total Deferred Inflows of Resources 5,737,561 5,737,561
Net position Net investment in capital assets 38,466,350 95,525 38,561,875 Restricted for:
Capital reserve 4,906,680 4,906,680 Maintenance reserve 90,003 90,003 Excess surplus - current year 1,404,659 1,404,659 Excess surplus - designated for subsequent years 2,222,692 2,222,692
Unrestricted (deficit) {221927,994} 400,908 {22,527,086} Total net position $ 2411621390 $ 4961433 $ 2416581823
See accompanying notes lo the basic financial statements. 22
A-2 Hopewell Valley Regional School District
Statement of Activities
June 30, 2018
Net (Expense) Revenue and Pro!!mn Revenues Chanses in Net Position
Operatine Char2es for Grants and Governmental Business-type
[unctions/Pm1u11ms ~"llll!l!lls Services Contributions Activities Activities Total
Governmental activities Instruction $ 67,372,705 $ 279,256 $ 969,073 $ (66,124,376) $ (66,124,376) Suppon services:
Instruction 2,573,100 (2,573,100) (2,573.100) Altendance/social work 7,570 (7,570) (7,570) Heallh services 1,160,199 (1,160,199) (1,160,199) Olher support services 7,090,727 207,671 (6,883,056) (6,883,056) Improvement of instruction 5,253,594 (5,253,594) (5,253,594) School library 1,987,806 (1,987,806) (1,987,806) General administration 1,271,827 (1,271,827) (1,271,827) School administration 4,279,998 (4,279,998) (4,279,998) Central services 1,842,099 (1,842,099) (1,842,099) Admin info technology 421,186 (421,186) (421,186) Required maintenance of plant services 2,096,029 (2,096,029) (2,096,029) Operation of plant 5,858,279 (5,858,279) (5,858,279) Care & upkeep of grounds 524,553 (524,553) (524,553) Security 404,408 (404,408) (404,408) Student transportation 5,468,943 136,888 (5,332,055) (5,332,055) Special Schools 386,981 (386,981) (386,981)
Interest and olher charges on long-term debt I 639,397 {l16391397l {11639,39:!l Total governmental activities 109,639,401 416,144 1,176,744 (I 08,046,513) (108,046,513)
Business-type activities Food service 1,346,886 1,321,981 156,546 $ 131,641 131,641 Driver education 20,968 18,145 (2,823) (2,823) After school 94035 93 800 {235! {2351
Total business-type activities 114611889 1,4331926 156,546 128 583 128,583 Total primary government $ II 1,101,290 $ 1,850,070 $ 1,333,290 (108,046,513) 128,583 (107,917,930)
General revenues: Propeny taxes, levied for general purposes 70,710,312 70,710,312 Property taxes, levied for debt service 5,742,494 5,742,494 State and federal sources 33,768,539 33,768,539 Investment earnings 445,844 445,844 Miscellaneous income 479 537 479,537
Total general revenues 111 146 726 II 11146,726 Change in net position 3,100,213 128,583 3,228,796
Net position-beginning 211062,177 367,850 21,430,027 Net position-ending $ 24.1621390 $ 496,433 $ 24,658,823
See accompanying no/es to the basic financial slatements. 23

Fund Financial Statements
Governmental Funds
-Cuhmd c:ub~,:almb --. ..... .---fdml o,!,a ---ltmnctcJ cub and c:&dlcqtai\~
T<>Cll.-.
Lb!riUUn nd hind baluttt Ua!llU!Kt.
""'°"""l"'yabl• lnlap,,....,..... l"')'lbla:
!Iulo lnlcrAio,l1pay~ lJaamc,1,-
TCl&&llidldwa
Dctand tatbt•., fflOIINQ
t&11 In,- m:awd m u.lJICICd T<>Cll<kf<m>li:,lloawo(,-
f,mW-. -!or,
C&p\.11~ M&Weft&nlilOrtcnc
eop<tal""""" l><bo-·~ mrplw,..cwymt y=r I~ Aiqlla,prior ywr
Auiinor,leo· Dmp,at<,lb,wxq--
~pmditwu Olhcrl""I"""'
v.w.._i T<>Cll!lnl-
Tatdllalll?Llics,dctmol~•of ~ ... C'un.t balm.,cs
Su ammpanJtng ""'" to tu btutc jin,mct,,/ 1ra1t-n11.
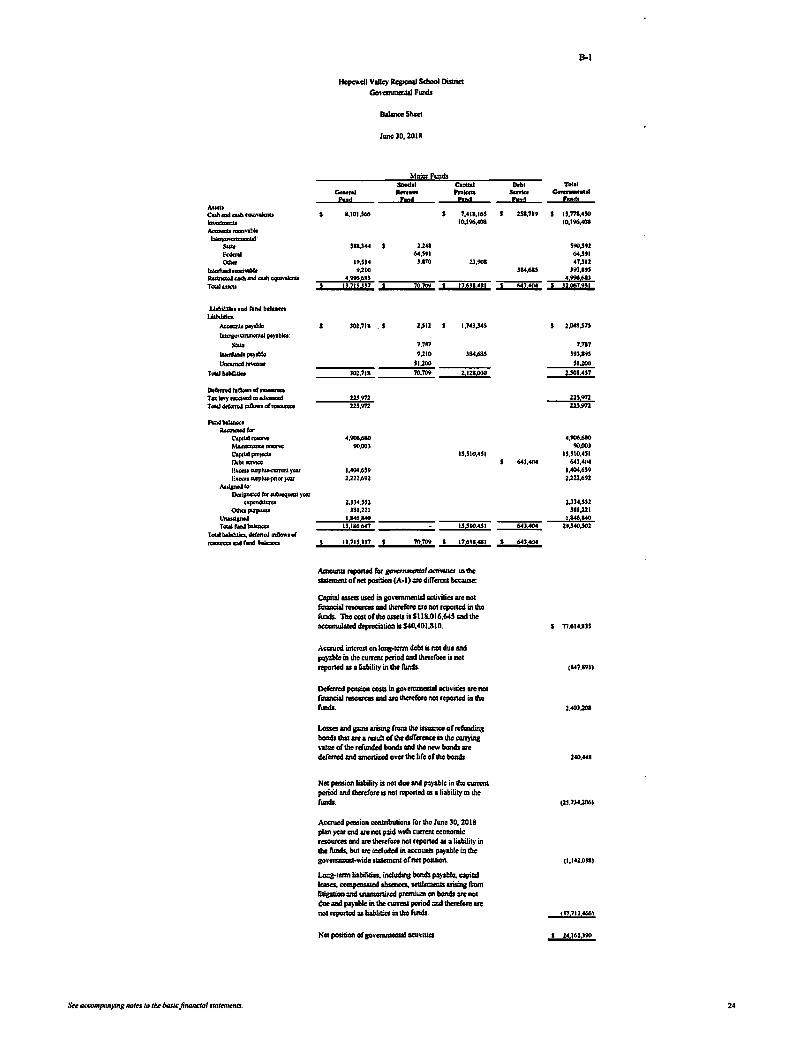
Hopc,>-dl Valley llcgiONI ~ Disuict Oo,'Cfflll1Clll.llFonds
D&l=Shcel
lwte 30, 2018
Moi!!!Fwtds Sooclol Caolt&I
C-ral -- ......... Ellllil bml EIDd
l,101,566 s 7,411,16S 10,196,408
$11.344 JJU 6',Stl
l9JJ• l,l10 11,908 9,210
499569)
nzu uz zom 1ZMl 4,-I
s 102,718 . s J,112 1,74l,J4S
1.1n 9,210 1114.68S
SI.JOO
)02,711 10.m J.121.0JO
wm ns.m
006,6&0 90,001
1S,l10,4SI
1,404,6S9 Ull.692
2,Jl4JS2 )81,Jll ........
IJ 116647 U 1:510.4.S1
II 71S 1)7 ! 'IO'IW t76l1G1
Amounts repo,ud ror _.....,.,,.,....., ... ,, .. in doc .-..r not posilion (A• I)..., dilTaau because:
Coi,illl wcu used in go,'CfflfflCIUII octi,;lia ""'not fonancial resowus and doctcfote ""'Ml rq,oncd in doc lunds. The costofd1us-is $118,016,645 and the accumulAled depreci@on is $40,401,81 o.
Accrued interest on lons•lmn dobl i1 not due and pa):blo in lho clllfflll period 1111d lhororora is not rq,orted ... lilbilily in doc lunds.
Do(erred pension cosu in 8°'~ aclivilia.,. not fimncw resources and arc lhoffl'ora OOI repo,ud in lhc l'unds.
LoS1cs and ga;ns Irising (fClll lhe issuance ..r rcfundins boads lhos 11e a ra.i1 ofdw dill'crcnu in lho RnlUl8 ,-atue oflho rcflmded bonds and doc now bonds""' doferred and mnoniu,d O\'Cr the life oflhe boads.
Net pension liabilily is nol due and p&):blo in tho ammt poricid wl lhore(ore is not reponod os • liabili1y in lho funds.
Aocn>cd pension con1nbutions ror lho Jwoc 30, 2018 plan>= end ""'not iwd wilh currcnl economic raowca and ""'lhcrc(ora nol reported a, a li&bili1y in doc /\mds, bid 110 included in OCCOIIIIII p&)'lblo in lhc aovommau ... ide ltllemall or net posilion.
Long-term lwilitios. indlldins bonds p&)'lblo, capital 1-. compeas&101 abscnca. Hltlcmcnts arisins mom litiplion and uwnoniud praniwn en boads ""'not due ml pa)@le in lho CUffCIII period W lherc{o,e UC not rcponcd u liablitics in tloc (unds.
Net posolion or sovcrnmcalll actmucs
B-1
11,t,1 Tol•I - Govtn••ltl bd f!ltdt
lll,719 1!,ffl,4l0 10,196,408
S90J92 6'J91 41.)U
)114,611 ,.,,.., ""'.!!' 60'21 HPCZUI
2,(MIJ7!
1.m )9)~l
SIJOO JJOl.417
nsm W.972
4,'l06,6l0 90,00)
1!,II0,4SI 6'),ol(M 6'),ol(M
1,404,619 2.Jll.692
Ul•.SS2 J8U21 . ... ...,
60404 29)40J02
s 60.0.
S 7'1.614.lll
(147,891)
l40,HS
(2S.714.l06)
(l,142J)III
<J?,'712466)
2,u6111w
24

B-2
Hopewell Vllllcy Regional School DiS1rict Go11emmenlal Fwids
S111temm1 or Ra..:nucs, ExpendilllrCS 1111d Changes in Fund Balances
June 30, 2018
MmiorFunds Special Capital Debt Tolal
General Ra>enue Projects Service Governmental Fund Fund Fund Fund Funds
Revenues: Local SOUfCC:S:
Local laX levy s 70,710,312 S 5,742,494 s 76,452,806 Tuition 279,256 279,256 lnlm:st on invaunenls 133,SIS $ 312,329 44S,844 TranSl)Orllllion 136,888 136,888 Mi=Uancous 479537 s 36,998 Sl61SJS
Tola! I~ sources 71,739,508 36,998 312,329 S,742,494 77,831,329
S111teso111CC:S 13,990,466 164,501 340,286 l4,49S,2S3 Federal soun:cs 106S6 97S124S 985,901
Tolalrncnucs 85,740,630 1,176,744 312,329 6,082.780 93,312,483
Espendltuns: Cwrcnt:
Instruction 34,941,858 969,073 35,910,931 SupPort scm=:
lnllnlfflon 2,479,750 2,479,750 Anmdancdsoa31 work 4,090 4,090
Healdtsemccs 610,605 610,605 Supponsemccs 5,132.270 207,671 5,339,941 Improvement orins1ruction 1,450,188 1,450,188 School libnuy 1,033,031 1,033,031 Geneml adminislr.ltion 971,381 971,381 School 3dminisl1ation 2,178,987 2,178,987 Cenlr31 services 990,31S 990,315 Administtalion information technology 216,661 216,661 lnslrudional stifTlnlinin11 scrvcics SJ,381 53,381 Required maintenance or plant semccs 1,431,460 1,431,460 Opmition or plant-cusiodial semccs 3,830,116 3,830,116 Care & upkeep or lll'Ounds 300,920 300,920 Security 202,001 202,001 Student lransponnlion 4,014,032 4,014,032 Employee benefils 13,880,102 13,880,102 On-bchalr pension. medical and
disability contributions 7,962,948 7,962,948 On-1,cbalrTPAF soda! security
contributions 2,46S,312 2,465,312 Special Schools 196,406 196,406 Capital ouday 740,917 16,892,548 17,633,465 Debt Service:
Principal 3,960,000 3,960,000 lnlercSI 2,131,589 2,131,589
Tollll expcrulilllrCS 85,086,731 1,176,744 16,8~548 6,091,589 109,247,612 Excess (deficiency) or revenues
over (under) expenditures 6S3,899 (16,S80,219) (8,1109) (15,935,129)
Olher linancin11 sources (uses): Transfers in 312,329 312,329 Transfers out (312,329) (312,329) Capilal leases (non-budp;eled) 475 000 475 000
Tolal other financinJt sowccs (uses) 475 000 {312J29} 212,329 47S 000
Net chanitc in rwid balances 1,128,899 (16,892,548) 303,520 (IS,460, I 29)
Fund balances, July I 12 057 748 32,402,999 339,884 44,800,631 fund balances, June 30 s 13.1861647 s S 151SI0.451 s 643.404 s 29.340jS02
The rcconc;tiation of the rurut b:ilances or govcmmcnt31 funds lo the net position of govemmcnlal IIClivitics in the Sllltcmcnl of IIClivitics is prcsmted in an 11CCOmpMying schedule (B-3).
See accompanying notes to the basic financ/ul stutemenls. 2S
Hopewell Valley Regional School District Governmental Funds
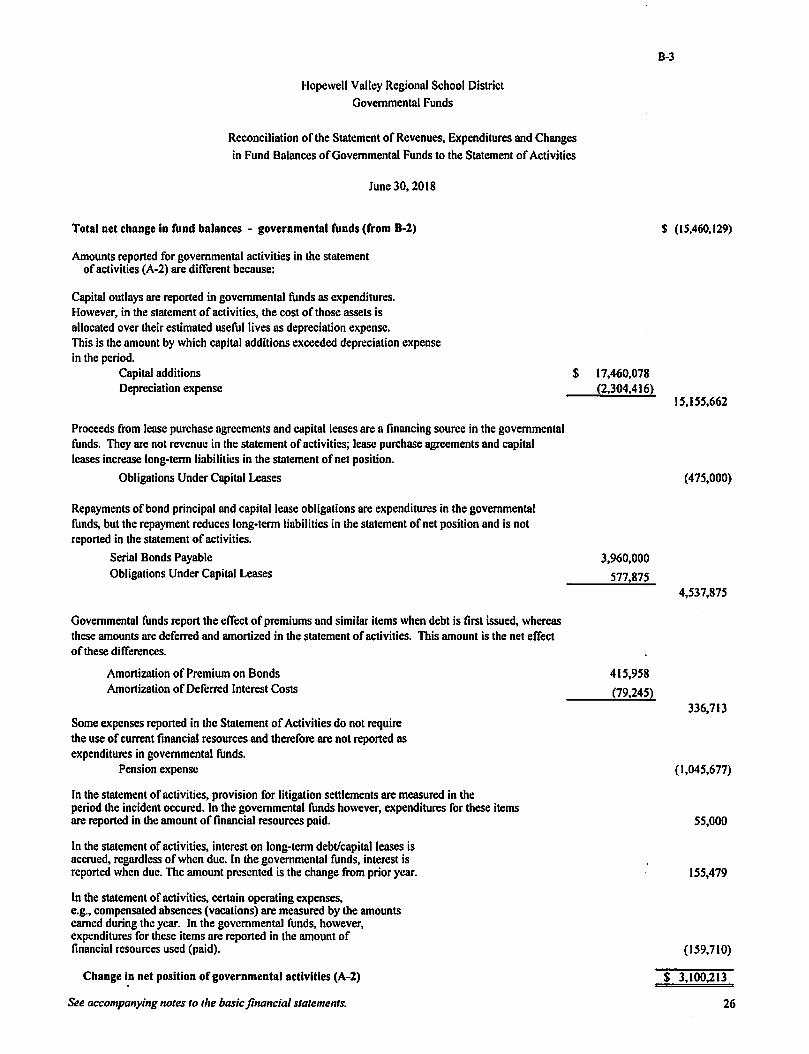
Reconciliation of the Statement of Revenues, Expenditures and Changes in Fund Balances of Governmental Funds to the Statement of Activities
June 30, 2018
Total net change in fund balances - governmental funds (from B-2)
Amounts reported for governmental activities in the statement of activities (A-2) are different because:
Capital outlays are reported in governmental funds as expenditures. However, in the statement of activities, the cost of those assets is allocated over their estimated useful lives as depreciation expense. This is the amount by which capital additions exceeded depreciation expense in the period.
Capital additions Depreciation expense
$ 17,460,078
Proceeds from lease purchase agreements and capital leases are a financing source in the governmental funds. They arc not revenue in the statement of activities; lease purchase agreements and capital leases increase long-term liabilities in the statement of net position.
Obligations Under Capital Leases
Repayments of bond principal and capital lease obligations are expenditures in the governmental funds, but the repayment reduces long-term liabilities in the statement of net position and is not reported in the statement of activities.
Serial Bonds Payable Obligations Under Capital Leases
Governmental funds report the effect of premiums and similar items when debt is first issued, whereas these amounts arc deferred and amortized in the statement of activities. This amount is the net effect of these differences.
Amortization of Premium on Bonds Amortization of Deferred Interest Costs
Some expenses reported in the Statement of Activities do not require the use of current financial resources and therefore are not reported as expenditures in governmental funds.
Pension expense
In the statement of activities, provision for litigation settlements are measured in the period the incident occured. In the governmental funds however, expenditures for these items are reported in the amount of financial resources paid.
In the statement of activities, interest on long-term debt/capital leases is accrued, regardless of when due. In the governmental funds, interest is reported when due. The amount presented is the change from prior year.
In the statement of activities, certain operating expenses, e.g., compensated absences (vacations) are measured by the amounts earned during the year. In the governmental funds, however, expenditures for these items are reported in the amount of financial resources used (paid).
Change in net position of governmental activities (A-2)
See accompanying notes to the basic financial statements.
(2,304,416)
3,960,000
577,875
415,958
(79,245)
B-3
$ (15,460,129)
15,ISS,662
(475,000)
4,537,875
336,713
(1,045,677)
55,000
155,479
(159,710)
$ 3,100,213
26

Enterprise Funds

Assets Current assets:
Cash and cash equivalents Accounts receivable:
State Federal Other
Inventories Total current assets
Non-current assets: Capital assets:
Equipment Accumulated depreciation
Total capital assets, net Total assets
Liabilities Current liabilities:
Accounts payable Unearned revenue
Total current liabilities
Net position Investment in capital assets Unrestricted Total net position
Hopewell Valley Regional School District Proprietary Funds
Combining Statement of Net Position
June 30, 2018
Major Funds Business Type Activities-
Enterprise Funds Food Driver After
Service Education School
$ 321,996 $ 84,903 $ 18,946
595 6,223 3,963
12,348 345,125 84,903 18,946
615,502 (519,977)
95,525 440,650 84,903 18,946
2,310 45,756 45,756 2,310
95,525 299,369 82,593 18,946
$ 3942894 $ 822593 $ 182946
See accompanying notes to the basic financial statements.
B-4
Totals
$ 425,845
595 6,223 3,963
12,348 448,974
615,502 {519,977)
95,525 544,499
2,310 45,756 48,066
95,525 400,908
$ 4961433 .
27

B-5
Hopewell Valley Regional School District Proprietary Funds
Combining Statement of Revenues, Expenses and Changes in Fund Net Position
June 30, 2018
Major Funds Business Type Activities -
Enterprise Funds Food Driver After
Service Education School Totals Operating revenues:
Local sources: Daily food sales-reimbursable programs $ 487,761 $ 487,761 Daily food sales- non reimbursable programs 834,220 834,220 Fees $ 18,145 $ 93,800 111,945
Total operating revenues 1,321,981 I 8,145 93,800 1,433,926
Operating expenses: Salaries 398,442 15,510 21,660 435,612 Employee benefits 99,532 1,098 1,500 102,130 Supplies and materials 63,204 23 63,227 Purchased services 70,852 70,852 Depreciation 23,385 23,385 Insurance 37,701 37,701 Cost of sales - reimbursable programs 359,326 359,326 Cost of sales - non reimbursable programs 282,486 282,486 Management and administrative fees 72,020 72,020 Other 10,790 4,360 15,150
Total operating expenses 1,346,886 20,968 94,035 1,461,889
Operating (loss) (24,905) (2,823) (235) (27,963)
Nonoperating revenues: State sources:
State school lunch program 7,724 7,724 Federal sources:
National school lunch program 82,323 82,323 Food donation program 66,499 66,499
Total nonoperating revenues 156,546 156,546
Change in net position 131,641 (2,823) (235) 128,583
Total net position-beginning 263,253 85,416 19,181 367,850 Total net position-ending $ 394,894 $ 82,593 $ 18,946 $ 496,433
See accompanying notes lo the basic financial statements. 28

Hopewell Valley Regional School District Proprietary Funds
Combining Statement of Cash Flows
June 30, 2018
Food Si:riis.i:
Cash flows from operating activities: Receipts from customers s 1,313,119 s Payments to employees (398,442) Payments for employee benefits (99,532) Payments to suppliers {912,238}
Net cash (used in) operating activities (97,093)
Cash flows from noncapital financing activities: Cash received from state and federal reimbursements 90,329 Cash received from food donation program 66499
Net cash provided by noncapital financing activities 156,828
Cash flows from capital and related financing activity: Acquisition of assets !21697}
Net cash (used in) capital financing activity (2,697)
Net increase (decrease) in cash and cash equivalents 57,038 Cash and cash equivalents, beginning of year 2641958 Cash and cash equivalents, end of year s 321.996 s
Reconciliation of operating (loss) to net cash (used in) operating activities
Operating (loss) s (24,905) S Adjustments to reconcile operating (loss) to net cash
(used in) operating activities: Depreciation 23,385 Change in assets and liabilities:
Decrease in accounts receivable 312 Decrease in inventory 3,545 (Decrease) in accounts payable (90,256) (Decrease) in unearned revenue (9,174}
Net cash (used in) operating activities s (97,093} $
Noncash noncapital financing aclivities: The District received $66,499 offood commodities from the U.S. Department of Agriculture for the year ended June 30, 2018.
See accompanying notes to the basic financial statements.
B-6
Major Funds Business Type Activities •
Ente!]!rise Funds Driver Aller
Bdus.111i120 Ss.b!H!I Totals
18,145 s 93,800 s 1,425,064 (15,SIO) (21,660) (435,612) (1,098) (1,500) (102,130) (41822} {701875} !9871935} (3,285) (235) (100,613)
90,329 661499
156,828
(21697} (2,697)
(3,285) (235) 53,518 881188 191181 372.327 84.903 s 18.946 s 425.845
(2,823) S (235) S (27,963)
23,385
312 3,S4S
(462) (90,718) (9,174}
p.285) S (235} $ (I00,613}
29

Fiduciary Funds
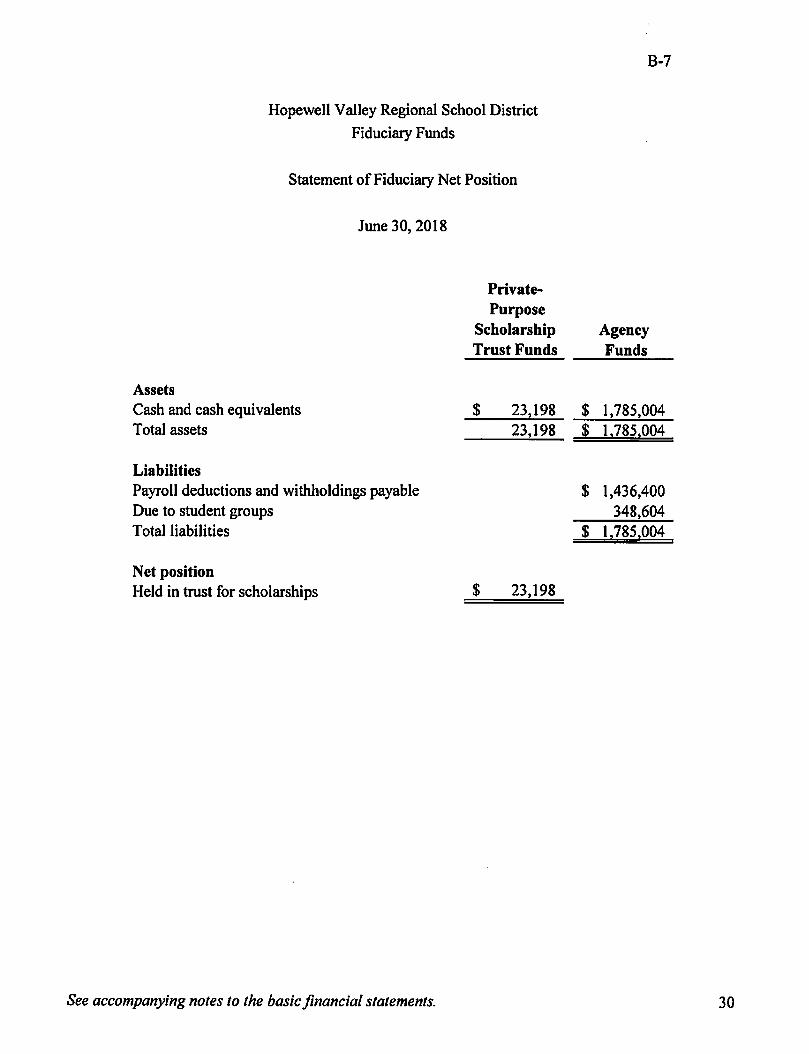
Hopewell Valley Regional School District Fiduciary Funds
Statement of Fiduciary Net Position
June 30, 2018
Private-Purpose
Scholarship Trust Funds
Assets Cash and cash equivalents $ 23,198 Total assets 23,198
Liabilities Payroll deductions and withholdings payable Due to student groups Total liabilities
Net position Held in trust for scholarships $ 23,198
See accompanying notes to the basic financial statements.
B-7
Agency Funds
$ 1,785,004 $ 1,785,004
$ 1,436,400 348,604
$ 1,785,004
30

Hopewell Valley Regional School District
Fiduciary Funds
Statement of Changes in Fiduciary Net Position
June 30, 2018
Private-Purpose
Scholarship Trust Funds
Additions Contributions:
Board contributions Plan member contributions Scholarship donations $ 12109
Total additions 12,109
Deductions Unemployment benefit payments Scholarship payments 18 700
Total deductions 18,700 Change in net position (6,591)
Net position-beginning 29 789 Net position-ending $ 23,198
See accompanying notes to the basic financial statements.
B-8
Unemployment Compensation
Trust Fund
$ 166,402 122,767
289,169
289,169
289,169
$
31

Hopewell Valley Regional School District
Notes to the Basic Financial Statements
Year ended June 30, 2018
1. Summary of Significant Accounting Policies
The financial statements of the Board of Education (Board) of the Hopewell Valley Regional School District (District) have been prepared in confonnity with accounting principles generally accepted in the United States of America (GAAP) as applied to governmental units. The Governmental Accounting Standards Board (GASB) is the accepted standard-setting body for establishing governmental accounting and financial reporting principles.
The more significant of the District's accounting policies are disclosed below:
A. Reporting Entity
The financial reporting entity consists of a) the primary government, b) organizations for which the primary government is financially accountable, and c) other organizations for which the nature and significance of their relationship with the primary government are such that exclusion would cause the reporting entity's fmancial statements to be misleading or incomplete.
The definition of the reporting entity is based primarily on the notion of financial accountability. A pri.mary government is financially accountable for the organizations that make up its legal entity. It is also financially accountable for legally separate organizations if its officials appoint a voting majority of an organization's governing body and either it is able to impose its· will on that organization or there is a potential for the organization to provide specific financial benefits to, or to impose specific financial burdens on, the primary government. A primary government may also be financially accountable for governmental organizations that are fiscally dependent on it.
The District, as the primary government for financial reporting entity purposes, has oversight responsibility and control over all activities related to the Hopewell Valley Regional School District in Pennington, New Jersey. The District receives funding from local, state, and federal government sources and must comply with the requirements of these funding source entities.
The District has no component units that are required to be included within the reporting entity, as set forth in Section 2100 of the GASB Codification of Governmental Accounting and Financial Reporting Standards.
32

Hopewell Valley Regional School District
Notes to the Basic Financial Statements ( continued)
Year ended June 30, 2018
1. Summary of Significant Accounting Policies (continued)
B. Government-wide and Fund Financial Statements
The government-wide financial statements (i.e., the statement of net position and the statement of activities) report information on all of the nonfiduciary activities of the District. Governmental activities, which normally are supported by truces and intergovernmental revenues, are reported separately from business-type activities, which rely to a significant extent on fees and charges for support.
The statement of activities demonstrates the degree to which the direct expenses of a given function or segment are offset by program revenues. Direct expenses are those that are clearly identifiable with a specific function. Program revenues include 1) charges to customers or applicants who purchase, use, or directly benefit from goods, services, or privileges provided by a given function and 2) grants and contributions that are restricted to meeting the operational or capital requirements of a particular function. Truces and other items not properly included among program revenues are reported instead as general revenues.
Separate financial statements are provided for governmental funds, proprietary funds, and fiduciary funds, even though the latter are excluded from the government-wide financial statements. Major individual governmental funds and the major individual enterprise funds are reported as separate columns in the fund financial statements. The New Jersey Department of Education requires that all funds be reported as major to promote consistency of reporting among the school districts in the State of New Jersey.
C. Measurement Focus, Basis of Accounting and Financial Statement Presentation
The government-wide financial statements are reported using the economic resources measurement focus and the accrual basis of accounting, as are the proprietary fund and fiduciary fund financial statements. Revenues are recorded when earned and expenses are recorded when a liability is incurred, regardless of the timing of related cash flows. Property truces are recognized as revenues in the year for which they are levied. Grants and similar items are recognized as revenue as soon as all eligibility requirements imposed by the provider have been met.
Governmental fund financial statements are reported using the current financial resources measurement focus and the modified accrual basis of accounting. Revenues are recognized as soon as they are both measurable and available. Revenues are considered to be available when they are collectible within the current period or soon enough thereafter to pay liabilities of the current period.
33

Hopewell Valley Regional School District
Notes to the Basic Financial Statements ( continued)
Year ended June 30, 2018
1. Summary of Significant Accounting Policies (continued)
For this purpose, the District considers all revenues, except property taxes, to be available if they are collected within 60 days of the end of the current fiscal year. Property taxes are considered to be available if they are collected within 60 days of the end of the current fiscal period. Expenditures generally are recorded when a liability is incurred, as under accrual accounting. However, debt service expenditures, as well as expenditures related to compensated absences and net pension liability are recorded only when payment is due.
Property taxes, interest, and state aid monies associated with the current fiscal period are all considered to be susceptible to accrual and so have been recognized as revenues of the current fiscal year. All other revenue items are considered to be measurable and available only when the District receives cash.
The District has reported the following major governmental funds:
General Fund: The general fund is the general operating fund of the District and is used to account for all financial resources except those required to be accounted for in another fund. Included are certain expenditures for vehicles and movable instructional or no~-instructional equipment, which are classified in the capital outlay subfund.
Special Revenue Fund: The District maintains one special revenue fund, which includes the proceeds of specific revenue sources that are restricted or committed to expenditures for specified purposes other than debt service or capital projects.
Capital Projects Fund: The capital projects fund is used to account for and report financial resources that are restricted, committed, or assigned to an expenditure for capital outlays, including the acquisition or construction of major capital facilities and other capital assets ( other than those financed by proprietary funds). The financial resources are derived from temporary notes or serial bonds, state aid and local funds that are specifically authorized by the voters as a separate question on the ballot either during the annual election or at a special election.
Debt Service Fund: The debt service fund accounts for and reports financial resources that are restricted, committed, or assigned to an expenditure for the principal and interest on long-term general obligation debt of governmental funds.
34
Hopewell Valley Regional School District
Notes to the Basic Financial Statements ( continued)
Year ended June 30, 2018
1. Summary of Significant Accounting Policies (continued)
The District reports the following major proprietary funds:
Enterprise Funds (Food Service, Driver Education, and After School): The enterprise funds account for all revenues and expenses pertaining to cafeteria, driver education, and after school operations and are utilized to account for operations that are financed and operated in a manner similar to private business enterprises. The stated intent is that the cost (i.e., expenses including depreciation and indirect costs) of providing goods and services to the students or other entities on a continuing basis are financed or recovered primarily through user charges. ·
Additionally, the District reports the following fiduciary fund types:
Fiduciary Funds of the District include the unemployment compensation trust fund, private-purpose scholarship trust funds and agency funds. Agency funds are purely custodial (assets equal liabilities) and thus do not involve measurements of results of operations. The following is a description of the fiduciary funds of the District:
Trust and Agency Funds: The trust and agency funds are used to account for assets held by the District on behalf of outside parties, including other governments, or on behalf of other funds within the District.
. Trust Funds: The unemployment compensation and private-purpose scholarship funds .are accounted for using the economic resources measurement focus. The unemployment compensation fund is used to account for contributions from the District and employees and interest earned on the balance as well as payments to the State for reimbursement of unemployment claims. The private-purpose scholarship fund is utilized to provide scholarships to students and to account for the related transactions.
Agency Funds (Payroll and Student Activity Fund): Agency funds are used to account for the assets that the District holds on behalf of others as their agent. Agency funds are custodial in nature and do not involve measurement of results of operations. As a general rule the effect of interfund activity has been eliminated from the government-wide financial statements.
As a general rule the effect of internal activity has been eliminated from the Government-wide financial statements.
Amounts reported as program revenues include 1) fees charged to customers or applicants for goods, services, or privileges provided, 2) operating grants and contributions, and 3) capital grants and contributions. Internally dedicated resources are reported as general revenues rather than as program revenues. Likewise, general revenues include all taxes.
35

Hopewell Valley Regional School District
Notes to the Basic Financial Statements ( continued)
Year ended June 30, 2018
1. Summary of Significant Accounting Policies (continued)
Enterprise funds distinguish operating revenues and expenses from nonoperating items. Operating revenues and expenses generally result from providing services and producing and delivering goods in connection with an enterprise fund's principal ongoing operations. The principal operating revenues of the District's enterprise funds are charges for sales of food, tuition for the driver education program and rental fees and fees collected related to the after school program. Operating expenses for the enterprise fund include the cost of sales, administrative expenses, and depreciation on capital assets. All revenues and expenses not meeting this definition are reported as nonoperating revenues and expenses.
The District reports unearned revenue on its balance sheet and statement of net position. Unearned revenue arises when resources are received by the District before it has legal claim to them, as when federal assistance is received prior to the incurrence of qualifying expenditures. In subsequent periods, when the District has a legal claim to the resources, the liability for unearned revenue is removed from the balance sheet and statement of net position and revenue is recognized.
Ad Valorem (Property) taxes are susceptible to accrual as, under New Jersey State Statute, a municipality is required to remit to its school district the entire balance of taxes in the ~ount voted upon or certified prior to the end of the school year. The District records the entire approved tax levy as revenue (accrued) at the start of the fiscal year, since the revenue is both measurable and available. The District is entitled to receive moneys under the established payment schedule and the unpaid amount is considered to be an "accounts receivable."
The County Board of Taxation is responsible for the assessment of properties and the Municipal Tax Collectors are responsible for the collection of taxes. Assessments are certified and taxes are levied on January 1; taxes are due on February 1, May I, August 1, and November 1. Unpaid taxes are considered delinquent the following January 1 and are then subject to lien.
36

Hopewell Valley Regional School District
Notes to the Basic Financial Statements ( continued)
Year ended June 30, 2018
1. Summary of Significant Accounting Policies (continued)
D. Budgets/Budgetary Control
Annual appropriated budgets are prepared in the spring of each year for the general, special revenue and debt service funds and submitted to the county office for approval. Budgets are prepared using the modified accrual basis of accounting and the special revenue fund uses a non-GAAP budget (budgetary basis). The legal level of budgetary control is established at line item accounts within each fund. Line item accounts are defined as the lowest (most specific) level of detail as established pursuant to the minimum chart of accounts referred in N.J.A.C. 6A:23. The over-expenditure in the general fund is due to the inclusion of the non-budgeted on-behalf payments made by the State of New Jersey as District expenditures. These amounts are offset by related revenues and as such do not represent budgetary over-expenditures. All budget amendments must be approved by School Board resolution and certain other matters require approval by the County Superintendent of Schools. Budgetary transfers were made during the current year in accordance with statutory guidelines.
Formal budgetary integration into the accounting system is employed as a management control device during the year. For governmental funds, there are no substantial differences between the budgetary basis of accounting and accounting principles generally accepted in the United States with the exception of the legally mandated revenue recognition of the last state aid payments for budgetary purposes only and the special revenue fund as noted below. Encumbrance accounting is also employed as an extension of formal budgetary integration in the governmental fund types. Unencumbered appropriations lapse at fiscal year-end.
The accounting records of the special revenue fund are maintained on the grant accounting budgetary basis. The grant accounting budgetary basis differs from GAAP in that the grant accounting budgetary basis recognizes encumbrances as expenditures and also recognizes the related revenues, whereas the GAAP basis does not. Sufficient supplemental records are maintained to allow for the presentation of GAAP basis financial reports. ·
37

Hopewell Valley Regional School District
Notes to the Basic Financial Statements ( continued)
Year ended June 30, 2018
1. Summary of Significant Accounting Policies (continued)
E. Cash, Cash Equivalents and Investments
Cash and cash equivalents include petty cash, amounts on deposit, and money market accounts with original maturities of three months or less. Investments include United States Treasury Bonds and Notes which are carried at fair value.
F. Interfund Receivables/Payables
Interfund receivables/payables represent amounts that are owed, other than charges for goods or services rendered to/from a particular fund in the District and that are due within one year.
G. Inventories
Inventories that benefit future periods, other than those recorded in the enterprise fund, are recorded as an expenditure during the year of purchase.
The food service enterprise fund inventories are valued at cost, which approximates market, using the first-in, first-out (FIFO) method. At June 30, 2018, there were no unused Food Donation Program commodities in the food service enterprise fund.
H. Capital Assets
Capital assets, which include land, property, plant and equipment and construction in progress, are reported in the applicable governmental or business-type activities columns in the government-wide financial statements. Capital assets are defined by the District as assets with an initial individual cost of more than $2,000 and an estimated useful life in excess of two years. Such assets are recorded at historical cost or through estimation procedures. Donated capital assets are valued at acquisition value at the date of acquisition.
The costs of normal repairs and maintenance that do not add to the value of the asset or materially extend the assets lives are not capitalized.
Property, plant and equipment of the District is depreciated using the straight line method. The following estimated useful lives are used to compute depreciation:
Land improvements Buildings and building improvements Machinery and equipment Vehicles Computer software
Years 20
7-60 3-20 5-10
5
38

Hopewell Valley Regional School District
Notes to the Basic Financial Statements ( continued)
Year ended June 30, 2018
1. Summary of Significant Accounting Policies (continued)
I. Compensated Absences
A liability for compensated absences that are attributable to services already rendered and that are not contingent on a specific event that is outside the control of the employer and employee is accrued as employees earn the rights to the benefits. The District uses the "vesting method" for estimating its accrued sick and vacation leave liability.
District employees are granted vacation and sick leave in varying amounts under the District's personnel policies and collective bargaining agreements. In the event of termination, an employee is reimbursed for accumulated vacation. Sick leave benefits provide for ordinary sick pay and begin vesting with the employee after one year of service.
The liability for vested compensated absences of the District is recorded in the government-wide financial statements amounted to $2,238,082 at June 30, 2018. A liability for these amounts is reported in governmental funds only if they have matured, for example, as a result of employee resignations and retirements.
J. Unearned Revenue
Unearned revenue in the special revenue fund represents cash which has been received but not yet earned. Unearned revenue in the enterprise fund consists of student deposits made for the use of purchasing food to be consumed in a future period.
K. Deferred Outflows I Inflows of Resources
In addition to assets, the statement of net position will sometimes report a separate section for deferred outflows of resources. This separate financial element, deferred outflows of resources, represents a consumption of net position that applies to future periods and so will not be recognized as an outflow of resources ( expense / expenditure) until then. The District has two items that qualify for reporting in this category, including deferred losses from the refunding of debt and deferred amounts related to pensions.
In addition to liabilities, the statement of net position will sometimes report a separate section for deferred inflows of resources. This separate financial element, deferred inflows of resources, represents an acquisition of net position that applies to future periods and so will not be recognized as an inflow of resources (revenue) until that time. The District has three items that qualify for reporting in this category, including deferred amounts related to pensions, tax levy paid in advance and the deferred gain on the refunding of debt.
39

Hopewell Valley Regional School District
Notes to the Basic Financial Statements ( continued)
Year ended June 30, 2018
1. Summary of Significant Accounting Policies (continued)
L. Deferred Loss/Gain on Defeasances of Debt
Deferred losses on refunding of debt are recorded as deferred outflows of resources. Deferred gain on refunding of debt is recorded as a deferred inflow of resources. They are amortized in a systematic and rational manner over the duration of the related debt as a component of interest and.other charges on long-term debt. The net amortization expense for the year ended June 30, 2018 amounted to $79,245. As of June 30, 2018, the District has recorded an unamortized deferred loss and deferred gain of $322,300 and $81,852 as a deferred outflow of resources and a deferred inflow of resources, respectively.
M. Long-Term Obligations
In the government-wide financial statements, and enterprise funds in the fund financial statements, long-term debt and other long-term obligations are reported as liabilities in the applicable governmental activities, business-type activities, or enterprise fund type statement of net position. Bond premiums and discounts are deferred and amortized over the life of the bonds using the straightline method which approximates the effective interest method. Bonds payable are reported net of the applicable bond premium or discount.
In the fund financial statements, governmental fund types recognize bond premiums and discounts, as well as bond issuance costs, during the current period. The face amount of debt issued is reported as other financing sources. Premiums received on debt issuances are reported as other financing sources while discounts on debt issuances are reported as other financing uses. Issuance costs, whether or not withheld from the actual debt proceeds received, are reported as either capital projects fund or debt service fund expenditures in the year of issuance.
N. Fund Balances
GASB Statement No. 54, Fund Balance Reporting and Governmental Fund Type Definitions ("GASB 54") established fund balance classifications that comprise a hierarchy based primarily on the extent to which a government is bound to observe constraints imposed upon the use of the resources reported in governmental funds. Under GASB 54, fund balances in the governmental funds financial statements are reported under the modified accrual basis of accounting and classified into the following five categories, as defined below:
I) Nonspendable - includes amounts that cannot be spent because they are either (a) not in spendable form or (b) legally or contractually required to be maintained intact. Assets included in this fund balance category include prepaid assets, inventories, long-term receivables and corpus of any permanent funds.
40

Hopewell Valley Regional School District
Notes to the Basic Financial Statements ( continued)
Year ended June 30, 2018
1. Summary of Significant Accounting Policies (continued)
N. Fund Balances (continued)
2) Restricted - includes amounts that can be spent only for the specific purposes stipulated by constitution, external resource providers, or through enabling legislation.
3) Committed - includes amounts that can be used only for the specific purposes imposed by a formal action of the government's highest level of decision-making authority. The District's highest level of decision-making authority is the Board of Education (the "Board") and formal action is taken by resolution of the Board at publicly held meetings. Once committed, amounts cannot be used for other purposes unless the Board revises or changes the specified use by taking the same action (resolution) taken to originally commit these funds.
4) Assigned - amounts intended to be used by the government for specific purposes but do not meet the criteria to be classified as restricted or committed. Intent is expressed by either the Board or Business Administrator, to whom the Board has delegated the authority to assign amounts to be used for specific purposes, including the encumbering of funds.
5) Unassigned - includes all spendable amounts not contained in the other classifications in the general fund. This classification represents fund balance that has not been assigned to other funds and that has not been restricted, committed or assigned to specific purposes within the general fund. The general fund is the only fund that reports a positive unassigned fund balance amount. In the other governmental funds, if expenditures incurred for specific purposes exceed the amounts restricted, committed or assigned to those purposes, it may be necessary to report a negative unassigned fund balance.
When both restricted and unrestricted resources are available for use, it is the District'~ policy to use restricted resources first, then unrestricted resources as they are needed. For the unrestricted fund balance, the District first spends committed funds, then assigned funds, and finally, unassigned funds.
Of the $13,186,647 of fund balance in the General Fund, $4,906,680 has been restricted in the capital reserve account, $90,003 has been restricted in the maintenance reserve account, $1,404,659 has been restricted for excess surplus - current year and will be utilized in the 2019-20 budget and $2,222,692 has been restricted for excess surplus - prior year and is being utilized in the 2018-19 budget, $381,221 of encumbrances are assigned to other purposes, $2,334,552 has been assigned as designated for subsequent years expenditures and $1,846,840 is unassigned. All of the $15,510,451 fund balance in the Capital Projects Fund is restricted for capital projects. Of the $643,404 fund balance in the Debt Service Fund, $331,075 has been budgeted for use in the 2018-19 budget and is included in restricted for debt service.
41
Hopewell Valley Regional School District
Notes to the Basic Financial Statements ( continued)
Year ended June 30, 2018
Summary of Significant Accounting Policies (continued)
0. Calculation of Excess Surplus
The designation for restricted fund balance -- excess surplus is a required calculation pursuant to N.J.S.A. 18A:7F-7, as amended. New Jersey school districts are required to reserve fund balance of the general fund at the fiscal year end of June 30 if they did not appropriate a required minimum amount as budgeted fund balance in its subsequent years' budget. The excess fund balance at June 30, 2018 was $3,629,234. Of this amount, $2,222,692 has been appropriated in the 2018-19 budget and the remaining $1,404,659 will be appropriated in the 2019-20 budget.
P. Net Position
Net position represents the difference between assets, deferred outflows of resources, deferred inflows of resources and liabilities in the government-wide financial statements. Net investment in capital assets consists of capital assets, net of accumulated depreciation, reduced by the outstanding balance of any long-term debt used to build or acquire the capital assets. Net positions are reported as restricted in the government-wide financial statements when there are limitations imposed on their use through external restrictions imposed by creditors, grantors, or laws or regulations of other governments.
Q. GASB Pronouncements
GASB Pronouncements implemented in the 2018 Fiscal Year
In June 2015, GASB issued Statement No. 75, Accounting and Financial Reporting for Postemployment Benefits Other Than Pensions. This Statement replaces the requirements of Statement 45 and requires governments to report a liability on the face of the financial statements for the OPEB that they provide. Statement No. 75 requires governments in all types of OPEB plans to present more extensive note disclosures and required supplementary information (RSI) about their OPEB liabilities. The requirements of this Statement are effective for financial statements for reporting periods beginning after June 15, 2017. The District has adopted GASB No. 75 during the year ended June 30, 2018, which resulted in an increase in full accrual revenues and expenses and additional footnote disclosures.
In March, 2017, GASB issued Statement No. 85, Omnibus 2017. This Statement establishes accounting and financial reporting requirements for blending component units, goodwill, fair value measurement and application, and postemployment benefits (pensions and other postemployment benefits). The requirements of this Statement are effective for periods beginning after June 15, 2017. The District has adopted GASB Statement No. 85 during the year ended June 30, 2018.
42

Hopewell Valley Regional School District
Notes to the Basic Financial Statements ( continued)
Year ended June 30, 2018
1. Summary of Significant Accounting Policies (continued)
Recently Issued Accounting Pronouncements
GASB issued Statement No. 84, Fiduciary Activities in January 2017. This Statement establishes standards of accounting and financial reporting for fiduciary activities. The requirements of this Statement are effective for periods beginning after December 15, 2018. Management of the District has not yet determined the impact on its financial statements.
GASB issued Statement No. 87, Leases in June 2017. This Statement establishes standards of accounting and financial reporting for leases by lessees and lessors. The requirements of this Statement are effective for periods beginning after December 15, 2019. Management of the District has not yet determined the impact on its financial statements.
R. Management Estimates
The preparation of financial statements in conformity with accounting principles generally accepted in the United States requires management to make estimates and assumptions that affect the reported amounts of revenues and expenditures/expenses during the reporting period. Actual results could differ from those estimates.
S. On-Behalf Payments
Revenues and expenditures of the general fund include payments made by the State of New Jersey for social security contributions and post-retirement medical and pension benefits for certified members of the New Jersey Teachers Pension and Annuity Fund. Additionally, revenues and expenses related to on-behalf pension, medical and long-term disability contributions in the government-wide financial statements have been increased by $7,962,948 to adjust for the full accrual basis expense incurred by the State of New Jersey during the most recent measurement period. The amounts are not required to be included in the District's annual budget.
T. Subsequent Events
Management has reviewed and evaluated all events and transactions that occurred between June 30, 2018 and February 4, 2019, the date that the financial statements were available for issuance, for possible disclosure and recognition in the financial statements, and no items have come to the attention of the District that would require disclosure.
43

Hopewell Valley Regional School District
Notes to the Basic Financial Statements ( continued)
Year ended June 30, 2018
2. Reconciliation of Government-wide and Fund Financial Statements
Explanation of Certain Differences Between the Governmental Fund Balance Sheet and the Government-wide Statement of Net Position
The governmental fund balance sheet includes a reconciliation between fund balance - total governmental funds and net position - governmental activities as reported in the government-wide statement of net position. One element of that reconciliation explains that long-term liabilities are not due and payable in the current period and therefore are not reported in the funds. The detail of this $57,712,466 difference is as follows:
Bonds payable $ Premium on bonds Litigation payable Capital leases payable Compensated absences Net adjustment to reduce fund balance-total governmental
51,135,000 2,066,184
575,000 1,698,200 2,238,082
funds to arrive at net position - governmental activities =$===5=7=, 7=1=2=,4=6=6=
3. Deposits and Investments
Investments are stated at fair value in accordance with Governmental Accounting Standards Board (GASB) Statement No. 31, "Accounting and Financial Reporting for Certain Investments and for External Investment Pools" and Statement No. 72, "Fair Value Measurement and Application." The Board classifies certificates of deposit, which have original maturity dates of more than three months but less than twelve months from the date of purchase, as investments and are stated at cost. All other investments are stated at fair value.
New Jersey school districts are limited as to the types ofinvestments and types of financial institutions they may invest in. New Jersey statute l SA:20-3 7 provides a list of permissible investments that may be purchased by New Jersey school districts. Additionally, the District has adopted a cash management plan that requires it to deposit public funds in public depositories protected from loss under the provisions of the Governmental Unit Deposit Protection Act ("GUDPA"). GUDP A was enacted in 1970 to protect governmental units from a loss of funds on deposit with a failed banking institution in New Jersey. N.J.S.A. 17:9-41 et. seq. establishes the requirements for the security of deposits of governmental units. The statute requires that no governmental unit shall deposit public funds in a public depository unless such funds are secured in accordance with the Act. Public depositories include savings and loan institutions, banks (both state and national banks) and savings banks, the deposits of which are federally insured. All public depositories must pledge collateral, having a market value at last equal to five percent of the average daily balance of collected public funds, to secure the deposits of governmental units. If a public depository fails the collateral it has pledged, plus the collateral of all other public depositories, is available to pay the full amount of their deposits to the governmental units.
44

Hopewell Valley Regional School District
Notes to the Basic Financial Statements ( continued)
Year ended June 30, 2018
3. Deposits and Investments -(continued)
Deposits
New Jersey statutes require that school districts deposit public funds in public depositories located in New Jersey that are insured by the Federal Deposit Insurance Corporation, the Federal Savings and Loan Insurance Corporation, or by any other agency of the United States that insures deposits made in public depositories. School districts are also permitted to deposit public funds in the State of New Jersey Cash Management Fund and the New Jersey Asset and Rebate Management Fund.
New Jersey statutes require public depositories to maintain collateral for deposits of public funds that exceed depository insurance limits as follows:
The market value of the collateral must equal at least 5% of the average daily balance of collected public funds on deposit.
In addition to the above collateral requirement, if the public funds deposited exceed 75% of the capital funds of the depository, the depository must provide collateral having a market value at least equal to 100% of the amount exceeding 75%.
All collateral must be deposited with the Federal Reserve Bank ofNew York, the Federal Reserve Bank of Philadelphia, the Federal Home Loan Bank of New York, or a banking institution that is a member of the Federal Reserve System and has capital funds of not less than $25,000,000.
The District's cash and cash equivalents are classified below to inform financial statement users about the extent to which a government's deposits and investments are exposed to custodial credit risk. Pursuant to GASB Statement No. 40, "Deposit and Investment Risk Disclosures" ("GASB 40"), the District's operating cash and money market accounts are profiled in order to determine exposure, if any, to Custodial Credit Risk (risk that in the event of failure of the counterparty the District would not be able to recover the value of its deposits and investments). Deposits are considered to be exposed to Custodial Credit Risk if they are: uncollateralized (securities not pledged to the depositor), collateralized with securities held by the pledging financial institution, or collateralized with securities held by the financial institution's trust department or agent but not in the government's name.
45

Hopewell Valley Regional School District
Notes to the Basic Financial Statements ( continued)
Year ended June 30, 2018
3. Deposits and Investments (continued)
The District does not have a policy for the management of custodial credit risk, other than depositing all of its funds in banks covered by GUDPA. At least five percent of the District's deposits were fully collateralized by funds held by financial institutions, but not in the name of the District. Due to the nature ofGUDPA, further information is not available regarding the full amount that is collateralized.
At June 30, 2018, the District's carrying value of its deposits was $15,176,786 and the bank balance was $17,389,133. Of the bank balance, $250,000 was secured by federal depository insurance. The New Jersey Governmental Unit Deposit Protection Act (GUDPA) covered the bank balance of $15,334,630. $1,804,503 held in the District agency accounts are not covered by GUDPA.
Investments
New Jersey statutes permit the District to purchase the following types of securities:
a. Bonds and other obligations of the United States or obligations guaranteed by the United States.
b. Bonds of any Federal Intermediate Credit Bank, Federal Home Loan Bank, Federal National Mortgage Agency or of any United States Bank for Cooperatives which have a maturity date not greater than twelve months from the date of purchase.
c. New Jersey Cash Management Fund and New Jersey Asset and Rebate Management Fund.
Custodial Credit Risk. For investments, custodial credit risk is the risk that in the event of the failure of the counter-party, the District will not be able to recover the value ofits investments or collateral securities that are in the possession of the outside party. Investment securities are exposed to custodial credit risk if the securities are uninsured and are not registered in the name of the District.
Credit Risk: The District does not have an investment policy regarding the management of credit risk. GASB 40 requires that disclosure be made as to the credit rating of all debt security investments except for obligations of the U.S. government or investments guaranteed by the U.S. government. The District manages custodial credit risk by limiting its investments to United States Treasury Notes.
Concentration of Credit Risk: The District places no limit on the amount the District may invest in any one issuer.
Interest Rate Risk: The District does not have a policy to limit interest rate risk.
46
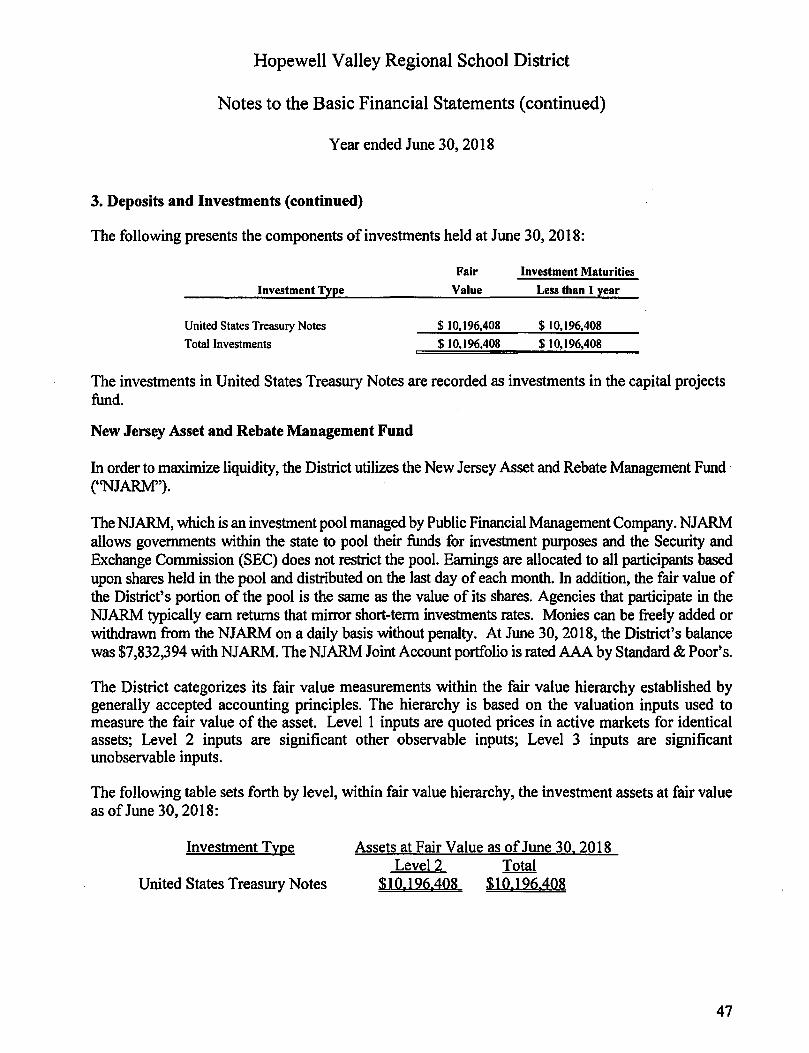
Hopewell Valley Regional School District
Notes to the Basic Financial Statements ( continued)
Year ended June 30, 2018
3. Deposits and Investments (continued)
The following presents the components of investments held at June 30, 2018:
Investment Type
United States Treasury Notes
Total Investments
Fair Investment Maturities
Value Less than I year
$ IO, 196,408 $10,196,408
$ 10,196,408 $ I0, 196,408
The investments in United States Treasury Notes are recorded as investments in the capital projects fund.
New Jersey Asset and Rebate Management Fund
In order to maximize liquidity, the District utilizes the New Jersey Asset and Rebate Management Fund (''NJARM").
The NJARM, which is an investment pool managed by Public Financial Management Company. NJARM allows governments within the state to pool their funds for investment purposes and the Security and Exchange Commission (SEC) does not restrict the pool. Earnings are allocated to all participants based upon shares held in the pool and distributed on the last day of each month. In addition, the fair value of the District's portion of the pool is the same as the value of its shares. Agencies that participate in the NJARM typically earn returns that mirror short-term investments rates. Monies can be freely added or withdrawn from the NJARM on a daily basis without penalty. At June 30, 2018, the District's balance was $7,832,394 with NJARM. The NJARM Joint Account portfolio is rated AAA by Standard & Poor's.
The District categorizes its fair value measurements within the fair value hierarchy established by generally accepted accounting principles. The hierarchy is based on the valuation inputs used to measure the fair value of the asset. Level 1 inputs are quoted prices in active markets for identical assets; Level 2 inputs are significant other observable inputs; Level 3 inputs are significant unobservable inputs.
The following table sets forth by level, within fair value hierarchy, the investment assets at fair value as of June 30, 2018:
Investment Type
United States Treasury Notes
Assets at Fair Value as of June 30, 2018 Level2 Total
$ IO, 196.408 $10,196,408
47

4. Capital Assets
Hopewell Valley Regional School District
Notes to the Basic Financial Statements ( continued)
Year ended June 30, 2018
The following schedule is a summarization of the governmental activities changes in capital assets for the year ended June 30, 2018.
Beginning Deletions/ Ending Balance Increases Transfers Balance
Governmental activities Capital assets, not being depreciated
Land $ 2,546,691 $ 2,546,691 Construction in progress 3,452,001 $ 16,892,549 20,344,550
Total capital assets, not being depreciated 5,998,692 16,892,549 22,891,241
Capital assets, being depreciated Land improvements 4,373,610 4,373,610 Buildings and building improvements 82,725,160 82,725,160 Machinery, equipment, and vehicles 7,564,499 567,529 $ (105,394) 8,026,634
Total capital assets being depreciated 94,663,269 567,529 (105,394) 95,125,404
Less accumulated depreciation for: Land improvements 1,354,082 214,043 1,568,125 Buildings and building improvements 30,461,392 1,719,768 32,181,160 Machinery, equipment, and vehicles 6,387,314 370,605 105,394 6,652,525
Total accumulated depreciation 38,202,788 2,304,416 105,394 40,401,810 Total capital assets, being depreciated, net 56,460,481 ( l, 736,887) 54,723,594 Governmental activities capital assets, net $ 62,459,173 $ 15,155,662 $ $77,614,835
48

Hopewell Valley Regional School District
Notes to the Basic Financial Statements ( continued)
Year ended June 30, 2018
4. Capital Assets -(continued)
Depreciation expense was charged to functions/programs of the District for the year ended June 30, 2018 as follows:
Regular Instruction Undistributed Instruction Attendance/social work Health services Other support services Improvement of instruction School library General administration School administration Central services Information technology Required maintenance of plant services Operation of plant Care & upkeep of grounds Security Student transportation Special Schools
$1,351,872 93,350
154 22,986
203,032 54,593 38,889 36,568 82,028 37,281 8,156
53,887 144,185
11,328 7,604
151,109 7,394
$2,304,416
The following schedule is a summarization of business-type activities changes in capital assets for the year ended June 30, 2018:
Business-type activities Capital assets, being depreciated:
Beginning Balance Increases
Ending Balance
Equipment $ 612,805 $ 2,697 $ 615,502 Less accumulated
depreciation for: Equipment
Total business-type activities capital assets, net
5. Long-Term Liabilities
Bonds Payable
$
496,592 23,385 519,977
116,213 $ (20,688) $ 95,525
Bonds are authorized in accordance with State law by the voters of the municipalities through referendums. All bonds are retired in serial installments within the statutory period of usefulness. Bonds issued by the District are general obligation bonds.
49

Hopewell Valley Regional School District
Notes to the Basic Financial Statements ( continued)
Year ended June 30, 2018
5. Long-Tenn Liabilities -(continued)
On December of 2016, the District issued $35,855,000 in 2016 School Bonds. The bonds were approved by the electorate via referendum and were issued to provide funds to undertake various renovations, alterations, additions and improvements to school facilities throughout the District. The bonds maturing prior to January 15, 2027 are not subject to optional redemption. The bonds maturing on or after January 15, 2027 are subject to optional redemption at par plus accrued interest to the date of redemption.
Principal and interest due on all serial bonds outstanding are as follows:
Fiscal year ending June 30: 2019 2020 2021 2022 2023 2024-2028 2029-2033
Principal
$ 4,230,000 4,430,000 4,180,000 4,440,000 2,990,000
16,215,000 14,650,000
$ 51,135,000
Interest Total
$ 1,992,550 $ 6,222,550 1,844,313 6,274,313 1,671,263 5,851,263 1,586,463 6,026,463 1,209,463 4,199,463 4,527,575 20,742,575 1,467,425 16,117,425
$ 14,299,052 $ 65,434,052
Bonds payable at June 30, 2018 are comprised of the following issues:
$5,665,000, 2012 refunding bonds, due in annual installments ranging from $985,000 to $1,015,000 through January 15, 2020 at interest rates ranging from 3.75% to 4.00%.
$16,290,000, 2016 refunding bonds, due in annual installments ranging from $3,120,000 to $3,540,000 through August 15, 2021 at interest rates ranging from 4.00% to 5.00%.
$35,855,000, 2016 school bonds, due in annual installments ranging from $125,000 to $3,815,000 through January 15, 2032 at interest rates ranging from 3.00% to 4.00%.
Defeased Debt
In March 2012, the District issued $5,665,000 of refunding bonds to provide resources to refund $4,755,000 of the District's 2004 bonds. As of June 30, 2018, no defeased debt remains outstanding.
On May 3, 2016, the District issued $16,290,000 ofrefunding bonds to provide resources to refund a portion of the District's outstanding debt. As of June 30, 2018, no def eased debt remains outstanding.
50

Hopewell Valley Regional School District
Notes to the Basic Financial Statements ( continued)
Year ended June 30, 2018
5. Long-Term Liabilities -(continued)
Bonds Authorized But Not Issued
As of June 30, 2018, the District had no authorized but not issued bonds.
Capital Leases Payable
In March 2014, the District entered into a capital lease for maintenance equipment in the amount of $665,000. The equipment is being leased with an interest rate of 1.52%.
In August, 2014, the District entered into a capital lease for cardiac emergency equipment in the amount of $48,610. The equipment is being leased with an interest rate of 3.33%.
In March, 2016, the District entered into a capital lease for the acquisition of buses in the amount of $180,000. The buses are being leased with an interest rate of2.93%.
In November 2016, the District entered into a capital lease for the acquisition of various vehicles in the amount of $295,000. The vehicles are being leased with an interest rate of 1.905%. In May 2017 the District entered into a capital lease for computer equipment and server upgrades in the amount of $1,190,000. The equipment is being leased with an interest rate of 1.69%. In November 2017, the District entered into a capital lease for the acquisition of buses, a vehicle and various equipment in the amount of $475,000. The buses, vehicle and equipment are being leased with an interest rate of 1.931%.
The following is a schedule of the future minimum lease payments under these capital leases, and the present value of the net minimum lease payments at June 30, 2018:
Year: 2019 2020 2021 2022 Total minimum lease payments Less amounts representing interest
Present value of net minimum lease payments
Amount
$ 585,427 516,445 517,870 137,916
$1,757,658 (59,458)
$1,698,200
51

Hopewell Valley Regional School District
Notes to the Basic Financial Statements ( continued)
Year ended June 30, 2018
5. Long-Term Liabilities-(continued)
Changes in Long-term Liabilities
Beginning Ending Balance Additions Reductions Balance
Governmental activities: Bonds payable $ 55,095,000 $3,960,000 $51, 135,000 Premium on bonds 2,482,142 415,958 2,066,184 Litigation payable 630,000 55,000 575,000 Capital leases 1,801,075 $475,000 577,875 1,698,200 Compensated absences 210781372 2531380 931670 212381082
Subtotal 62,086,589 728,380 5,102,503 57,712,466 Net pension liability 3219081916 711741710 2517341206 Total governmental
activity long-term liabilities $94,995,505 $728,380 $12,277,213 $83,4461672
Due within One Year
$4,230,000 415,958
556,527 1741932
5,377,417
$5,377,417
Compensated absences, the legal settlement, net pension liability and capital lease liabilities are liquidated by expenditures charged to the general fund. Bonds payable are liquidated by expenditures charged to the debt service fund.
6. Pension Plans
Description of Systems
Substantially all of the District's employees participate in one of the following contributory defined benefit public employee retirement systems which have been established by State statute: . the Teachers' Pension and Annuity Fund (TP AF) or the Public Employees' Retirement System (PERS). These systems are sponsored and administered by the State ofNew Jersey.
The Teachers' Pension and Annuity Fund Retirement System is considered a cost-sharing multipleemployer plan, with a special funding situation, as under current statute, all employer contributions are made by the State of New Jersey on behalf of the District and the system's other related non-contributing employers. The Public Employees' Retirement System is considered a cost-sharing multiple-employer plan.
Teachers' Pension and Annuity Fund
The Teachers' Pension and Annuity Fund was established in January 1955 under the provisions of N.J.S.A. l 8A:66 to provide coverage including post-retirement health care to substantially all full time public school employees in the State. Membership is mandatory for such employees and vesting occurs after 10 years of service for pension benefits and 25 years for health care coverage. Age eligibility and benefit provisions were affected by Chapters 92 and 103, P.L. 2007, Chapter 89, P.L. 2008, Chapter 1, P.L. 2010, and Chapter 78, P.L. 2011. Members are classified into one of five tiers dependent upon the date of their enrollment. Tier 1, 2 and 3 members are eligible to retire at age 60, 60, and 62,
52

Hopewell Valley Regional School District
Notes to the Basic Financial Statements ( continued)
Year ended June 30, 2018
6. Pension Plans - (continued)
Teachers' Pension and Annuity Fund (continued)
respectively with an annual benefit generally detennined to be 1155th of the average annual compensation for the highest three fiscal years' compensation for each year of membership during years of credited service. Tier 4 and 5 members are eligible to retire at age 62 and 65, respectively, with an annual benefit generally detennined to be 1160th of the average annual compensation for the highest five fiscal years' compensation for each year of membership during years of credited service. Anyone who retires early and is under their respective tier's retirement age receives retirement benefits as calculated in the above mentioned formulas but at a reduced rate in accordance with applicable New Jersey Statute based upon their tier.
Public Employee's Retirement System
The Public Employees' Retirement System was established in January 1955 under the provisions of N.J.S.A. 43:15A to provide coverage including post-retirement health care to substantially all full time employees of the State or any county, municipality, school Board or public agency provided the employee is not a member of another State-administered retirement system. Age eligibility and benefit provisions were affected by Chapters 92 and 103, P.L. 2007, Chapter 89, P.L. 2008, Chapter 1, P.L. 2010, and Chapter 78, P.L. 2011. Members are classified into one of five tiers dependent upon the date of their enrollment. Tier 1, 2 and 3 members are eligible to retire at age 60, 60, and 62, respectively with an annual benefit generally detennined to be 1/55111 of the average annual compensation for the highest three fiscal years' compensation for each year of membership during years of credited service. Tier 4 and 5 members are eligible to retire at age 62 and 65, respectively with an annual benefit generally determined to be 1/60111
of the average annual compensation for the highest five fiscal years' compensation for each year of membership during years of credited service. Anyone who retires early and is under their respective tier's retirement age receives retirement benefits as calculated in the above mentioned formulas but at a reduced rate in accordance with applicable New Jersey Statute based upon their tier.
The State of New Jersey, Department of the Treasury, Division of Pensions and Benefits, issued publicly available financial reports that include the financial statements and required supplementary information for TP AF and PERS. The financial reports may be obtained by writing to the State of New Jersey, Department of the Treasury, Division of Pensions and Benefits, P.O. Box 295, Trenton, New Jersey 08625-0295.
Funding Policy
The contribution policy is set by New Jersey State Statutes and contributions are required by active members and contributing members. Plan member and employer contributions may be amended by State of New Jersey legislation. Under the provisions of Chapter 78, P.L. 2011, employee contribution rates for TPAF and PERS increased from 5.5% to 6.5% of employees' annual compensation. An additional increase is being phased in annually through July, 2018 that will bring the total pension contribution rate to 7.5% of employees' annual compensation. Employers are required to contribute at
53

Hopewell Valley Regional School District
Notes to the Basic Financial Statements ( continued)
Year ended June 30, 2018
6. Pension Plans -(continued)
Funding Policy (continued)
an actuarially detennined rate in both the TP AF and PERS. The actuarially detennined contribution includes funding for noncontributory death benefits and post-retirement medical premiums. Under current statute the Board is a non-contributing employer of the TP AF.
During the year ended June 30, 2018, the State of New Jersey contributed $7,962,948 to the TPAF for post-retirement medical benefits, disability insurance and pensions on behalf of the District. Also, in accordance with N.J.S.A. 18A:66-66, the State of New Jersey reimbursed the District $2,465,312 during the year ended June 30, 2018 for the employer's share of social security contributions for TP AF members as calculated on their base salaries. These amounts have been included in the government-wide and fund financial statements.
The District's actuarially determined contributions to PERS for the years ended June 30, 2018, 2017 and 2016 were $1,039,948 $987,125 and $966,330, respectively, equal to the required contributions for each year.
Pension Liabilities, Pension Expense, and Deferred Outflows of Resources and Deferred Inflow of Resources Related to Pensions (continued)
Public Employee's Retirement System (PERS)
For purposes of measuring the net pension liability, deferred outflows of resources and deferred inflows of resources related to pensions, and pension expense, infonnation about the. fiduciary net position of PERS and additions to/deductions from PERS fiduciary net position have been detennined on the same basis as they are reported by PERS. For the purpose, benefit payments (including refunds of employee contributions) are recognized when due and payable in accordance with the benefit tenns. Investments are reported at fair value.
At June 30, 2018, the District reported a liability of$25,734,206 for its proportionate share of the net pension liability. The net pension liability was measured as of June 30, 2017, and the total pension liability used to calculate the net pension liability was detennined by an actuarial valuation July 1, 2016, which was rolled forward to June 30, 2017. The District's proportion of the net pension liability was based on a projection of the District's long-tenn share of contributions to the pension plan relative to the projected contributions of all participating school districts, actuarially determined. At June 30, 2017, the District's proportion was 0.1105497103 percent, which was a decrease of 0.000564 7506 from its proportion measured as of June 30, 2016. For the year ended June 30, 2018, the District recognized full accrual pension expense of $1,045,677 in the government-wide financial statements. At June 30, 2018, the District reported deferred outflows of resources and deferred inflows of resources related to PERS from the following sources:
54

Hopewell Valley Regional School District
Notes to the Basic Financial Statements ( continued)
Year ended June 30, 2018
6. Pension Plans ( continued)
Pension Liabilities, Pension Expense, and Deferred Outflows of Resources and Deferred Inflow of Resources Related to Pensions (continued)
Public Employee's Retirement System (PERS) (continued)
Difference between expected and actual experience Changes of assumptions Net difference between projected and actual earnings
on pension plan investments Changes in proportion District contributions subsequent to the measurement date
Deferred Outflows of Resources $ 605,952
5,184,556
175,233 725,166
1,142,038 $ 7,832,945
Deferred Inflows of Resources
$ · 5,165,548
264,189
$5.429,737
$1,142,038 is reported as deferred outflows of resources related to pensions resulting from school district contributions subsequent to the measurement date. Other amounts reported as deferred outflows of resources and deferred inflows of resources related to pensions will be recognized in pension expense as follows:
Actuarial Assumptions
Year ended June 30: 2019 2020 2021 2022 2023
$ 798,375 I, 100,854
623,600 (624,681) (636,978)
$ 1,261,170
The total pension liability for the June 30, 2017 measurement date was determined by an actuarial valuation as of July 1, 2016, which was rolled forward to June 30, 2017. This actuarial valuation used the following actuarial assumptions, applied to all periods included in the measurement:
Inflation rate Salary increases
through 2026
Thereafter
Investment rate of return
2.25%
1.65% - 4.15% based on age
2.65% - 5.15% based on age
7.00%
55

Hopewell Valley Regional School District
Notes to the Basic Financial Statements ( continued)
Year ended June 30, 2018
6. Pension Plans ( continued)
Actuarial Assumptions (continued)
The actuarial assumptions used in the July 1, 2016 valuation were based on the results of an actuarial experience study for the period July 1, 2011 to June 30, 2014. It is likely that future experience will not exactly conform to these assumptions. To the extent that actual experience devia~es from these assumptions, the emerging liabilities may be higher or lower than anticipated. The more the experience deviates, the larger the impact on future financial statements.
Mortality Rates
Pre-retirement mortality rates were based on the RP-2000 Preretirement Mortality Table for male and female active participants. For State employees, mortality tables are set back 4 years for males and females. For local employees, mortality tables are set back 2 years for males and 7 years for females. In addition, the tales provide for future improvements in mortality from the base year of 2013 using a generational approach based on the plan actuary's modified MP-2014 projection scale. Postretirement mortality rates were based on the RP-2000 Combined Healthy Male and Female Mortality Tables (set back 1 year for males and females) for service retirements and beneficiaries of former members and a one year static projection based on mortality improvement Scale AA. In addition, the tables for service retirements and beneficiaries of formers members provide for future improvements in mortality from the base year of 2013 using a generational approach based on the plan actuary's modified MP-2014 projection scale. Disability retirement rates used to value disables retirees were based on the RP-2000 Disabled Mortality Table (set back 3 years for males and set forward 1 year for females).
Long-Term Rate of Return
In accordance with State statute, the long-term expected rate of return on plan investments (7.00% at June 30, 2017) is determined by the State Treasurer, after consultation with the Directors of the Division oflnvestments and Division of Pensions and Benefits, the board of trustees and.the actuaries. The long-term expected rate of return was determined using a building block method i'n which bestestimate ranges of expected future real rates of return ( expected returns, net of pension plan investment expense and inflation) are developed for each major asset class. These ranges are combined to produce the long-term expected rate of return by weighting the expected future real rates of return by the target asset allocation percentage and by adding expected inflation. Best estimates of arithmetic real rates of return for each major asset class included in PERS's target asset allocation as of June 30, 2017 are summarized in the following table:
56

Hopewell Valley Regional School District
Notes to the Basic Financial Statements ( continued)
Year ended June 30, 2018
6. Pension Plans (continued)
Long-Term Rate of Return (continued)
Asset Class Absolute return/risk mitigation Cash equivalents U.S. Treasuries Investment grade credit Public high yield Global diversified credit Credit oriented hedge funds Debt related private equity Debt related real estate Private real asset Equity related real estate U.S. equity Non-U.S. developed markets equity Emerging markets equity Buyouts/venture capital
Target Allocation
5.00% 5.50% 3.00% 10.00% 2.50% 5.00% 1.00% 2.00% 1.00% 2.50% 6.25% 30.00% II.SO% 6.50% 8.25%
100.00%
Long-Term Expected Real Rate of Return
5.51% 1.00% 1.87% 3.78% 6.82% 7.10% 6.60% 10.63% 6.61% 11.83% 9.23% 8.19% 9.00% 11.64% 13.08%
57

Hopewell Valley Regional School District
Notes to the Basic Financial Statements ( continued)
Year ended June 30, 2018
6. Pension Plans (continued)
Discount rate
The discount rate used to measure the total pension liability was 5.00% as of June 30, 2017. This single blended discount rate was based on the long-term expected rate of return on pension plan investments of 7.00%, and a municipal bond rate of 3.58% as of June 30, 2017 based on the Bond Buyer GO 20-Bond Municipal Bond Index which includes tax-exempt general obligation municipal bonds with an average rating of AA/Aa or higher. The projection of cash flows used to determine the discount rate assumed that contributions from plan members will be made at the current member contribution rates and that contributions from employers will be made based on the contribution rate in the most recent fiscal year. The State employer contributed 40% of the actuarially determined contributions and the local employers contributed 100% of their actuarially determined contributions. Based on those assumptions, the plan's fiduciary net position was projected to be available to make projected future benefit payments of current plan members through 2040. Therefore, the long-term expected rated of return on plan investments was applied to projected benefit payments through 2040 and the municipal bond rate was applied to projected benefit payments after that date in determining the total pension liability.
Sensitivity of the District's proportionate share of the net pension liability to changes in the discount rate
The following presents the District's proportionate share of the net pension liability as of June 30, 2017 calculated using the discount rate as disclosed above as well as what the District's proportionate share of the net pension liability would be if it were calculated using a discount rate that is I -percentage-point lower (4.00 percent) or I-percentage-point higher (6.00 percent) than the current rate:
District's proportionate share of the net pension liability
Pension Plan Fiduciary Net Position
At1% Decrease (4.00%)
At Current Discount Rate
(5.00%)
At1% Increase (6.00%)
$ 31,925,029 $ 25,734,206 $ 20,576,483
Detailed information about the pension plan's fiduciary net position is available in the separately issued financial report for the State of New Jersey Public Employees Retirement System.
58

Hopewell Valley Regional School District
Notes to the Basic Financial Statements ( continued)
Year ended June 30, 2018
6. Pension Plans ( continued)
Additional Information
Collective balances of the Local Group at June 30, 2017 are as follows:
Deferred outflows of resources $ 6,424,455,842 Deferred inflows of resources $ 5,700,625,981 Net pension liability $ 23,278,401,588
District's Proportion 0.1105497103%
Collective pension expense for the Local Group for the measurement period ended June 30, 2017 is $1,694,305,613.
The average of the expected remaining service lives of all employees that are provided with pension through the pension plan (active and inactive employees) determined at July 1, 2017, 2016, 2015 and 2014 is 5.48, 5.57, 5.72 and 6.44 years, respectively.
Special Funding Situation - Teachers Pensions and Annuity Fund ([P AF)
The employer contributions for local participating employers are legally required to be funded by the State in accordance with N.J.S.A. 18:66-33. Therefore, these local participating employers are considered to be in a special funding situation as defined by GASB Statement No. 68 and the State is treated as a nonemployer contributing entity. Since the local participating employers do not contribute directly to the plan ( except for employer specific financed amounts), there is no net pension liability or deferred outflows or inflows to report in the financial statements of the local participating employers. However, the notes to the financial statements of the local participating employers must disclose the portion of the nonemployer contributing entities' total proportionate share of the net pension liability that is associated with the local participating employer.
The State's proportionate share of the TP AF net pension liability associated with the District as of June 30, 2017 was $212,261,796. The District's proportionate share was $0.
The net pension liability was measured as of June 30, 2017, and the total pension liability used to calculate the net pension liability was determined by an actuarial valuation as of July 1, 2016, which was rolled forward to June 30, 2017. The State's proportionate share of the net pension liability associated with the District was based on a projection of the State's long-term contributions to the pension plan associated with the District relative to the projected contributions by the State associated with all participating school districts, actuarially determined. At June 30, 2017, the State's proportionate share of the TP AF net pension liability associated with the District was 0.3148182207 percent, which was a decrease of0.0045458784 from its proportion measured as of June 30, 2016.
59

Hopewell Valley Regional School District
Notes to the Basic Financial Statements ( continued)
Year ended June 30, 2018
6. Pension Plans (continued)
For the year ended June 30, 2018, the District recognized on-behalf pension expense and revenue in the government-wide financial statements of$12,992,531 for contributions incurred by the State.
Actuarial assumptions
The actuarial valuation used the following actuarial assumptions, applied to all periods included in the measurement:
Mortality Rates
Inflation rate Salary increases
2012-2021
2.25%
Varies based on experience
Thereafter Varies based on experience
Investment rate ofreturr 7.00%
Pre-retirement, post-retirement and disabled mortality rates were based on the experience of TP AF members reflecting mortality improvement on a generational basis based on a 60-year average of Social Security data from 1953 to 2013.
The actuarial assumptions used in the July 1, 2016 valuation were based on the results of an actuarial experience study for the period July 1, 2012 to June 30, 2015.
Long-Term Expected Rate of Return
In accordance with State statute, the long-term expected rate of return on plan investments (7.00% at June 30, 2017) is determined by the State Treasurer, after consultation with the Directors of the Division of Investments and Division of Pensions and Benefits, the board of trustees and the actuaries. The long-term expected rate of return was determined using a building block method in which bestestimate ranges of expected future real rates of return ( expected returns, net of pension plan investment expense and inflation) are developed for each major asset class. These ranges are combined to produce the long-term expected rate of return by weighting the expected future real rates of return by the target asset allocation percentage by adding expected inflation.
Best estimates of arithmetic real rates of return for each major asset class included in TPAF's target asset allocation as of June 30, 2017 are summarized in the following table:
60

Hopewell Valley Regional School District
Notes to the Basic Financial Statements ( continued)
Year ended June 30, 2018
6. Pension Plans (continued)
Asset Class Absolute return/risk mitigation Cash equivalents U.S. Treasuries Investment grade credit Public high yield Global diversified credit Credit oriented hedge funds Debt related private equity Debt related real estate Private real asset Equity related real estate U.S. equity Non-U.S. developed markets equity Emerging markets equity Buyouts/venture capital
Discount Rate
Target Allocation
5.00% 5.50% 3.00% 10.00% 2.50% 5.00% 1.00% 2.00% 1.00% 2.50% 6.25%
30.00% 11.50% 6.50% 8.25%
100.00%
Long-Tenn Expected Real Rate of Return
5.51% 1.00% 1.87% 3.78% 6.82% 7.10% 6.60% 10.63% 6.61% 11.83% 9.23% 8.19% 9.00% 11.64% 13.08%
The discount rate used to measure the total pension liability was 4.25% as of June 30, 2017. This single blended discount rate was based on the long-term rate of return on pension plan investments of 7 .00%, and a municipal bond rate of 3.58% as of June 30, 2017 based on the Bond Buyer GO 20-Bond Municipal Bond Index which includes tax-exempt general obligation municipal bonds with an average rating of AA/ Aa or higher. The projection of cash flows used to determine the discount rate assumed that contributions from plan members will be made at the current member contribution rates and that contributions from employers will be made based on the contribution rate in the most recent fiscal year. The State contributed 40% of the actuarially determined contributions. Based on those assumptions, the plan's fiduciary net position was projected to be available to make projected future benefit payments of current plan members through 2036. Therefore, the long-term expected rate of return on plan investments was applied to projected benefit payments through 2036, and the municipal bond rate was applied to projected benefit payments after that date in determining the total pension liability.
Sensitivity of the State 's proportionate share of the net pension liability associated with the District to changes in the discount rate
The following presents the State's proportionate share of the net pension liability associated with the District as of June 30, 2017 calculated using the discount rate as disclosed above as well as what the State's proportionate share of the net pension liability associated with the District would be if it
61

Hopewell Valley Regional School District
Notes to the Basic Financial Statements ( continued)
Year ended June 30, 2018
6. Pension Plans (continued)
were calculated using a discount rate that is I-percentage-point lower (3.25 percent) or 1-percentagepoint higher (5.25 percent) than the current rate:
State's proportionate share of the net pension liability
At1% Decrease (3.25%)
At Current Discount Rate
(4.25%)
At1% Increase (5.25%)
associatedwiththeDistrict $252,173,672 $212,261,796 $179,382,219
Detailed information about the pension plan's fiduciary net position is available in the separately issued TP AF financial report.
Additional Information
Collective balances of the Local Group at June 30, 2017 are as follows:
Deferred outflows of resources $ 14,251,854,934 Deferred inflows of resources $ 11,807,238,433 Net pension liability $ 67,423,605,859
State's proportionate share associated with the District 0.3148182207%
Collective pension expense for the plan for the measurement period ended June 30, 2017 is $4,682,493,081.
The average of the expected remaining service lives of all employees that are provided with pension through the pension plan (active and inactive employees) determined at July I, 2017, 2016, 2015 and 2014 is 8.3, 8.3, 8.3 and 8.5 years, respectively.
7. Post-Retirement Benefits
Plan description and benefits provided
The School District contributes to the New Jersey State Health Benefits Program (the "SHBP"}, a multiple-employer defined benefit postemployment healthcare plan administered by the State of New Jersey Division of Pension and Benefits. SHBP provide medical, prescription drug, mental health/substance abuse and Medicare Part B reimbursement to retirees and their covered dependents. The State Health Benefits Program Act is found in New Jersey Statutes Annotated, Title 52, Article 17.25 et. seq. Rules governing the operation and administration of the program are found in Title 17,
62

Hopewell Valley Regional School District
Notes to the Basic Financial Statements ( continued)
Year ended June 30, 2018
7. Po~t-Retirement Benefits -(continued)
Chapter 9 of the New Jersey Administrative Code. The State of New Jersey Division of Pension and Benefits issues a publicly available financial report that includes financial statements and required supplementary information for SHBP. That report may be obtained by writing to Division of Pension and Benefits, PO Box 295, Trenton, NJ 08625-0295.
The State's contributions to the SHBP Fund for TP AF retirees' post-retirement benefits on behalf of the District for the years ended June 30, 2018, 2017 and 2016 were $3,122,303, $2,950,531 and $3,044,624, respectively, which equaled the required contributions for each year.
P.L. 1987, c.384 and P.L. 1990, c.6 required the Teachers' Pensions and Annuity Fund (TPAF) and the Public Employees' Retirement System (PERS), respectively, to fund post-retirement medical benefits for those state employees who retire after accumulating 25 years of credited service or on a disability retirement. P.L. 2007, c.103 amended the law to eliminate the funding of post-retirement medical benefits through the TP AF and PERS. It created separate funds outside of the pension plans for the funding and payment of post-retirement medical benefits for retired state employees and retired educational employees. The cost of these benefits is funded through contributions by the State in accordance with P.L. 1994, c.62. Funding of post-retirement medical benefits changed from a prefunding basis to a pay-as-you-go basis beginning in Fiscal Year 1994. As the employer contributions for local government education employers are legally required to be funded by the State, this constitutes a special funding situation as defined by GASB Statement No. 75 (GASB 75) and the State is treated as a non-employer contributing entity.
The State is also responsible for the cost attributable P.L. 1992, c.126, which provides employer paid health benefits to members of PERS and the Alternate Benefit Program (APB) who retired from a board of education or county college with 25 years of service.
The School Employees Health Benefits Program (SEHBP) Act is found in New Jersey Statutes Annotated, Title 52, Article 17.25 et. seq. Rules governing the operation and administration of the program are found in Title 17, Chapter 9 of the New Jersey Administrative Code.
The State provides OPEB benefits through a defined benefit OPEB plan that is not administered through a trust that meets the criteria in paragraph 4 of GASB 75. No assets are accumulated in a trust that meets the criteria in paragraph 4 of GASB 75.
Total OPEB Liability
The net OPEB liability from New Jersey's plan is $53,639,841,858.
63

Hopewell Valley Regional School District
Notes to the Basic Financial Statements ( continued)
Year ended June 30, 2018
7. Post-Retirement Benefits - (continued)
Changes in the Total OPEB Liability
Below represents the changes in the State's portion of the OPEB liability associated wi.th the District for. the year ended June 30, 2017:
Beginning Total OPEB Liability, June 30, 2016
Changes for the year: Service cost Interest cost Changes of assumptions Member contributions Gross benefit payments
Net changes
Ending Total OPEB Liability, June 30, 2017
Employees covered by benefit terms
Total OPEB Liability $ 165,557,124
$
6,825,202 4,864,441
(20,323,672) 130,917
(3,555.355) ( 12,058,467)
153,498.657
The following employees were covered by the benefit tenns:
Local Education June 30, 2017
Active Plan Members 223,747 Inactive Plan Members or Beneficiaries Currently Receiving Benefit 142,331 Inactive Plan Members Entitled to but Not Yet Receiving Benertts Total Plan Members 366,078
The State, a nonemployer contributing entity, is the only entity that has a legal obligation to make employer contributions to OPEB for qualified retired PERS and TPAF participants. The District's proportionate share percentage detennined under paragraphs 193 and 203 through 205 of GASBS No. 75 is zero percent. Accordingly, the District did not recognize any portion of the collective net OPEB liability on the Statement of Net Position. The State's proportionate share of the net OPEB liability associated with the District as of June 30, 2017 was $153,498,657. Additional infonnation can be obtained from the State of New Jersey's comprehensive annual financial report.
64
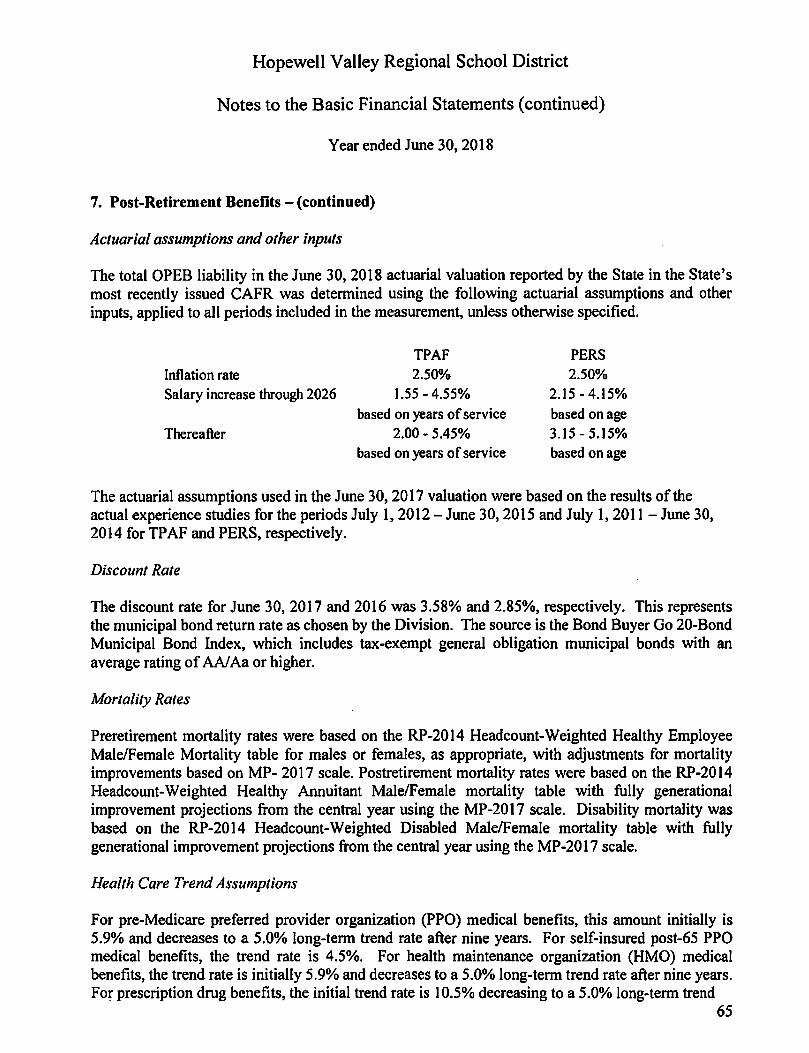
Hopewell Valley Regional School District
Notes to the Basic Financial Statements ( continued)
Year ended June 30, 2018
7. Post-Retirement Benefits -(continued)
Actuarial assumptions and other inputs
The total OPEB liability in the June 30, 2018 actuarial valuation reported by the State in the State's most recently issued CAFR was determined using the following actuarial assumptions and other inputs, applied to all periods included in the measurement, unless otherwise specified.
Inflation rate Salary increase through 2026
Thereafter
TPAF 2.50%
1.55 - 4.55% based on years of service
2.00-5.45% based on years of service
PERS 2.50%
2.15 -4.15% based on age 3.15-5.15% based on age
The actuarial assumptions used in the June 30, 2017 valuation were based on the results of the actual experience studies for the periods July 1, 2012 -June 30, 2015 and July 1, 2011 -June 30, 2014 for TPAF and PERS, respectively.
Discount Rate
The discount rate for June 30, 2017 and 2016 was 3.58% and 2.85%, respectively. This represents the municipal bond return rate as chosen by the Division. The source is the Bond Buyer Go 20-Bond Municipal Bond Index, which includes tax-exempt general obligation municipal bonds with an average rating of AA/ Aa or higher.
Mortality Rates
Preretirement mortality rates were based on the RP-2014 Headcount-Weighted Healthy Employee Male/Female Mortality table for males or females, as appropriate, with adjustments for mortality improvements based on MP- 2017 scale. Postretirement mortality rates were based on the RP-2014 Headcount-Weighted Healthy Annuitant Male/Female mortality table with fully generational improvement projections from the central year using the MP-2017 scale. Disability mortality was based on the RP-2014 Headcount-Weighted Disabled Male/Female mortality table with fully generational improvement projections from the central year using the MP-2017 scale.
Health Care Trend Assumptions
For pre-Medicare preferred provider organization (PPO) medical benefits, this amount initially is 5.9% and decreases to a 5.0% long-term trend rate after nine years. For self-insured post-65 PPO medical benefits, the trend rate is 4.5%. For health maintenance organization (HMO) medical benefits, the trend rate is initially 5.9% and decreases to a 5.0% long-term trend rate after nine years. For prescription drug benefits, the initial trend rate is 10.5% decreasing to a 5.0% long-term trend
65

Hopewell Valley Regional School District
Notes to the Basic Financial Statements ( continued)
Year ended June 30, 2018
7. Post-Retirement Benefits -(continued)
rate after eight years. For the Medicare Part B reimbursement, the trend rate is 5.0%. The Medicare Advantage trend rate is 4.5% and will continue in all future years.
The following represents sensitivity of the State's proportionate share of the net OPEB liability associated with the District to changes in the discount rate and healthcare cost trend rate.
The following presents the State's proportionate share of the net OPEB liability attributed with the District as of June 30, 2017 calculated using a discount rate that is I-percentage-point lower (2.58%) or I-percentage-point higher (4.58%) than the current discount rate:
Net OPEB Liablility (Allocable to the District and the responsibility
of the State)
At 1% Decrease (2.58%}
At Current Discount Rate
(3.58%}
Atl% Increase (4.58%}
$ 182,213,980 $ 153,498,657 $ 130,721,390
The following presents the State's proportionate share of the net OPEB liability associated with the District as of June 30, 2017 calculated using a healthcare cost trend rate that is I-percentage-point lower or I-percentage-point higher than the current healthcare cost trend rate:
At I% Decrease
At Current Healthcare Trend Rate
At 1% Increase
Net OPEB Liability (Allocable to the District and the responsibility
of the State) $ 126,237,807 $ 153,498,657 $ 189,700,745
OPEB Expense and Deferred Outflows of Resources and Deferred Inflows of Resources Related to OPEB
For the year ended June 30, 2018, the District recognized on-behalf OPEB expense and revenue in the government-wide financial statements of$6,434,600 for OPEB expenses incurred by the State.
Collective balances of the Local Education Group at June 30, 2017 are as follows:
Deferred outflows of resources Deferred inflows of resources Collective OPEB expense
District's Proportion
$ 99,843,255 $ 6,443,612,287 $ 3,348,490,523
0.2861653795%
66

Hopewell Valley Regional School District
Notes to the Basic Financial Statements ( continued)
Year ended June 30, 2018
7. Post-Retirement Benefits -(continued)
Special Funding Situation
The employer contributions for local participating employers are legally required to be funded by the State, therefore, the District records an expense and corresponding revenue for its respective share of total OPEB expense and revenue attributable to the State of New Jersey.
8. Risk Management
The District is exposed to various risks of loss related to torts; theft, damage or destruction of assets; errors or omissions; employee health and accident claims; and natural disasters.
Property, Liability and Health Insurance
The District maintains commercial insurance coverage for property, liability, health, student and other accident claims and surety bonds and does not retain risk of loss. A complete schedule of insurance coverage can be found in the Statistical Section of this Comprehensive Annual Financial Report. There have been no significant reductions in insurance coverage from the prior year and no settlements have exceeded insurance coverages over the past three years.
New Jersey Unemployment Compensation Insurance
The District has elected to fund its New Jersey Unemployment Compensation Insurance under the "Contributory Method_,' Under this plan, the District has a quarterly contribution due based on the amount of wages paid for the quarter and remits these funds with the employee withholdings to the State.
9. Deferred Compensation
The District offers its employees a choice of deferred compensation plans created in accordance with Internal Revenue Code Section 403(b). The plans, which are administered by the District and various insurance companies, permit participants to defer a portion of their salary until future years. Amounts deferred under the . plan are not available to employees until termination, retirement, death or unforeseeable emergency.
Participants' rights under the plan are equal to those of general creditors in an amount equal to the fair market value of the deferred account of each participant. The District has no liability for losses under the plan.
The plan members' contributions to the deferred compensation plans for the years ended June 30, 2018, 2017 and 2016 were $1,244,365, $1,177,561 and $1,101,092, respectively. The District does not contribute to these plans on behalf of plan members.
67

Hopewell Valley Regional School District
Notes to the Basic Financial Statements ( continued)
Year ended June 30, 2018
1 O. Interfund Receivables and Payables
The total interfund accounts receivable and payable for the District at June 30, 2018 are as follows:
Interfund Interfund Receivable Pa1:able
General Fund $ 9,210 Special Revenue Fund $ 9,210 Capital Projects Fund 384,685 Debt Service Fund 384 685
$ 3932895 $ 3932895
The interfund between the general fund and the special revenue fund represents an allocation of internally pooled cash from the general fund and represents a short-term loan. The interfund between the capital projects fund and the debt service fund represents interest earned on the investment of bond proceeds held in the capital projects fund that is transferred to the debt service fund pursuant to N.J.A.C. 6A:26-4.2(e). All interfunds are expected to be repaid within one year.
11. Economic Dependency
The District receives a substantial amount of its support from federal and state governments. A significant reduction in the level of support, if this were to occur, could have an effect on the District's programs and activities.
12. Contingent Liabilities
The District participates in numerous state and federal grant programs, which are governed by various rules and regulations of the grantor agencies; therefore, to the extent that the District has not complied with the rules and regulations governing the grants, refunds of any money received may be required and the collectability of any related receivable at June 30, 2018 may be impaired.
In the opinion of the District, there are no significant contingent liabilities relating to compliance with the rules and regulations or final eligible cost requirements governing the respective grants or funding; therefore, no provisions have been recorded in the accompanying basic financial statements for such contingencies. The District is involved in several claims and lawsuits incidental to its operations. In the opinion of the administration and legal counsel, the ultimate resolution of these matters will have a material adverse effect on the financial position of the District. Therefore, the District has accrued a total of$575,000 in the government-wide financial statements as a result of the actual and expected outcomes of these claims and lawsuits. The estimated settlement of these claims is not expected to be paid with current financial resources.
68

Hopewell Valley Regional School Distri~t
Notes to the Basic Financial Statements (continued)
Year ended June 30, 2018
13. Capital Reserve Account
A capital reserve account was established by the District on October 10, 2000 for the accumulation of funds for use as capital outlay expenditures in subsequent fiscal years. The capital reserve account is maintained in the general fund and its activity is included in the general fund annual budget. Funds placed in the capital reserve account are restricted to capital projects in the District's approved Long Range Facilities Plan (LRFP). Upon submission of the LRFP to the Department, a district may increase the balance in the capital reserve by appropriating funds in the annual general fund budget certified for taxes or by transfer by board resolution at year end (June 1 to June 30) of any unanticipated revenue or unexpended line - item appropriation amounts, or both. A district may also appropriate additional amounts when the express approval of the voters has been obtained either by a separate proposal at budget time or by a special question at one of the four special elections authorized pursuant to N.J.S.A. 19:60-2. Pursuant to N.J.A.C. 6A:23A-14.l(g), the balance in the account cannot at any time exceed the local support costs of uncompleted capital projects in its approved LRFP. The June 30, 2018 LRFP balance of local support costs of uncompleted capital projects exceeded the amount in the capital reserve.
The activity of the capital reserve for the July 1, 2017 to June 30, 2018 fiscal year is as follows:
Beginning balance, July 1, 2017
Deposits: Approved by June 18, 2018 Board resolution
Ending balance, June 30, 2018
14. Restricted Assets
$ 4,825,710
80,970
$ 4,906,680
The money set aside in the District's capital and maintenance reserves are classified as restricted assets (cash and cash equivalents) as they are restricted to payments relating to- capital and maintenance related expenditures.
15. Commitments
The District has contractual commitments at June 30, 2018 for various purposes, which are recorded in the general fund as fund balance assigned to other purposes in the amount of $381,221 and in the capital projects fund $10,051,370, which are recorded as part of fund balance restricted for capital projects.
16. Transfers
The District transferred $312,329 from the capital projects fund to the debt service fund. The transfer was required to move interest earned on the unspent bond proceeds in the capital projects fund to the debt service fund to offset future debt service tax levies.
69

Required Supplementary Information Part II

DisUicl's PfOPOllion of the net pension llabilitv (ustl) • l.ocal Group
Dislric:l's P10P011ion111e shue of the net pension liabililV (asset)
Disuicts PIOPonionalO share of the net pcnsionbabibl\·(uset)a•of iu ..,,.....s.cmplmu P>\toll
Plan liducian· net PoSi1ion ... ~con-oflhc IOW pension~·• Local Group
2018
O. IIOS497103'o
25,734,206 s 8,039,792 s
320.09%
48.10%
The amounll praonkd for eadl lilCal ,..., \\ffe delfflnined as oflhc pmious llscal ,...,-end.
Notes lP Rcotrirat SVPPkmm:tlD· lnfom,Mioo
RmctU Oma
Clw12n oC Auumntiom
The diS<Ounl raloCNlnjlcd from J.98%as oCJune JO, 2016 IO S.OO%asofJune 30, 2017.
Hopewell Valley llomd or EdU<lllion Schodulc of the Disuic:1'1 Proponionalo Share of the Net Pension Liabili1y
Public Emplo)'ffl Rclircmcnl Syslem Required Supplomonwy lnfonnlllion
Los! Ton FilCal y..,.
2017 2016 2015 201•
0.1111144609% O. ll239'l00S8'~ 0.1084386997% "'· 32,908,916 s 2S.2Jl,324 s 20,302,690 "'" 7,728,BSl s 7,S69.463 s 7,614,S32 s 7,701,670
42S.79",. 333 33% 266.63% nl&
•0.1•% 47.93,. SZ.08% nla
L-1
2013 2012 2011 2010 2009
r/a "'· "'· n/Q "'" "'· "'" "'" "'" "'·
s 1.399.294 7,041.273 s 7,203,027 s 7,722,995 s 7,470.775
"'· "'· n/a "'· "'·
"'" n/1 nla n/1 n/a
70

2018 2017
Contractually required contribution s 1,019,948 s 987,125 $
Conlnl>utions in relation to the conaactually required contribution (1,039,948) (987,125)
Conlribution deficiency (excess) $ $ $
District's cowrcd-cmployce payroll s 7,728,853 s 7,569,463 s
Contributions as a percentage of covered-employee payroll 13.46% 13.04%
2016
Hopewell Valley Board of Education Scheclulc of Disttict Contributions
Public Employee's Retircmcnt System Required Supplcmcnta,y Information
Last Ten Fiscal Y cars
201S 2014
73S,OOO s 709,412 s 710,S07
(73S,000) (709,412) (710,S07)
s $ .
7,614,S32 $ 7,708,670 s 7,399,294
9.6S% 9.20% 9.60%
2013 2012 2011 2010 2009
s 662,2SS s S83,482 s S27,00S s S37,886 $ S37,386
(662,2SS) (583,482) (S27,00S) (537,886) (S37,386)
$ s s s . $
s 7,048,273 $ 7,203,027 $ 7,722.995 $ 7,470,775 s 6,818,472
9.400/o 8.100/o 6.82% 7.200/o 7.88%
71

S1111e's proJM>nion of the net pension liability (asset) associated with the DiSlrict • LocalGroup
District's llfOl)Offionate share of the net pcnsion liobility (asset)
State's proportionate share of the net pension liability (asset) ossociated with the District
Totlll proportionate share of the net pension liability Cassel) assocUl!Cd with the District
Plan fiducia,y net position as a perccn111ge of the tola! pension liability
Hopewell Vlllley Board orEducotion Schedule orthe St3!C's Proponionate Share or the Net Pension
Liability Associated with the District Teachers' Pension and Annuity Fund Required Supplementllr)' Information
Last Ten Fiscal Years•
2018 2017
0.3148182207% 0.3193640991%
s • $ . s
$ 212,261,796 $ :?SJ,232,134 S
$ 212.261,796 S
2S.41% 22.33%
The amounu presented for each fiscal year were determined as or the previous fucal year-end
2016
O.J 156974S68%
• $
199,534,274 S
199,534.274 S
28.71%
• This schedule is presented to illustrate the requirement to show infonnation for ten years. However, until a rull ten-year trend is compiled, governments should present information for those years for which information is available.
Covered payroll infonnation is not presented since the Teachers' Pension and Annuity Fund is a special funding situation in which the District does not m3ke a cnntrihut;nn to rhi, nlan
Notes to Rmuiml Supptmmrorv lnCnmtion
Bmcfil CJJaom
There were none.
Omnm oCAssumPtions
The discount rate changed froml.22'.4 as of June 30, 201610 4.25% as of June 30, 2017.
J..3
201.S
0.3 I 77476S44%
169,82S,780
169.82.S.780
3364%
72

Hopewell Valley Regional School District Schedule of the State's Proponionate Share of the Net OPEB Liability Associated with the District
and Changes in the Total OPEB Liability and Related Ratios Public Employee's Retirement System and Teachers' Pension and Annuity Fund
Required Supplementary Information and Notes to Required Supplementary Information
Last Ten Fiscal Years•
Year Ended June 30 2018 2017
M-1
State's proportion of the net OPEB liability (asset) 0.2861653795% 0.2862735887%
District's proponionate share of the net OPEB liability (asset)
State's proportionate share of the net OPEB liability (asset) associated with the District
Total proportionate shareofthe net OPEB liability (asset) associated with the District
Plan fiduciary net position as a percentage of the total OPEB liability
Total OPED Liability
Service cost
Interest cost
Changes of assumptions
Member contributions
Gross benefit payments
Net change in total OPEB liability
Total OPEB liability- beginning
To1al OPEB liability- ending
Covered-employee payroll
Tolal OPEB liability as a percenlage of covered-employee payroll
s
s
s
s
s
s
I 53,498,657
153,498,657
0.00%
2018
6,825,202
4,864,441
(20,323,672)
130,917
(3.555,355)
(12,058,467)
165.557.124
153,498,657
41,315,611
371.53%
• This schedule is to be built prospectively. Until a full I 0-year trend is compiled, the schedule will show information for those years for which data is available.
• • Information not available
Notes to Required SuppJementazy lnfonnatjon
Benefit Changes
There were none.
Changes ofAssumptjons
The discount rate changed from 2.85% as of June 30, 2016 to 3.58% as of June 30, 2017.
s
s 165,557,124
s 165,SS7,124
0.00%
2017 ..
73

Required Supplementary Information Part III
Budgetary Comparison Schedules

C-1 p. I
Hopewell Valley Regional School District General Fund
Budgetary Comparison Schedule
(Budgetary Basis) Year ended June 30. 2018
Variance Orii:inal Buda:el Final Final Budget Transfen Budget Aciual 10Ac1ual
Revenues Local sources:
Local tax levy s 70,710,312 s 70,710,312 s 70,710,312 Tuition 180,000 180,000 279,256 s 99,256 lnteresl on invcs1mcnt11 25,000 25,000 133,515 108,SIS Transponation 110,000 110,000 136,888 26,888 Miscellaneous 602,000 602.000 479,537 {122.463!
Total ~ucs • local sources 71,627,312 71,627,312 71,739,508 112,196
Swe sources: School choice aid 243,972 243,972 243,972 Special education catesorical aid 2,049,948 2,049,948 2,164,734 114,786 Security ca1esorical aid 62,529 62,529 62,529 Transponation categorical aid 389,553 389,SSJ 389,553 Extraordinary aid 486,341 486,341 P ARCC Readiness aid JS,060 35,060 JS,060 Per pupil growlh aid JS,060 35,060 JS,060 Professional IC11111ins communhy aid 35,880 35,880 35,880 Additional Non-public transportation Bid 102,003 102,003 On-behalrTPAF pension contributions 4,834,194 4,834,194 On-behalfTPAF medical contributions 3,122,303 3.122.303 On-behalfTPAF disablility contribuiions 6,451 6,4SI Reimbursed TP AF social 1CCurity contributions 2,465,312 2.465,312
Total • Slale sources 2.8S2,002 2,852,002 13,983,392 11.131,390
Federal sources: Medicaid reimbursement 21,593 21,S93 10,656 {10,937!
Total • Fc:deml sources 21,593 21.S93 10,656 il0:937! Tol:ll revenues 74,500,907 74,500,907 8S,733,SS6 11.232,649
Expenditures CWTCnt expenditures:
Instruction • regular prosrarns: Salaries ofteuhen:
Kindefsanen 876,668 s (41,252) 83S,416 835,224 192 Grades.., 8,538,622 (685,617) 7,853,005 7,846,864 6,141 Gmdes6-8 S,62S,419 12S,S42 S,750,961 S,73S,98S 14,976 Gmdes9-12 7.262,088 (99,JOS) 7,162,783 7,156,712 6,071
Home insttw:tion: Salaries of teachen S0,000 S0,000 41,750 8,250 Pun:hased professional.ecfucational sen.ices 21,000 17,000 38,000 31,194 6,806
Support services: Other salaries for instruction 907,IIS (ISl,374) 1SS,141 703,294 S2,447 Pun:hased profcssional.ecfucational services 683,308 17,800 701,108 636,064 65,044 Purchased technical services 38,000 (31,500) 6,SOO 5,150 750 Other purchased services l,24S,171 (483,6S8) 761,SIJ 673,809 87,704 General supplies 1,187,308 420,672 1,607,980 1,337,337 270,643 Textbooks 173,669 (9,nS) 163,891 111,026 52,865 Other objects 2S.261 100 2S,361 16,364 8,997
Tolal instruction· regular prognuns 26,633,629 (921,370) 25,712.2S9 25,131,373 SI0,886
Special education: AUlism:
Salaries of teachers 133,831 133,831 131,298 2,533 Other salaries for instruction 136,SOJ 136,SOJ 136,503 General supplie11 3,882 3,882 3,882
Total autism 274,216 274,216 271,683 2,S33
Learning and/or language disabilities: Salaries oftcachen 60,SIJ 99,989 160,S02 153,061 7,441 Other salaries for instruction 2S,219 23,737 48,956 48,9S6 Geneml supplies 1,500 1,446 54
Total learning and/or language disabilities 87,232 123,726 210,9.SS 203,463 7,495
74

C-1 p.2
(continued) Hopewell Valley Regional School District
General Fund
Budgetary Comparison Schedule
(Budgetary Basis) Year ended June 30, 2018
Variance Original Budget Final Final Budgel Transfers Budget Actual lo Actual
Espenditures (continued) Cwrent expendihlrcs (continued):
Special education (continued): Behavioral disabilities:
Salaries of teachers s 377,806 s (109,177) S 268,629 s 239,647 s 28,982 Other salaries for instruction 29,545 94,701 124,246 108,505 15,741
Total behavioral disabilities 407,351 (14,476) 392,875 348,152 44.723
Multiple disabilities: Salaries of teachers 329,215 15,417 344,632 338,521 6.111 Other salaries for instruction 202,224 82.467 284,691 272,992 11,699 General supplies 250 250 242 8
Total multiple disabilities 531,439 98,134 629,573 611,155 17,818
Resource room/center: Salaries of teachers 2,729,480 1,540,458 4,269,938 4,269,409 529 Other salaries for instruction 1,824,481 (1,280,888) S43,S93 542,037 1,556 Other purch:iscd services 1,332 1,332 1,076 256 General supplies 24,875 301 25,176 20,644 4,532 Textbooks 4000 4,000 3 422 578
Total resource room/center 4,584,168 259,871 4,844,039 4,836,588 7,451
Preschool disabilities· part • time: Salaries of teachers 121,266 (114,837) 6,429 6.429 Other salaries for inslruction 128,462 {85,371} 43,091 43.091
Total preschool disabilities • part • time 249,728 (200,208) 49,S20 49,520
F'Jeschool disabilities • full • time: Salaries of teachers 470,690 (145,010) 325,680 314.17S 11,SOS Other salaries for instruction 87,223 55,420 142,643 121,025 21,618 General supplies 61275 !S08! s1161 3,491 2.i76
Total preschool disabilities • full - time 564,188 (90,098) 474,090 438,691 35,399
Home instruction: Purch:ised professional educational services 531000 41.471 94,471 761341 18,130
Total home instruction S3.000 41.471 94 471 76 341 18 130
Total special education 61477,106 492.636 6.969,742 6,836,193 133,549
Bilingual education: Salaries of teachers 77,234 91,314 168,548 160.728 7,820 Other salaries for instruction 17,279 17,279 17,279 General supplies 700 700 S16 124
Total bilingual education 77,934 108,S93 186,527 178,583 7,944
Basic skills/remedi:11 instruction: Salaries of teachers 822,279 540,584 1,362,863 l,3S6,IS6 6,707 General supplies 8,500 53 8,553 6,940 1,613 Tcx1books soo 500 119 381
Total basic skills/remedial instruction 831,279 540,637 1,371,916 1,363,215 8,701
School-sponsored cocurricular 11cti,;1ies: Salaries 180,678 17,889 198,567 195,835 2,732 Purchased services 47.750 3,736 Sl,486 44,545 6,941 Supplies and materials 68,561 (11,521) 57,040 51,561 5,473 Other objects 971500 !9,9481 87,552 82,920 4:632
Total school-sponsored cocurricular activities 394,489 IS6 394,645 374,867 19,778
75

C-1 p.3
( continued) Hopewell Valley Regional School District
General Fund
Budgetary Comparison Schedule (Budgetary Basis)
Year ended June 30, 2018
Variance Original Budget Final Final Budget Transfers Budget Actual to Actual
Expenditures (continued) Current expenditures (continued):
School-sponsored athletics - instruction: Salaries $ 715,432 $ 52,724 $ 768,156 s 761,521 s 6,635 Purchased services 166,500 (15,165) 151,335 143,430 7,905 Supplies and materials 119,400 8,832 128,232 126,791 1,441 Other objects 28,570 (2,646) 25,924 25,885 39
Total school-sponsored athletics • instruction 1,029,902 43,745 1,073,647 1,057,627 16,020
Total instruction 35,444.339 264,397 35,708,736 34,941,858 766,878
Support services: Instruction:
Tuition to other LEAs within the state-special 36,989 36,989 36,460 529 Tuition to county voe. school dist.-special 99,100 (12,000) 87,100 84,680 2,420 Tuition to CSSD and regional day schools 553,783 (95,068) 458,715 458,715 Tuition to private school for the disabled • within state 1,232,872 74,897 1,307,769 1,307,694 15 Tuition to private school for the disabled and
other LEAs-special-outside state 350,989 82,735 433,724 429,706 4,018 Tuition • other 146,405 30,220 176,625 162,495 14,130
Total instruction 2,383,149 117,773 2,500,922 2,479,750 21,172
Attendance and social work services: Salaries 3,413 3,413 3,413 Other purchased services 255 422 677 677
Total attendance and social work service 255 3,835 4,090 4,090
Health services: Salaries 542,542 12,760 555,302 550,703 4,599 Purchased professional and technical services 37.500 37,500 27,500 10,000 Other purchased services 17,500 17,500 2,900 14,600 Rentals 11,893 11,893 11,893 Supplies and materials 21,600 (2) 21,598 17,609 3,989 Other objects 1,300 1,300 1,300
Total health services 632,335 12,758 645,093 610,605 34,488
Speech, OT, PT & related services: Salaries 1,080,308 (684) 1,079,624 1,049,273 30,351 Purchased professional • educational services (21,027) 88,973 44,428 44,545 Supplies and materials 42.200 {189) 42,011 24,855 17,156
Total speech, OT, PT & related services 1,232,508 (21,900) 1,210,608 1,118,556 92,052
Other support servcies • students• extraordinary services: Salaries 636,231 (144,180) 492,051 484,253 7,798 Purchased professional • educational services 791,000 (142,367) 648,633 375,308 273,325 Supplies and materials 5,267 5,267 5,074 193
Total other support services • students • extraordinary services 1,427,231 (281,280) 1,145,951 864,635 281,316 76
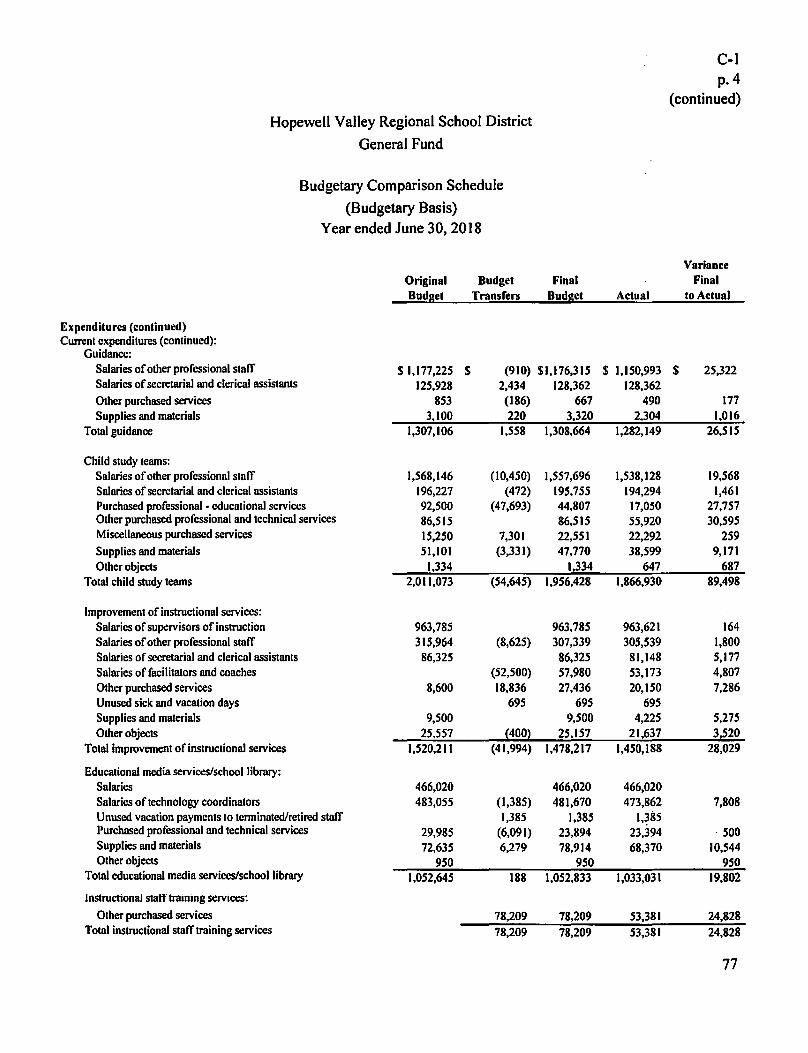
Expenditures (continued) Current expenditures (continued):
Guidance:
Hopewell Valley Regional School District
General Fund
Budgetary Comparison Schedule
(Budgetary Basis) Year ended June 30, 20 J 8
Original Budget
Budget Transfers
Final Budget
Salaries of other professional staff $ 1,177,225 s (910) $1,176,315 Salaries of secretarial and clerical assistants Other purchased services Supplies and materials
Total guidance
Child study teams: Salaries of other professional staff Salaries of secretarial and clerical assistants Purchased professional • educational services Other purchased professional and technical services Miscellaneous purchased services Supplies and materials Other objects
Total child study teams
Improvement of instructional services: Salaries of supervisors of instruction Salaries of other professional staff Salaries of secretarial and clerical assistants Salaries of facilitators and coaches Other purchased services Unused sick and vacation days Supplies and materials Other objects
Total improvement of instructional services
Educational media services/school library: Salaries Salaries of technology coordinators Unused vacation payments to terminated/retired staff Purchased professional and technical services Supplies and materials Other objects
Total educational media services/school library
lnstructsonaJ statf training services: Other purchased services
Total instructional staff training services
125,928 853
3,100 1,307,106
1,568,146 196,227 92,500 86,515 15,250 51,101
1,334 2,011,073
963,785 315,964
86,325
8,600
9,500 25,557
1,520,211
466,020 483,0SS
29,985 72,635
9SO 1,052,645
2,434 128,362 (186) 667 220 3,320
1,558 1,308,664
(I0,450) 1,557,696 (472) 195,755
(47,693) 44,807 86,515
7,301 22,551 (3,331) 47,770
1.334 (54,645) 1,956,428
963,785 (8,625) 307,339
86,325 (52,500) 57,980 18,836 27,436
69S 695 9,500
(400) 25,157 (41,994) 1,478,217
466,020 (1,385) 481,670 1,385 1,385
(6,091) 23,894 6,279 78,914
950 188 1,052,833
78,209 78,209 78,209 78,209
Actual
$ 1,150,993 128,362
490 2,304
1,282,149
1,538,128 194,294 17,050 55,920 22,292 38,599
647 1,866,930
963,621 305,539 81,148 53,173 20,150
695 4,225
21,637 1,450,188
466,020 473,862
l,~85 23,394 68,370
1,033,031
53,381 53,381
C-1 p.4
( continued)
$
Variance Final
to Actual
25,322
177 1,016
26,515
19,568 1,461
27,757 30,595
259 9,171
687 89,498
164 1,800 5,177 4,807 7,286
5,275 3,520
28,029
7,808
· 500 10,544
950 19,802
24,828 24,828
77

C-1 p.5
( continued)
Hopewell Valley Regional School District
General Fund
Budgetary Comparison Schedule
(Budgetary Basis) Year ended June 30, 2018
Variance Original Budget Final Final Budget Transfen Budget Actual to Actual
Expenditures (continued) Current expenditures (continued):
Support services-general administration: Salaries $ 199,886 $ 8,770 $ 208,656 $ 208,656 Salaries of secretarial and clerical assistants 62,135 62,135 62,135 Legal 150,000 (8,770) 141,230 45,417 $ 95,813 Audit fees 65,000 65,000 64,960 40 Other purchased professional services 13,501 8,646 22,147 22,147 ArchitecturaVengineering services 200,000 (57,419) 142,581 76,145 66,436 Communications/telephone 214,359 (40,000) 174,359 134,608 39,751 Miscellaneous purchased services 153,755 153,755 152,825 930 General supplies 3,000 3,000 2,093 907 Judgments against the district 75,000 210,299 285,299 185,299 100,000 Miscellaneous expenditures 48 144 I 48 145 39243 8,902
Total support services-general administration 1,184,780 121,527 1,306,307 971,381 334,926
Support services-school administration: Salaries of principals/ assistant principals 1,476,325 (62,579) 1,413,746 1,413,745 I Salaries of secretarial and clerical assistants 716,769 (965) 715,804 714,579 1,225 Unused vacation payments 8,498 8,498 8,287 211 Other purchased services 41,005 (6,000) 35,005 11,293 23,712 Supplies and materials 27,600 2,127 29,727 24,409 5,318 Other objects 30,190 (14,112! 16:078 6,674 9,404
Total support services-school administration 2,291,889 (73,031) 2,218,858 2,178,987 39,871
Central services: Salaries 838,943 (79) 838,864 835,842 3,022 Unused vacation payments 107,149 107,149 107,149 Purchased professional services 50,000 5,100 55,100 33,671 21,429 Purchased technical services 37,612 4,012 41,624 41,107 517 Miscellaneous purchased services 83,814 (1,028) 82,786 58,968 23,818 Supplies and materials 30,320 30,320 15,497 14,823 Miscellaneous expenditures 11,600 {2:984! 8,616 .51230 3,386
Total support services-central services 1,052,289 112,170 1,164,459 990,315 174,144
Administration infonnation technology: Salaries 201,434 79 201,513 201,513 Other purchased services 17 800 17 800 15,148 2,652
Total administration infonnation technology 219,234 79 219,313 216,661 2,652
Operation and maintenance of plant services: Required maintenance for school facilities:
Salaries 755,801 (28,743) 727,058 721,956 5,102 Cleaning, repair and maintenance services 580,661 104,328 684,989 540,339 144,650 General supplies 1981950 1981950 1691165 29,785
Total required maintenance for school facilities 1,535,412 75,585 1,610,997 1,431,460 179,537
78

C-1 p.6
(continued)
Hopewell Valley Regional School District
General Fund
Budgetary Comparison Schedule
(Budgetary Basis) Year ended June 30, 2018
Variance Ori1tinal Bud~et Final Final Budget Transfers Budget Actual to Actual
Expenditures (continued) Current expenditures (continued):
Operation and maintenance of plant services (continued): Custodial services:
Salaries $ 1,982,122 $ (48,771) S l,933,3SI $ 1,933,341 $ IO Cleaning, repair and maintenance services 220,250 (18,018) 202,232 108,386 93,846 Other purchased property services 279,987 279,987 232,860 47,127 Insurance 308,010 308,010 301,392 6,618 Miscellaneous purchased services 12,750 12,750 1,766 10,984 General supplies 181,000 181,000 145,226 35,774 Energy (electricity) l.227,Sl9 1,227,519 820.287 407,232 Energy (natural gas) 492,814 492,814 250,515 242,299 Energy (gasoline) 31,600 31,600 26,858 4,742 Other objects IS 799 IS 799 9485 6314
Total custodial services 411s1 1ss1 {66i789! 4,68SI062 318301116 8541946
Care and upkeep of grounds: Salaries 218,605 (S38) 218,067 217,867 200 Cleaning, repair and maintenance services 14,000 14,000 9,600 4,400 General supplies 126,SOO (1,786) 124,714 73,313 51,401 Other objects 140 140 140
Total care and upkeep of grounds 3S91105 {2.1841 3561921 3001920 561001
Security: Salaries 193,766 8,540 202,306 199,907 2,399 General supplies 2094 2 094 2094
Total security 1931766 101634 2041400 202.001 2:399 Total operations and maintenance of plant 6,840,134 17,246 6,857,380 5,764,497 1,092,883
Student transponation services: Salaries of non-instructional aides 235,547 46,627 282,174 279,399 2,77S Salaries for pupil transponation:
Between home and school • regular 385,509 62,602 448,111 447,825 286 Between home and school • special 780,S82 (16,070) 764,Sl2 736,960 27,552 Other than between home and school 50,000 13,S63 63,563 63,487 76
Management fee - ESC & CTSA trans. program 7,500 4,913 12,413 9,500 2,913 Other purchased professional and technical services 22,599 (3,900) 18,699 15,986 2,713 Cleaning, repair and maintenance services 84,500 (24,000) 60,SOO 28,127 32,373 Rental payments • school buses 3,000 3,000 3,000 Lease purchase payments - school buses 193,297 193,297 193,297 Contracted services:
Between home and school - vendors 1,358,910 (56,471) 1,302,439 1,299,668 2,771 Other than between home and school - vendors 302,755 (1,380) 301,375 202,025 99,350 Between home and school • joint agreements l,SOO 6,697 8,197 8,197 Special ed stds· vendors 110,000 (109,967) 33 33 Special ed stds- joint agreements S,000 (5,000) Special ed stds- ESC & CTSAs 94,699 69,815 164,514 157,260 7,254 Aid in lieu of payments - non public students 256,803 78,623 335,426 334,286 1,140
Miscellaneous purchased services 2,750 2,750 1,912 838 Transportation supplies 324,937 11,000 335,937 235,703 100,234 Other objects I 2SO I 250 400 BSO
Total student transportation services 4,221,138 77,052 4,298,190 4,014,032 284,158 79

Hopewell Valley Regional School District General Fund
Budgetary Comparison Schedule
(Budgetary Basis) Year ended June 30, 2018
Expenditures (continued) Current expenditures ( continued):
Unallocated benefits - employee benefits: Social security contributions Other retirement contributions - PERS Other retirement contributions - regular Unemployment compensation Workers' compensation Health benefits Tuition reimbursement Other employee benefits
Total unallocated benefits
On-behalfTPAF pension contributions (non-budgeted) On-behalfTPAF post-retirement medical contributions(non-budgeted) On-behalfTPAF long-term disability contributions {non-budgeted) Reimbursed TPAF social security contributions
{non-budgeted) Total on-behalf payments
Total support services Total expenditures - current
Capital outlay: Equipment:
Regular programs - instruction: Undistributed expenditures - instruction Undistributed expenditures -required maintenance
Total equipment
Facilities acquisition and construction services: Construction services Other objects - debt service assessment
Total facilities acquisition and construction services
Assets acquired under capital teases {Non-budgeted) Total expenditures - capital outlay
Original Budget
$ 1,015,437 1,069,456 $
30.000 176,881 329,674
11,489,235 165.000 90.000
14,365,683
41,741,660 77,185,999
IOl,068 101,068
101,068
Budget Transfers
(945)
945 {247,681)
25,304 (12,453)
(234,830)
(165,285) 99,112
6,951 8,000
14,951
149,898
149,898
164,849
$
Final Budget
1,015.437 1,068,511
30,000 176,881 330,619
11,241,554 190,304 77,547
14,130,853
41,576,375 77,285,111
6,951 8,000
14,951
149,898 101,068 250,966
265,917
s
Actual
962,458 1,046,725
20,562 166,402 330,619
11,087,827 187,962 77,547
13,880,102
4,834,194 3,122,303
6,451
2,465,312 I0,428,260 49,207,550 84,149,408
6,951 8,000
14,951
149,898 101,068 250,966
475,000 740,917
C-1 p. 7
( continued)
s
Variance Final
to Actual
52,979 21,786 9,438
10,479
153,727 2,342
250,751
(4,834,194) {3,122,303)
{6,451)
(2,465,312) ( I 0,428,260) (7,631,175) (6,864,297)
{475,000) {475,000)
80

Expenditures (continued) Special schools:
Summer school • instruction: Salaries of teachers Purchased professional educational services General supplies
Total summer school • instruction
Total expenditures (Deficiency) excess of revenues (under)
over expenditures
Other financing sources: Capital leases - (non·budgeted)
Total other financing sources (Deficiency) excess of revenues (under) over
expenditures and other financing sources
Hopewell Valley Regional School District General Fund
Budgetary Comparison Schedule (Budgetary Basis)
Year ended June 30, 2018
s
Original Budget
172,SOO 29,230
l,SOO 203,230
77,490,297
(2,989,390)
(2,989,390)
12,289,995
$
Budget Transfers
30,471
30,471
294,432
(294,432)
(294,432)
$
Fund balances, July I Fund balances, June 30 $ 9,300.605 $ (294,432) $
Recapitulation of fund balance: Capital reserve account - restricted Maintenance reserve account • restricted Excess surplus - current year - restricted Excess surplus designated for subsequent years - restricted Designated for subsequent year's expenditures - assigned Year end encumbrances - assigned Unassigned
Reconciliation to Government Funds statements (GMP):
Last state aid payments not recognized onGMPbasis
Fund balance per Governmental Funds (GMP)
Final Budget
202,971 29,230
l,SOO 233,701
77,784,729
(3,283,822)
(3,283,822)
12,289,995 9,006.173
Actual
$ 187,982 7,200 1.224
196,406
85,086,731
646,825
475,000 475,000
1,121,825
12,289,995 $ 13,411.820
$ 4,906,680 90,003
1,404,659 2,222,692 2,334,552
381,221 2,072,013
13,411,820
(225,173) $ 13,186,647
$
$
C-1 p.8
Variance Final
to Actual
14,989 22,030
276 37,295
(7,302,002)
3,930,647
475,000 475,000
4,405,647
4,405.647
81

C-2
Hopewell Valley Regional School District Special Revenue Fund
Budgetary Comparison Schedule (Budgetary Basis)
Year ended June 30, 2018
Variance Ori1dnal Bud2et Final Final Budget Transfers Budget Actual to Actual
Revenues State sources $ 170,040 $ 170,040 $ 164,501 $ (5,539) Federal sources $ 833,856 216,811 1,050,667 975,245 (75,422) Local sources 89,004 89,004 45,393 (43,611) Total revenues 833,856 475,855 1,309,711 1,185,139 (124,572)
Expenditures Current expenditures:
Instruction: Salaries of teachers 73,619 9,957 83,576 75,829 7,747 Purchased professional services 13,782 13,782 12,454 1,328 Other purchased services 728,034 169,088 897,122 841,519 55,603 General supplies 32,500 32,500 26,591 5,909 Textbooks 24,322 24,322 21,075 3,247
Total instruction 801,653 249,649 1,051,302 977,468 73,834
Support services: Salaries 11,206 11,206 1,880 9,326 Personal services-employee benefits 7,447 7,447 6,133 1,314 Purchased professional services 32,203 16,596 48,799 45,318 3,481 Other purchased professional services 183,029 183,029 153,900 29,129 Supplies and materials 7,178 7,178 440 6,738 Other objects 750 750 750
Total support services 32,203 226,206 258,409 207,671 50,738
Total expenditures 833,856 475,855 1,309,711 1,185,139 124,572 Excess (deficiency) of revenues over (under)
expenditures $ - $ - $ - $ - $
82

Hopewell Valley Regional School District Note to Required Supplementary lnfonnation
Budget to GAAP Reconciliation
Year ended June 30, 2018
Sources/inflows of resources Actual amounts (budgetary basis) "revenue" from the
budgetary comparison schedule (C-1, C-2) $
Differences - Budgetary to GAAP:
Grant accounting budgetary basis differs from GAAP in that encumbrances are recognized as expenditures, and the related revenue is recognized. Current year
State aid payments recognized for budgetary purposes, not recognized for GAAP statements.
Prior year
Current year
Total revenues as reported on the statement of revenues, expenditures and changes in fund balances - governmental funds (B-2) $
Uses/outflows of resources Actual amounts (budgetary basis) "total outflows" from the
budgetary comparison schedule (C-1, C-2) $
Differences - budgetary to GAAP:
Encumbrances for supplies and equipment ordered but not received are reported in the year the order is placed for budgetary purposes, but in the year the supplies are received for financial reporting purposes. Current year
Total expenditures as reported on the statement of revenues, expenditures, and changes in fund balances - governmental funds (B-2) $
General Fund
85,733,556
232,247
(225,173)
85,740,630
85,086,731
85,086,731
C-3
Special Revenue
Fund
$ 1,185,139
(8,395)
$ 1,176,744
$ 1,185,139
(8,395)
$ 1,176,744
83

Supplementary Information

Special Revenue Fund

Revenues: Scace sources Federal sources Local sources
Tolal revenues
ExpendillUCS: lnsuuclion:
Salaries of leachen Pun:hasc:d professional services
Ocher purdlllSCd services General supplies Texcbooks
Tocal inscruclion
Suppon services: Salaries
Hopewell Valley Regionlll School DislriCI Special Revenue Fund
Combining Scltcdule of Program Revenues and Expendicurcs Budgeca,y Basis
June 30, 2018
Noneublic Aid
Home Textbooks Nursing Ttchnolo&l: Instruction
$ 21,07S S SB,437 s 16,373 s 2,248
21,07S SB,437 16,373 2 248
s 21,07S 21,075
Personal servi~loyce benefits Purchased professional services Ocher 11urchascd professional S SB,437 s 16,373 s 2,248 Supplies and materials
Tolal suppon services ss,437 16,373 2,248 Tolal expcndicum s 21,075 S S81437 $ 16,373 s 2,248
Eumloatlon & Classincatlon
s 19,112 s
19,112
s 19,112 $
19,112 s 19,112 s
E-1 p. I
Stcuri!l:
47,2S6
47,2S6
47,256
47,256 47,256
84

E-1 p. 2
Hopewell Valley Regional School District Special Revenue Fund
Combining Schedule of Program Revenues and Expenditures Budgelaiy Basis
June 30, 2018
I.D.E.A.
TIUelA Tille II A Tille Ill TiUelV Perkins Part B Preschool OlhtrLocal Tolals
Revenues: StalCSOU'"5 s 164,SOI Federal sources S 67,488 S 45,318 s 4,389 s 8,672 s 16,187 s 808,687 S 24,S04 97S,24S l.ocalSOU'"5 s 45,393 4SJ93
Total revenues 67,488 45,318 4 389 8,672 16.187 808.687 24,S04 45,393 1118S1139
Expenditures: lnstruc1ion:
Salaries of teachers S 61,377 s 2,000 s 12,452 s 75,829 Purchased professional services 1,000 s 8,672 2,782 12,454 Other purchased services s 808,687 S 24,504 s 8,328 841,519 General supplies 26,591 26,591 TeK1books 21,075
Tollll ins1JUction 61,377 3,000 8,672 JS,234 808,687 24,504 34,919 977,468
Suppon services: Salaries 914 966 1,880 Personal services-emploY= benefi1S 4,757 423 9S3 6,133 l'u1dl&Sed 11rofessional services S 45,318 45,318 Other purchased professional 10,474 153,900 Supplies Md materials 440 440
Total suppon services 6,111 4S1318 1,389 953 10474 207.671 Total CKpcnditures S 67,488 S 45,318 s 4,389 s 8.672 s 16,187 s 808,687 S 24,504 s 45,393 s 11m.139
BS

Capital Projects Fund .

Hopewell Valley Regional School District Capital Projects Fund
Summary Schedule of Project Revenues, Expenditures, Project Balance and Project Status
(Budgetary Basis)
Year ended June 30, 2018
Revenues Interest income $ 312,329
Total revenues 312,329
Expenditures Legal services Architectural services 988,730 Other purchased professional and technical servcies 61,774 Construction services 15,842,044 Equipment
Total expenditures 16,892,548
(Deficiency) ofrevenues (under) expenditures (16,580,219)
Other financing (uses) Transfer out (312,329)
Total other financing (uses): (312,329)
(Deficiency) ofrevenues (under) expenditures and Other financing (uses): (16,892,548)
Fund Balance, July I 32,402,999 Fund Balance, June 30 $ ls,510,451
F-1
86
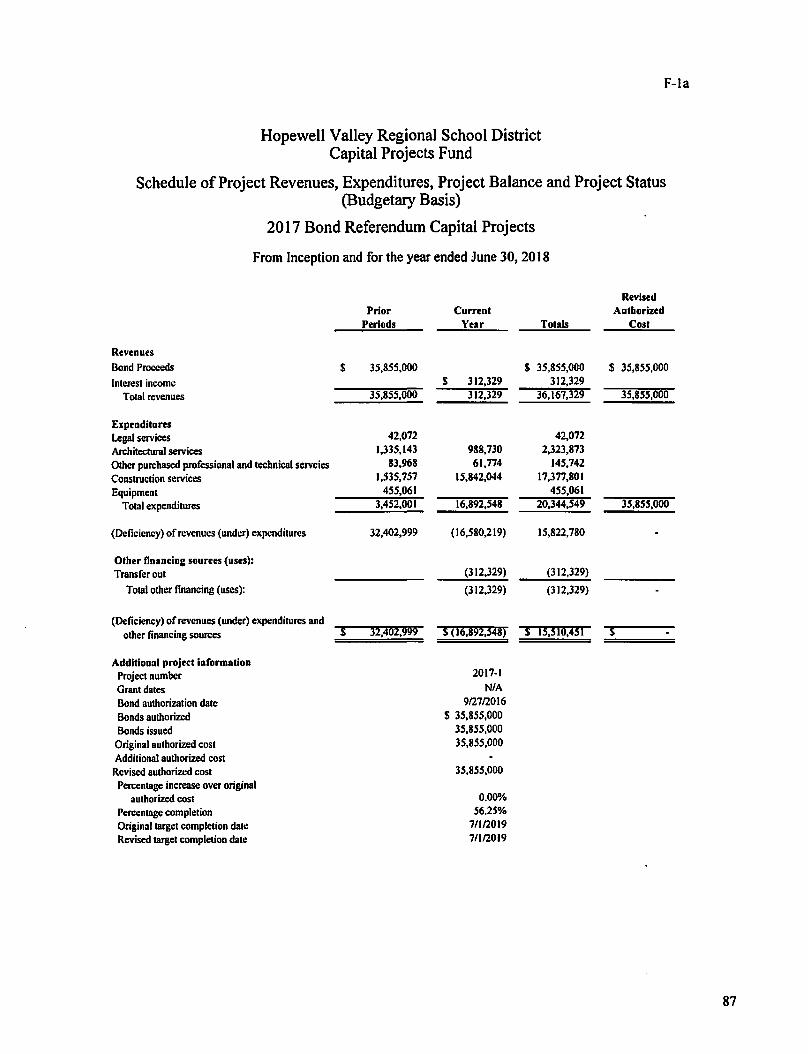
Hopewell Valley Regional School District Capital Projects Fund
F-la
Schedule of Project Revenues, Expenditures, Project Balance and Project Status (Budgetary Basis)
2017 Bond Referendum Capital Projects
From Inception and for the year ended June 30, 2018
Prior Current Periods Year Totals
Revenues Bond Proceeds s 35,855,000 $ 35,855,000 Interest income $ 312,329 312,329
Total revenues 35,855,000 312,329 36,167,329
Expendilures Legal services 42,072 42,072 Architectural services 1,335,143 988,730 2,323,873
Other purchased professional and technical servcies 83,968 61,774 145,742 Construction services 1,535,757 15,842,044 17,377,801
Equipment 455,061 455,061 Total expenditures 3,452,001 16,892,548 20,344,549
(Deficiency) of revenues (under) expenditures 32,402,999 (16,580,219) 15,822,780
Other financing sources (uses): Transfer out (312,329) (312,329)
Total other financing (uses): (312,329) (312,329)
(Deficiency) of revenues (under) expenditures and other financing sources s ll,4ill,IJIJIJ S (l6,KiJl,34ll) s 13,slil,:J3I
Additional project information Project number 2017-1
Grant dales NIA
Bond authorization date 9127/2016 Bonds authorized $ 35,855,000 Bonds issued 35,855,000
Original authorized cost 35,855,000 Additional authorized cost Revised authorized cost 35,855,000 Percentage increase over original
authorized cost 0.00% Percentage completion 56.25% Original target completion date 711/2019 Revised target completion date 7/1/2019
Revised Authorized
Cost
S 35,855,000
35,855,000
35,855,000
s
87

Fiduciary Funds Detail Statements

Hopewell Valley Regional School District Trust and Agency Funds
Combining Statement of Fiduciary Net Position
Assets Cash and cash equivalents Total assets
Liabilities
June 30, 2018
PrivatePurpose
Scholarship Trust Funds
S 23.198 23,198
Student Activity
$ 348,604 S 348,604
Agency
Payroll
$ 1,436,400 $ 1.436.400
H-1
Total Agency
$ 1.785.004 S 1.785,004
Payroll deductions and withholdings payable
Due to student groups Total liabilities
$ 1,436,400 S 1,436,400
Net position Held in trust for scholarhip funds Total net position
23,198 S 23.198
$ 348,604 348.604 $ 348,604 S 1,436,400 S I, 785,004
88

Hopewell Valley Regional School District Trust Funds
Combining Statement of Changes in Fiduciary Net Position
Additions: Contributions:
Board contributions
Plan member contributions Scholarship donations
Total additions
Deductions: Unemployment benefit payments Scholarship payments
Total deductions Change in net position
Net position, beginning Net position, ending
June 30, 2018
PrivatePurpose
Scholarship Fund
$ 12,109
Unemployment Compensation
Fund
$ 166,402
122,767
12, I 09 289,169
289,169 18,700 18,700 289,169 (6,591)
29,789 $ 23,198 $
$
$
H-2
Total Trust
166,402
122,767
12,109
301,278
289,169 18,700
307,869 (6,591)
29,789 23,198
89

Elemenlary Schools: Bear Tavern Hopewell Stony Brook Toll Gate
Junior High School: Timberlane
High School: Student Fund
Total all schools
Hopewell Valley Regional School District Student Activity Agency Fund
Schedule of Receipts and Disbursements
June 30, 2018
Balance July Cash
I, 2017 Receipts
$ 1,849 s 3,221 7,624 18,859
82 1 14,999 7,819
45,470 146,398
281,666 569:157 $ 3511690 s 745.455
H-3
Balance Cash June
Disbunements 30, 2018
s 2,820 $ 2,250 19,600 6,883
83 8,818 14,000
140,704 51,164
576,599 274,224 $ 7481541 $ 348.604
90

Assets Cash and equivalents Total assets
Liabilities
Hopewell Valley Regional School District Payroll Agency Fund
Schedule of Changes in Assets and Liabilities
June 30, 2018
Balance July Cash Cash
], 2017 Receipts Disbursements
$ 1,318,692 $ 80,406,558 $ 80,288,850 $ 113182692 $ 8014061558 $ 8022882850
Payroll deductions and withholdings payable $ 1,318,692 $ 80,406,558 $ 80,288,850 Total liabilities $ 113181692 $ 80,4061558 $ 8012881850
H-4
Balance June
30, 2018
$ 1,436,400 · $ 114361400
$ 1,436,400 $ 124361400
91

Long-Term Debt

1-1 Hopewell Valley Regional School District
Long-Tenn Debt
Schedule of Serial Bonds Payable
Yeorended June 30, 2018
Balance Balance Date or Amount or Annual l\laturilles Interest July June
Issue Issue Issue Date Amount Rate 112017 Retired 3012018 2012 Refunding of December 2004 and 3/IS/12 s S,66S,OOO I/IS/2019 s 985,000 3.750% S 2,950,000 S 950,000 S 2,000,000 bnua,y 200S Bonds l/lS/2020 l,OIS,000 4.000%
2016 Refunding of200S Refunding S/20/16 16,290,000 8/IS/2018 3,120,000 4.000% 16,290,000 3,010,000 13,280,000 Bonds 8/IS/2019 3,240,000 4.000%
8/IS/2020 3,380,000 5.000% 8/IS/2021 3,540,000 S.000%
2016 School Bonds Renovations, alterations ond improvements 12/15/16 3S,8SS,OOO I/IS/2019 12S,000 3.000% 3S,8SS,OOO 35,855,000 Bl Hopewell, Stony Brook. Toll Gate and Dear Tavern J/IS/2020 175,000 3.000% Elemen1a1y Schools. Timberlane Middle School J/IS/2021 800,000 3.000% and Ccnlml High School. I/IS/2022 900,000 3.000%
I/IS/2023 2,990,000 3.250% I/IS/2024 3,070,000 3.250% I/IS/2025 3,JSS,000 3.250% I/IS/2026 3,240,000 3.250% I/IS/2027 3,330,000 3.500% l/lS/2028 3,420,000 3.500% I/IS/2029 3,515.000 3.S00% I/IS/2030 3,610,000 4.000% I/IS/2031 3,710,000 4.000% I/IS/2032 3,815,000 4.000%
SSS,09S,OOO $3.9601000 s s1 113s1000
92

Interest Rate
Various Equipment 1.52%
Cardiac Equipment 3.33%
Buses 2.93%
Computer Equipment 1.69%
Vehicles 1.905%
Buses, Vehicle and Equipment 1.931%
Hopewell Valley Regional School District Long-Tenn Debt
Schedule of Obligations Under Capital Leases
Year ended June 30, 2018
Amount of Ori2inal Balance
Issue July 1, 2017 Additions
$ 665,000 $ 176,261
48,610 20,403
180,000 147,131
1,190,000 1,190,000
295,000 267,280
475,000 $ 475,000
$ 1,801,075 $ 475,000
1-2
Balance Retired June 30, 2018
$ 117,063 $ 59,198
10,035 10,368
34,365 112,766
290,136 899,864
56,590 210,690
69,686 405,314
$ 577,875 $ 1,698,200
93

1-3
Hopewell Valley Regional School District Debt Service Fund
Budgetary Comparison Schedule
Year ended June 30, 2018
Variance Original Budget Final Final Budget Transfers Budget Actual to Actual
Revenues: Local sources:
Local tax levy $ 5,742,494 $ 5,742,494 $ 5,742,494 State sources:
Debt service aid 340,286 340,286 340,286 Total revenues 6,082,780 6,082,780 6,082,780
Expenditures: Principal on bonds 3,960,000 3,960,000 3,960,000 Interest on bonds 2,131,589 2,131,589 2,131,589
Total expenditures 6,091,589 6,091,589 6,091,589
(Deficiency) of revenues (under) expenditures (8,809) (8,809) (8,809)
Other financing sources: Transfer in 312!329 $ 3121329
Total other financing sources 312,329 312,329
Net change in fund balance (8,809) (8,809) 303,520 312,329
Fund balance, July I 339,884 339,884 339,884 Fund balance, June 30 $ 3311075 $ - $ 3311075 $ 643.404 s· 3121329
94
Statistical Section
(Unaudited)

Statistical Section Unaudited
Contents
Financial Trends These schedules contain trend infonnation to help the reader understand how the district's financial perfonnance and well being have changed over time.
Revenue Capacity These schedules contain infonnation to help the reader assess the district's most significant local revenue source, the property tax.
Debt Capacity
These schedules present infonnation to help the reader assess the affordability of the district's current levels of outstanding debt and the district's ability to issue additional debt in the future.
Demographic and Economic Information These schedules offer demographic and economic indicators to help the reader understand the environment within which the district's financial activities take place.
Operating Information These schedules contain service and infrastructure data to help the reader understand how the infonnation in the district's financial report relates to the services the district provides and the activities it perfonns.
Sources: Unless othenvise noted, the information in these schedules is derived from the comprehensive annual financial reports (CAFR) for the relevant year.

Hopewell Valley Regional School Disuict Net Position by Component
Last Ten Fiscal Yean (accrual lums of accounting)
Unaudited
June JO 2009 2010 2011 2012 2013
Governmental activities Net investment in capital assets s IS,65S,759 s 17,581,226 s 19,808,415 s 21,552,025 S 26,145,876 Restricted 1,728,390 1,054,122 4,940,503 4,486,124 2,571,167 Unrestricted (deficit) 219871704 J.,9021S4I !649,001) 113721735 1,587,725
Tola! governmental activities net position s 2013711853 s 2215371889 s 241099.917 s 2714!01884 S 30.3041768
Business-type activities Investment in capital assets s 297,117 s 249,788 s 217,906 Restricted 6,000 Unrestricted s 570404 s 774,727 S24 77S 378,323 212,550
Total business-type activities net position s S70404 s 774;727 s 8211892 s 63411ll s 430,456
Govemment•\\idc Net investment in capital assets s IS,6SS,7S9 s 17,581,226 s 20,IOS,S32 s 21,801,813 S 26,363,782 Restricted 1,728,390 1,054,122 4,940,503 4,492,124 2.571,167 Unnsuictcd (deficit) 3,558,108 4,677.268 !124,226) 1,751,058 1,800.275
Total govemment-\\idc net position s 2019421257 S 2313121616 s 2419211809 s 281044199S S 30;73Siaa4
Source: CAFR Schedule A-1 and District reconls.
GASD 6J was implemented in the 2013 6seal year, which required tl1e reclassification ofb,alonoes previously reponed as nel ossets to nel position.
GASB 68 was implemented during the 20 I S fiscal year, which required the resiatement of begiMing net posilion in the amount of S( 19,767,631 ). 1ltis amount is not reflected in the June 30, 2014 Net Position, above.
s
s
s
s
s
s
J-1
2014 2015 2016 2017 2018
30,7SS,627 S 33,969,867 S 36,138,255 S 3S,803,648 S 38,466,350 2,618,421 4,312,975 4,959,888 7,137,070 8,624,034 IJl71644 !191538,608) !I 9,222,98S) Pl1878,S41) !22,927,994)
341S91 1692 S I 8;144.a34 S 211875,ISS S 2110621177 S 2411621390
186,399 $ 162,ISS s 138,336 $ 116,21~ s 9S,S2S
368,537 46S,30S IS8898 251,637 400,908 SS41936 $ 6271460 s 297,234 s 367
18SO s 496 433
30,942,026 S 34,132,022 $ 36,276,591 S 35,919,861 S 38,S61,87S 2,618,421 4,312,975 4,959,888 7,137,070 8,624,034 l.S86,181 (19.073,303) (19,064.087) {21.626,904) {22,527,086)
3511461628 S 19,3711694 S 22i172.392 $ 21,4301027 S 2416581823
9S

,.1 l~Vdey~SckialDas:nct
Qqe1ia~l\liliml.LutTcaFIICIIYan , __ ,,_ .........
,·.,.,~.,_ - .... JIU .... .... :tol• .... .. .. !!!' HI' ··-a.-a.a..a ... -. -- • 2,..M9.0JI • 2,.)69.974 • Jl,.114,oH I H.J,41.JIS I ~.ISUM • ll,41'.1)9 • 46.Cll.79S s lG.IS0.921 s Sf.261.616 • st.MJ.UO -- J,.l,t9.JH J.tJl.7)1) ·- u~m 4,J27.90:a 4JOS.ttt 4,IOS.029 ,.111.)6l 6.IJIU91 6.ll6.t9J ---- 6'2.<70 ., ... ff! 1.116.IJI l.2'5.196 1,314.999 1,251.1)9 1.n,.12, IM,S.()60 l.lJl.670 l,91"'6S --- ·- I.OU.kl ....,., 1.02s.n1 ......... l,09J,1N Ul..1.UI - 1.oau:u 1.0S,.6l1
"""""""" T"""" ,.m.sn ).0'1..C,61 2.J6J.4.IJ l.1'6.ffl UIG.0'1 J.0)9.Jlb 2.191.JQJ ?.469,TIJ J.IW74 1J1J.10Ct ...... ..,..._...~ ... 6.614.IJ? 1.0,1,Jll ll,T.M.712 ......... ......... 9,6,U.JIJ ll,IM.79) 12.1n ... , 11.nuso ., ..... kllcd~s.r. ..... J.IS,S7 U1._... U011J>1 JJ111~ ,,,.. .... J.o56.IIJ UOI.OSl Ul9.,W 4,6,lf.lQI 4,J7'9,WI Oa:iml&~~-~ J.:09.,0Z 1.119.HJ 1.111.961 1.69l.7JI l.fflJ6l UJ9.IS2 2.171.114 ,.nu•• Ul9.)IO ,.nuu -....-·- UDUIO lJGJ.o91 S.6ll,111 1.G9l.165 1.m.sso , ........ JSIOO,.JJl l.6Jl.7U U10.2J7 1.1&1..Z.. ,.,,.n...,....,.. J.ISf.662 J-6:1.10] J"'1.f.J6J 4.JU.962: 4,40.JII 4Ji1U19 ..... ,.9tt •.H<.-.U '·'°'·"' S.461..MJ ........,,._
IJ.661.2'6 14..II0.121 ............ 2".C161 :wm ,..., .. 175.115 267 .... - J91;.101 211.701 m.•n ....... ~dl>ml~Ccaa& M.IJI nm
T....SO~Clanll'lllah 22.967 -............... 2.Ul,114 ......... l.61l.19J USl.917 ,_. .. 1....- U-41,961 929,421 1.Gl1,IJ6 ..... .,., ~t.ca-~c1rndA-b (9 .... 1 ........... "'-- l!UZ!I JJ:16WI
Tc&al ~ldm:Man,....,. <f)1:1)621 1J~Jl.!;IJ 7J9Ui!;l9 lflS~ 71.6J9B! 71531B;I ll.!?l,!S6 t.1imn1 107.!!1¥.6 IO'J.!;l'0.!2;1
-.....-c.,p,.r- 14)10)' I ,l)lffl' li;!!S!!' l.§7Jll9 1!!291S l,!!!.Mol ,m.,. !'!!.!!! ti!!:!6U ie1e
TCIII~~~ ld!_U!M l,!1'.912 !"'.!!' li§:fl,!19 ·~915 Ii!!!~ ,m.,. , ,.,,., •e!S 1461!!! ,,.......,.npc:mn '1°'1Y.: • 7'J?Offl • 7',S21J,6,I • 71(1C'JIU s IO.Htl SU • ~'MJ,11 • l95'fflUO • 9'111 no • 1oup111 tltt0 tm ----................ l<O.OIJ )U.796 2".912 • m- • - • m.ost .. , .... MU.JI ffl.2)1 416.IM
__ ... _ I.OU.91' I.IC-0.IO'ill ,.m.u-s ·- 1.119.912 ··""·"' 1.114.991 1.161.t'ill) t.lfJ.4.,0 t.n,m __ ..,_
19',!!! :m .... Jl.9J' 131.>16 ~ Tolll.,_.....lldm1:lnP.-"'"-* I l!,!9sa li!M~ ;4~Jl0 • t 614 ''° ·~~ ·~ 1191>!!1 I '".SI l.!!:!NI • !.!!JIU ~-....... a.,,p, ......... IJl1P14 1.m..m 1.SSl.416 s 1,501,116 s 1.537.0U s 1.67UOJ 1.,:0.1.U • I.JOI ... s Ul0.791 1,,tll.926 __ ... _
!!!.190 191J:!I , .. ,.. l!!.099 1,0,!IJ U&J)I ... ll)J .,, 11, IS:'61 12! !!! , ......... ')fll~fl"'l;l'ta~ ·~e !~761$ •.!!!tu 1~nm li!!!,!ff 1WSM ·~ .... t Sl11N 1!19.!'• !.!!!•ll T<:CAl61ux1~- Z'!''M! J'NH11 ..... ,,, .. s HS2'1' • 1&3!!:16' ,~,m )6,0,01 li!!,16H 1.m:w. ! IUl60
~,11 ............. -- • (72.l09Jll0) • (71-'Sf.:OS) s 171.Sl6.009) I <'•JI-) s (17_.m, s (1UIJ.227) • (16.0U . .oJ) s <92.n,m, S (106.ffl.lOII I CIOl.ol6JlJ) ~plCcntlft i~.!~ 19n, 11,119 .... (IIJJ,a! muo! n,u um '°!I~ !!ISU Tcllal~WMlnpa11t 1'2a?:!900! aa;,11,211 s a• uo9502 • sz .. i1som2 • ma:!a22 • il'i£:27'Z2 • '16009ffll I s:!"'''!'I ! 11r..6aJl~I I U:2! 91'9 11>2 ~...._. ... oo.n....-•:iw. ....... --,,...,. IUAlnW fc. pmnl pwp,wa.lWI s '9.J,..961 • 6Ul2.166 • 61.l60.SSf s 6l.29S.96S s 64.m.m s 6S.9n,ao, s .. .m .... s 61,IU,IJI I 69.)91.161 I 10,Tlo.JIJ ,...,..,.....,.,..ro,4d,t.,.... •. 114,16,Z J.940.662 (.266.,00 4.111.911 •.SSl,6lS •• ,46,141 J,M7,4U 4,7'0,ll6 4,7'1.,JM J,742.f!M
~mbudisrdlal.FAI ,.. .... ~-... - UIU.!7 1..W:..621 l.691.21! 7.568..flS 9.677.242 ......... 17.294,61' 21 ...... ffl 10.,10.11, U,161.St9 - ........ ll.>IIJ 21.2M ,,.,.. ll,11:Z JJ.991 109.5J.t .. , .... M-""- UU90 1..164.211 ...... , 2.JOJ.,... 172.927 171.1:0 tiOS.lll 601,ni 619.2.16 ,CffJ)? r.-. (l.l .. ) (97.664) (200.000) o.u.ou)qff\'Mo(fiud .... , 162&!!1
Toul~Kli,ll»'t 7!&1~6~ 749S97fl1 7) 11!,,117 7796'4H 1997.t706 801021SI 90001 '16 9J912N6 IOS.:!fflJZ 111!:tr:.72
~-tm:n -........ 10),ll'JJ 211,401 Tnnsf'c:n ""' .. ~ ,00000 f:l61.;!lll
t'1Calhi--l)'p9.ia'11.it, 10.1 IOJ 211401 ,. .. , 91itt! lOO.!!!l!! iJ61idH! r...i..,._,....... "1JO~S9 n.a,11oa • 7111• 111 T1970SMJ • aoi2zi1m • .0.!23111 • 90e;!2 574 9!1'!241! 102 4f!.!l1 111'4A1iS:
°'-"'N"-~~Ii~. I..C06.916 2.lOl.<99 1-'61.oll s J,JI0,961 2.193,114 4.:Zl.6.924 l,920.171 J,IJ0.924 t11J.91J) s J.100.JIJ ~ ... -ffl'.I ... ,, ,n lll lH 17Jll9 9\U ,., .. ,..l 11',f,IO 72 ,,. illO.!U! ?!.!!l!! Iii I!! 1:Clllld~ ,,.u ''9 :Zlllffl 17)711>7 • llJOffl 2,I07990 ,411,...w :.mm 2JO\W! f1 .. JIM) u2•'9(a
8-ni CAf'R ~A.J-S Omric.1NICOtds.
·c:~ fldie2011 f..ai)'AI',~- ..Daia1cdbcN(Jti•a.aQocmd lo~n.pcl* Ima. •tAritllpUl~ .. ....,... mnaad ~
OAIO 6) •u ~ mO..:OIJ r...i )-.U. •-' ~O.. Nela:aifutlol olWaaca pm10mly np,rlldundUKblDml ~ 0A1111J-...,._,...aoaao1,,...,..,.. . ..._..,.... .. ~crfdl-'~..,_._-.-mD1aae.p'flic,a,-,.
..

Hopewell Valley Regional School District Fund Balances, Governmental Funds
Last Ten Fiscal Years (modified accrual basis of accounting)
Unaudited
June30 2009 2010 2011 2012 2013
General Fund Reserved $ 3,950,291 $ 4,957,858 Unreserved 1,160,423 1,119,135 Restricted $ 2,920,640 $ 3,270,750 $ 1,609,971 $ Assigned 7%,063 2,017,979 2,235,500 Unassigned 1,618,340 1,478,156 t 1683JOB
Total general fund $ 5,110,714 $ 6,076.993 $ 5,335,043 $ 6,766,885 $ 5,528,679 $
All Other Governmental Funds Reserved $ I0,000 $ 13,000 Reserved, reponed in:
Capital projects fund 928,766 1,017,780 Debt service fund 30,405 3,554
Restricted for Capital Projects $ 1,811,952 $ 1,003,774 $ 948,863 $ Debt service 250,398 211.600 12.333
Total all other governmental funds $ %9,171 s 1,034,334 $ 2,062,350 $ 1,215,374 $ 961.196 s
Source: CAFR Schedule B-1 and District records.
The change in the reserved fund balance is the result of capital project fund expenditures incurred for projects in which the funding was received in prior years through the issuance of bonds or SDA grants.
GASB 54 was implemented in the 2011 fiscal year, which required the presentation of fund balances lo be reported in different classifications
2014
1,975,635 1,649,292 1,601,661 5,226,588
221,434 918 482
1,139,916
from those presented in prior years. (See footnote l in the basic financial statements). Prior years have not been restated above, nor are they required to be.
J.3
2015 2016 2017 2018
$ 4,058,841 $ 4,959,888 $ 7,137,070 $ 8,624,034 1,465,284 2,490,634 3,283,823 2,715,773 1,625,670 1,764,050 1,636,855 1,846,840
$ 7,149,795 $ 9Jl4,572 $ 12,057,748 $ 13,186,647
$ 254,134 $ 32,402,999 $ 15,510,451 3,066 $ I0,563 339,884 643404
s 257,200 $ 10,563 $ 32!742,883 $ 16.153,855
97

1-1
ffoi,cadl Vallc)' llqiooal Sdiool Duuict Clw,gataFwidllalaac<I.--
LdTcaFucalYcm
u-...i
Yurndal.lmtt 2009 2010 2011 2012 2013 2014 2015 2016 2017 2011
Reweaun Tax levy s 64.369,829 s 6S,272,828 s 66,627,0S7 $ 68,084,876 $ 68,993,917 s 70,702,544 s 72,074,537 s 73,601,264 s 74,150,2S2 s 76,452,806 Oovcmmcnlll units c,lhcr lhan I.EAs S00,000 Tuition charges 290,043 313,796 2SS,912 301,S60 289,469 3SS,64S 312.SSS 267,681 266,S09 279,2S6 Miscellanec,us 1,064,590 1,380,964 837,861 2,397,424 1,024,762 1,042.211 723,114 747,770 9Sl,36S 1,099,267 Staie sources 8,S47,670 8,4S9,SS7 S,9S6,739 7,743,517 9,776,4SO 8,929,487 10.199,732 11,779,408 12,308,866 l4,49S,2S3 Federal soun:cs 948 482 1,023,873 1,867,278 1,117,733 I 046S79 9946S8 l10Sl12l6 1,00,100 1,097,479 98S1901
Total revenue 7S,220,614 76,4Sl,Ol8 75544847 79,645,110 81,631,177 B2,024,S4S 84,361,184 87,09,823 88,774,471 93,312,483
E11Mndlturn lnstrue1:ion
Regulat lns1111c~on 26,098,757 2S,732,S84 lS,742,391 24,360,440 26,293,46S 26,68S,S4S 26,678,668 27,648,526 26,0S0,644 26,100,446 Spcc:i.al Education lnsrruction 3,849,353 3,937,730 4,098,629 3,896,Sll 4,327,908 4,SOS,729 4,805,029 S,113,362 6,126,291 6,836,193 Olhcr Spcc:i.al Jnsrruwon 642.476 86S,4S9 1,176,851 l,2SS,196 1,314,999 1,251,839 l,17S,82S 1,145,450 1,231,670 l,916,66S Olher lns1111ction 1,088,269 1,0IS,S42 992,S87 l,02S,7SI l,094,S48 1,093,794 1,174,151 1,282,306 1,082.813 1,057,627
Su(>port Saviccs: Tuiticn 3,315,547. 3,0Sl.668 2,363,433 3,996,670 2.7Sl,131 2.921,329 2.I IS,89S 2,469,773 2.023,lSS 2.479,7SO Student lnsrruction Related Savices 6,674,157 7,0Sl,312 6,749,694 6.860,038 7,018,387 6,961,331 7,517,274 7,S07,0SO 8,668,149 8,437,SSS School Adminiuntion 2.154,697 2.276,639 2.307,087 2.IS6,209 l,I04,9Sl 2.139,668 2.180,114 2,091,891 2.106,134 2.232.368 Gencnl & Business Admin. Services 2.269,402 1,829,313 1,817,961 2.121,S36 1,985,448 1,962.691 2.044,312 2,765,261 2.04S,970 2.178,3S7 Plsm O(>aatic,ns & Main- S,804,SIO S,S03,697 S,62S,781 S,767,119 S,824,184 6,210.284 6,036,988 6,075,136 S,83S,442 5,764,497 Pupil TansportStic,n 3,857,662 3,621,103 3,S74,367 J,68),'25 3,778,793 3,968,789 3,774,863 3,776,463 3,62S,SS9 4,014,032 Other Supi,c,n Saviccs 13,SOl,639 14,842.674 IS,386,07S 16.803,758 18,008,482 17,536,370 18,463,576 20,116,900 21,808,073 24,308,362 Special Schoob 225,068 223,387 204,354 197,188 188,702 230,581 187,323 16S,711 167,311 196,405
Capilll c,utlsy 3,808,648 500,199 l,OS4.224 1,491,616 3,576,631 2.38S,029 2.227,447 l,677,S74 S.077.S40 17,633,466 Debi service:
Principol 2,780,000 2.89S,OOO 3.170.000 3,160,000 3,31S,OOO 3,40S,000 3.737.209 3,64S,OOO J,97S,60S 3,960,000 lntaat and c,lhc, charges 2,190,61S 2,073J.69 I 614.28S 1714197 1,443,267 I 3S3 700 IJ.S0,629 1,116,438 l,S6S,961 ;m,S89
Total expenditures 78,260,800 7S4l9S76 75177719 78,489,764 83,02S,897 82 611 679 83.;!69,303 S~S96,841 91,393,517 109,247,612 Excess (Deficia,cy) c,( revenues
°""' (under) expenditures (3,040,186) 1,031,442 (332,872) 1,155,346 (1,394,720) (S87,134) 991.881 842.982 (2,619,046) (IS,93S,129)
Olhtr r ... 111cln1 uurus (usn) Transfer to cc,ver deflchs:
food Services (97,664) (200.000) Performing Ans Conter (S,149)
Transfer to Charter School (22,967) Payment to Escrow ABffll (6,171,175) (17,911,317) Proceeds &om Bonowinc S,66S,000 16,290,000 3S,8SS,OOO Premium on Bonds 602.437 1,782.407 8S4,S42 Capilll Leases (non-budgeted) 988,294 293,808 663,763 48,610 451,635 l,48S.OOO 47S,OOO Transrcrs in 2,798 1.201,928 l,S87.Sl7 191,279 8,587 616,567 312,329 Tans(crs CIUt IP98! IJ,201,928) 11,ss1,s111 1191,2791 IB,S87) (254,134) !31;329)
Tc,111 other flnsncing sc,urces (uses) 96Sl27 293,808 91 113 !97,6641 463763 48610 97S 158 38 194 S42 47SOOO
Net dwige in fund bal&llccs s j~07418S9! s 1,031,442 s i391064i $ 1~4614S9 s 1114SlB4! s j12l,371! s 1,040,491 s 11s1s,140 s 1s1s1S,496 s f1S14601129!
Debt service as• pcrcentqe ..r R<lrlcapilll expenditures 6.7'• 6.6'-' 6.4% 63% 6.0,, S.9% 6.1% S.6,, 6.4% 6.6%
S..nru: CAFR Schedule 8•2
98

J-S
Hopewell Valley Regional School District General Fund Other Local Revenues by Source
Last Ten Fiscal Years Unaudited
Refund of Summer School Refunded Health Rental Health Scholastic
Fiscal Year Program Transportation Interest Other Prior Year Insurance Of Insurance Fees and Ended June 30, Tuition Fees Fees Earned Refunds Expenditures Premium Facilities Cobra Parking E-Ratc Misc. Total
2009 $ 270,693 $ 19,350 $ 61,571 $ 98,147 $ 55,429 $ 284,873 $106,332 $ 93,726 $ 115,000 $ 216,695 $ 1,321,816 20IO 304,761 9,035 84,360 31,545 152,241 93,225 113,720 831,120 1,620,007 2011 255,912 80,373 23,377 152,142 121,556 162,025 245,138 1,040,523 2012 301,560 74,120 13,583 82,732 96,967 $1,428,967 175,616 129,356 167,130 222,352 2,692,383 2013 289,469 117,421 28,284 87,180 150,124 79,177 168,700 387,371 1,307,726 2014 355,645 121,412 27,369 50,612 200,335 65,596 169,475 301,164 1,291,608 2015 312,585 80,419 28,112 84,422 230,808 70,135 218,195 1,024,676 2016 267,681 80,550 32,998 77,738 252,396 35,047 233,732 980,142 2017 266,509 158,729 37,168 88,890 249,251 22,784 $123,185 145,126 1,091,642 2018 279,256 136,888 133,515 50,447 220,367 117,297 91,426 1,029,196
Source: District records.
99

J-6 HOPEWELL VALLEY REGIONAL SCHOOL DISTRICT
ASSESSED VALUE AND ACTUAL VALUE OFT AXABLE PROPERTY LAST TEN FISCAL YEARS
UNAUDITED FISCAL TOTAL ACTUAL YEAR TOTAL TAX NET DIRECT (COUNTY ENDED VACANT FARM ASSESSED EXEMPT PUBLIC VALUATION SCHOOL EQUALIZED)
JUNE30, LAND RESIDENTIAL REO. gFARM COMMERCIAL INDUSTRIAL APARTMENT VALUE PROPERTY UTIUTIES TAXABLE TAX RATE VALUE
Borough or Hopewell 2018 $ 4,766,400 $ 268,623.000 s 1,748,100 s 27,700 s 37,998,900 s 1,270,100 $ l,S03,200 s JIS,937,400 s 22,758,600 s l,897,6SS s 317,83S,OSS $ I.S6 s 336,9S8, 721 2017 S,372,200 267,444,700 1,748,100 28,600 39,007,100 1,270,100 l,S03,200 316,374,000 22,291,SOO l,897,6SS 318,27 l,6SS J.S4 320,024,928 2016 S,370,400 266,880,300 1,748,100 28,600 39,022,000 1,270,100 l,S03,200 JJS,822,700 22,391,SOO 1,897,655 317,720,JSS J.S4 322,070,S94 201S 4,586,800 268,494,600 1,748,100 28,700 39,022,000 1,270,100 J,S03,200 316,6S3,SOO 22,391,SOO l,897,6SS 318,SSl,ISS I.SJ 320,S93, 148 2014 S,528,900 278,896,700 1,890,200 28,900 48,322,600 8S7,700 1,697,900 337,222,900 24,499,300 l,897,6SS 339,120,SSS 1.40 314,986,120 2013 5,549,000 281,632.600 1,890,200 28,000 49,329,900 857,700 1,697,900 342,882,955 24,499,300 l,897,6SS 344,780,610 1.36 3 J4,372,S49 2012 S,2.Sl,100 28.S,641,000 1,890,200 28,000 49,9S8,300 857,700 1,697,900 34.S,324,200 24,499,300 l,897,6SS 347,221,BSS 1.29 329,715,622 2011 .S,344,.SOO 288,293,900 1,890,200 28,900 .S0,221,900 857,700 1,697,900 3S0,232,6SS 24,499,300 l,897,6SS 352,130,310 1.23 314,7SI,062 2010 S,SJl,800 294,090,700 2,032,SOO 28,800 S3,J3S,2SS 857,700 1,697,900 JS7,374,6SS 24,992,100 l,897,6SS 359,272,310 1.18 320,364,996 2009 4,512,700 296,872,200 2,032,500 28,700 Sl,614,400 8S7,700 2,322,900 JS8,24 I, 100 2S,390.700 l,897,6SS 360,138,7.SS 1.18 334,375,220
Borough or Pennington 2018 $ 1,645,800 $ 430,324,400 s 51,537,300 $ 6,283,800 $ 818,400 s 490,609,700 s S9,68S,400 $ ,1,817,400 $ 492,427.100 $ I.S3 s soo,9n,234 2017 1,645,800 430,S 13,600 SS,646,100 6,283,800 818,400 494,908,300 S9,68S,400 1,785,801 496,694,101 us S01,461,.S42 2016 l,64S,800 429,968,800 SS,S.52,700 6,633,300 818,400 494,619,000 S9,68S,400 1,750,730 496,369,730 I.SS S 11,228,881 201.S l,6S4,600 429,608,400 SS,752,700 6,633,300 818,400 494,467,400 S9,313,000 1,600,418 496,067,818 I.SS .SOl,194,021 2014 1,713,600 430,813,400 S6,604,900 6,633,300 818,400 496,.583,600 S9,309,JOO 1,710,251 498,293,SS I 1.49 .SOl,198,918 2013 1,712,.SOO 433,816,000 56,674,200 6,633,300 818,400 499,654,400 S9,3SS,200 1,884,914 SOJ,S39,314 1.41 493,891,906 2012 2,020,300 434,578,600 49,894,800 6,633,300 818,400 493,945,400 86,852,200 2,481,413 496,426,813 1.38 492,619,487 2011 1,782,600 436,168,000 S0,486,900 6,633,300 818,400 495,889,200 72,753,900 2,246,SOS 498,135,705 1.37 502,330,276 2010 2,294,000 436. 728,800 S0,844,600 6,633,300 1,729,100 498,229,800 72,778,900 2,S23,76S SOO, 7S3,S6S 1.33 494,093,S43 2009 2,568,100 4S6,274,.SOO SJ,672,000 7,S94,900 1,729,100 S2 l,838,600 73,149,200 2,510.108 524,348, 708 1.20 SIB,981,236
Township of Hopewell 2018 $ 34,598,700 s 2,737,363,400 s 266,229,SOO $ S,390,800 $ SOS,623,000 $ 407,534,400 $ 4,SSl,600 s 3,961,291,400 s SJS,946,000 $ S,092,983 $ 3,966,384,383 $ 1.62 $ 4,303,S29,S99 2017 36,872,800 2. 736. 705,500 26S.9S2,800 S,377,800 504,119,000 410,634,400 4,.SSJ,600 3,964,213,900 535,438,000 S,2S4,08S 3,969;467,988 I.SB 4,190,664,752 2016 40,84S,SOO 2,744,443,000 261,476,000 S,Jn,600 493,931,400 402,089,000 S,204,700 3,953,367,200 S34,3SS, 700 S,364,0S3 3,9S8, 731,253 I.SS 4,0S4,739,S36 201S 47,397,200 2, 742, I JS,000 260,810,600 S,329,400 502,637,700 399,286,800 S,320,200 3,962,896,900 531,478,900 S,S79,0S8 3,968,475,958 I.S2 3,983,615,416 2014 45,419,400 2,739,937,800 261,480,900 .S,330,800 S2S. I 23,300 400.165,600 S,320,200 3,982,778,000 S 13,532,400 .S,426,768 3,988,204, 768 1.48 3,91S, 117,682 2013 48,281,400 2, 7SO,S3 l,200 263,373,600 S,339,400 S23,6S7,700 402,985,600 S,621,400 3,999,790,300 S 11,021,000 6,706,907 4,006,497,207 l.4S 3,929,681,004 2012 54,584,900 2, 784, 798, 700 267,S 18,400 S,397,400 S29,848,000 403,178,400 S,621,400 4,0S0.947,200 S07,402,000 6,828,000 4,057,775,200 1.41 4,003,841,822 2011 S4,4.SO,.SOO 2,903,0SS,600 268,462,800 S,620,600 533,613,400 406,027,400 5,033,800 4,176,264,100 351,462,600 7,188,189 4, I 83,4S2,289 1.35 4,073,248, 162 2010 S7,4Sl,SOO 3,021,846,700 275,012,100 S,693,SOO SS9,276,ti00 407,811,400 S,06S,OOO 4,332,156,800 JSS,210,100 9,703,188 4,341,859,988 1.27 . 4, JS9,076,020 2009 73,046,SOO 3,133,774,300 277,719,300 .S,840,SOO SSS,026,000 401,139,SOO S,231,600 4,4s1.1n,100 338,169,800 7,222,300 4,489,000,000 1.21 4,322,023,148
Real property is ~uiml to be asseS5Cd at some pen:entage ofttue wl~ (fair or market wlue) emblished by each county board of taxation. Reassessment occws when ordm:d by the County Board ofTaxmion 11. Taxable Value of Machinery, Implements and Equipment of Telephone, Telegraph and Messenger System Companies b. Tax mies are per $100
Soun:e: Municipal Tax Assessor ond County Abstnu:t ofRatablcs.
100

J-7 HOPEWELL VALLEY REGIONAL SCHOOL DISTRICT DIRECT AND OVERLAPPING PROPERTY TAX RATES
LAST TEN FISCAL YEARS (Rate per S100 or Assessed Value)
UNAUDITED
FISCAL OVERLAPPING RATES TOTAL YEAR BOROUGH COUNTY MUNICIPAL DIRECT AND
ENDED REGIONAL TOTAL OR MERCER FIRE OPEN OPEN OVERLAPPING JUNE30, SCHOOL DIRECT TOWNSHIP COUNTY LIBRARY DISTRICT SPACE SPACE TAX RATE
Dorouch or Hopewell 2018 $ I.S6 $ 1.56 $ O.S9 $ 0.62 s 0.04 $ 0.07 $ 0.03 s 0.01 s 2.92 2017 J.S4 I.S4 O.S6 O.S9 0.03 0.0, 0.03 0.01 2.83 2016 I.S4 1.54 O.S4 0.60 0.03 0.06 0.03 0.01 2.80 20JS J.S3 I.S3 O.S2 O.S8 0.03 0.06 0.03 0.01 2.76 2014 1.40 1.40 0.48 o.ss 0.03 0.06 0.02 0.01 2.SS 2013 1.36 1.36 0.46 O.S3 0.Dl 0.06 0.02 0.01 2.46 2012 1.29 1.29 0.44 o.so .032 0.65 0.02 0.01 2.31 2011 1.23 1.23 0.41 0.44 .031 0.02 0.01 2.11 2010 1.18 1.18 0.41 0.42 0.03 2.04 2009 1.18 1.18 0.40 0.42 0.04 0.03 0.01 2.08
Boroueh or Pmnlneton 2018 s I.SJ $ I.SJ $ 0.43 $ 0.60 $ 0.03 $ o.os s 0.03 s 0.01 s 2.68 2017 I.SS J.SS 0.43 0.60 0.03 0.04 O.QJ 0.01 2.69 2016 I.SS J.5S 0.43 0.61 0.03 0.04 O.o3 0.01 2.70 201S I.SS I.SS 0.42 O.SB 0.03 0.04 0.01 0.01 2.64 2014 1.49 1.49 0.40 0.60 0.03 0.04 0.03 0.01 2.60 2013 1.41 1.41 0.40 O.S6 .033 0.03 0.02 0.01 2.44 2012 1.38 1.38 0.30 0.S4 .033 0.03 0.02 0.01 2.28 2011 1.37 1.37 0.42 0.49 0.03 0.02 0.01 2.34 2010 1.33 1.33 0.43 O.SI O.Dl 0.03 2.33 2009 1.20 1.20 0.42 0.4S O.QJ 0.03 0.01 2.14
Township or Hopewell 2018 $ 1.62 s 1.62 s 0.38 s 0.64 s 0.o7 s 0.09 s 0.03 s 0.03 s 2.86 2017 I.SB I.S8 0.37 0.62 0.06 0.09 0.03 0.03 2.78 2016 I.SS I.SS 0.36 0.60 0.06 0.09 0.03 0.03 2.71 201S 1.52 I.S2 0.36 0.S8 0.06 0.08 0.03 0.03 2.6S 2014 1.48 1.48 OJ4 O.S8 0.06 0.08 0.02 0.02 2.S8 2013 l.4S l.4S 0.32 O.S7 0.06 O.D7 0.02 0.03 2.S2 2012 1.41 1.41 0.30 O.S4 0.06 o.os 0.02 0.03 2.27 2011 I.JS I.JS 0.29 0.47 o.os 0.06 0.02 0.03 2.27 2010 1.27 J.27 0.30 O.SI 0.06 0.02 0.02 2.18 2009 1.21 1.21 0.27 0.43 0.04 o.os 0.03 0.03 2.06
Source: County Tax AdminislratOT
101

J-8 HOPEWELL VALLEY REGIONAL SCHOOL DISTRICT
PRINCIPAL PROPERTY TAX PAYERS CURRENT VEAR AND NINE YEARS AGO
UNAUDITED
2018 2009 %0FTOTAL %0FTOTAL
TAXABLE DISTRICT NET TAXABLE DISTRICT NET ASSESSED ASSESSED ASSESSED ASSESSED
TBXpayer VALUE VALUE VALUE VALUE
Boroullh or Hopewell Doroullh orllopewell Freedman, Gerald s 3,208,200 1.01% Freedman, Gerald H., C1 al. $ 3,092,500 0.85% Brick F11t111 Market,LLC 2,088,800 0.66% Hopewell Village Square 2,431,800 0.67% Hopewell Vill1111e Square 2,048,900 0.64% PNC Bank 1,748,400 0.48% Verizon 1,897,655 0.60% Bell Atlantic l,746,4SO 0.48% Rockwell Automation 1,444,100 0.45% Klcsncy, Fr1111k Jr & Anita 1,377,100 0.38% RanpdLLC 1,340,600 0.42% Jeffers, James & Raquel 1,234,100 0.34% Bre11enzcr, Charles 1,332,100 0.42% Prewill lncorporoted 1,208,700 0.33% Llort, Frank 1,254,900 0.39% Lance Roberts, LLC 1,ISS,200 0.32% Maldiacano, Marfa 1,057,100 0.33% MLNLLC 1,131,700 0.31% PNCB1111k 1,029,600 0.32% The Gowcrlins Group, LLC I 120000 0.31%
Total s 161111 2SS smi s HiMHSO ~ 47°&!
Boroullh or Pennln11ton Borouih or Pennln11ton 143 West Franklin Ave., LLC $ 7,600,000 I.S3% PenninS1on Inv. Lic/C/0 Lorenzetti $ 5,323,800 1.03% American Properties 4,S00,000 0.91% Mereer Mutual 5,319,500 1.03% PCMinjl10n Square Shop. Cntr. 3,900,000 0.78% Mcnulty, James E & Nancy L 4,S38,000 0.88% Pcnnin111on Investments 3,700,000 0.74% S1raubc Regional Center 4,142,900 0.80% S1raubc Rcl!ional Center 3,531,800 0.71% S1raubc Center 4,000,000 0.77% M=crMIIIUal 3,441,900 0.69% ECS holding LLC 3,602,000 0.70% Slraubc Center 3,300,000 0.66% NJ Bell 3,235,108 0.62% ECS Holdin11 LLC 3,000,000 0.60% PCMinS1on Court Co Inc 3,126,300 0.60% NJBcll 2,542,400 O.S1% Mon1pcn SC LLC 3,038,300 0.59% PCMin111on Court, Inc. ~078,200 0.42% Chill Propenics LLC C/0 G Lanciano 2,000,000 0.39%
Total s l7 S94 l00 1mii s l8 l2S 908 HI~
Township or Hopewell Township or Hopewell Brutol Myers Squibb s 233,797,800 S.89% Merrill Lynch $ 386,071,600 8.40% CCI-Hopewell VI LLC 108,762,504 2.74% Bristol Myers Squibb 233,926,196 9.87% Cole Hopewell Twp 92,400,000 2.33% Janssen Phannaccutical 90,856,600 3.92% Janssen Phannacculical 91,230,100 2.30% Hopewell TC Associates & Investment 27,646,100 1.23% AREP Hopewell LLC 74,025,000 1.87% Trap Rock Industries 22,092,800 1.04% One Tolen! 42,433,200 1.07% 3SO Carter Rd LLC C/0 D&T K Faroy 16,7~4.900 0.88% Hopewell TC Asssociates 24,646,100 0.62% Monlpen SC LLC 14,050,000 0.80% Trap Rock Industries Inc 22,280,300 O.S6% Transco Gas Pipeline/AD Valorcm Tax 13,992,100 0.8S% Carter Road III LLC 16,000,000 0.40% Capital Health Syslem Inc, 10,611,000 0.64% Transco Gas Pipeline 13,842,100 0.35% Pcnnwell Holding LLC C/0 B Freedman 1011231400 O.S3%
Total $ 7)94)7 )04 )8)4% $ 826 164 626 28 )1%
Source: CounlV Tax Administrator
102

FISCAL YEAR
ENDED JUNE30,
2018 2017 2016 2015 2014 2013 2012 2011 2010 2009
HOPEWELL VALLEY REGIONAL SCHOOL DISTRICT PROPERTY TAX LEVIES AND COLLECTIONS
LAST TEN FISCAL YEARS UNAUDITED
TAXES COLLECTED WITHIN THE FISCAL LEVIED FOR YEAR OF THE LEVY THE FISCAL PERCENTAGE
YEAR AMOUNT OF LEVY
$ 76,452,806 $ 76,452,806 100.00% 74,150,252 73,769,504 99.49% 73,601,264 74,366,411 101.04% 72,074,537 72,074,537 100.00% 70,702,544 70,702,544 100.00% 68,993,917 68,993,917 100.00% 68,084,876 68,084,876 100.00% 66,627,057 66,627,057 100.00% 65,272,828 65,272,828 100.00% 64,369,829 64,369,829 100.00%
Source: District records including the Certificate and Report of School Taxes (A4F fonn)
J-9
COLLECTIONS IN
SUBSEQUENT YEARS
$
380,748
103
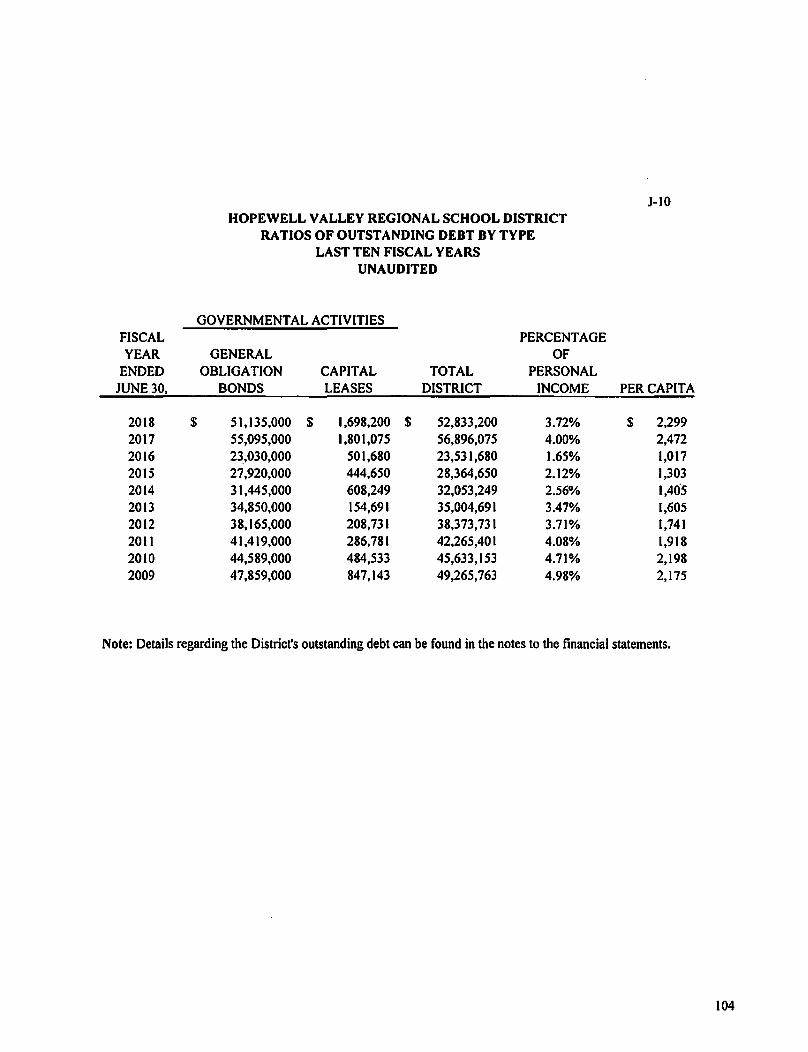
J-10 HOPEWELL VALLEY REGIONAL SCHOOL DISTRICT
RATIOS OF OUTSTANDING DEBT BY TYPE LAST TEN FISCAL YEARS
UNAUDITED
GOVERNMENTAL ACTIVITIES FISCAL PERCENTAGE YEAR GENERAL OF
ENDED OBLIGATION CAPITAL TOTAL PERSONAL JUNE30, BONDS LEASES DISTRICT INCOME PER CAPITA
2018 $ 51,135,000 $ 1,698,200 $ 52,833,200 3.72% $ 2,299 2017 55,095,000 1,801,075 56,896,075 4.00% 2,472 2016 23,030,000 501,680 23,531,680 1.65% 1,017 2015 27,920,000 444,650 28,364,650 2.12% 1,303 2014 31,445,000 608,249 32,053,249 2.56% 1,405 2013 34,850,000 154,691 35,004,691 3.47% 1,605 2012 38,165,000 208,731 38,373,731 3.71% 1,741 2011 41,419,000 286,781 42,265,401 4.08% 1,918 2010 44,589,000 484,533 45,633,153 4.71% 2,198 2009 47,859,000 847,143 49,265,763 4.98% 2,175
Note: Details regarding the District's outstanding debt can be found in the notes to the financial statements.
104

J-11 HOPEWELL VALLEY REGIONAL SCHOOL DISTRICT
RATIOS OF NET GENERAL BONDED DEBT OUTSTANDING LAST TEN FISCAL YEARS
UNAUDITED
GENERAL BONDED DEBT OUTSTANDING NET PERCENTAGE
FISCAL GENERAL OF ACTUAL YEAR GENERAL BONDED TAXABLE
ENDED OBLIGATION LESS DEBT DEBT VALUE OF JUNE30, BONDS SERVICE FUND OUTSTANDING PROPERTY PER CAPITA
2018 $ 51,135,000 $ 643,404 $ 50,491,596 1.056% $ 2,197 2017 55,095,000 339,884 54,755,116 1.144% 2,379 2016 23,030,000 10,563 23,019,437 0.482% 995 2015 27,920,000 3,066 27,916,934 0.584% 1,282 2014 31,445,000 918,482 30,526,518 0.630% 1,338 2013 34,850,000 12,333 34,837,667 0.718% 1,581 2012 38,165,000 211,600 37,953,400 0.703% 1,736 2011 41,419,000 200,398 41,218,602 0.758% 1,871 20IO 44,589,000 NIA 44,589,000 0.820% 2,148 2009 47,859,000 NIA 47,859,000 0.880% 2,113
J-12 RATIOS OF OVERLAPPING GOVERNMENTAL ACTIVITIES DEBT
AS OF JUNE 30, 2018
GOVERNMENTAL UNIT
Debt Repaid With Property Taxes: Borough of Hopewell Borough of Pennington Township of Hopewell
Total
DEBT OUTSTANDING
$ 3,263,263
$
5,129,401 42,742,336
51,135,000
County of Mercer- Regional Share (Total Debt $527,959,760) Borough of Hopewell Borough of Pennington Township of Hopewell
Subtotal, Overlapping Debt Hopewell Valley Regional School District Direct Debt
Total Direct & Overlapping Debt
ESTIMATED
PERCENTAGE APPLICABLE
SHARE OF
OVERLAPPING DEBT
100.000% $ 3,263,263 100.000% 5,129,401 100.000% 42,742,336
0.780% S 4,117,403 1.217% 6,425,611 9.730% 51,352,047
___ ..__ ___ _ 113,030,061 51,135,000
$ 164,165,061
Sources: Assessed value data used to estimate applicable percentages provided by County Tax Administrator, Debt outstanding data provided by each governmental unit.
105

Debt Umil
TOl&I Nd Debt Applicab!e 10 Limit
LciiJI Debt llfarilin
TOl&I Nd Debt All;,licab!c u, the Umil u a Pcrccnu,gc of Debt Limit
s
s
2018
200,555,410 s
S0,491,S96
I S0.063.814 s
2S.18"/o
2017 2016
196,074,571 s 192,329,924
SS,09S.OOO 23.030.000
l4019791S7I s 169299.924
18.10% 11.97"/o
Source: Equalized •aluation baa were obtained from the Annual Rcpon oflhc S1a1e of New Jersey, l>epanmcnl ofTrcuurv, DillilHln ofTaxalion
s
s
HOPF.WELL VALLEY RECIONAL SOIOOL DISTRICT LEGAL DEBT MARGIN INFORMATION
LAST TEN FISCAL YEARS (Doi/an;,, 'TltlJfUOJtlbJ
UNAUDITED
201S 2014
190,328,677 s 190,605,668 s
27.920.000 31,445.000
161408677 s 159.160,668 s
14.67"/o 16.SO'lo
2013
18S,J58,2IJ S
34,850.000
ISO SOS.113 S
18.80%
2012
196,499,481 S
3816S.OOO
ISUJ4.481 S
1942%
2011
203,641,887 S
41,419,000
162.222.887 S
20.34%
2010
206,646,828 S
31.324.000
17S.322.828 S
15.16%
IAR•I Debt M1ral11 C1lculation for FiK•I Vr•r 2018
Equalized Valuation Basa
Debt Umit (4% of Avcn,ce Equalimlm, Value) Nd Bonded School Debt
LcsaJ Debt Maqiin
2018 S 2017 2016
s
s
s
a Umit SCI by NJSA ISA:24·19 for a K duoulili 11 distrid;othcr% limils would bc811pliablcforothcr dlslricu
J.13
2009
206,079,201
47,859.000
158,220.201
5,141,46S,SS4 5,012,151,222 4 888039011
IS.04116SS1787
S10l3.88S1262
200,555,410 S0491 S96
IS0063 814
...

HOPEWELL VALLEY REGIONAL SCHOOL DISTRICT DEMOGRAPHIC AND ECONOMIC STATISTICS
LAST TEN FISCAL YEARS UNAUDITED
PER CAPITA PERSONAL
YEAR POPULATION (a) INCOME(b)
Borough of Hopewell 2018 1,948 $ 52,180 2017 1,926 52,180 2016 1,929 52,180 2015 1,917 53,455 2014 1,922 50,910 2013 1,921 52,294 2012 2,035 49,986 2011 2,035 49,986 2010 1,992 50,590 2009 2,022 38,413
Borouih of Pennington 2018 2,589 $ 60,545 2017 2,568 60,545 2016 2,598 60,545 2015 2,587 56,962 2014 2,585 56,004 2013 2,583 56,962 2012 2,696 63,990 2011 2,696 63,990 2010 2,661 60,376 2009 2,656 45,843
Township of Hopewell 2018 18,440 $ 62,979 2017 18,523 62,979 2016 18,606 62,979 2015 17,265 62,979 2014 18,302 55,219 2013 17,304 43,947 2012 17,304 43,947 2011 17,304 43,947 2010 16,105 43,947 2009 17,968 43,947
Source: (a) Population infonnation provided by the NJ Dept of Labor and Workforce Development (b) Per Capita infonnation provided by the US Dept of Commerce, Bureau of Economic Analysis (c) Unemployment data provided by the NJ Dept of Labor and Workforce Development
J-14
UNEMPLOYMENT RATE(c)
2.7% 2.9% 4.9% 5.0% 5.9% 8.3% 1.0% 1.0% 1.0% 1.3%
2.9% 3.0% 4.9% 5.3% 5.9% 8.3% 2.6% 2.6% 2.6% 4.6%
3.3% 2.7% 4.9% 5.0% 5.0% 7.4% 8.3% 8.3% 7.7% 3.4%
107

J-15 HOPEWELL VALLEY REGIONAL SOIOOL DISTRICT
PRINCIPAL EMPLOYERS CURRENT YEAR AND NINE YEARS AGO
UNAUDITED
2018 2009
Percentage of Peteentage of Total Total
EMPLOYERS Emelol:'.J=eS Emelomient Emelol:'.J=eS Emelomient
Borouih or Hopewell Borouah of Hopewell Hopewell Elementaf}' 76 NIA Hopewell Elementafy 62 NIA Dana Communications 35 NIA The Prisco Group so NIA Tomato Factory Antique 34 NIA Brothers Moon 20 NIA Mooney/Brothers Moon 25 NIA Dana Communications 20 NIA Borough of Hopewell 21 NIA Valley Oil Inc. 20 NIA Valley Oil Inc. 15 NIA Hopewell Pharmacy 19 NIA Mobile Physician Group 12 NIA USPC 13 NIA Baxter Construction Inc 14 NIA JBHill&Sons 8 NIA Semandex Netwoits Inc 14 NIA Saums Interiors 8 NIA
Total ~46 NlA 220 NlA
Borouah or Penninaton Borouah of Penninaton Pennington School 121 NIA Not available NIA Pennington Mongage 69 NIA Not available NIA Brandywine Assisted Living 54 NIA Not available NIA Toll Gate Grammar ss NIA Not available NIA Hopewell Valley Regional so NIA Not available NIA Cambridge School so NIA Not available NIA USPS 34 N/A Not available NIA Pennington Doro 32 NIA Not available NIA Pennington Dental Assoc 13 NIA Not available NIA
Total HS NLA NlA
Township of Hopewell Township of Hopewell Merrill Lynch 6,000 NIA Merrill Lynch 6,000 NIA Capital Health at Hopewell 3,000 NIA Bristol Myers Squibb l,16S NIA Bristol Myers Squibb 1,765 NIA Janssen Pharmaceutical 1,200 NIA Janssen Pharmaceutical 1,200 NIA Not available NIA Johnson & Johnson Phann 443 NIA Not available NIA Mary-Lawrence Corp PQM 240 NIA Not available NIA Hopewell Valley Central High 174 NIA Not available NIA Wakenem Food Corp./Shoperite 150 NIA Not available NIA Stop and Shop Inc 132 NIA Not available NIA Kooltronics ll8 NIA Not available NIA Township ofHopewell ll2 NIA Not available NIA
Total J3 334 NlA 8965 NlA
Source: Hopewell Twp website, Mercer County Guide to Our Rei!lon, Buzzlile Website
108

J-16 HOPEWELL VALLEY REGIONAL SCHOOL DISTRICT
FULL-TIME EQUIVALENT DISTRICT EMPLOYEES BY FUNCTION/PROGRAM LAST TEN FISCAL YEARS
UNAUDITED
June 30, Function/Program 2018 2017 20J6 2015 2014 2013 2012 2011 2010 2009
Instruction: Regular 338.94 338.83 337.30 340.87 336.34 338.33 339.50 346.40 331.06 342.97 Special Education 72.14 69.85 68.38 66.39 63.64 59.14 57.90 50.20 55.04 55.04
Support Services: Student & Instruction Related Services 121.57 113.52 113.83 I I0.38 109.06 107.92 94.60 94.90 102.08 116.95 School Administrative Services 25.00 24.60 24.60 24.60 24.55 23.55 27.70 24.20 25.20 25.80 General & Business Administrative Services 23.49 22.49 23.09 22.49 22.49 18.48 12.40 12.00 13.78 16.03 Plant Operations & Maintenance 48.00 47.00 47.00 48.00 47.00 53.00 52.20 52.00 52.45 54.45 Pupil Transportation 56.00 54.00 55.00 54.00 54.00 54.00 51.70 52.00 52.36 53.00
Total 685.14 670.29 669.20 666.73 657.08 654.42 636.00 631.70 631.97 664.24
Source: District Personnel Records
109

OPERATING
HOPEWELL VALLEY REGIONAL SCHOOL DISTRICT OPERA TING STATISTICS LAST TEN FISCAL YEARS
UNAUDITED
PUPIUfEACHER RA TIO SENIOR
FISCAL EXPENDITURES COST PER PERCENT AGE TEACHING MIDDLE HIGH YEAR ENROLLMENT (a} PUPIL CHANGE STAFF(b}
2018 3,536 s 85,522,557 s 24,186 8.54% 416 2017 3,625 80,774,411 22,283 1.96% 409 2016 3,668 80,157,829 21,853 4.45% 406 2015 3,640 76,154,018 20,921 5.04% 407 2014 3,686 73,418,555 19,918 1.78% 39S 2013 3,735 73,093,370 19,570 3.05% 389 2012 3,798 72,123,951 18,990 4.14% 383 2011 3,841 70,039,210 18,235 3.10% 387 2010 3,9SS 69,951.108 17,687 1.72% 411 2009 3,996 69,481.537 17,388 1.96% 398
Sources: District records
Note: Enrollment based on annual October district counL
a Operating expenditures equal total expenditures less debt service and capital outlay. b Teaching staff includes only full-time equivalents of certificated staff.
ELEMENTARY SCHOOL
12.5: I 9.4:1 10.3:1 10.0:1 10.1:1 10.1:1 10.1:1 10.1:1 10.1:1 10.1:1 9.1:1 10.1:1 9.1:1 10.1:1
10.1:1 10.1:1 JO.I: I 10.1:1 9.1:1 JO.I :I
c Average daily enrollment and average daily attendance are obtained from the School Register Summary (SRS).
SCHOOL
10.4:1 11.2:1 12.1:1 12.1;1 12.1:1 11.1:1 11.1:1 11.1:1 11.1:1 11.l:I
J-17
AVERAGE AVERAGE %CHANGE IN DAILY DAILY AVERAGE STUDENT
ENROLLMENT ATTENDANCE DAILY ATTENDANCE {ADE}(c) (ADA} (c} ENROLLMENT PERCENTAGE
3,516 3,338 -2.41% 94.94% 3,603 3,425 -1.40% 95.05% 3,654 3,478 -0.51% 95.18% 3,673 3,497 -OAI% 95.21% 3,688 3,542 -I.OS% 96.04% 3,727 3,575 -1.77% 95.92% 3,794 3,658 -1.76% 96.42% 3,862 3,700 -2.35% 95.81% 3,9SS 3,779 -1.03% 9S.SS% 3,996 3,822 -0.60% 95.65%
110

J.18 HOPEWELL VALLEY REGIONAL SCHOOL DISTRICT
SCHOOL BUILDING INFORMATION LAST TEN FISCAL YEARS
UNAUDITED
DISTRICT BUILDINGS 2018 io11 2016 201S 2014 2013 2012 2011 2010 2009
Elemenlllly Schools: Bear Tavern Elementazy ( 1961 ):
Square Feet 69,940 69,940 69,940 69,940 69,940 69,940 69,940 69,940 69,940 69,940 Capacity (Students} sso sso sso sso sso sso sso sso sso sso Enrollment 407 407 420 407 407 407 439 47S S41 S76
Toll Gate Grammar (1928):
Square Feet 61,736 61,736 61,736 61,736 61,736 61,736 61,736 61,736 61,736 61,736
Capacity (Students) 3S4 3S4 3S4 3S4 3S4 3S4 3S4 3S4 3S4 354
Enrollment (o} 297 297 286 287 287 287 297 30S 306 324 Hopewell Elcmentruy ( 1926):
Square Feet 97,048 97,048 97,048 97,048 97,048 97,048 97,048 97,048 97,048 97,048 Capacity (Students) 546 S46 S46 S46 S46 S46 S46 S46 S46 S46 Enrollment 441 441 447 468 468 468 479 41S 4S2 470
Stony Brook Elcmcntazy (2002):
Squorc Feet 76,400 76,400 76,400 76,400 76,400 76,400 76,400 76,400 76,400 76,400
Capacity (Students) sso sso sso sso sso sso sso sso sso sso Enrollment 427 427 442 428 428 428 412 4S2 460 488
Middle School: Timberlonc Middle School (1961):
SquorcFeet 169,066 169,066 169,066 169,066 169,066 169,066 169,066 169,066 169,066 169,066
Capacity (Students) 997 997 997 997 997 997 997 997 997 997
Enrollment 8SI 8SI 847 928 928 928 9S2 961 964 960 High School:
Central High School (1958):
Square Feet 21S,S07 215,507 215,507 215,501 215,507 21S,S07 215,507 21S,S07 215,507 21S,S07
Capacity (Students) 1,215 1,215 1,215 1,215 1,215 1,215 1,215 1,215 1,215 1,215
Enrollment 1,202 1,202 1,243 1,217 1,217 1,217 1,215 1,194 1,226 1,200
Other Buidlings: After School Program Building (1946):
Square Feet 2,000 2,000 2,000 2,000 2,000 2,000 2,000 2,000 2,000 2,000
Central Administration (1926):
Square Feet 30,000 30,000 30,000 30,000 30,000 30,000 30,000 30,000 30,000 30,000
Facilities Building (1946) (b):
Squorc Feet 8,000 8,000 8,000 8,000 8,000 8,000 8,000 8,000 8,000 8,000
Number of Schools at JW1e 30, 2018:
Elcmentruy = 4
Middle School = I Senior High School = I Qlherc 3
Source: District Facilities Office
Note: Year of original construction is shown in parentheses. Increases in square footage and capacity are the result of and additions. Enrollment is based on the annual October district coW1t.
Ill

J-19 HOPEWELL VALLEY REGIONAL SCHOOL DISTRICT
SCHEDULE OF REQUIRED MAINTENANCE LAST TEN FISCAL YEARS
UNAUDITED
UNDISTRIBUTED EXPENDITURES - REQUIRED MAINTENANCE FOR SCHOOL FACILITIES
11-000-261-xxx
PROJECT School Facilities NUMBERS 2018 2017 2016 2015 2014 2013 2012 2011 2010 2009
Bear Tavern NIA s 186,531 s 234,130 s 159,698 s 229,992 s 172,689 s 245,415 s 179,623 s 300,476 s 73,630 $ 161,763 Toll Gate NIA 118,141 160,608 142,304 158,284 197,767 256,768 142,431 117,584 379,750 184,323 Central High School NIA 390,250 403,335 673,453 415,330 373,789 449,019 3i 1,861 309,514 248,792 339,625 Stony Brook NIA 173,896 148,008 239,628 140,485 161,157 134,442 127,291 137,528 73,424 150,694 Hopewell NIA 220,452 204,924 145,013 164,353 268,391 141,445 160,686 150,490 206,951 203,496 Timberlane NIA 342,190 344,815 322,463 443,771 410,626 325,010 637,001 580,134 524,345 285,890
Total School Facilities $ 1,431,460 s 1,495,820 s 1,682,559 $ 1,552,215 $ 1,584,419 $ 1,552,099 s 1,558,893 $1,595,726 $ 1,506,892 $ 1,325,791
Source: District records
112

HOPEWELL VALLEY REGIONAL SCHOOL DISTRICT INSURANCE SCHEDULE
JUNE 30, 2018 UNAUDITED
J-20
COVERAGE DEDUCTIBLE Property• NJSIG:
Blanket Building & Contents Extra Expenses
Uablllty•NJSIG Bodily lnjwy & Property Damage Each Occurrence Aggregate Fire Damage
Employee Benefit Programs Ench Occurrence
Boller & Machinery • NJSIG
Crlme-NJSIG Employee Dishonesty Musical Instruments Athletic Equipment Mobile Equipment
EDP
Automoblle-NJSIG Bodily Injury & Propeny Personal Injury Protection Medical Payments Uninsured/Underinsured
Workers Compemation-NJSIG Section "A" Section "B" Ench Accident Each Employee Aggregate
Supplemental Indemnity Ma.ximum Weekly Benefit
Bonds-Selective Board Sec/Bus Adm Treasurer of School Monies
Student Accident-Bollinger Maximum Limit
Environmental Policy-AIG Limit of Liability Aggregate Mold Deductible
School Leaders- NJSIG Limit of Liability Retention
CAP· Fireman's Fund Limit of liability
International Policy · Ace Ench Occurrence Aggregate Employee Benefits Contingent Auto Liability
S 184,754,215 $ S0,000,000
16,000,000 16,000,000 16,000,000
16,000,000
184,754,215
500,000 134,066 192,311
9,000
2,234,671
16,000,000 Statutory
10,000 1,000,000
Statutory
2,000,000 2,000,000 2,000,000
Sl,7SO
120,000 400,000
S,000,000
1,000,000 1,000,000
16,000,000 10,000
50,000,000
1,000,000 2,000,000 1,000,000 1,000,000
5,000
1,000
1,000
1,000
1,000 1,000
10,000
100,000
113

Single Audit Section

WISS A Partner to Grow With
K-1
Report on Internal Control Over Financial Reporting and on Compliance and Other Matters Based on an Audit of Financial Statements Performed
in Accordance with Government Auditing Standards
Independent Auditors' Report
Honorable President and Members of the Board of Education
Hopewell Valley Regional School District Pennington, New Jersey County of Mercer
We have audited, in accordance with the auditing standards generally accepted in the United States of America; audit requirements as prescribed by the Office of School Finance, Department of Education, State of New Jersey; and the standards applicable to financial audits contained in Governmenr Auditing Standards, issued by the Comptroller General of the United States, the financial statements of the governmental activities, the business-type activities, each major fund, and the aggregate remaining fund information of the Hopewell Valley Regional School District, in the County of Mercer, New Jersey (the "District") as of and for the year ended June 30, 20 18, and the related notes to the financial statements, which collectively comprise the District's basic financial statements, and have issued our report thereon dated February 4, 2019.
Internal Control Over Financial Reporting
In planning and performing our audit of the financial statements, we considered the District's internal control over financial reporting (internal control) to determine the audit procedures that are appropriate in the circumstances for the purpose of expressing our opinions on the financial statements, but not for the purpose of expressing an opinion on the effectiveness of the District's internal control. Accordingly, we do not express an opinion on the effectiveness of .the District's internal control.
A deficiency in internal control exists when the design or operation of a control does not allow management or employees, in the normal course of performing their assigned functions, to prevent, or detect and correct, misstatements on a timely basis. A material weakness is a deficiency, or a combination of deficiencies, in internal control, such that there is a reasonable possibility that a material misstatement of the District's financial statements will not be prevented, or detected and corrected on a timely basis. A significant deficiency is a deficiency, or a combination of
1 : P n1 PlcJld Suite 1010 ' . \', 'tOrk. N't 10122
21259<l8155
35..t E1se~ho ::e1 Park'.·.ay. SultC' 1850 L•vingston. NJ 0703Q
973.994 9,100
114
5 Bc1rtles Corner Roaa Flemington NJ 08822
908.782.7300

deficiencies, in internal control that is less severe than a material weakness, yet important enough to merit attention by those charged with governance. ·
Our consideration of internal control was for the limited purpose described in the first paragraph of this section and was not designed to identify all deficiencies in internal control that might be material weaknesses or significant deficiencies. Given these limitations, during our audit we did not identify any deficiencies in internal control that we consider to be material weaknesses. However, material weaknesses may exist that have not been identified.
Compliance and Other Matters
As part of obtaining reasonable assurance about whether the District's financial statements are free of material misstatement, we performed tests of its compliance with certain provisions of laws, regulations, contracts, and grant agreements, noncompliance with which could have a direct and material effect on the determination of financial statement amounts. However, providing an opinion on compliance with those provisions was not an objective of our audit, and accordingly, we do not express such an opinion. The results of our tests disclosed no instances of noncompliance or other matters that are required to be reported under Government Auditing Standards and the audit requirements as prescribed by the Office of School Finance, Department of Education, State of New Jersey.
Purpose of this Report
The purpose of this report is solely to describe the scope of our testing of internal control and compliance and the results of that testing, and not to provide an opinion on the effectiveness of the District's internal control or on compliance. This report is an integral part of an audit performed in accordance with Government Auditing Standards in considering the District's internal control and compliance. Accordingly, this communication is not suitable for any other purpose.
February 4, 2019 Livingston, New Jersey
Scott A. Clelland Licensed Public School Accountant
No. 1049
w'.,;.,,, "'I-' ~ WISS &COMPANY, LLP
115

WISS A Partner to Grow With
K-2
Report on Compliance For Each Major Federal and State Program and Report on Internal Control Over Compliance Required by the
Uniform Guidance and New Jersey 0MB 15-08
Independent Auditors' Report
Honorable President and Members of the Board of Education
Hopewell Valley Regional School District Pennington, New Jersey County of Mercer
Report on Compliance for Each Major Federal and State Program
We have audited Hopewell Valley Regional School District's, in the County of Mercer, New Jersey (the "District") compliance with the types of compliance requirements described in the 0MB Compliance Supplement and the New Jersey State Aid/Grant Compliance Supplement that could have a direct and material effect on each of the District's major federal and state programs for the year ended June 30, 2018. The District' s major federal and state programs are identified in the summary of auditors' results section of the accompanying schedule of findings and questioned costs.
Management's Responsibility
Management is responsible for compliance with federal and state statutes, regulations and the terms and conditions of its federal and state awards applicable to its federal and state programs.
Auditors' Responsibility
Our responsibility is to express an opinion on compliance for each of the District's major federal and state programs based on our audit of the types of compliance requirements referred to above. We conducted our audit of compliance in accordance with auditing standards generally accepted in the United States of America; the standards applicable to financial audits contained in Government Auditing Standards, issued by the Comptroller General of the United States; the audit requirements as prescribed by the Office of School Finance, Department of Education, State of New Jersey; and the audit requirements of Title 2 U.S. Code of Federal Regulations Part 200, Uniform Administrative Requirements, Cost Principles, and Audit Requirements of Federal Awards (Uniform Guidance); and New Jersey OMB's Circular 15-08, Single Audit Policy for Recipients of
l l Penn Pt,1;:a, Suitt' 1010 NC\'/ York, NY 10122
212.594 8155
35-l Eisenhower Parkw,1y, Suli,, 1850 L1v1ngston, NJ 07039
973.994.9400
116
5 Bartles Carner Road Flemington. NJ 08822
908. 782. 7300

Federal Grants, State Grants and State Aid. Those standards, the Uniform Guidance and New Jersey 0MB Circular 15-08 require that we plan and perform the audit to obtain reasonable assurance about whether noncompliance with the types of compliance requirements referred to above that could have a direct and material effect on a major federal and state program occurred. An audit includes examining, on a test basis, evidence about the District's compliance with those requirements and performing such other procedures as we considered necessary in the circumstances.
We believe that our audit provides a reasonable basis for our opinion on compliance for each major federal and state program. However, our audit does not provide a legal determination of the District's compliance.
Opinion on Eacl, Major Federal and State Program
In our opinion, the District complied, in all material respects, with the types of compliance requirements referred to above that could have a direct and material effect on each of its major federal and state programs for the year ended June 30, 2018.
Report on Internal Control Over Compliance
Management of the District is responsible for establishing and maintaining.effective internal control over compliance with the types of compliance requirements referred to above. In planning and performing our audit of compliance, we considered the District's internal control over compliance with the types of requirements that could have a direct and material effect on each major federal and state program to determine the auditing procedures that are appropriate in the circumstances for the purpose of expressing an opinion on compliance for each major federal and state program and to test and report on internal control over compliance in accordance with the Uniform Guidance and New Jersey 0MB Circular 15-08, but not for the purpose of expressing an opinion on the effectiveness of internal control over compliance. Accordingly, we do not express an opinion on the effectiveness of the District's internal control over compliance.
A deficiency in internal control over compliance exists when the design or operation of a control over compliance does not allow management or employees, in the normal course of performing their assigned functions, to prevent, or detect and correct, noncompliance with a type of compliance requirement of a federal or state program on a timely basis. A material weakness in internal control over compliance is a deficiency, or a combination of deficiencies, in internal control over compliance, such that there is a reasonable possibility that material noncompliance with a type of compliance requirement of a federal or state program will not be prevented, or detected and corrected, on a timely basis. A significant deficiency in internal control over compliance is a deficiency, or a combination of deficiencies, in internal control over compliance with a type of compliance requirement of a federal or state program that is less severe than a material weakness in internal control over compliance, yet important enough to merit attention by those charged with governance.
Our consideration of internal control over compliance was for the limited purpose described in the first paragraph of this section and was not designed to identify all deficiencies in internal control over compliance that might be material weaknesses or significant deficiencies. We did not identify any deficiencies in internal control over compliance that we consider to be material weaknesses. However, material weaknesses may exist that have not been identified.
117

Purpose of this Report
The purpose of this report on internal control over compliance is solely to describe the scope of our testing of internal control over compliance and the results of that testing based on the requirements of the Uniform Guidance and New Jersey 0MB Circular 15-08. Accordingly, this .report is not suitable for any other purpose.
February 4, 2019 Livingston, New Jersey
~ a. Scott A. Clelland
Licensed Public School Accountant No. 1049
/JI .,IA,A, <>I' 4--r WISS & COMPANY, LLP
118

K-3 Schedule A
Hopewell Valley Regional School District
Schedule of Expenditures of Federal Awards
June 30, 2018
Federal Federal Balantt Balance June 301 2018 CFDA FAIN Grant Award at June Cash Dud1ctary Unearned (Accounb Due to
Federal Grantor/Pass-Through Grantor/Program Tille Number Number Pmod Amount 30,2017 KHdvcd t:sl!!!!dltures Adjustmcab Revenue RHdwblel Grantor
U.S. ~artmeat of Homeland Stturi1y-Passcd-Throu1h Township of Hopewell Oencnl Fund: FEMA Hazard Miliglllion Onmt 97.039 Not A\'ailoblc 7/1/16-6/30/17 $ 104,388 $ (104,388! s 104,388
U.S. Departmmt orllealtb and Human Scnices- Passed•Throu1h Slate
Dcpartmmt or Education Mediail AssiSlante Prognun • SEMI 93.778 180SNJMAP 7/1/17-6/30/18 10,656 10,656 s (1016S6!
Total Oencnl Fund (104.388! 115.044 (I0,656!
U.S. Department or Eduealion-Passcd•Throu1h State DcpartmentorEducation
Spc,:ial RC\'Cllue Fund: Tide I.Pan A 84.0IOA SOIOAl70030 7/1/17-6/30/18 86,619 61,815 (67,488) s (S,673) Tide I. Part A. Canyo..,,- 84.0IOA SOIOA160030 7/1/16-6/30/17 92,752 (12.488) 12,488
Tide II A 84.367A S367A170029 7/1/17-6/30/18 45,318 4S,318 (45,318) Tide II A. Canyo..,,- 84.367A S367A160029 7/1/16-6/30/17 40,254 (3,200) 3,200 Tide II A. Canyovcr 8'4.367A S367Al40029 7/1/14-6/30/IS 4S,086 l,89S s (1,895)
Tide 111 lnunig:ant 84.36SA S36SAl70030 7/1/17-6/30/18 4,543 4,122 (4,389) (267) Tide III lnunig:ant, Canyovcr 84.36SA S36SA160030 7/1/16-6/30/17 8,454 (892) 397 49S
T'lllc IV. Sludcnt Support A<:a<lcmic Enrichmcut 84.424 S424Al7003J 7/1/17-6130/18 10,000 8,672 (8,672)
Carl D. Peilins 84.048A V048A170114 7/1/17-6130/18 16,187 14,438 (16,187) (1,749) Carl D. Perkins 84.048A S048A 130030 7/1/13-6130/14 18,132 506 (S06)
Special Educlllion Cluster: I.D.E.A., Part B 84.027A H027Al70100 7/1/l 7•6/30/18 808,687 7Sl,78S (808,687) (56,902) I.D.E.A., Part B, Conyover 84.027A 11027Al60100 7/1/16-6/30/17 831,887 (209,036) 209,036
I.D.E.A. Pn:school 84.173A Hl73Al70114 7/1/17-6/30/18 24,504 24,S04 (24,504) I.D.E.A. Preschool, Canyover 84.173A Hl73Al20114 9/l/12·8131/13 23,385 (924! 924
Total Special Education CIUS1Cr (209,960! 98S132S (833,191! 924 (S61902l
Total Special Revenue Fund (224,139! l,l3S177S (97S124Sl (982! (64,S9ll
U.S. Dcpartmenl or A1riculturc-Passed•Throui:;b Stale Department or Agriculture
Enterprise Fund: Child Nutrition Program Cluster:
Food Donation Progmm (NC) 10.SSS 181NJ304NI09 7/1/17-6/30/18 66,499 66.499 (66,499) Nalionol School Lunch Prognun 10.SSS 181NJ304NI09 7/1/17-6/30/18 82,323 76,100 (82,323) (6,223) National School Lunch Program 10.SSS 171NJ304NI09 7/1/16-6/30/17 84,875 (6.S93l 6,593
Total Child Nulrilion Program Cluster (6.593! 149,192 (148,8221 !6,223! Total Enterprise Fund (6,S93l 149,192 (148,8221 (6,2231
Total Expaulinuaoffedeml Awards s pls 120} s I 400 011 I U,1~4.7231 ! !982} S . s {70 814} S
NC-non cash expc:nditmes
Tiu, accompanying notes to scMdules of ~ndJt"ru of fetkral awarrb and stat• financial assistance an an lnttg,al part of this statement.
119
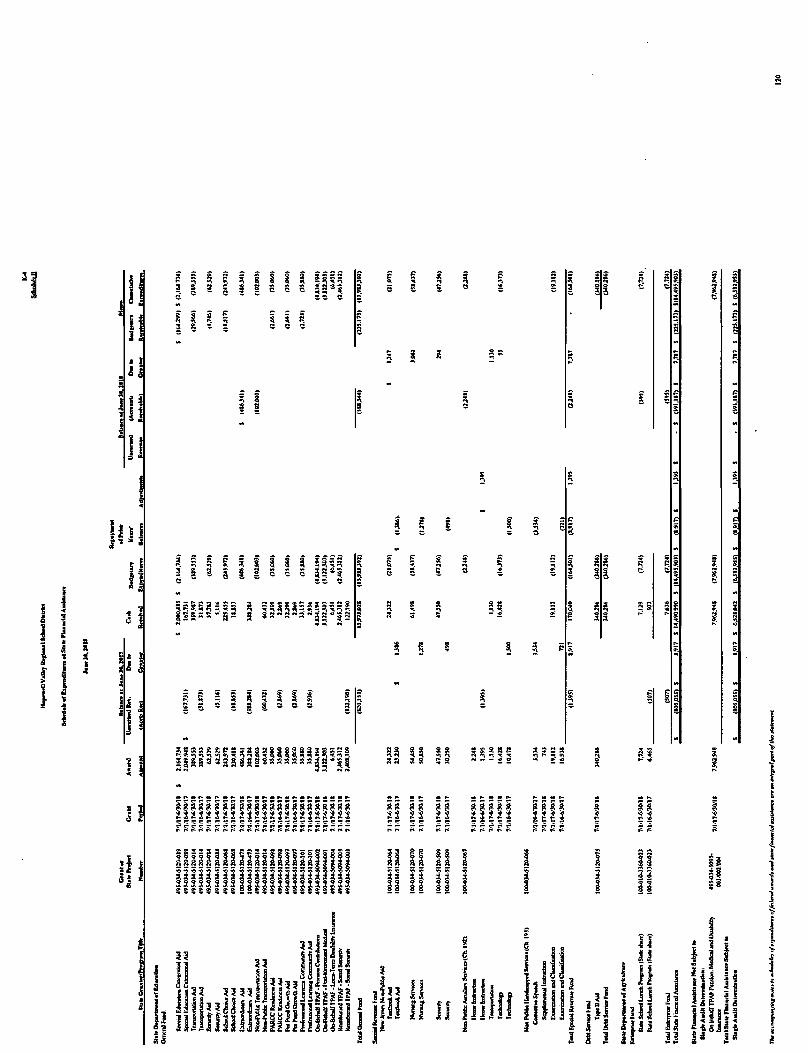
j t·
I • l A &
n ·U l j I
i i ~ C C C
... :

1. General
Hopewell Valley Regional School District
Notes to Schedules of Expenditures of Federal Awards and State Financial Assistance
Year ended June 30, 2018
K-5 p.1
( continued)
The accompanying schedules of expenditures of federal awards and state financial assistance present the activf ty of all expenditures of federal awards and state financial assistance programs of the District. The District is defined in Note 1, to the District's basic financial statements. All federal awards and state financial assistance received directly from federal and state agencies, as well as federal awards and state financial assistance passed through other government agencies, are included on the schedules of expenditures of federal awards and state financial assistance.
2. Basis of Accounting
The accompanying schedules of expenditures of federal awards and state financial assistance are presented on the budgetary basis of accounting with the exception of programs recorded in the enterprise fund, which are presented using the accrual basis of accounting and those recorded in the special revenue fund, which are presented using the budgetary basis of accounting. These bases of accounting are described in Note 1 to the District's basic financial statements. The information in these schedules are presented in accordance with the requirements of 2 CFR 200-Uniform Administrative Requirements, Cost Principles, and Audit Requirements for Federal Awards and New Jersey 0MB Circular 15-08, Single Audit Policy for Recipients of Federal Grants, State Grants and State Aid Therefore, some amounts presented in these schedules may differ from amounts presented, or used in the preparation of, the basic financial statements.
3. Relationship to Basic Financial Statements
Amounts reported in the accompanying schedules agree with amounts reported in the District's basic financial statements. The basic financial statements present the general fund and special revenue fund on a GMP basis. Budgetary comparison statements or schedules (RSI) are presented for the general fund and special revenue fund to demonstrate finance-related legal compliance in which certain revenue is permitted by law or grant agreement to be recognized in the fiscal year, whereas for GAAP reporting, revenue is not recognized until the subsequent year or when expenditures have been made. The general fund is presented in the accompanying schedules on the
121

Hopewell Valley Regional School District
Notes to Schedules of Expenditures of Federal Awards and State Financial Assistance
Year ended June 30, 2018
3. Relationship to Basic Financial Statements (continued)
K-S p.2
( continued)
modified accrual basis of accounting with the exception of the revenue recognition of the last two state aid payments in the current year, which is mandated pursuant to N.J.S.A. ISA:22-44.2. For GAAP purposes, those payments are not recognized until the subsequent year due to the state deferral and recording of the last two state aid payments in the subsequent year. The special revenue fund is presented in the accompanying schedules on the grant accounting budgetary basis, which recognizes encumbrances as expenditures and also recognizes the related revenues, whereas the GAAP basis does not. The special revenue fund also recognizes the last state aid payment in the current budget year, consistent with N.J.S.A. ISA:22-44.2.
The net adjustment to reconcile from the budgetary basis to the GAAP basis is $7,074 for the general fund and $8,395 for the special revenue fund. See note to required supplementary information for a reconciliation of the budgetary basis to the modified accrual basis of accounting for the general and special revenue funds (C-3). Federal and State award revenues are reported in the District's basic financial statements on a GAAP basis as follows:
Federal State Total
General Fund $ 10,656 $ 13,990,465 $ 14,001,122 Special Revenue Fund 975,245 164,501 1,139,746 Debt Service Fund 340,286 340,286 Food Service Enterprise Fund 148,822 72724 1562546 Total financial award revenues $ 1,134,723 $ 14,502,977 $ 15,637,700
4. Relationship to Federal and State Financial Reports
Amounts reported in the accompanying schedules agree with the amounts reported in the related federal and state financial reports.
122

5. Other
Hopewell Valley Regional School District
Notes to Schedules of Expenditures of Federal Awards and State Financial Assistance
Year ended June 30, 2018
K-5 p.3
Revenues and expenditures reported under the Food Donation Program represent current year value received and current year distributions, respectively. TPAF Social Security Contributions represent the amount reimbursed by the State for the employer's share of Social Security for TP AF members for the year ended June 30, 2018.
The post retirement pension, medical, and long-term disability benefits received onbehalf of the District for the year ended June 30, 2018 amounted to $7,962,948. Since on-behalf post retirement pension, medical and long-term disability benefits are paid by the State directly, these expenditures are not subject to a single audit in accordance with New Jersey 0MB Circular 15-08. They are however reported on the Schedule of Expenditures of State Financial Assistance, as directed by the funding agency.
6. Indirect Costs
The District did not use the l 0% de minimis indirect cost rate.
7. Adjustments
The adjustments presented on exhibits K-3 and K-4 represent cancellations of prior year receivables, encumbrances and unearned revenue.
123

Hopewell Valley Regional School District
Schedule ofFindings and Questioned Costs (continued)
Year ended June 30, 2018
Part I - Summary of Auditors' Results ( continued)
Financial Statements
Type of report the auditors issued on whether the financial statements audited were prepared in accordance with GAAP:
Internal control over financial reporting:
Are any material weakness (es) identified?
Are any significant deficiency (ies) identified?
Noncompliance material to the basic financial statements noted?
Federal Awards
Internal control over major federal programs:
Unmodified
Yes X
Yes X
Yes X
X
K-6 p. 1
( continued)
No
None Reported
No
No Are any material weakness (es) identified?
Are any significant deficiency (ies) identified?
Yes
Yes X None Reported
Type of auditors' report issued on compliance for major federal programs:
Any audit findings disclosed that are required to be reported in accordance with 2 CFR 200.516(a)?
Identification of major federal programs:
Yes
Unmodified
X No
CFDA Number(s) FAIN Number Name of Federal Program or Cluster
84.027A H027A170100 84.173A H173A170114
IDEA, Part B, Basic (Special Education Cluster) IDEA, Part B, Preschool (Special Education Cluster)
Dollar threshold used to distinguish between Type A and Type B programs:
Auditee qualified as low-risk auditee? X Yes
$750,000
No
124
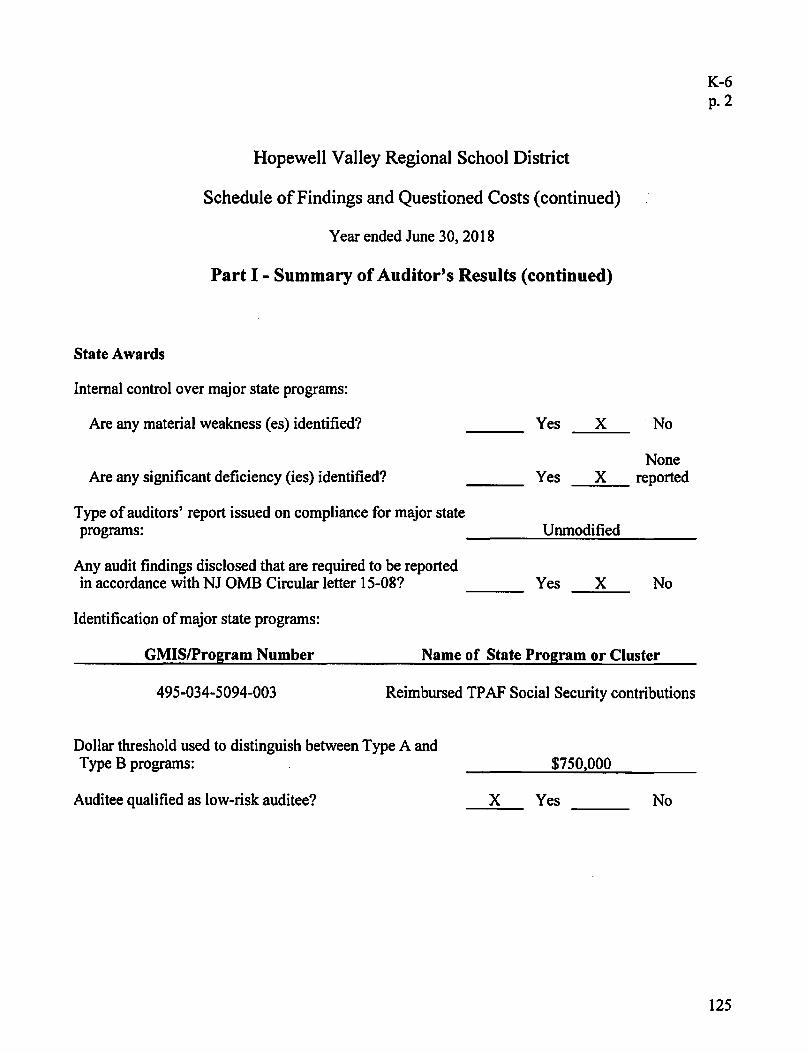
State Awards
Hopewell Valley Regional School District
Schedule of Findings and Questioned Costs ( continued)
Year ended June 30, 2018
Part I - Summary of Auditor's Results (continued)
Internal control over major state programs:
Are any material weakness (es) identified? Yes X No
Are any significant deficiency (ies) identified? Yes None
__ x __ reported
Type of auditors' report issued on compliance for major state programs:
Any audit findings disclosed that are required to be reported in accordance with NJ 0MB Circular letter 15-08?
Identification of major state programs:
Unmodified
Yes X No
GMIS/Program Number Name of State Program or Cluster
495-034-5094-003 Reimbursed TP AF Social Security contributions
Dollar threshold used to distinguish between Type A and Type B programs:
Auditee qualified as low-risk auditee? X
$750,000
Yes No
K-6 p.2
125

Hopewell Valley Regional School District
Schedule ofFindings and Questioned Costs (continued)
Year ended June 30, 2018
Part II - Schedule of Financial Statement Findings
K-7 p. I
( continued)
No compliance or internal control over financial reporting findings noted that are required to be reported under Government Auditing Standards.
126

Hopewell Valley Regional School District
Schedule of Findings and Questioned Costs ( continued)
Year ended June 30, 2018
Part III - Schedule of Federal and State Award Findings and Questioned Costs
K-7 p.2
This section identifies the significant deficiencies, material weaknesses, and instances of noncompliance, including questioned costs, related to the audit of major federal and state programs, as required by 2 CFR 200 Section 516(a) and New Jersey Treasury Circular 0MB 15-08, respectively.
Federal Award Programs
No compliance or internal control findings noted that are required to be reported in accordance with 2 CFR 200 Section 5 l 6(a).
State Award Programs
No compliance or internal control findings noted that are required to be reported in accordance with NJ 0MB Circular Letter 15-08.
127
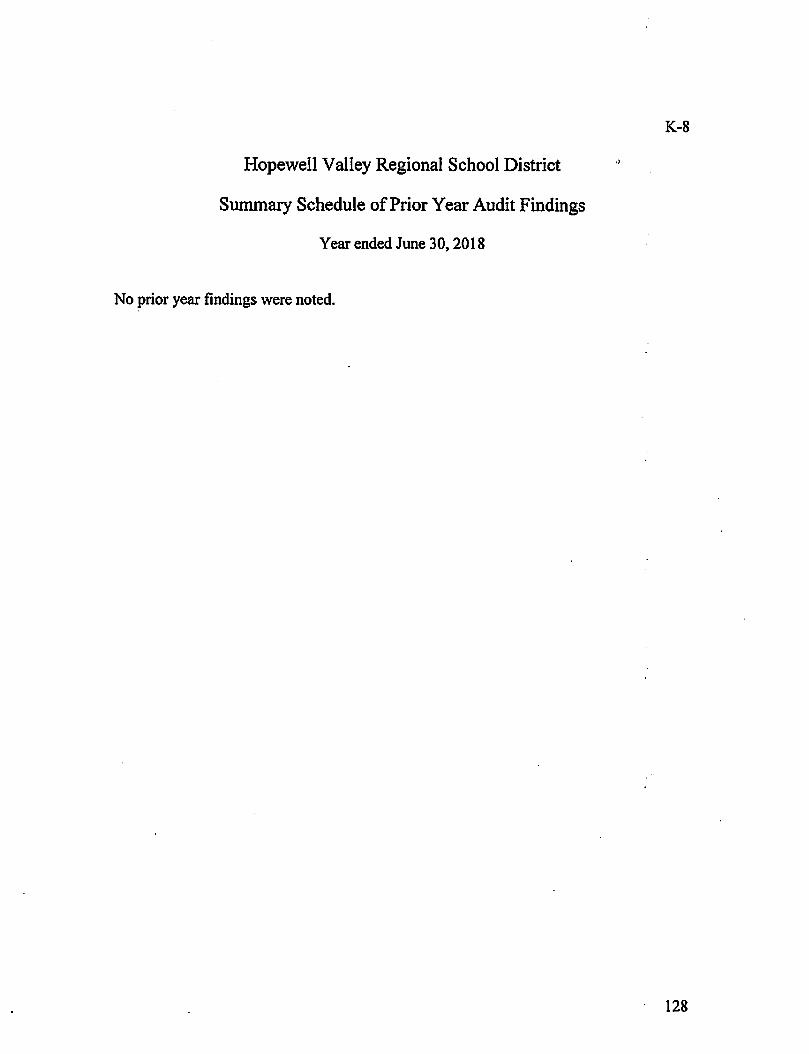
Hopewell Valley Regional School District
Summary Schedule of Prior Year Audit Findings
Year ended June 30, 2018
No prior year findings were noted.
K-8
· 128


![Employee's' health clinic orientation [compatibility mode]](https://static.fdocuments.net/doc/165x107/545c9b07af7959c8098b4882/employees-health-clinic-orientation-compatibility-mode.jpg)