REGIONAL PARTNERSHIP GRANT (RPG) PROGRAM … Program Brief_4_Outcomes.pdf · Page | 1 Prepared for...
20
Page | 1 Prepared for the Children’s Bureau by Children and Family Futures REGIONAL PARTNERSHIP GRANT (RPG) PROGRAM: INTERIM SAFETY, PERMANENCY, WELL-BEING, AND RECOVERY OUTCOMES JANUARY 2014 RPG PROGRAM BRIEF #4 About the RPG Program Briefs Series This is the fourth in a series of program briefs discussing the initial grant period of the Regional Partnership Grant (RPG) Program, administered by the Administration on Children, Youth and Families, Children’s Bureau. In 2007, 53 grantees representing state, county, and tribal partnerships were awarded “Targeted Grants to Increase the Well-Being of, and to Improve the Permanency Outcomes for, Children Affected by Methamphetamine or Other Substance Abuse.” The initial grant period for the RPG Program was September 2007 – September 2012. The four program briefs cover the following: RPG Program Brief 1: Legislative Intent and General Overview RPG Program Brief 2: Overview of Grantees’ Services and Interventions RPG Program Brief 3: Effective Systems Linkages – Key Implementation Lessons RPG Program Brief 4: RPG Program: Interim Safety, Permanency, Well-Being, and Recovery Outcomes Additional information about the RPG Program can be found in the Reports to Congress, available at http://www.cffutures.org/projects/regional-partnership-grants.
Transcript of REGIONAL PARTNERSHIP GRANT (RPG) PROGRAM … Program Brief_4_Outcomes.pdf · Page | 1 Prepared for...

Page | 1
Prepared for the Children’s Bureau by Children and Family Futures
REGIONAL PARTNERSHIP GRANT (RPG) PROGRAM:
INTERIM SAFETY, PERMANENCY, WELL-BEING, AND
RECOVERY OUTCOMES
JANUARY 2014
RPG PROGRAM BRIEF #4
About the RPG Program Briefs Series
This is the fourth in a series of program briefs discussing the initial grant period of the
Regional Partnership Grant (RPG) Program, administered by the Administration on Children,
Youth and Families, Children’s Bureau. In 2007, 53 grantees representing state, county, and
tribal partnerships were awarded “Targeted Grants to Increase the Well-Being of, and to
Improve the Permanency Outcomes for, Children Affected by Methamphetamine or Other
Substance Abuse.” The initial grant period for the RPG Program was September 2007 –
September 2012.
The four program briefs cover the following:
RPG Program Brief 1: Legislative Intent and General Overview
RPG Program Brief 2: Overview of Grantees’ Services and Interventions
RPG Program Brief 3: Effective Systems Linkages – Key Implementation Lessons
RPG Program Brief 4: RPG Program: Interim Safety, Permanency, Well-Being, and
Recovery Outcomes
Additional information about the RPG Program can be found in the Reports to Congress,
available at http://www.cffutures.org/projects/regional-partnership-grants.
Page | 2
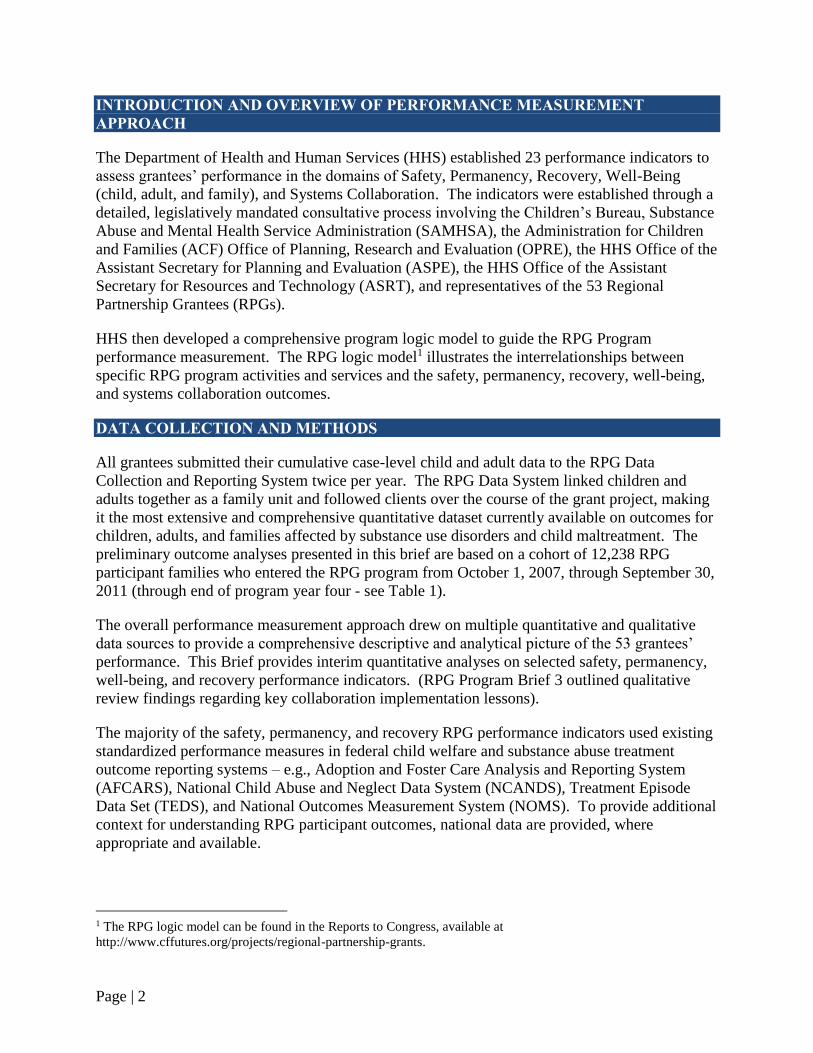
INTRODUCTION AND OVERVIEW OF PERFORMANCE MEASUREMENT
APPROACH
The Department of Health and Human Services (HHS) established 23 performance indicators to
assess grantees’ performance in the domains of Safety, Permanency, Recovery, Well-Being
(child, adult, and family), and Systems Collaboration. The indicators were established through a
detailed, legislatively mandated consultative process involving the Children’s Bureau, Substance
Abuse and Mental Health Service Administration (SAMHSA), the Administration for Children
and Families (ACF) Office of Planning, Research and Evaluation (OPRE), the HHS Office of the
Assistant Secretary for Planning and Evaluation (ASPE), the HHS Office of the Assistant
Secretary for Resources and Technology (ASRT), and representatives of the 53 Regional
Partnership Grantees (RPGs).
HHS then developed a comprehensive program logic model to guide the RPG Program
performance measurement. The RPG logic model1 illustrates the interrelationships between
specific RPG program activities and services and the safety, permanency, recovery, well-being,
and systems collaboration outcomes.
DATA COLLECTION AND METHODS
All grantees submitted their cumulative case-level child and adult data to the RPG Data
Collection and Reporting System twice per year. The RPG Data System linked children and
adults together as a family unit and followed clients over the course of the grant project, making
it the most extensive and comprehensive quantitative dataset currently available on outcomes for
children, adults, and families affected by substance use disorders and child maltreatment. The
preliminary outcome analyses presented in this brief are based on a cohort of 12,238 RPG
participant families who entered the RPG program from October 1, 2007, through September 30,
2011 (through end of program year four - see Table 1).
The overall performance measurement approach drew on multiple quantitative and qualitative
data sources to provide a comprehensive descriptive and analytical picture of the 53 grantees’
performance. This Brief provides interim quantitative analyses on selected safety, permanency,
well-being, and recovery performance indicators. (RPG Program Brief 3 outlined qualitative
review findings regarding key collaboration implementation lessons).
The majority of the safety, permanency, and recovery RPG performance indicators used existing
standardized performance measures in federal child welfare and substance abuse treatment
outcome reporting systems – e.g., Adoption and Foster Care Analysis and Reporting System
(AFCARS), National Child Abuse and Neglect Data System (NCANDS), Treatment Episode
Data Set (TEDS), and National Outcomes Measurement System (NOMS). To provide additional
context for understanding RPG participant outcomes, national data are provided, where
appropriate and available.
1 The RPG logic model can be found in the Reports to Congress, available at
http://www.cffutures.org/projects/regional-partnership-grants.

Page | 3
CHILD SAFETY – INTERIM INDICATOR FINDINGS
The majority of RPG children (70.5 percent) were in the custody of a parent/caregiver (i.e.,
in-home) at time of RPG program enrollment.
Nearly all (92.7 percent) of the children in-home at time of RPG program remained in their
parent’s or caregiver’s custody through RPG program case closure.
The percent of RPG children who remained in-home through RPG case closure increased
steadily over the first four program years. The percent of children who remained in-home
was 87.1 percent in program year one, 91.8 percent in program year two, 94.7 percent in
program year three, and 98.5 percent in program year four (see Figure 1).
87.1% 91.8%94.7% 98.5%
0%
20%
40%
60%
80%
100%
RPG Year 1 (n=1,647) RPG Year 2 (n=2,957) RPG Year 3 (n=2,394) RPG Year 4 (n=1,218)
Figure 1: Percentage of Children Who Remained at Homeby RPG Program Year
Table 1: RPG Program Sample Sizes
(As of September 30, 2011)
Participant Group Comparison Group
Children: 20,276 10,148
Adults: 14,462 7,097
Families: 12,238 6,208
Children Remain at Home:
Percentage of Children Identified as At Risk of Removal from the Home Who are Able to
Remain in the Custody of a Parent/Caregiver through RPG Case Closure

Page | 4
A total of 4.3 percent of RPG children experienced child maltreatment within six months of
program enrollment. This rate is less than the 2010 median rate of 5.5 percent maltreatment
recurrence within six months for the 26-state contextual subgroup.2
The percentage of RPG children who experienced child maltreatment within six months of
program enrollment decreased from 6.5 percent in program year one to 4.1 percent in
program year two. The percentage continued to decrease to 3.7 percent in program year
three and 3.4 percent in program year four (see Figure 2).
HHS also examined maltreatment occurrence at 12, 18, and 24 months following a family’s
RPG program enrollment; this included families who may have been discharged from the
RPG program and were no longer receiving RPG services. As Figure 3 shows, the point-in-
time percentage of children experiencing maltreatment at 12, 18, and 24 months was 2.3
percent, 1.6 percent, and 1.2 percent, respectively. The cumulative percentage of children
experiencing maltreatment within 12, 18 and 24 months was 6.6 percent, 8.2 percent, 9.4
percent, respectively.
2 To provide additional context for understanding RPG Program performance, national child welfare data from the
Adoption and Foster Care Analysis and Reporting System (AFCARS) and the National Child Abuse and Neglect
Data System (NCANDS) and national substance abuse data from the National Outcomes Measures (NOMs) and
Treatment Episode Data Set (TEDS) are provided, where appropriate and available. These state contextual subgroup data represent the 29 states in which the RPGs are operating. The state contextual data are not intended to
serve as a comparison group for the RPG Program and do not allow for statistical comparisons to RPG participants.
6.5%
4.1% 3.7%3.4%
0%
1%
2%
3%
4%
5%
6%
7%
RPG Year 1 (N=3,074) RPG Year 2 (N=4,839) RPG Year 3 (N=5,044) RPG Year 4 (N=3,934)
Figure 2: Percentage of RPG Children Experiencing Child Maltreatment Within 6 Months of RPG Program Enrollment
by RPG Program Year
Occurrence of Child Maltreatment
Percentage of Children who had an initial occurrence and/or recurrence of sustained/indicated
child maltreatment within six, 12, 18, and 24 months after enrolling in the RPG program

Page | 5
PERMANENCY – INTERIM INDICATOR FINDINGS
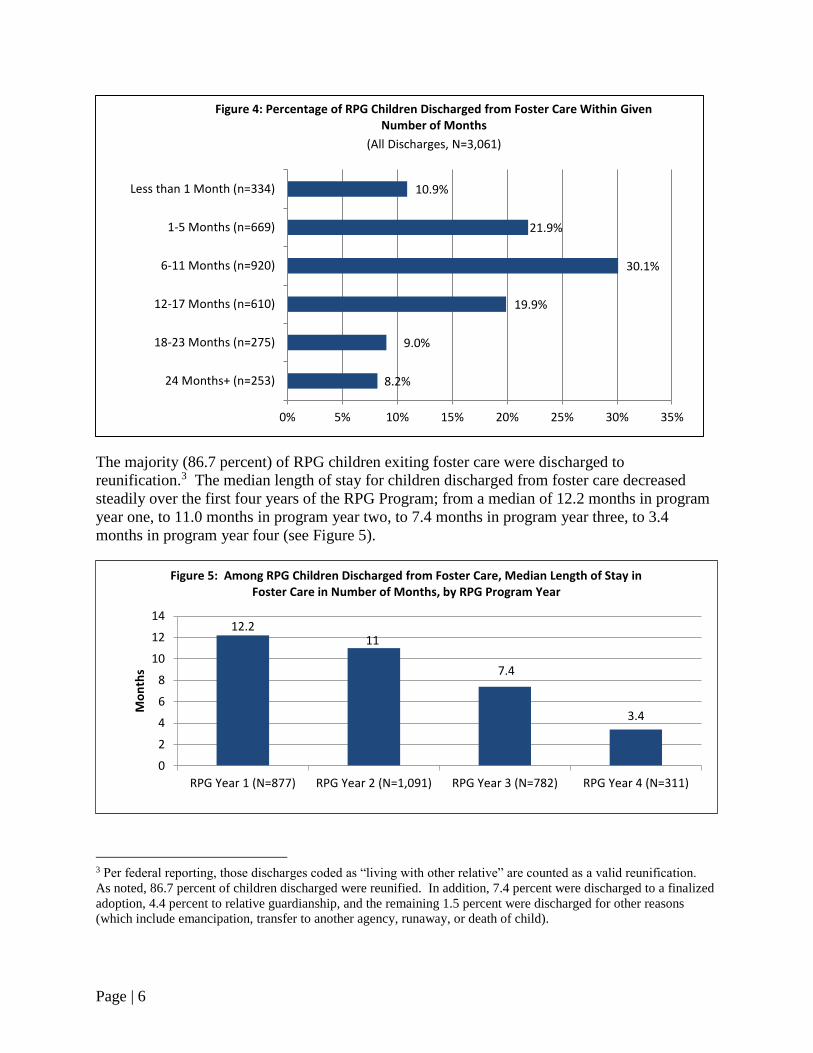
RPG children discharged from foster care (all reasons combined) had a median length of stay in
care of nine months. Nearly one-third (32.8 percent) of RPG children were discharged from
foster care in less than six months; nearly two-thirds (63.0 percent) were discharged in less than
12 months (see Figure 4). Specifically, 10.9 percent were discharged in less than one month,
21.9 percent were discharged within one to five months, 30.1 percent were discharged within six
to 11 months, 19.9 percent were discharged within 12 to 17 months, 9.0 percent were discharged
within 18 to 23 months, and 8.2 were discharged in 24 months or more.
4.3%(n=719)
2.3% (7-12 months,
n=345) 1.6%
(13-18 months, n=202)
1.2%(19-24 months,
n=122)
6.6%(n=1,064)
8.2%(n=1,266)
9.4%(n=1,388)
0.0%
1.0%
2.0%
3.0%
4.0%
5.0%
6.0%
7.0%
8.0%
9.0%
10.0%
Within 6 Months Within 12 Months(cumulative)
Within 18 Months(cumulative)
Within 24 Months(cumulative)
Figure 3: Point-in-Time and Cumulative Percentage of RPG Children Who Experienced Maltreatment Within 6, 12, 18, and 24 Months of RPG Program Enrollment
Point-in-Time Cumulative
Note: Data represent 45 RPGs. The denominator for each point-in-time calculation represents the number of children for whom a specified amount of time has passed since their RPG enrollment date. For within 6 months, N=16,894 children for whom at least 1 day has passed since the RPG enrollment date. For 7 to 12 months, N=14,927 children for whom more than 6 months had passed; for 13 to 18 months, N=12,475 children for whom more than 12 months had passed; for 19 to 24 months, N=9,843 children for whom more than 18 months had passed since their RPG enrollment date. The cumulative data represent the total number and percentage of children who have experienced maltreatment through the identified time interval.
Average Length of Stay in Foster Care
For children discharged from foster care, average length of stay (in days) from date of most
recent entry into such care until data of discharge.
Page | 6
The majority (86.7 percent) of RPG children exiting foster care were discharged to
reunification.3 The median length of stay for children discharged from foster care decreased
steadily over the first four years of the RPG Program; from a median of 12.2 months in program
year one, to 11.0 months in program year two, to 7.4 months in program year three, to 3.4
months in program year four (see Figure 5).
3 Per federal reporting, those discharges coded as “living with other relative” are counted as a valid reunification.
As noted, 86.7 percent of children discharged were reunified. In addition, 7.4 percent were discharged to a finalized
adoption, 4.4 percent to relative guardianship, and the remaining 1.5 percent were discharged for other reasons
(which include emancipation, transfer to another agency, runaway, or death of child).
8.2%
9.0%
19.9%
30.1%
21.9%
10.9%
0% 5% 10% 15% 20% 25% 30% 35%
24 Months+ (n=253)
18-23 Months (n=275)
12-17 Months (n=610)
6-11 Months (n=920)
1-5 Months (n=669)
Less than 1 Month (n=334)
Figure 4: Percentage of RPG Children Discharged from Foster Care Within Given Number of Months
(All Discharges, N=3,061)
12.211
7.4
3.4
0
2
4
6
8
10
12
14
RPG Year 1 (N=877) RPG Year 2 (N=1,091) RPG Year 3 (N=782) RPG Year 4 (N=311)
Mo
nth
s
Figure 5: Among RPG Children Discharged from Foster Care, Median Length of Stay in Foster Care in Number of Months, by RPG Program Year

Page | 7
Among the 2,938 RPG children reunified through September 30, 2011, the median length of stay
in foster care was 8.1 months. Overall, approximately 70 percent of these RPG children were
reunified within 12 months; more than one-fourth (26.2 percent) were reunified in less than three
months.
Through September 30, 2011, only a very small number of children had been discharged to a
finalized adoption or legal guardianship. Among the 313 RPG children discharged from foster
care to this type of permanency placement, two-thirds (66.2 percent) did so within 24 months.
More than one-fourth (26.2 percent) of RPG children were reunified with their families in less
than three months; 12.5 percent were reunified in four to six months; 17.6 percent within seven
to nine months; 13.5 percent in 10 to 12 months and 30.2 percent in more than 12 months (see
Figure 6).
The percentage of RPG children reunified within 12 months (69.8 percent) is on par with the
contextual 22-State subgroup median of 69.0 percent.
Timeliness of reunification (i.e., within 12 months) increased steadily over the course of the RPG
Program. The percentage of children reunified within 12 months was 59.7 percent in program
year one, 63.6 percent in program year two, 78.2 percent in program year three, and 91.6 percent
in program year four (see Figure 7).
30.2%
13.5%
17.6%
12.5%
26.2%
0% 5% 10% 15% 20% 25% 30% 35%
More than 12 Months
10-12 Months
7-9 Months
4-6 Months
Less than 3 Months
Figure 6: Percentage of RPG Children Who Were Reunified Within Given Number of Months (N=2,843)
Timeliness of Reunifications
Percentage of children who were reunified in less than 12 months from the date of the most
recent entry into foster care

Page | 8
Differences by age group were observed. The percentage of children less than one year old who
were reunified within 12 months (80.4 percent) was significantly higher than all other age
groups. Children aged six to eight years (61.7 percent) and nine to 12 years (59.9 percent) had
the lowest rates of reunification within 12 months.
Through September 30, 2011, 33 grantees reported reunifying 2,938 RPG children who were in
out-of-home care.4 More than half of these grantees (18 grantees or 54.5 percent) reported that
none of their reunified children re-entered foster care.
Among children reunified, only 220 (7.5 percent) re-entered foster care following reunification.
Most of those who re-entered did so within six to 11 months of being reunified. Specifically, the
percentage of children who re-entered foster care after reunification was 1.9 percent in less than
six months, 3.2 percent in six to 11 months, 0.9 percent in 12 to 18 months, and 0.7 percent in 19
to 24 months (see Figure 8).
4 Includes children who were already in foster care at time of RPG enrollment as well as those who entered foster
care after RPG enrollment.
59.7%63.6%
78.2%
91.6%
0%
20%
40%
60%
80%
100%
RPG Year 1 (N=764) RPG Year 2 (N=977) RPG Year 3 (N=769) RPG Year 4 (N=333)
Figure 7: Percentage of Children Reunified Within 12 Months, by RPG Program Year
Re-Entries to Foster Care:
Percentage of Children Returned Home from Foster Care that Re-entered Foster Care in Less
than six, 12, 18 and 24 Months

Page | 9
The percentage of RPG children who re-entered foster care within 12 months (5.1 percent) was
substantially lower than the median rate of 13.4 percent for the 21 States in which the RPGs were
operating.
The percentage of RPG children who re-entered foster care decreased steadily over the course of
the RPG Program. The percentage of children who re-entered foster was 9.8 percent in year one,
7.5 percent in program year two, 6.8 percent in program year three, and 3.5 percent in year four.
The overall rate across the four years was 7.5 percent (see Figure 9). Children who re-entered
foster care were significantly younger (Mean=4.2 years) than children who did not re-enter foster
care (Mean=5.4 years).
0.7%
0.9%
3.2%
1.9%
0% 1% 1% 2% 2% 3% 3% 4%
19-24 Months (n=22)
12-18 Months (n=25)
6-11 Months (n=94)
Less than 6 Months (n=57)
Figure 8: Among RPG Children Reunified, Percentage Who Re-entered Foster Care Within Given Number of Months
N=2,938 children reunified; analysis excludes 22 reunified children who re-entered foster care, but time to re-entry could not be determined.
9.8%
7.5%6.8%
3.5%
0%
2%
4%
6%
8%
10%
12%
RPG Year 1 (N=808) RPG Year 2 (N=999) RPG Year 3 (N=791) RPG Year 4 (N=340)
Figure 9: Of Children Reunified, Percentage Who Re-Entered Foster Care, by RPG Program Year
Overall rate: 7.5%

Page | 10
CHILD, ADULT, AND FAMILY WELL-BEING INDICATOR FINDINGS
Introduction to the Well-Being Framework
When the RPG Program was implemented in September 2007, the general concept of “well-
being,” together with child safety and permanency in caregiving relationships, were recognized
as the primary outcomes of child welfare services. The Children’s Bureau’s Child and Family
Service Review (CFSR) process operationally defined well-being as parents having enhanced
capacity to care for the health and educational needs of their children. Over the past decade,
measurement of well-being continues to be discussed and more clearly defined.5
Since the implementation of the RPG Program and during the last several years in particular,
there has been increased attention on ensuring services are delivered to meet children’s
additional needs, including their social and emotional needs, and a broader operational definition
of child well-being was sought. This has been evidenced by various national and federal efforts.6
In April 2012, the Administration on Children, Youth and Families (ACYF) issued an
Information Memorandum (IM) outlining its priority to promote and strengthen children’s social
and emotional well-being,7 noting that ensuring safety and achieving permanency are necessary
but not sufficient to improving well-being. The IM provided a child well-being framework
focused on four outcome domains: cognitive functioning, physical health and development,
behavioral/emotional functioning, and social functioning. Environmental supports and personal
characteristics are viewed as intermediate outcome domains that influence the four child well-
being domains.
Among the more than 50 different instruments grantees are using to measure the various well-
being concepts, HHS identified nine most commonly selected valid and reliable instruments (See
Box 1). The well-being indicator analyses are limited to data from these nine instruments. This
brief focuses only on interim findings from the subset of 10 grantees that used the North Carolina
Family Assessment Scales (NCFAS).
5 Lou, C., Anthony, E.K., Stone, S., Vu, C.M. & Austin, M.J. (2008). Assessing child and youth well-being:
Implications for child welfare practice. Journal of Evidence-Based Social Work. 5:1-2, 91-133
6 Other efforts focused on child and family well-being include, for example, the Strengthening Families approach
and Protective Factors Framework that more than 30 States have adopted; the National Child Welfare Resource
Center on Legal and Judicial Issues’ proposed well-being measures for the courts; the KIDS COUNT Data Book
(which includes 16 child well-being indicators in the domains of economic well-being, education, health, and family
and community); the National Study on Child and Adolescent Well-Being (NSCAW); and the development of a
National Child Well-Being Index. In addition, ACYF has incorporated a more explicit focus on child well-being in
recent grant programs such as the Maternal, Infant, and Early Childhood Home Visiting Program and the Child
Welfare – Early Education Partnerships to Expand Protective Factors for Children with Child Welfare Involvement
Program.
7 Information Memorandum ACYF-CB-IM-12-04 issued April 17, 2012; available at
http://www.acf.hhs.gov/programs/cb/laws_policies/policy/im/2012/im1204.pdf

Page | 11
PRELIMINARY NCFAS FINDINGS
The NCFAS Child Well-Being subscale includes items that address a child’s overall well-being
and social-emotional and behavioral functioning. It assesses if a child is experiencing any
problems in the following areas: mental health, behavior or discipline problems, school
performance, relationship with parents/caregivers, relationship with siblings, relationship with
peers, and cooperation or motivation to maintain the family. The subscale also includes an
overall child well-being item that is intended to summarize a child’s ratings across these areas.
The percentage of RPG children assessed with the NCFAS for whom the overall child well-
being item was rated as a mild to clear strength significantly increased from 27.0 percent at
program admission to 57.1 percent at program discharge. Similarly, the percentage for
whom overall well-being was rated as a mild to serious problem significantly declined from
more than one-fourth (28.7 percent) to 10.2 percent (see Table 2).8
8 Statistically significant improvements in the overall child well-being item were consistent across grantees reporting
these data.
Table 2: Overall Child Well-Being – Change in NCFAS Ratings from RPG Program
Admission to Discharge, Percentage of Children by Rating Category (N=587)
RPG Program
Admission
RPG Program
Discharge
Mild/Clear Strength 27.0% 57.1%
Baseline/Adequate 44.1% 32.7%
Mild/Moderate/Serious Problem 28.7% 5.9%
Notes: Data represent the subset of eight grantees reporting these NCFAS data.
Box 1: Most Commonly Selected Instruments to Measure Child, Adult and Family
Well-Being Indicators-Box
Addiction Severity Index (ASI)
Adult-Adolescent Parenting Inventory (AAPI)
Ages and Stages Questionnaire (ASQ)
ASQ Social-Emotional (ASQ-SE)
Beck Depression Inventory (BDI)
Child Behavior Checklist (CBCL)
North Carolina Family Assessment Scales (NCFAS, NCFAS-G or NCFAS-R)
Parenting Stress Index (PSI)
Protective Factors Survey (PFS)

Page | 12
The percentage of RPG children for whom specific areas of well-being were rated as a mild to
clear strength significantly increased from RPG program admission to program discharge in
all areas. Ratings for children increased most in the areas of mental health, relationships with
their parents/caregivers, and behavior. These improvements indicate improved emotional
stability, better behavior, less discipline and supervision problems, and better communication
with their parents. Children also showed significant improvements in ratings for school
attendance and behavior, better and more frequent interactions with their peers, increased
motivation to behave and cooperate with their parents and family, and improved relationships
with their siblings9 (see Table 3).
This section presents data highlighting change over time regarding RPG adults’ parenting
behaviors and attitudes, as measured by the NCFAS Parental Capabilities subscale.
The NCFAS Parental Capabilities subscale assesses if parents are experiencing any problems
with supervision of children, disciplinary practices, control and monitoring of children’s media
access and content, provision of developmental/enrichment opportunities (e.g., sports, music),
promotion of and involvement in child’s education, literacy skills (e.g., integrating reading and
writing into the family’s everyday life), and alcohol and drug use that impacts their ability to
parent children. The subscale also includes an overall parental capabilities item that is intended
to summarize a parent’s ratings across these areas.
The percentage of RPG adults for whom the overall parental capabilities item was rated as a mild
to clear strength significantly increased from 16.6 percent at program admission to
approximately half (49.7 percent) at program discharge. Similarly, the percentage for whom
9 Statistically significant improvements in the mental health and behavior items were consistent across grantees
reporting these data. For the other items, findings of statistical significance varied across grantees.
Table 3: Percentage of Children for Whom Selected NCFAS Child Well-Being Areas
were Rated as a Mild/Clear Strength at RPG Program Admission and Discharge***
RPG Program
Admission
RPG Program
Discharge
Behavior (N=531) 28.2% 52.4%
Cooperation (N=528) 47.0% 69.9%
Mental Health (N=404) 29.5% 56.4%
Relationship with Parents (N=543) 34.2% 59.3%
Relationship with Peers (N=379) 32.7% 53.1%
Relationship with Siblings (N=403) 44.7% 63.8%
School Performance (N=400) 23.2% 43.3%
*** p<.001 for all items
Notes: Data represent the subset of eight grantees reporting these NCFAS data.

Page | 13
overall parental capabilities was rated as a mild to serious problem significantly declined from
47.9 percent to 17.5 percent (see Table 4).
In four of the seven specific parental capability areas, RPG parents showed significant
improvement (see Table 5); the greatest progress was made regarding no or decreased substance
use and appropriate supervision of children.10 The percentage of RPG parents in the strength
range for no or decreased substance use significantly increased from only 14.2 percent at
program admission to 47.2 percent at discharge. While supervision was a strength for more than
one-fourth (26.3 percent) of parents upon RPG admission, this figure significantly increased to
well over half (57.7 percent) by program discharge. Parents also showed significant
improvements in more appropriate disciplinary practices and increased support of enrichment
opportunities for their children.
10 Statistically significant improvement in alcohol and drug use, provision of development/enrichment opportunities,
and control over media access and content was consistent across grantees.
Table 4: Overall Parental Capabilities – Change in NCFAS Ratings from RPG Program
Admission to Discharge, Percentage of Parents by Rating Category (N=587)
RPG Program
Admission
RPG Program
Discharge
Mild/Clear Strength 16.6% 49.7%
Baseline/Adequate 35.4% 32.9%
Mild/Moderate/Serious Problem 47.9% 17.5%
Notes: Data represent the subset of 10 grantees reporting these NCFAS data.
Table 5: Percentage of Parents for Whom Selected NCFAS Parental Capabilities Areas
were Rated as a Mild/Clear Strength at RPG Program Admission and Discharge
RPG Program
Admission
RPG Program
Discharge
Controls Access to Media (N=108) 20.4% 25.9%
Development/Enrichment Opportunities (N=528)* 24.6% 47.4%
Disciplinary Practices (N=531)* 22.6% 48.0%
Parent’s Literacy (N=158) 27.9% 36.1%
Promotes Education (N=125) 28.0% 36.8%
Supervision of Children (N=537)* 26.3% 57.7%
Use of Drug/Alcohol (N=566)* 14.2% 47.2%
* p<.001 for all items
Notes: Data represent the subset of eight to 10 grantees reporting these NCFAS data; not all grantees report on all
individual items.

Page | 14
RECOVERY – SELECTED INTERIM INDICATOR FINDINGS
Among the 9,180 RPG adults receiving substance abuse treatment through September 30,
2011,11,12 23.9 percent were participating in substance abuse treatment prior to entering the RPG
program, while 76.1 percent were admitted the same day as or after RPG program entry.
Overall, for RPG adults who were not already in substance abuse treatment at the time of RPG
program enrollment, the time to treatment from RPG program entry was 11 days; however, 38.7
percent accessed treatment within three days. Time to substance abuse treatment entry from
child welfare file open date was 32 days, while time to treatment from the substance abuse
assessment date was zero days (i.e., same day access to treatment).13 Time to treatment
fluctuated somewhat over the course of the RPG Program, but appears to have improved in
program year four. The median number of days to treatment was 10 in program year one, 12 in
program year two, 12 in program year three and 8 in program year four (see Figure 10).
11 Given the diversity in RPG program models, time to treatment is measured from three different time points: 1)
when the family enters the RPG program, 2) when the family enters the child welfare system, and 3) when a client
receives a substance abuse assessment.
12 This represents 71.0 percent of all adults served by grantees. Not all RPG adults require substance abuse
treatment. For example, there may be family members of the primary caregiver(s) in substance abuse treatment;
these adults may not need treatment, but do receive other RPG services.
13 Time to treatment is measured from these three different time points given the diversity in grantees’ program
models and variability in their client referral and engagement processes.
10
12 12
8
0
2
4
6
8
10
12
14
RPG Year 1 (N=1,294) RPG Year 2 (N=2,285) RPG Year 3 (N=2,046) RPG Year 4 (N=1,310)
Day
s
Figure 10: Median Days to Substance Abuse Treatment from RPG Entry, by RPG Program Year
Access to Substance Abuse Treatment
Percentage of parents or caregivers who were able to access timely and appropriate substance
abuse treatment; number of days between program entry and treatment entry
Page | 15
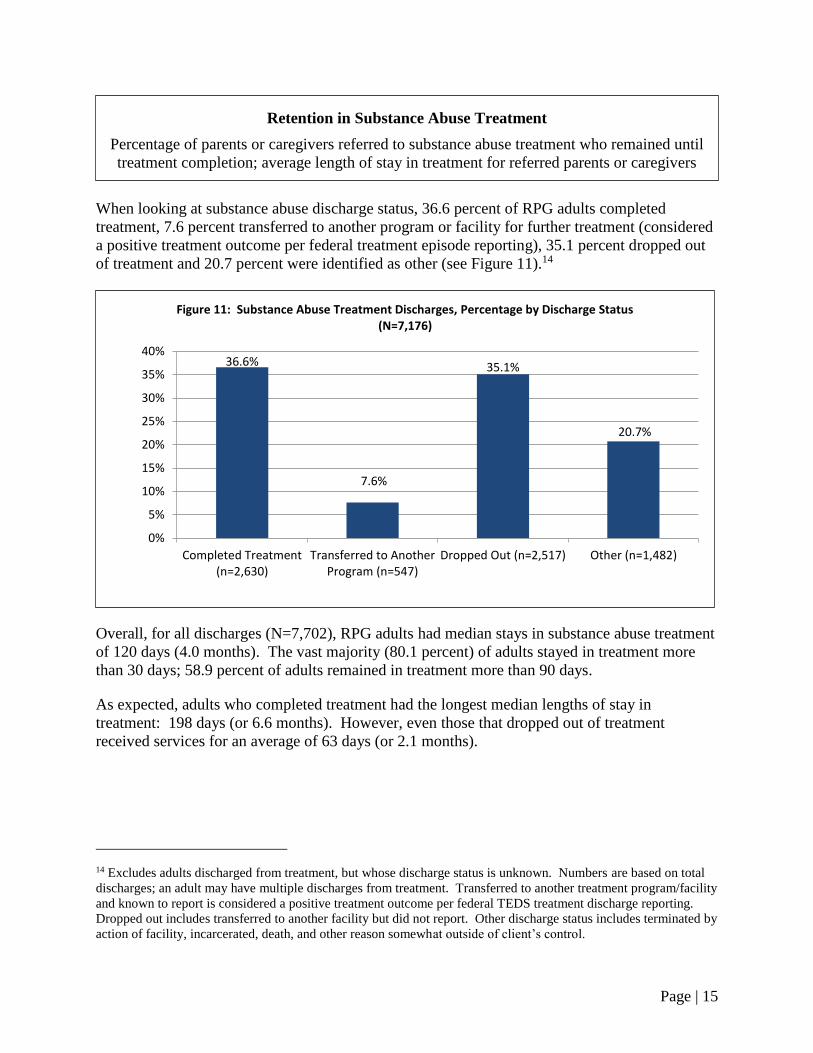
When looking at substance abuse discharge status, 36.6 percent of RPG adults completed
treatment, 7.6 percent transferred to another program or facility for further treatment (considered
a positive treatment outcome per federal treatment episode reporting), 35.1 percent dropped out
of treatment and 20.7 percent were identified as other (see Figure 11).14
Overall, for all discharges (N=7,702), RPG adults had median stays in substance abuse treatment
of 120 days (4.0 months). The vast majority (80.1 percent) of adults stayed in treatment more
than 30 days; 58.9 percent of adults remained in treatment more than 90 days.
As expected, adults who completed treatment had the longest median lengths of stay in
treatment: 198 days (or 6.6 months). However, even those that dropped out of treatment
received services for an average of 63 days (or 2.1 months).
14 Excludes adults discharged from treatment, but whose discharge status is unknown. Numbers are based on total
discharges; an adult may have multiple discharges from treatment. Transferred to another treatment program/facility
and known to report is considered a positive treatment outcome per federal TEDS treatment discharge reporting.
Dropped out includes transferred to another facility but did not report. Other discharge status includes terminated by
action of facility, incarcerated, death, and other reason somewhat outside of client’s control.
36.6%
7.6%
35.1%
20.7%
0%
5%
10%
15%
20%
25%
30%
35%
40%
Completed Treatment(n=2,630)
Transferred to AnotherProgram (n=547)
Dropped Out (n=2,517) Other (n=1,482)
Figure 11: Substance Abuse Treatment Discharges, Percentage by Discharge Status (N=7,176)
Retention in Substance Abuse Treatment
Percentage of parents or caregivers referred to substance abuse treatment who remained until
treatment completion; average length of stay in treatment for referred parents or caregivers

Page | 16
The percentage of RPG adults with reductions in use was between 71.8 and 82.0 percent,
depending on the substance. Among RPG adults who reported any substance use in the past 30
days at treatment admission, those who used cocaine reported the greatest reduction in mean
days of use (82.0 percent), followed by those using methamphetamine (79.8 percent), marijuana
(79.0 percent), and alcohol (77.1 percent). Reduction in use rates among RPG adults using
heroin/other opiates was 71.8 percent (see Figure 12).
The percentage of RPG participants reporting abstinence from alcohol use at treatment admission
(61.4 percent) and at treatment discharge (87.3 percent) was slightly higher than the latest NOMs
data for the RPG states (58.3 percent and 80.3 percent, respectively). RPG participants also
showed a greater percentage increase in the number abstinent for alcohol from admission to
discharge (42.2 percent), compared to the 29-state subgroup (34.7 percent).
The percentage of RPG participants reporting abstinence from drug use at treatment admission
was slightly lower than that of the RPG States’ NOMs data (41.2 percent versus 51.7 percent).
However, at treatment discharge, the percentage of RPG participants who were abstinent was
higher than the Statewide NOMs (85.0 percent versus 74.6 percent).
71.8%
77.1%
79.0%
79.8%
82.0%
0% 20% 40% 60% 80% 100%
Heroin/Other Opiates (N=341)
Alcohol (N=1,261)
Marijuana (N=1,013)
Methamphetamine (N=667)
Cocaine/crack (N=412)
Figure 12: Percentage of Adults Reporting Reduction in Use from Treatment Admission to Discharge, by Type of Substance*
*Among adults who reported any use at treatment admission.
Reduced Substance Use
Percentage of parents or caregivers who report a reduction in substance use, as measured by
number of days of use in past 30 days at treatment intake and discharge

Page | 17
BRIEF DEMOGRAPHIC PROFILE OF CLIENTS RECEIVING RPG SERVICES
Over the course of the initial five year grant period (through September 30, 2012), the 53
regional partnerships served 15,031 families including 25,541 children and 17,820 adults. The
average number of RPG participant families served per grantee was 284, ranging from a low of
62 to a high of 1,886, reflecting the diversity of the grantee program models, target populations,
and geographic regions being served. More than three-fourths (83.9 percent) of families have
been discharged from the RPG program at the end of the grant period. On average, families who
had been discharged received RPG services for 8.2 months.
Children enrolled in the RPG program were predominantly White (49.9 percent), followed by
Hispanic (20.3 percent) and Black (14.9 percent); nine percent were Native American. The
greatest proportion of children was one to three years of age (26.2 percent). Overall, children
between zero and five years of age comprised 59.8 percent and school age children (six years
and older) comprised 40.2 percent of the RPG child population (see Table 6).15
Table 6: Selected Demographics of RPG Participant Children*
Number Percent
Total Children 25,541 100%
Gender 23,758 100%
Boys 12,125 51.0%
Girls 11,633 49.0%
Age 23,967 100%
Under 1 Year 4,912 20.5%
1-3 Years 6,271 26.2%
4-5 Years 3,148 13.1%
6-8 Years 3,580 14.9%
9-12 Years 3,324 13.9%
13 and Older 2,732 11.4%
Mean Age (years) 5.7 (5.0)
Race/Ethnicity 22,469 100%
White 11,204 49.9%
Hispanic (of any race) 4,555 20.3%
Black 3,341 14.9%
Alaska Native/ American Indian 2,022 9.0%
Two or more races 1,097 4.9%
Asian/Native Hawaiian/Other Pacific Islander 250 1.1%
15 Percentage calculations for child demographics exclude cases with missing information.

Page | 18
Adults in the RPG program were also predominantly White (58.2 percent); nearly half
(48.6percent) were under 30 years of age. Women comprised 72.2 percent of the total adult RPG
population, the majority of whom were the biological mother and a primary caregiver of the
children involved in the RPG program. Methamphetamine was the primary substance at
admission for nearly one-third of all RPG adults in substance abuse treatment (see Table 7).16
Table 7: Selected Demographics of RPG Participant Adults*
Number Percent
Total Adults 17,820 100%
Gender 17,601 100%
Female 12,716 72.2%
Male 4,885 27.8%
Age 17,388 100%
Under 21 years 877 5.0%
21 to 24 years 2,985 17.2%
25 to 29 years 4,598 26.4%
30 to 34 years 3,705 21.3%
35 to 39 years 2,396 13.8%
40 to 44 years 1,431 8.2%
45 years and older 1,396 8.0%
Mean Age - Years (SD) 31.4 (8.5)
Race/Ethnicity 16,719 100%
White 9,723 58.2%
Hispanic (of any race) 2,628 15.7%
Black 1,957 11.7%
Alaska Native/ American Indian 1,901 11.4%
Two or more races 329 2.0%
Asian/Native Hawaiian/Other Pacific Islander 181 1.1%
Relationship to Child 11,219 100%
Biological Mother 8,519 75.9%
Biological Father 1,807 16.1%
Other 893 8.0%
Primary Substance at Treatment Admission 10,004 100%
Methamphetamine 3,150 31.5%
Marijuana 1,970 19.7%
Alcohol 1,913 19.1%
16 Percentage calculations for adult demographics exclude cases with missing information.

Page | 19
Table 7: Selected Demographics of RPG Participant Adults*
Number Percent
Primary Substance at Treatment Admission
Heroin/Opiates 1,687 16.9%
Crack/Cocaine 956 9.6%
Other 328 3.3%
Caveats and Limitations in Interpreting the Data
These data provided an unprecedented opportunity to assess the impact of the RPG programs
on child welfare and substance abuse outcomes. Yet several important caveats must be
considered in reviewing data that represent 53 partnerships with different program models
and diverse target populations:
The RPG Program Performance Measurement is not designed as a cross-site evaluation. The
RPG findings presented in this report represent 53 grantees that have the same overarching
project goals (to improve child, adult, and family outcomes), but are not implementing or
testing the same set of services, interventions, or program models.
Grantees implemented different methodologies for obtaining control or comparison group
data, if applicable to their project. Grantees were not specifically required to include a control
or comparison group in their local evaluation design. Grantees collecting control or
comparison group data had the discretion to identify and select what they deemed an
appropriate control or comparison group.
The results presented in this brief are interim findings. Because grantees uploaded an
updated, cumulative data file every six months, the results may change as the number of
children, adults, and families served increases. Definitive conclusions should not be drawn
from these interim results.
Contextual and community factors may impact grantees’ outcomes. The 53 regional
partnerships operated within broader communities and systems of care. As such, the
partnerships, programs, and families served were impacted by local conditions including the
service array available in different communities and the current economic environment. State
and county budget constraints and recent reductions impacted the grantees in important ways.
National child welfare and substance abuse treatment outcomes provide important contextual
perspective, but may reflect a broader child and adult population than the RPG families.
Families served by the RPG programs likely represented more difficult or complex cases
(e.g., significant co-occurring disorders, including trauma and violence). Further, the state
contextual data are not intended to serve as a comparison group for the RPG Program and do
not allow for statistical comparisons to RPG participants, as these data do not reflect random
assignment or matched characteristics of RPG participants.

Page | 20
For More Information about the RPG Program
The RPG Program Briefs provide summary snapshots of selected aspects of the RPG
Program. For more extensive information, please refer to the Reports to Congress (which
are mandated by the authorizing legislation). The Reports are available at
http://www.cffutures.org/projects/regional-partnership-grants.