Regional Outlooks Kitchener Waterloo Barrie … Ontario Economic Update: Kitchener - Waterloo -...
18
2016 Ontario Economic Update: Kitchener - Waterloo - Barrie Economic Region | 1 The Kitchener-Waterloo-Barrie Economic Region is a large region containing about 10 percent of the province’s population, anchored in the southern half by the Kitchener- Cambridge-Waterloo Census Metropolitan Area (CMA) and the Guelph CMA. In the northern part, the Barrie CMA is the principal centre among the neighbouring census agglomerations of Orillia, Midland, and Collingwood. The manufacturing and education industries stand out as the region’s most important export sectors, especially in its southern economies. Manufacturing plays a smaller but important export role in the northern economies, though education plays a lesser role than in the south. Economic growth in the Kitchener- Waterloo-Barrie region so far in 2015 has been mixed and moderate overall. Employment and labour force growth has slowed, though housing market activity and residential construction have picked up. Investment in non- residential building construction is up, while non-residential building permits, a leading indicator of investment, has declined. Population growth has slowed slightly. Employment was up about one percent in the region through October and the unemployment rate averaged 5.5 percent, down slightly from last year. The labour market was stronger than indicated by the headline number with full-time employment up nearly two percent and part-time employment down. There is a considerable divergence in employment performance by CMA in the region. The Guelph CMA has seen a 10 percent jump so far in 2015, while employment dipped 1.1 percent in the Kitchener-Cambridge-Waterloo CMA and declined 2.5 percent in the Barrie CMA. Large swings in the Labour Force Survey (LFS) results for smaller geographic areas raise a cautionary flag that sample variability may account for the change, rather than underlying trends or forces. Regional job growth in 2015 has been led by education, health, accommodation and food services, as well as construction. Gains in these industries have been largely offset by declines in information, culture, recreation, professional and technical services, business and building support, public administration, retail and wholesale trade services, as well as agriculture. Manufacturing in the region has fared well in comparison to other regions and to the province as a whole. While manufacturing employment is lower in the past 10 years, the contraction is not as deep as in other regions. Further Economic growth has been mixed and moderate overall. Unemployment will slide to 5.1 percent in 2017. Over time, the region’s manufacturing sector will benefit from a lower Canadian dollar and faster U.S. economic growth. 1 2 3 Presented by the Credit Unions of Ontario and the Ontario Chamber of Commerce KITCHENER-WATERLOO-BARRIE ECONOMIC REGION
Transcript of Regional Outlooks Kitchener Waterloo Barrie … Ontario Economic Update: Kitchener - Waterloo -...
2016 Ontario Economic Update: Kitchener - Waterloo - Barrie Economic Region | 1
The Kitchener-Waterloo-Barrie
Economic Region is a large region
containing about 10 percent of the
province’s population, anchored in
the southern half by the Kitchener-
Cambridge-Waterloo Census
Metropolitan Area (CMA) and the
Guelph CMA. In the northern part,
the Barrie CMA is the principal
centre among the neighbouring
census agglomerations of Orillia,
Midland, and Collingwood.
The manufacturing and education
industries stand out as the region’s
most important export sectors,
especially in its southern economies.
Manufacturing plays a smaller but
important export role in the northern
economies, though education plays
a lesser role than in the south.
Economic growth in the Kitchener-
Waterloo-Barrie region so far in 2015
has been mixed and moderate overall.
Employment and labour force growth
has slowed, though housing market
activity and residential construction
have picked up. Investment in non-
residential building construction is
up, while non-residential building
permits, a leading indicator of
investment, has declined. Population
growth has slowed slightly.
Employment was up about one
percent in the region through
October and the unemployment rate
averaged 5.5 percent, down slightly
from last year. The labour market
was stronger than indicated by
the headline number with full-time
employment up nearly two percent
and part-time employment down.
There is a considerable divergence in
employment performance by CMA
in the region. The Guelph CMA has
seen a 10 percent jump so far in 2015,
while employment dipped 1.1 percent
in the Kitchener-Cambridge-Waterloo
CMA and declined 2.5 percent in
the Barrie CMA. Large swings in the
Labour Force Survey (LFS) results
for smaller geographic areas raise a
cautionary flag that sample variability
may account for the change, rather
than underlying trends or forces.
Regional job growth in 2015 has
been led by education, health,
accommodation and food services,
as well as construction. Gains in
these industries have been largely
offset by declines in information,
culture, recreation, professional
and technical services, business
and building support, public
administration, retail and wholesale
trade services, as well as agriculture.
Manufacturing in the region has
fared well in comparison to other
regions and to the province as
a whole. While manufacturing
employment is lower in the past
10 years, the contraction is not as
deep as in other regions. Further
Economic growth has been mixed and moderate overall.
Unemployment will slide to 5.1 percent in 2017.
Over time, the region’s manufacturing sector will benefit from a lower Canadian dollar and faster U.S. economic growth.
1
2
3
Presented by the Credit Unions of Ontario and the Ontario Chamber of Commerce
KITCHENER-WATERLOO-BARRIEECONOMIC REGION
2016 Ontario Economic Update: Kitchener - Waterloo - Barrie Economic Region | 2
consolidation and restructuring will continue but
likely at a lesser pace and gains are more likely now
that external factors such as the lower Canadian
dollar are providing competitive support.
Some manufacturing companies continue to invest
in production capacity and add jobs, often with
financial support from governments. Examples
include Wolf Steel and Streit Manufacturing in
Barrie, Huawei Technologies and DC Foods in
Waterloo, Linamar Corporation and NSF Canada
in Guelph, Heroux-Devtek in Cambridge, Toyota
Boshoku Canada in Elmira and Howa Textile Industry
in Alliston. However, General Mills announced the
closure of its Midland food manufacturing plant in
mid-2016, affecting approximately 100 employees.
Also, Owens Corning will be cutting more than
100 jobs at its fibreglass plant in Guelph by 2016
when it shifts some production to Mexico.
The technology sector in the Kitchener-Cambridge-
Waterloo CMA has faced some set-backs in 2015.
BlackBerry reduced smartphone operations and
announced two rounds of world-wide staff layoffs.
Open Text Corporation announced a five percent
cut in its global workforce to streamline operations.
Some mitigation will come from Communitech
Corporation, which plans to establish the Open Data
Exchange, creating 370 direct and indirect jobs.
Over time, the region’s manufacturing sector
will experience improved profits and market
share as a result of the lower Canadian
dollar and faster U.S. economic growth.
The region’s economic outlook through 2017 is for
trend growth in employment and a slightly lower
unemployment rate. Housing market activity will
continue to increase with ongoing growth in sales,
prices, and construction. Non-residential building
construction will remain near current levels in the
near term and turn higher in 2017. Population
growth will remain near one percent annually.
Job growth in the region is forecast at 1.1 percent in
2016 and 1.3 percent in 2017, similar to the estimated
1.1 percent in 2015. Forecast job growth is led by
the services sectors such as health, education,
accommodation and food services. Construction
employment is also seen rising. The unemployment
rate will slide lower to 5.4 percent in 2016 and 5.1
percent in 2017, down from an estimated 5.4 percent
in 2015. Labour market trends in the Kitchener-
Cambridge-Waterloo CMA will track the region.
Housing market conditions have tightened
considerably in recent months causing accelerating
prices. Sales in the first 10 months of 2015 were
up almost 10 percent year-over-year, while new
listings were up less than one percent, pushing
the sales-to-new listings ratio to its highest in 10
years. The average sale price accelerated at an
eight percent annual rate in the third quarter, up
from three percent in the first quarter of 2015.
Indications point to further acceleration in the
near term until listings pick up, or sales cool off.
Housing market activity is seen increasing in each
of the next two years against the backdrop of low
mortgage rates and some improvement in economic
and income growth in 2016 and 2017. In the
Kitchener-Cambridge-Waterloo CMA, MLS housing
unit sales are forecast to rise 6.7 percent in 2016 and
5.2 percent in 2017 following estimated growth of
6.8 percent in 2015. The average MLS sale price is
forecast to rise 5.0 percent in 2016 and 4.7 percent
in 2017, following an estimated gain of less than
three percent in 2015. Higher housing market activity
is also forecast in the Guelph and Barrie CMAs.
Residential building permits are forecast to
increase through 2017 and follow rising housing
sales and prices. Permits surged in 2014 on a
jump in multi-unit buildings in the Kitchener-
Cambridge-Waterloo CMA and as a result
permits are tracking slightly lower in 2015.
Investment in non-residential building construction
in the region’s three CMAs was up almost 26 percent
through the third quarter of 2015 compared to
last year. The increase was mainly in institutional
and government projects such as the $187 million
expansion of Cambridge Memorial Hospital, as
well as industrial buildings, while commercial
building construction was down. Construction
was up in the Kitchener-Cambridge-Waterloo
and Barrie CMAs, but down in the Guelph CMA.
2016 Ontario Economic Update: Kitchener - Waterloo - Barrie Economic Region | 3
Non-residential building permits, an indicator of
near term investment spending, are down almost
11 percent on the same basis. Permit decline is
mainly in institutional and government buildings,
while industrial permits are up and commercial
permits are little changed. Non-residential building
permits are down in all three CMAs of the region.
Examples of non-residential building construction
are the City of Cambridge’s Creekside Corporate
Campus multi-use industrial park, Canadian Forces
Base Borden military housing and ammunition
transit facility, and Collingwood’s new École
élementaire catholique Notre-Dame-de-la-Huronie,
which is scheduled to open in September 2016. A
number of manufacturing companies in the region
are also investing in expanded premises. The
major engineering project in the region through
2017 is the Waterloo rapid transport system.
Non-residential building permits in the region
are forecast to remain near current levels in 2016
following an estimated decrease of 8.2 percent in
2015. Private investment will trend higher, while
public sector permits decline from 2014’s high. Non-
residential building and engineering construction
spending forecasts have upside potential due to the
new federal government’s infrastructure initiative.
Population in the region is forecast to grow
just under one percent per year through 2017,
on par with estimated growth of 0.8 percent
in 2015. Net in-migration, mostly from other
parts of Ontario, will account for more than half
of total growth. Lower net interprovincial out-
migration is expected and higher net international
migration. Forecast population growth rates
will be similar in all three CMAs in the region.
Read on to find out how the KITCHENER-
WATERLOO-BARRIE economic region stacks up
against the rest of Ontario >>>
2016 Ontario Economic Update: Kitchener - Waterloo - Barrie Economic Region | 4
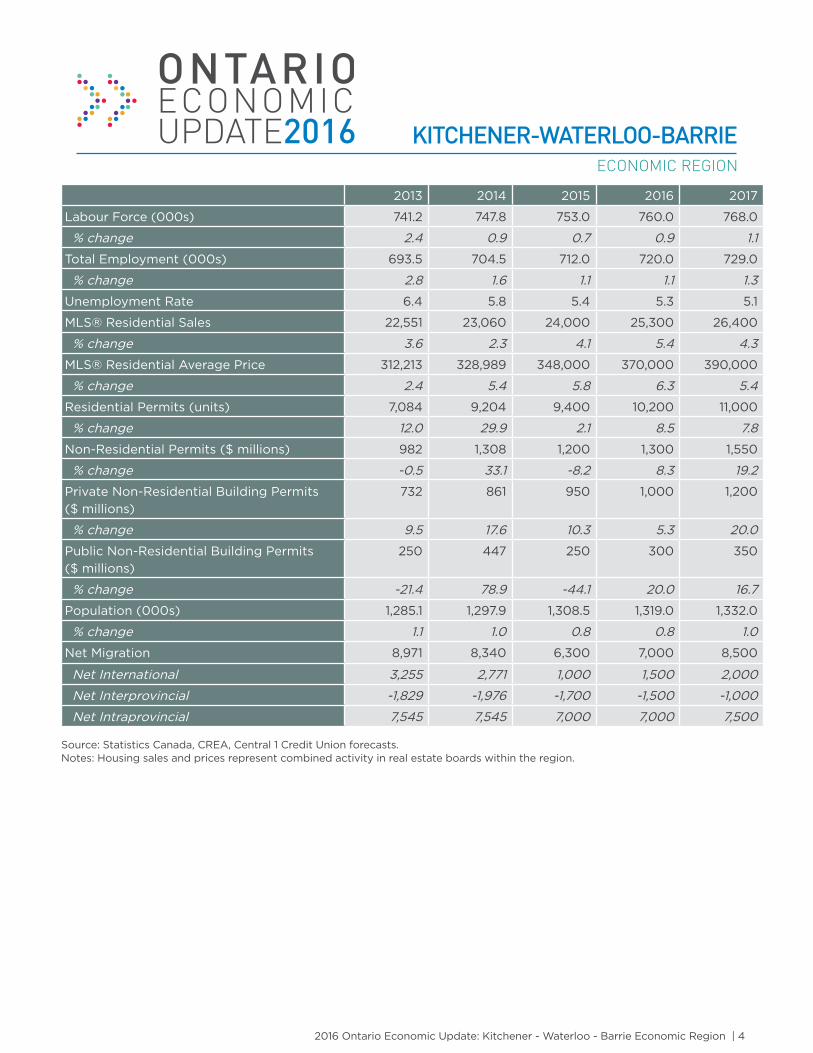
2013 2014 2015 2016 2017
Labour Force (000s) 741.2 747.8 753.0 760.0 768.0
% change 2.4 0.9 0.7 0.9 1.1
Total Employment (000s) 693.5 704.5 712.0 720.0 729.0
% change 2.8 1.6 1.1 1.1 1.3
Unemployment Rate 6.4 5.8 5.4 5.3 5.1
MLS® Residential Sales 22,551 23,060 24,000 25,300 26,400
% change 3.6 2.3 4.1 5.4 4.3
MLS® Residential Average Price 312,213 328,989 348,000 370,000 390,000
% change 2.4 5.4 5.8 6.3 5.4
Residential Permits (units) 7,084 9,204 9,400 10,200 11,000
% change 12.0 29.9 2.1 8.5 7.8
Non-Residential Permits ($ millions) 982 1,308 1,200 1,300 1,550
% change -0.5 33.1 -8.2 8.3 19.2
Private Non-Residential Building Permits
($ millions)
732 861 950 1,000 1,200
% change 9.5 17.6 10.3 5.3 20.0
Public Non-Residential Building Permits
($ millions)
250 447 250 300 350
% change -21.4 78.9 -44.1 20.0 16.7
Population (000s) 1,285.1 1,297.9 1,308.5 1,319.0 1,332.0
% change 1.1 1.0 0.8 0.8 1.0
Net Migration 8,971 8,340 6,300 7,000 8,500
Net International 3,255 2,771 1,000 1,500 2,000
Net Interprovincial -1,829 -1,976 -1,700 -1,500 -1,000
Net Intraprovincial 7,545 7,545 7,000 7,000 7,500
Source: Statistics Canada, CREA, Central 1 Credit Union forecasts. Notes: Housing sales and prices represent combined activity in real estate boards within the region.
KITCHENER-WATERLOO-BARRIEECONOMIC REGION
2016 Ontario Economic Update: Kitchener - Waterloo - Barrie Economic Region | 5
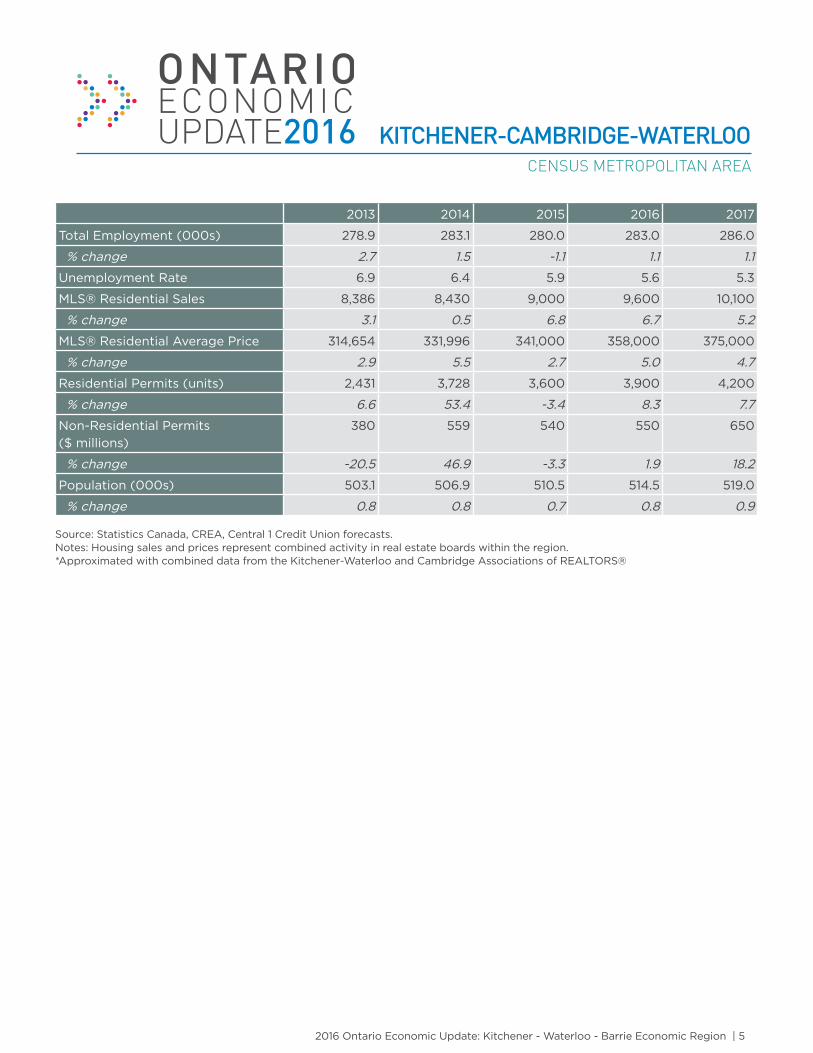
2013 2014 2015 2016 2017
Total Employment (000s) 278.9 283.1 280.0 283.0 286.0
% change 2.7 1.5 -1.1 1.1 1.1
Unemployment Rate 6.9 6.4 5.9 5.6 5.3
MLS® Residential Sales 8,386 8,430 9,000 9,600 10,100
% change 3.1 0.5 6.8 6.7 5.2
MLS® Residential Average Price 314,654 331,996 341,000 358,000 375,000
% change 2.9 5.5 2.7 5.0 4.7
Residential Permits (units) 2,431 3,728 3,600 3,900 4,200
% change 6.6 53.4 -3.4 8.3 7.7
Non-Residential Permits
($ millions)
380 559 540 550 650
% change -20.5 46.9 -3.3 1.9 18.2
Population (000s) 503.1 506.9 510.5 514.5 519.0
% change 0.8 0.8 0.7 0.8 0.9
Source: Statistics Canada, CREA, Central 1 Credit Union forecasts. Notes: Housing sales and prices represent combined activity in real estate boards within the region.*Approximated with combined data from the Kitchener-Waterloo and Cambridge Associations of REALTORS®
KITCHENER-CAMBRIDGE-WATERLOOCENSUS METROPOLITAN AREA
2016 Ontario Economic Update: Ontario | 1
Improving overall growth prospects
Regional growth differentials will narrow
Northern regions will lag due to poor mining prospects
1
2
3
Summary
Ontario’s economic performance
is not shared equally in all regions
in the province due to differences
in their economic makeup or base.
External macro factors play an
important role not only in Ontario’s
economic performance but also
in each region to varying degrees.
Economic prospects for Ontario
are improving aided by positive
externals such as a low dollar, faster
U.S. growth, and low interest rates.
Regional growth performances
during 2015 were led by the Toronto
and Hamilton-Niagara regions, with
the Kitchener-Waterloo-Barrie and
London regions close behind. At the
other end of the growth spectrum
were the northern regions and to
a lesser extent Windsor-Sarnia
and Stratford-Bruce. A narrowing
of growth differentials amongst
regions was evident, though small,
and made more apparent by the
large discrepancy that materialized
following the 2008-09 recession.
Further convergence in regional
growth performances is expected
during the next two years with
some of the laggards closing the
gap rather than the leaders surging
further ahead. Exceptions are the
northern regions, which are heavily
dependent on mining and resources
but face a weak outlook for metal
markets, where growth will remain
low and possibly negative.
All regions will see more housing
activity, in varying degrees,
depending on local economic and
market conditions. Some previously
slower regional markets such
as London and Windsor-Sarnia
are poised to have substantial
gains. Toronto and Hamilton-
Niagara markets will generate
the largest price increases.
Projected population growth in 2016
and 2017 gradually edges higher in
most regions, except in the north.
Low growth will continue to prevail
in the Kingston-Pembroke, Stratford-
Bruce, and Windsor-Sarnia regions.
A notable pickup is forecast for
the Muskoka-Kawarthas region.
rEPOrT FramEWOrK
The regional areas in this report
follow Statistics Canada’s 11 Economic
Region boundaries for Ontario. The
main metropolitan area in each
region is covered. The principal
economic indicators used to track
regional economic performance are
employment, unemployment, housing
sales, housing prices, residential and
non-residential building permits,
ONTARIO
2016 Ontario Economic Update: Ontario | 2
and population. Other data sets, such as housing
starts and non-residential building construction
investment spending, are referred to in the text,
but no data is presented in tables. Gross Domestic
Product (GDP) data are not available by region.
The labour market is a key indicator of regional
performance and Statistics Canada’s Labour
Force Survey (LFS) is the main source of this
information. Regional LFS data has issues with
sample errors making it difficult to separate
underlying movements from sample noise, which is
more problematic in smaller regions. Employment
Insurance (EI) data is helpful to verify labour
market changes, but it too has limitations.
rECENT PErFOrmaNCE VarIED
The province’s variable, but overall, moderate growth
performance so far in 2015 has been mirrored in
most regions. Provincial real GDP growth in the
first quarter was minimal followed by a modest
rebound the second quarter and very likely a
stronger performance in the third quarter. Fourth
quarter real GDP growth will probably ease.
Ontario’s employment profile generally tracked
real GDP with a dip in the first quarter of 2015 and
faster growth thereafter. Regionally, employment
turned up during 2015 in Toronto, Hamilton-Niagara,
and London, but declined in the Ottawa, Kingston-
Pembroke, Muskoka-Kawarthas, Windsor-Sarnia,
Stratford-Bruce, Northeast, and Northwest regions
and as a result they will have lower employment
for the year than in 2014. Kitchener-Waterloo-
Barrie region employment was little changed.
In more than one instance, the 2015 LFS results
were at odds with EI data, or with recent trends,
and were interpreted as sample variability rather
than a fundamental change in the labour market.
The regions in question were Kingston-Pembroke,
Muskoka-Kawarthas and Stratford-Bruce for
doubtful downside shifts and London’s sharp
increase was a questionable upside move.
Unemployment rates in most regions will close
out the year lower than in 2014. The exceptions
are the Muskoka-Kawarthas, Windsor-Sarnia,
Stratford-Bruce and the Northeast. EI data did not
corroborate the unemployment rate jump in the
Muskoka-Kawarthas and Stratford-Bruce regions,
leaving LFS sample variability as the likely cause.
While there was some divergence in regional
labour market performance in 2015, this was not
the situation in the housing market. All regional
housing markets expanded with more sales, higher
prices (except for the Northeast), and more new
construction. The degree of market expansion varied
with larger gains in the central and southwest regions
and smaller gains in the eastern and northern regions.
Non-residential construction was less robust than
residential construction in most regions. The Toronto
region will post a 17 percent rise in 2015 mainly due
to a 53 percent jump in public permits, with private
permits, industrial and commercial buildings up
eight percent. The London and Northwest regions
will also have double-digit gains this year, led by
public permits as well. Regions with less activity
this year, such as Ottawa and Kingston-Pembroke,
are coming off a public permit surge in 2014.
The latest regional population data is as of
July 1, 2014. Statistics Canada’s 2015 estimates
will be released in 2016. At the provincial level,
population growth slowed in the year ending
June 30, 2015 to less than one percent on
fewer immigrants and net non-permanent
residents. Net interprovincial migration remained
negative, though the outflow slowed.
ImPrOVING OuTLOOK
The performance of Ontario’s regional economies
depends on external and domestic factors as
well as on a region’s industry and demographic
composition. Several regions in Ontario are quite
dependent on external export-driven factors. The
northern regions with their considerable dependence
on forestry, mining, and metal products are at
one end of this spectrum, while Ottawa and the
Muskoka-Kawarthas regions are more domestically
driven and less exposed to export markets.
The external environment for Ontario will turn
more positive during the next two years due to a
better performance in its largest export market,
the U.S., a low Canadian dollar, low interest
2016 Ontario Economic Update: Ontario| 3
rates, and low oil prices. Working against these
positives will be low metal prices, geopolitical
events, and potential disruptions in financial
markets emanating from emerging markets. Global
economic growth will remain modest and below
potential, mainly due to the slowdown in China.
Exports play a key role in Ontario’s economic
performance and while international goods and
services exports have better prospects ahead,
interprovincial exports will be constrained
by the negative fallout from the poor oil and
natural gas markets that is affecting energy
producing provinces such as Alberta.
On the domestic front, government fiscal
policy will be more stimulative with time as the
impact of more infrastructure spending will
be felt to a greater degree. Private investment
spending is set to build momentum, while
residential investment spending will remain at
a robust pace with some slowing into 2017.
Ontario’s real GDP growth is forecast at 2.6
percent in 2016 and 3.0 percent in 2017, following
an estimated 2.5 percent expansion in 2015.
Statistics Canada’s preliminary 2014 estimate is
2.7 percent. Ontario’s economy has upshifted
from its slow growth phase of 2012 and 2013
to moderate growth and, if the forecast proves
accurate, will shift to a more robust phase in 2017.
Economic performance across Ontario’s regions
during the next two years will continue on recent
trends, resulting in a greater divergence between
some regions. The northern regions will post slight
growth, while the central and southwestern regional
economies will be the province’s main growth
drivers. In the absence of GDP data for the regions,
employment is the best single available economic
indicator of a region’s overall performance.
Growth in most regions will increase over 2015
and continue their cyclical expansion from the
last recession. The Toronto and Hamilton-Niagara
regions also are expected to perform above
the provincial growth rate, while the Kitchener-
Waterloo-Barrie and Ottawa regions look to perform
similar to Ontario’s pace, which is estimated at
1.5 percent in 2016 and 1.4 percent in 2017.
The London region, which was hard hit by the
recession and restructuring of its manufacturing
base, will continue to regain lost economic output
and post growth above the provincial average in 2016
and 2017. In the last year of the forecast, employment
will be above the 2007 pre-recession high.
Another manufacturing region hard hit by the
recession was Windsor-Sarnia and employment has
slowly advanced from its recession low. Forecast
employment growth will be close to but below
the provincial average and in 2017 employment
will be at its highest level since the recession,
but still well below the pre-recession high.
The three remaining regions – Kingston-Pembroke,
Muskoka-Kawarthas, and Stratford-Bruce – are
expected to grow in line with the recent modest
trend growth. For example, 2017 employment in
these regions is forecast at levels comparable to
or slightly higher than those that existed five years
ago. In contrast, employment in Toronto, Kitchener-
Waterloo-Barrie, and Hamilton-Niagara will be six to
nine percent higher, with Toronto leading this group.
All but one region is expected to see lower
unemployment rates in 2016 and 2017 compared
to this year. The exception is Kingston-Pembroke
but this is due more to LFS sample issues than to
underlying performance. Ontario’s unemployment
rate at 6.6 percent and 6.3 percent in 2016 and 2017,
respectively, would be the lowest since the recession.
The lowest regional unemployment rate will be in
Kitchener-Waterloo-Barrie, followed by London and
Windsor-Sarnia. The Stratford-Bruce and Northwest
regions will also have low unemployment rates due
to low population growth and lack of employment
opportunities. The highest unemployment rate will
prevail in Windsor-Sarnia at 8.0 percent in 2017.
Regional housing markets will continue on their
expansion phase during the next two years. The
low interest rate environment is a strong stimulus
to all regional housing markets. No recession in
Ontario’s housing market is foreseen until the next
global economic recession and regional markets
will expand reflecting their own local economic
circumstances. Housing markets in stronger
economies and with higher population growth
outperform those with weaker demand conditions.
2016 Ontario Economic Update: Ontario | 4
MLS® residential sales growth is predicted
to be most robust and above the provincial
averages during the next two years in the
Windsor-Sarnia and London regions. These two
regions will post the fastest sales growth in 2015
and this momentum carries into the forecast,
which is supported by improved economic
performance and the release of pent-up demand
following the lean post-recession years.
Another more active regional market is Muskoka-
Kawarthas. Residential sales are predicted well
above provincial sales growth rate at 9.1 percent in
2016 and 6.7 percent in 2017. In this region, labour
market performance is less of a housing driver than
the influx of retiree migrants from other parts of the
province, notably Toronto, in addition to low interest
rates. Robust market conditions in Toronto and
other regions facilitate and encourage migration.
Less active markets look to be in the northern
regions and in Stratford-Bruce, while the remaining
regions will perform around the provincial sales
pace. The Toronto and Hamilton-Niagara markets
have outperformed in recent years and are seen
expanding at a slower but still substantial pace.
As for price performance, Toronto and Hamilton-
Niagara will still lead all regions and outpace
provincial increases. The MLS® residential average
sale price will climb in every region during the
next two years with the slowest increases in
those regions with the lowest sales gains.
Residential construction, as captured by building
permits, tracks housing market conditions
and most regions will see higher levels during
the next two years. Residential construction
can be a significant local economic driver.
Non-residential building permits will rise in this
forecast with 2017 considerably more active
than 2016. Private non-residential building
permits will outperform public permits mainly
because of higher 2015 levels and the ‘lumpy’
nature of large building projects. Investment on
commercial and industrial buildings has been
below trend since the recession and the predicted
pickup in non-residential private permits will
be in response to improved market conditions.
Public permits are expected to receive a boost in
2017 when increased government infrastructure
spending translates into project development.
Ontario’s population growth will edge higher due
to more immigration and a lower net outflow
to other provinces during the next two years.
Toronto will continue as the main destination
for immigrants and will lead the regional growth
rankings. Near-zero growth rates will extend in
the two northern regions, Kingston-Pembroke,
Windsor-Sarnia, and Stratford-Bruce.
There are substantial differences in economic
performance within some regions. The main
metropolitan area in the region, which is the service,
distribution, and administrative centre, can have a
different economic structure than in the rest of the
region. This is evident in several regions, notably
in the Kingston-Pembroke region wherein the
economy of the Kingston Census Metropolitan Area
(CMA) bears little resemblance to the economic
base in the rest of the region. Other examples are
the Ottawa, Peterborough, and Thunder Bay CMAs,
which are distinct from the rest of their regions.
2016 Ontario Economic Update: Ontario | 5
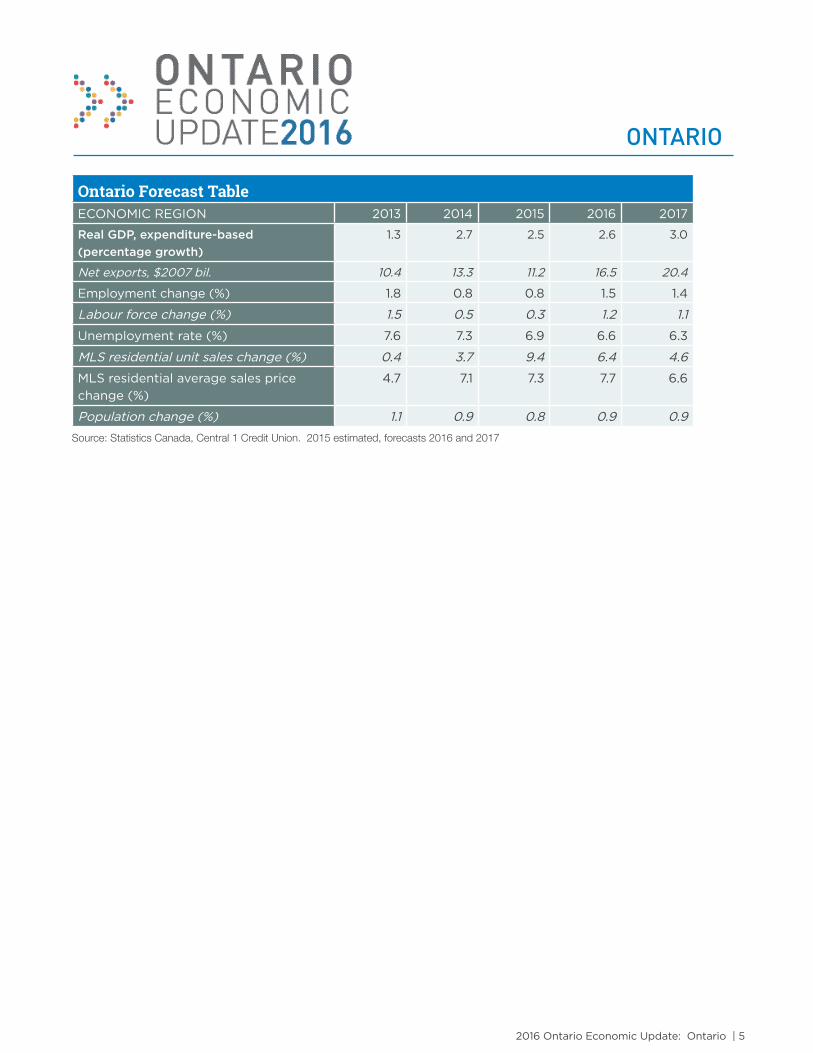
Ontario Forecast Table ECONOMIC REGION 2013 2014 2015 2016 2017
Real GDP, expenditure-based
(percentage growth)
1.3 2.7 2.5 2.6 3.0
Net exports, $2007 bil. 10.4 13.3 11.2 16.5 20.4
Employment change (%) 1.8 0.8 0.8 1.5 1.4
Labour force change (%) 1.5 0.5 0.3 1.2 1.1
Unemployment rate (%) 7.6 7.3 6.9 6.6 6.3
MLS residential unit sales change (%) 0.4 3.7 9.4 6.4 4.6
MLS residential average sales price
change (%)
4.7 7.1 7.3 7.7 6.6
Population change (%) 1.1 0.9 0.8 0.9 0.9
Source: Statistics Canada, Central 1 Credit Union. 2015 estimated, forecasts 2016 and 2017
ONTARIO

2016 Ontario Economic Update: Ontario | 6
Employment (000s), Regional SummaryECONOMIC REGION 2013 2014 2015 2016 2017
Ottawa 684.5 697.8 688.5 696.0 708.0
% change -1.5 1.9 -1.3 1.1 1.7
Kingston-Pembroke 213.9 210.1 203.0 207.0 211.0
% change 0.1 -1.8 -3.4 2.0 1.9
Muskoka-Kawarthas 168.5 186.3 168.6 174.0 176.0
% change -1.5 10.6 -9.5 3.2 1.1
Toronto 3,240.2 3,241.1 3,320.0 3,375.0 3,425.0
% change 4.1 0.0 2.4 1.7 1.5
Kitchener-Waterloo-Barrie 693.5 704.5 712.0 720.0 729.0
% change 2.8 1.6 1.1 1.1 1.3
Hamilton-Niagara Peninsula 697.5 706.4 722.0 734.0 744.0
% change -1.2 1.3 2.2 1.7 1.4
London 323.7 324.8 332.0 335.0 339.0
% change 0.3 0.3 2.2 0.9 1.2
Windsor-Sarnia 295.1 299.1 293.0 297.0 300.0
% change -0.8 1.4 -2.0 1.4 1.0
Stratford-Bruce Peninsula 150.6 151.1 144.5 147.0 149.5
% change -1.4 0.3 -4.4 1.7 1.7
Northeast 253.7 256.8 250.5 251.5 252.5
% change -0.6 1.2 -2.5 0.4 0.4
Northwest 102.2 99.8 97.3 97.1 97.3
% change 0.2 -2.3 -2.5 -0.2 0.2
Ontario 6,823.4 6,877.8 6,931.4 7,033.6 7,131.3
% change 1.8 0.8 0.8 1.5 1.4
Source: Statistics Canada, Central 1 Credit Union. 2015 estimated, forecasts 2016 and 2017
ONTARIO

2016 Ontario Economic Update: Ontario | 7
Labour Force (000s), Regional Summary ECONOMIC REGION 2013 2014 2015 2016 2017
Ottawa 731.7 746.9 736.0 743.0 752.0
% change -1.5 2.1 -1.5 1.0 1.2
Kingston-Pembroke 230.2 229.3 218.0 223.0 228.0
% change 0.0 -0.4 -4.9 2.3 2.2
Muskoka-Kawarthas 182.9 198.8 182.9 189.0 190.0
% change -1.2 8.7 -8.0 3.3 0.5
Toronto 3,528.8 3,524.7 3,580.0 3,625.0 3,670.0
% change 3.4 -0.1 1.6 1.3 1.2
Kitchener-Waterloo-Barrie 741.2 747.8 753.0 760.0 768.0
% change 2.6 0.9 0.7 0.9 1.1
Hamilton-Niagara Peninsula 751.2 755.9 770.0 779.0 786.0
% change -1.3 0.6 1.9 1.2 0.9
London 351.3 349.3 354.0 355.6 358.0
% change 0.1 -0.6 1.3 0.5 0.7
Windsor-Sarnia 322.2 325.3 320.6 323.4 326.2
% change -1.6 1.0 -1.4 0.9 0.9
Stratford-Bruce Peninsula 159.8 158.7 153.5 156.0 158.0
% change -0.4 -0.7 -3.3 1.6 1.3
Northeast 274.3 275.8 272.0 272.5 273.0
% change -0.5 0.5 -1.4 0.2 0.2
Northwest 110.2 106.2 103.5 103.1 102.9
% change 0.6 -3.6 -2.5 -0.4 -0.2
Ontario 7,383.8 7,418.7 7,443.5 7,529.6 7,612.1
% change 1.5 0.5 0.3 1.2 1.1
Source: Statistics Canada, Central 1 Credit Union. 2015 estimated, forecasts 2016 and 2017
ONTARIO
2016 Ontario Economic Update: Ontario | 8
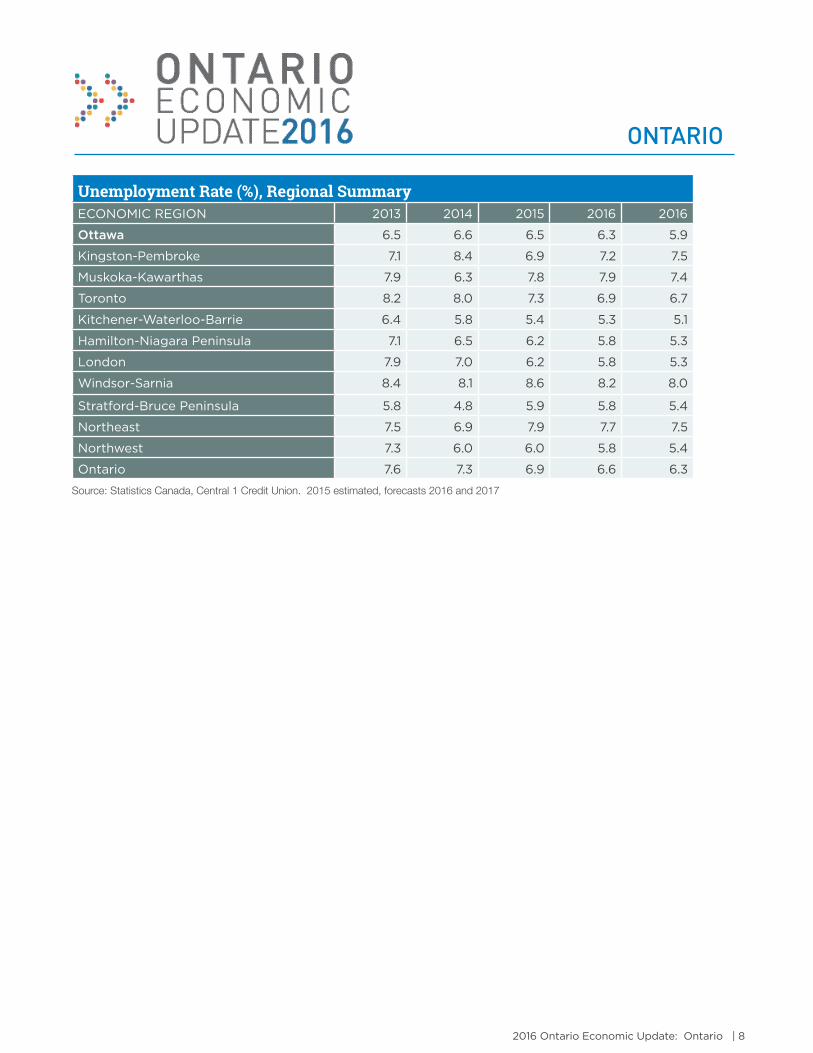
Unemployment Rate (%), Regional SummaryECONOMIC REGION 2013 2014 2015 2016 2016
Ottawa 6.5 6.6 6.5 6.3 5.9
Kingston-Pembroke 7.1 8.4 6.9 7.2 7.5
Muskoka-Kawarthas 7.9 6.3 7.8 7.9 7.4
Toronto 8.2 8.0 7.3 6.9 6.7
Kitchener-Waterloo-Barrie 6.4 5.8 5.4 5.3 5.1
Hamilton-Niagara Peninsula 7.1 6.5 6.2 5.8 5.3
London 7.9 7.0 6.2 5.8 5.3
Windsor-Sarnia 8.4 8.1 8.6 8.2 8.0
Stratford-Bruce Peninsula 5.8 4.8 5.9 5.8 5.4
Northeast 7.5 6.9 7.9 7.7 7.5
Northwest 7.3 6.0 6.0 5.8 5.4
Ontario 7.6 7.3 6.9 6.6 6.3
Source: Statistics Canada, Central 1 Credit Union. 2015 estimated, forecasts 2016 and 2017
ONTARIO
2016 Ontario Economic Update: Ontario | 9
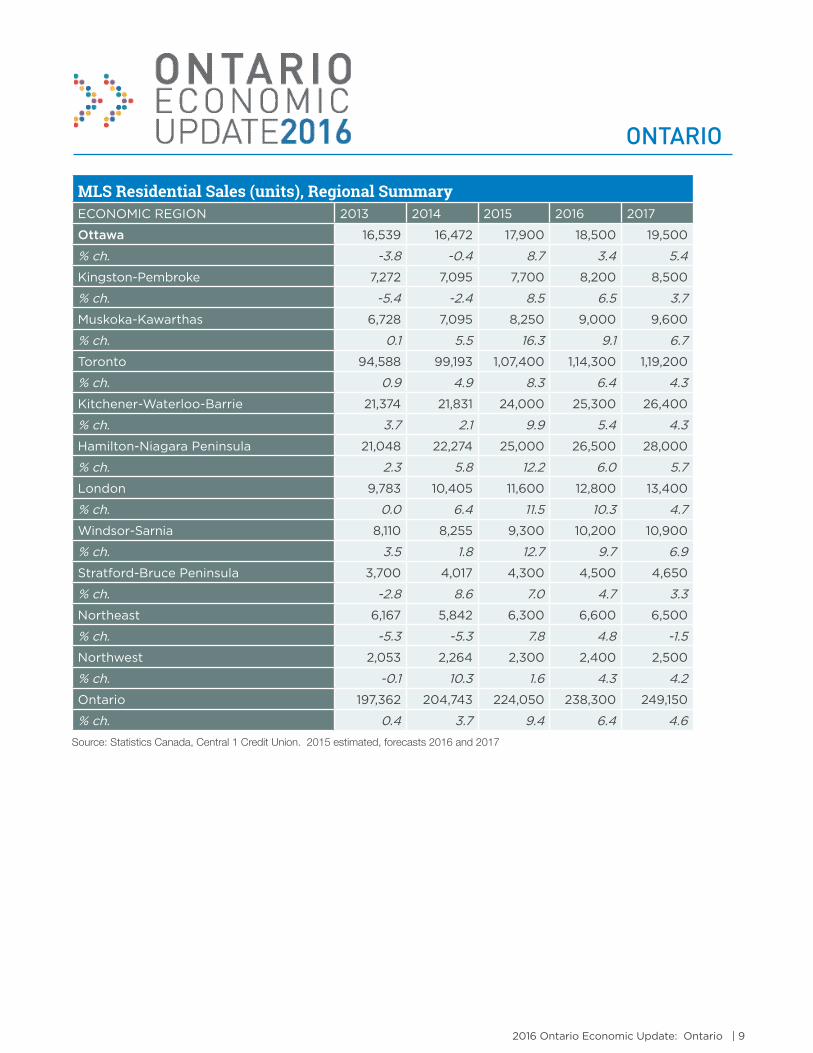
MLS Residential Sales (units), Regional Summary ECONOMIC REGION 2013 2014 2015 2016 2017
Ottawa 16,539 16,472 17,900 18,500 19,500
% ch. -3.8 -0.4 8.7 3.4 5.4
Kingston-Pembroke 7,272 7,095 7,700 8,200 8,500
% ch. -5.4 -2.4 8.5 6.5 3.7
Muskoka-Kawarthas 6,728 7,095 8,250 9,000 9,600
% ch. 0.1 5.5 16.3 9.1 6.7
Toronto 94,588 99,193 1,07,400 1,14,300 1,19,200
% ch. 0.9 4.9 8.3 6.4 4.3
Kitchener-Waterloo-Barrie 21,374 21,831 24,000 25,300 26,400
% ch. 3.7 2.1 9.9 5.4 4.3
Hamilton-Niagara Peninsula 21,048 22,274 25,000 26,500 28,000
% ch. 2.3 5.8 12.2 6.0 5.7
London 9,783 10,405 11,600 12,800 13,400
% ch. 0.0 6.4 11.5 10.3 4.7
Windsor-Sarnia 8,110 8,255 9,300 10,200 10,900
% ch. 3.5 1.8 12.7 9.7 6.9
Stratford-Bruce Peninsula 3,700 4,017 4,300 4,500 4,650
% ch. -2.8 8.6 7.0 4.7 3.3
Northeast 6,167 5,842 6,300 6,600 6,500
% ch. -5.3 -5.3 7.8 4.8 -1.5
Northwest 2,053 2,264 2,300 2,400 2,500
% ch. -0.1 10.3 1.6 4.3 4.2
Ontario 197,362 204,743 224,050 238,300 249,150
% ch. 0.4 3.7 9.4 6.4 4.6
Source: Statistics Canada, Central 1 Credit Union. 2015 estimated, forecasts 2016 and 2017
ONTARIO

2016 Ontario Economic Update: Ontario | 10
MLS Residential Average Sale Price ($), Regional Summary ECONOMIC REGION 2013 2014 2015 2016 2017
Ottawa 334,320 339,785 346,000 355,000 365,000
% ch. 2.0 1.6 1.8 2.6 2.8
Kingston-Pembroke 247,163 247,935 260,000 275,000 285,000
% ch. 2.8 0.3 4.9 5.8 3.6
Muskoka-Kawarthas 302,268 320,936 337,000 360,000 375,000
% ch. 3.3 6.2 5.0 6.8 4.2
Toronto 529,948 573,183 625,800 680,400 730,100
% ch. 5.1 8.2 9.2 8.7 7.3
Kitchener-Waterloo-Barrie 311,530 328,492 348,000 370,000 390,000
% ch. 3.9 5.4 5.9 6.3 5.4
Hamilton-Niagara Peninsula 333,673 352,833 380,000 410,000 440,000
% ch. 6.1 5.7 7.7 7.9 7.3
London 243,155 251,964 261,300 278,200 298,100
% ch. 2.4 3.6 3.7 6.5 7.2
Windsor-Sarnia 179,294 186,650 193,000 205,000 220,000
% ch. 4.1 4.1 3.4 6.2 7.3
Stratford-Bruce Peninsula 226,108 233,598 245,000 254,000 263,000
% ch. 2.9 3.3 4.9 3.7 3.5
Northeast 212,386 216,113 212,500 219,300 224,125
% ch. 1.2 1.8 -1.7 3.2 2.2
Northwest 195,100 208,909 220,000 225,000 230,000
% ch. 6.9 7.1 5.3 2.3 2.2
Ontario 4 431,543 463,123 498,701 531,532
% ch. 4.7 7.1 7.3 7.7 6.6
Source: Statistics Canada, Central 1 Credit Union. 2015 estimated, forecasts 2016 and 2017
ONTARIO
2016 Ontario Economic Update: Ontario | 11
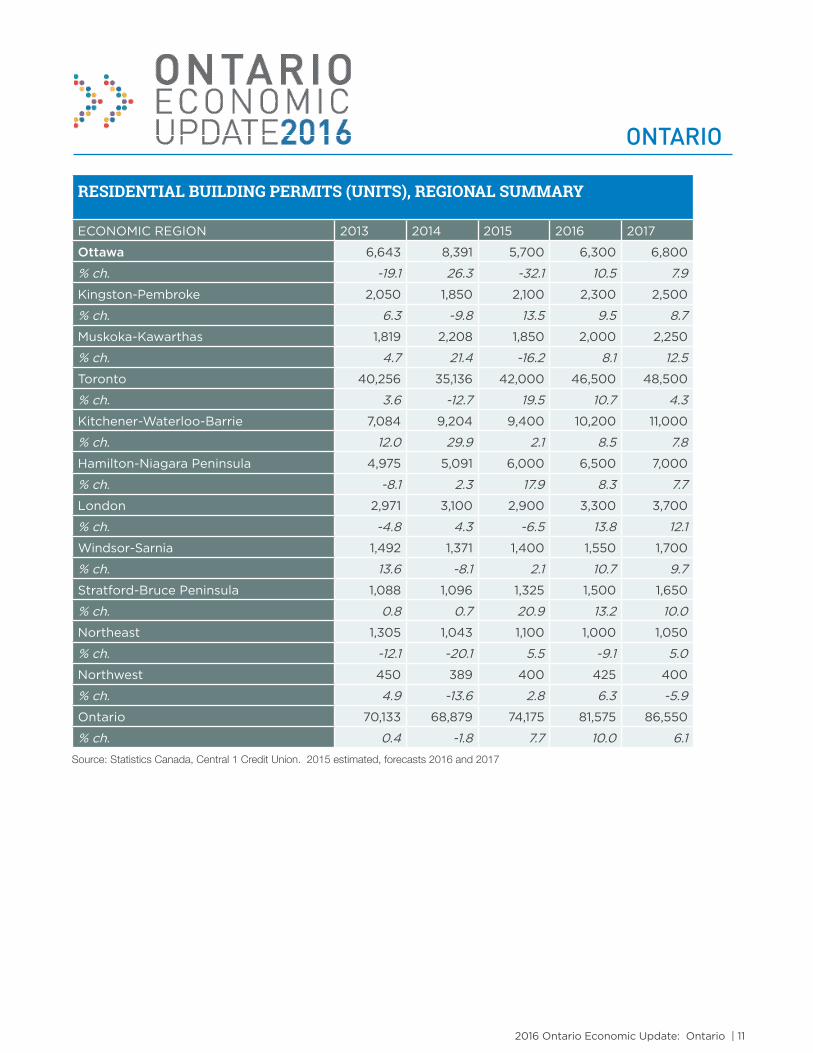
RESidEnTiAL BUiLding PERMiTS (UniTS), REgiOnAL SUMMARy ECONOMIC REGION 2013 2014 2015 2016 2017
Ottawa 6,643 8,391 5,700 6,300 6,800
% ch. -19.1 26.3 -32.1 10.5 7.9
Kingston-Pembroke 2,050 1,850 2,100 2,300 2,500
% ch. 6.3 -9.8 13.5 9.5 8.7
Muskoka-Kawarthas 1,819 2,208 1,850 2,000 2,250
% ch. 4.7 21.4 -16.2 8.1 12.5
Toronto 40,256 35,136 42,000 46,500 48,500
% ch. 3.6 -12.7 19.5 10.7 4.3
Kitchener-Waterloo-Barrie 7,084 9,204 9,400 10,200 11,000
% ch. 12.0 29.9 2.1 8.5 7.8
Hamilton-Niagara Peninsula 4,975 5,091 6,000 6,500 7,000
% ch. -8.1 2.3 17.9 8.3 7.7
London 2,971 3,100 2,900 3,300 3,700
% ch. -4.8 4.3 -6.5 13.8 12.1
Windsor-Sarnia 1,492 1,371 1,400 1,550 1,700
% ch. 13.6 -8.1 2.1 10.7 9.7
Stratford-Bruce Peninsula 1,088 1,096 1,325 1,500 1,650
% ch. 0.8 0.7 20.9 13.2 10.0
Northeast 1,305 1,043 1,100 1,000 1,050
% ch. -12.1 -20.1 5.5 -9.1 5.0
Northwest 450 389 400 425 400
% ch. 4.9 -13.6 2.8 6.3 -5.9
Ontario 70,133 68,879 74,175 81,575 86,550
% ch. 0.4 -1.8 7.7 10.0 6.1
Source: Statistics Canada, Central 1 Credit Union. 2015 estimated, forecasts 2016 and 2017
ONTARIO

2016 Ontario Economic Update: Ontario | 12
POPULATiOn (000S), REgiOnAL SUMMARyECONOMIC REGION 2013 2014 2015 2016 2017
Ottawa 1,309.1 1,320.3 1,331.0 1,343.0 1,358.0
% ch. 0.9 0.9 0.8 0.9 1.1
Kingston-Pembroke 467.7 468.7 470.0 471.4 473.1
% ch. 0.2 0.2 0.3 0.3 0.4
Muskoka-Kawarthas 380.0 381.5 383.0 385.5 388.5
% ch. 0.5 0.4 0.4 0.7 0.8
Toronto 6,268.8 6,357.7 6,439.8 6,530.3 6,626.1
% ch. 1.6 1.4 1.3 1.4 1.5
Kitchener-Waterloo-Barrie 1,285.1 1,297.9 1,308.5 1,319.0 1,332.0
% ch. 1.1 1.0 0.8 0.8 1.0
Hamilton-Niagara Peninsula 1,435.0 1,445.9 1,456.2 1,467.9 1,483.1
% ch. 0.9 0.8 0.7 0.8 1.0
London 662.3 666.4 670.9 675.8 681.5
% ch. 0.7 0.6 0.7 0.7 0.8
Windsor-Sarnia 638.2 637.4 637.0 637.5 637.9
% ch. 0.0 -0.1 -0.1 0.1 0.1
Stratford-Bruce Peninsula 300.3 300.5 300.7 301.2 301.7
% ch. 0.1 0.1 0.1 0.2 0.2
Northeast 564.3 562.6 560.9 559.0 557.3
% ch. -0.2 -0.3 -0.3 -0.3 -0.3
Northwest 240.1 239.8 239.4 239.1 239.1
% ch. -0.1 -0.1 -0.2 -0.1 0.0
Ontario 13,550.9 13,678.8 13,797.4 13,929.7 14,078.3
% ch. 1.1 0.9 0.9 1.0 1.1
Source: Statistics Canada, Central 1 Credit Union. Forecasts 2015 to 2017
Note: As of July 1, latest actual 2014.
ONTARIO
2016 Ontario Economic Update: Ontario | 13
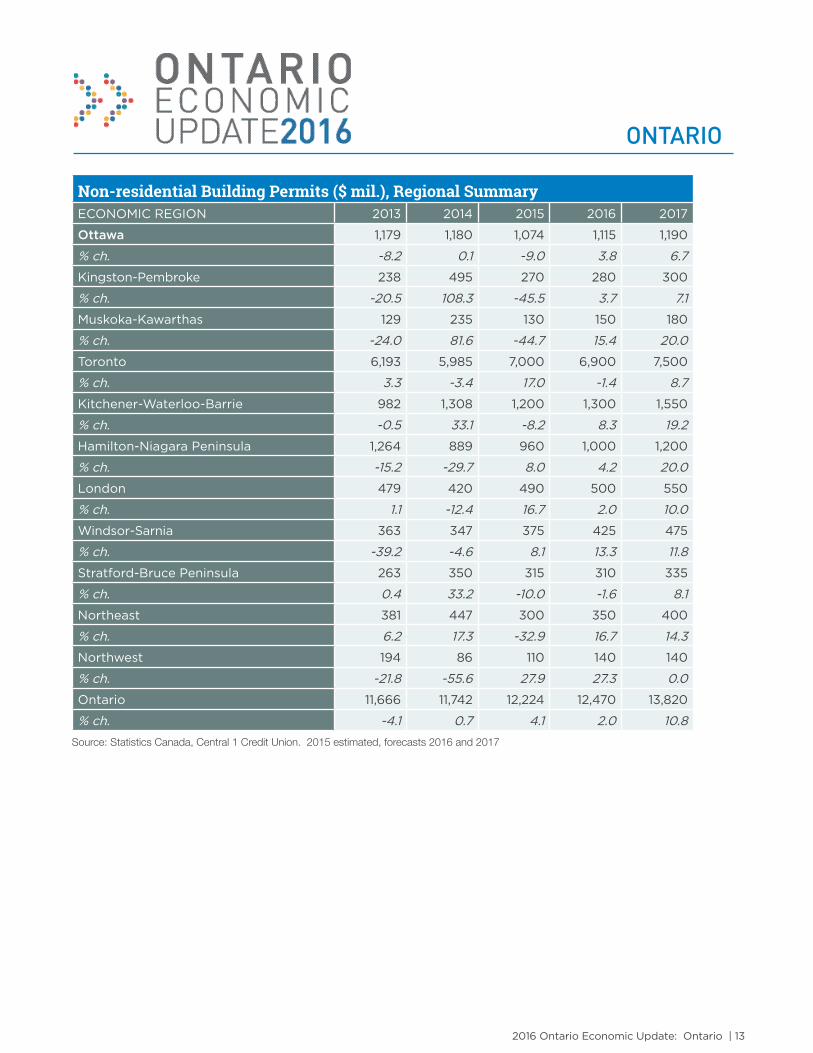
non-residential Building Permits ($ mil.), Regional SummaryECONOMIC REGION 2013 2014 2015 2016 2017
Ottawa 1,179 1,180 1,074 1,115 1,190
% ch. -8.2 0.1 -9.0 3.8 6.7
Kingston-Pembroke 238 495 270 280 300
% ch. -20.5 108.3 -45.5 3.7 7.1
Muskoka-Kawarthas 129 235 130 150 180
% ch. -24.0 81.6 -44.7 15.4 20.0
Toronto 6,193 5,985 7,000 6,900 7,500
% ch. 3.3 -3.4 17.0 -1.4 8.7
Kitchener-Waterloo-Barrie 982 1,308 1,200 1,300 1,550
% ch. -0.5 33.1 -8.2 8.3 19.2
Hamilton-Niagara Peninsula 1,264 889 960 1,000 1,200
% ch. -15.2 -29.7 8.0 4.2 20.0
London 479 420 490 500 550
% ch. 1.1 -12.4 16.7 2.0 10.0
Windsor-Sarnia 363 347 375 425 475
% ch. -39.2 -4.6 8.1 13.3 11.8
Stratford-Bruce Peninsula 263 350 315 310 335
% ch. 0.4 33.2 -10.0 -1.6 8.1
Northeast 381 447 300 350 400
% ch. 6.2 17.3 -32.9 16.7 14.3
Northwest 194 86 110 140 140
% ch. -21.8 -55.6 27.9 27.3 0.0
Ontario 11,666 11,742 12,224 12,470 13,820
% ch. -4.1 0.7 4.1 2.0 10.8
Source: Statistics Canada, Central 1 Credit Union. 2015 estimated, forecasts 2016 and 2017
ONTARIO