Regional Needs Assets Report Childhood Health and ...
108
Regional Needs and Assets Report Santa Cruz County Regional Partnership Council Arizona Early Childhood Health and Development Board Clegg & Associates Seattle, Washington August 2010
Transcript of Regional Needs Assets Report Childhood Health and ...

Regional Needs and Assets Report
Santa Cruz County Regional Partnership Council
Arizona Early Childhood Health and Development Board
Clegg & Associates
Seattle, Washington
August 2010
Report submitted by:
1904 Third Ave, Ste 925 Seattle, WA 98101
206.448.0878 www.cleggassociates.com
Judith Clegg, President Dawn Hanson Smart, Senior Associate
Beka Smith, Research Associate Irving Sambolin, Administrative Associate

Table of Content
Section Title Sub‐sections
i Message from the Chair o
ii Regional Partnership Council Members o
iii Introduction and Acknowledgements o
1 Executive Summary o
2 Demographic Overview o General Population Trends
o Additional Population Characteristics
o Economic Trends
o Education Trends
o Implications
3 Early Care and Education o Quality and Access to Child Care
o Professional Development in Child Care Setting
o Implications
4 Supporting Families o Support Service Availability
o Family Needs and Concerns
o Implications
5 Health o Maternal and Child Health Status
o Health Care Access and Utilization
o Implications
6 Public Awareness and Collaboration o Family Awareness Regarding Early Childhood Development Issues
o Key Informant Interviews: Parents’ Understanding of Early Childhood Issues
o Accessibility and Quality of Information Available to Families
o Key Informant Interview: Availability and Quality of Service‐related Information
o System Coordination
o Implications
7 Summary and Conclusion o
A Appendix o Child Care Providers
B Appendix o Citations for Resources
Regional Needs and Assets Report — Santa Cruz County Regional Partnership Council
Message From The Chair

Regional Needs and Assets Report — Santa Cruz County Regional Partnership Council
Santa Cruz Regional Partnership Council Members
Danna Gallardo, Chair — Rio Rico — At‐large
Anna Rosas, Vice Chair — Nogales — School Administration
Melisa Lunderville — Rio Rico — Child Care
Lourdes Mendez — Nogales — Education
Maria Neuman — Rio Rico — At‐large
Renee Travers‐Huerta — Rio Rico — At‐large
Lee Vellom — Nogales — Faith‐based
Karen Woodford — Tubac — Business
Tami Young — Patagonia — Parent
Vacant — Philanthropy
Vacant — Health Services Provision

Regional Needs and Assets Report — Santa Cruz County Regional Partnership Council
Introductory Summary and Acknowledgments
First Things First Santa Cruz Regional Partnership Council
The way in which children develop from infancy to well functioning members of society will
always be a critical subject matter. Understanding the processes of early childhood
development is crucial to our ability to foster each child’s optimal development, and thus, in
turn, is fundamental to all aspects of wellbeing for our communities, society, and the State of
Arizona.
This Needs and Assets Report for the Santa Cruz Geographic Region provides a clear statistical
analysis and helps us in understanding the needs, gaps, and assets for young children, and
points to ways in which children and families can be supported. The needs young children and
families face in the Santa Cruz Region include affordable early childhood education and care, as
well as access to physicians, dentists, and mental health practitioners.
The First Things First Santa Cruz Regional Partnership Council recognizes the importance of
investing in young children and empowering parents, grandparents, and caregivers to advocate
for services and programs within the region. A strong focus throughout the Santa Cruz Region in
the past year is providing assistance with child care tuition scholarships, home visitation
services, oral health screenings, and teacher/therapist loan programs. The opening of two
family resource centers will be completed by the end of August 2010. This report provides
basic data points that will aid the council’s decisions and funding allocations, while building a
true comprehensive statewide early childhood system.

Regional Needs and Assets Report — Santa Cruz County Regional Partnership Council
Acknowledgments
The First Things First Santa Cruz Regional Partnership Council owes special gratitude to the
agencies and key stakeholders who participated in numerous work sessions and community
forums throughout the past two years. The success of First Things First was due, in large
measure, to the contributions of numerous individuals who gave their time, skill, support,
knowledge, and expertise.
To the current and past members of the Santa Cruz Regional Partnership Council, your
dedication, commitment, and extreme passion has guided this work for making a difference in
the lives of young children and families within the region. Our continued work will only aid in
the direction of building a true comprehensive early childhood system for the betterment of
young children within the region and the entire state.
We also want to thank The Arizona Department of Economic Security and the Arizona Child
Care Resource and Referral, the Arizona Department of Health Services and the Arizona State
Immunization Information System, the Arizona Department of Education, the Arizona Head
Start Association, the Office of Head Start, and Head Start and Early Head Start Programs across
the State of Arizona, and the Arizona Health Care Cost Containment System for their
contribution of data for this report.
In addition, we would like to thank the following local individuals and organizations for their
assistance in ensuring that this report accurately reflects the Santa Cruz region’s needs and
assets: Penelope Jacks, Director — Children's Action Alliance, Southern Arizona; LaVonne
Douville, Vice President, Community Development — United Way of Tucson and Southern
Arizona; Gaby Heredia, DES Child Care Specialist — Child and Family Services; Rod Rich,
Assistant Superintendent — Santa Cruz Valley Unified School District #35; Angel Canto, School
Improvement Director — Nogales Unified School District; Alfredo Velasquez, County
Superintendent of Schools — Santa Cruz County; James Welden, Susan Kunz, Joyce Latura, and
Rosie Piper — Mariposa Community Health Center; and Bob Phillips — Santa Cruz Community
Foundation.

First Things First Arizona Early Childhood Health and Development Board
Regional Needs and Assets Report — Santa Cruz County Regional Partnership Council — 1
1 — Executive Summary
The Santa Cruz Regional Partnership Council is one of 31 regional partnership councils in Arizona. The Councils work to focus their communities’ attention on early childhood development, including child care, education, health, social services, and poverty issues. Every two years, the Councils commission a needs assessment report that explores regional needs and assets. This report builds on the first needs assessment report that was conducted for the Santa Cruz Regional Partnership Council in 2008 and provides new data and input from interviews with community stakeholders. The report identifies needs, assets, and opportunities for improvement and is intended to guide strategic planning and funding decisions.
Population
Santa Cruz County is a small county located in Southeast Arizona. It contains the communities of Nogales, Rio Rico, Patagonia, Elgin, Sonoita, Amado, Tubac, Tumacacori, and Carmen. While Amado is part of Santa Cruz County, it no longer falls within the jurisdiction of the Santa Cruz Regional Partnership Council.
Population trends are discussed in Section 2 of this report. The population of children ages 0 – 5 living in Santa Cruz County has increased by approximately 20% since 2000. The population of the county as a whole has grown somewhat more slowly, at 14%, which is less rapid than growth in the state as a whole, but greater than national averages.
Most families living in Santa Cruz County are Hispanic. There are therefore a high percentage of births to Hispanic mothers and children under age 6 living in Hispanic households. Families are frequently Spanish speakers and speak a language other than English at home.
The Economy
Families in Santa Cruz County bring home considerably less income than is average for the state of Arizona. The county’s poverty rate is substantial, with more than 20% of families with children 0 – 5 living in poverty. In addition, a large number of families are at financial risk due to unemployment and unaffordable housing costs. While many families and children are at risk, their use of income supports and benefits is uneven. While an increasing number of households participate in the Supplemental Nutrition Assistance Program (SNAP), TANF participation has remained level.
Education
Santa Cruz County residents have lower levels of education than is average for the state. Adults are less likely to have a high school or college degree. There are also differences in educational attainment between men and women and between people speaking English and Spanish at home. Women are more likely to graduate from high school, but less likely to go to college. People who speak English at home are more likely to graduate from high school and more likely to have a bachelors or higher degree.
Standardized testing, while a limited tool for measuring children’s skills, suggests that children in Santa Cruz County may be entering kindergarten with comparatively high barriers for
First Things First Arizona Early Childhood Health and Development Board
Regional Needs and Assets Report — Santa Cruz County Regional Partnership Council — 2
educational achievement. Many are categorized as at some or high risk for not achieving at grade level. However, school participation seems to make a positive difference, as test scores for third graders are considerably higher and are comparable to the state as a whole.
Within the county, however, there are large differences between schools and students’ scores on standardized tests. While some schools excel, many schools have high proportions of students who fail to meet state benchmarks. Similarly, the state’s performance ratings for elementary schools in the county range from high performing to underperforming.
Quality and Access to Child Care
The third section of this report describes the early childhood care and educational opportunities that are available in the county. A variety of types of early childhood care and education centers exist in the county, ranging from small family businesses to large child care centers. Because not all facilities are licensed or registered, the total number is unknown.
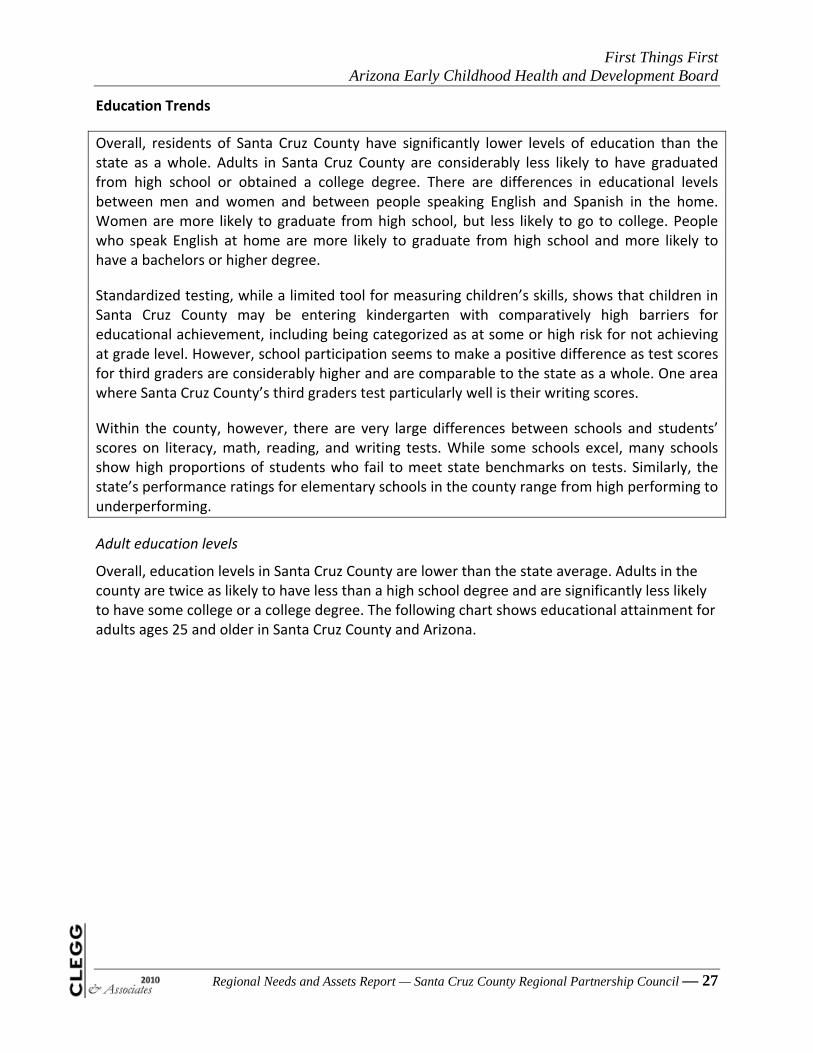
Among the licensed and registered facilities, the great majority are located in Nogales and Rio Rico. This corresponds with the population centers of Santa Cruz County. It is reasonable to assume that throughout the county there are a significant number of additional unregulated providers who have chosen not to register with the Child Care Resource and Referral Service, particularly smaller scale family businesses.
Most children in Santa Cruz County do not attend a day care home or center. This is in large part a cost issue. While Santa Cruz County child care centers generally charge less than the state average, costs have increased over time and the county is home to a large number of low‐income households and families living in poverty who are not able to afford child care. Funding cuts to the state’s Child Care Assistance program will further limit the number of families able to pay for child care.
Most child care teachers and assistants in Santa Cruz County do not have a degree beyond high school. While Central Arizona College, Pima Community College, and Cochise College offer a child development associates degree, the cost of credits and fee for the actual certificate pose barriers to completion. Paired with lower than average wages for child care teachers, professional development may not be affordable. This makes it more difficult for the region’s providers to offer top quality care.
Support Services
The fourth section of this report describes the support services that are available to families in the county, as well as gaps in needed services. Santa Cruz County has a number of social services agencies that support families, ranging from food banks to legal services to libraries. A large number of social services agencies are located in Nogales with far fewer throughout the rest of the county. Rio Rico, despite being the second largest community within the county, is home to comparatively few social services agencies. Smaller communities, such as Patagonia and Tubac, also have relatively few social services available.
Preschools, Head Start, and child care centers and homes throughout the county work directly with children and families on early childhood education. However, First Things First is the only organization in the county primarily dedicated to bringing attention to and improving early
First Things First Arizona Early Childhood Health and Development Board
Regional Needs and Assets Report — Santa Cruz County Regional Partnership Council — 3
childhood development and parenting. However, parenting trainings are also provided by preschools and Child Protective Services, and parenting classes are offered to any school by the Mariposa Community Health Center.
Safety net services and programs particularly focused on early childhood development are experiencing funding cuts, which limits their capacity. These reductions will make it even more difficult for Santa Cruz families to obtain the help that they need.
Health
The fifth section of the report deals with health, including the county’s health care system, the availability of health care coverage, and indicators of health for infants, young children, and pregnant women. Maternal and child health indicators in Santa Cruz County are generally similar to state rates, with the exception of the incidence of pre‐term births and infant mortality in Santa Cruz County, which are slightly better than state rates.
However, there are serious gaps in the capacity of the county’s health care system. Santa Cruz County contains a small number of health care facilities, including one general hospital and three community clinics located in Nogales, Patagonia, and Rio Rico, which means that families in most communities within the county must travel to access care. In addition, the county lacks adequate numbers of mental health and dental professionals. A significant number of children suffer from oral health problems such as tooth decay. Access barriers are likely contributing to insufficient dental care. Nearly a quarter of parents report that they have to travel more than 20 miles to obtain dental care for their children.
Gaps in health care are also evident in the significant number of pregnant women (nearly one‐third) who do not receive prenatal care during their first trimester, as well as some health indicators for children. For example, while the large majority of children entering kindergarten are up‐to‐date on their immunizations, as is required and is provided at no cost, this is not the case for younger children. In addition, children struggle to maintain healthy nutrition and activity, as is true throughout the state and nationally.
Arizona’s Kids Care program is a major source of health care coverage for low‐income families with children. Funding cuts have resulted in a freeze on enrollment, dramatically reducing the number of children enrolled in both Santa Cruz County and the state as a whole. Combined with cuts to the Mariposa Community Health Center, a provider of affordable health care, it is likely that families in the county will increasingly struggle to pay for health care for their children.
On a more positive note, local health care providers have been successful in developing culturally‐responsive approaches to care that respect the needs of Santa Cruz County’s primarily Hispanic families. The Promotoras program, in particular, is an effort that has established a vital link between the health care system and many families in the county.
Family Awareness Regarding Early Childhood Development Issues
The sixth section of this needs assessment report explores parents’ understanding of early childhood. Santa Cruz County families demonstrate a generally high level of awareness regarding childhood development issues. The responses of parents in the region to the First Things First Family and Community Survey, which was administered by First Things First

First Things First Arizona Early Childhood Health and Development Board
Regional Needs and Assets Report — Santa Cruz County Regional Partnership Council — 4
statewide and gauges parents’ understanding of early childhood, are stronger than state averages in many areas. However, there are a few areas for concern. Specifically, more parents in the region than statewide believe that a child’s capacity for learning is “pretty much set from birth” and cannot be greatly increased or decreased by how parents interact with them. In addition, more parents in the region than those statewide believe that children’s language development receives equal benefit from hearing someone talk on TV versus hearing a person in the same room talking to them.
System Coordination
Section 6 of the report also explores the extent to which service providers and service systems in the county are collaborating effectively. While many staff at social service agencies report good working relationships, there are mixed perspectives about whether coordination and collaboration in the county exist to a sufficient extent to create a unified network of services for the local families. While some of those interviewed believe that coordination is effective, many others stated that they view territoriality as a major impediment to a well‐coordinated system of services.
Conclusions
The final section of the needs assessment report concludes with key issues for the Regional Partnership Council to consider as it moves forward. Santa Cruz County has substantial assets in the providers that are serving the county, as well as parents’ generally strong understanding of and commitment to early childhood issues. At the same time, the county is facing major gaps in child care, health care, and basic needs assistance, which are likely to worsen due to funding cuts. The report encourages the Council to play a leadership role in addressing many of the system capacity and coordination challenges facing the region.

First Things First Arizona Early Childhood Health and Development Board
Regional Needs and Assets Report — Santa Cruz County Regional Partnership Council — 5
2 — Demographic Overview
General Population Trends
General population indicators show that the number of children ages 0 – 5 living in Santa Cruz County has increased by approximately 20% since the year 2000. However, the annual number of births and deaths within the 0 – 5 age group has remained relatively stable. This could be due to families moving into the county whose children were born elsewhere. Overall, population growth within the county has been somewhat lower at 14%, but has occurred more rapidly within unincorporated areas. Despite significant growth in Santa Cruz County, population growth in the state as a whole has outpaced the county.
Children 0 – 5
The number of children ages 0 – 5 living in Santa Cruz County varies according to the data source. Sources are difficult to compare because some measure the number of children in the Santa Cruz region, while others are limited to the county. Some sources measure the number of children ages 0 through 5, while others measure the number of children under age 5.
According to the First Things First 2011 Regional Allocations, 4,865 children ages 0 – 5 were living in the Santa Cruz County region as of 2009, an increase of 21% from 2000. In comparison, the number of children in this age group in Arizona as a whole increased by 40%.
Population 0 – 5 2000 2009
Growth
2000 – 2009
Santa Cruz Region 4,017 4,865
848 (21%)
Arizona 459,923 643,783
183,860 (40%)
First Things First. (2010). Final Table IV‐Proposed FY 2011 Regional Allocations.
Changes to the First Things First regional boundaries, which add Sonoita zip code 85637 to the Santa Cruz region while subtracting Amado zip code 85645, results in a slight reduction of the total number of children counted in the Santa Cruz region. Based on 2000 Census data, 178 children ages 0 – 5 lived in Amado, compared to 21 children in Sonoita. This change therefore represents a decrease of approximately 157 children under age 5 who are counted in the Santa Cruz region.
Because Amado zip code 85645 is counted as part of the county, but not the FTF region, it is important to note that this change in First Things First regional boundaries may create small discrepancies in population counts between different data sources. For the purpose of this report, we retain information about Amado where it is provided, since it was part of the Santa Cruz region during many of the years that this report covers, because the difference in the number is not large and unlikely to affect any decisions the Regional Partnership Council might make, and to avoid misrepresenting data at the county level by subtracting Amado statistics.

First Things First Arizona Early Childhood Health and Development Board
Regional Needs and Assets Report — Santa Cruz County Regional Partnership Council — 6
Total population
Total population estimates from the US Census show relatively steady growth for Santa Cruz County, which increased in total population by 14% between 2000 and 2009. This rate of growth was slower than growth for the state as a whole, at 28%, but higher than the national average of 9%.
Population, Santa Cruz County
Total Population
2000 2009 Growth 2000 – 2009
Santa Cruz County
38,381 43,771 5,390 (14%)
Arizona 5,130,632 6,595,778 1,465,146 (28%)
United States
282,171,957 307,006,550 24,834,593
(9%)
US Census Bureau, County Population Estimates. (2000 – 2009). Annual Estimates of the Resident Population for Counties. Available at <http://www.census.gov/popest/counties/CO‐
EST2009‐01.html>
The majority of Santa Cruz County’s population growth occurred in unincorporated areas, which grew by 42% between 2001 and 2008, the most recent geographic data available, as compared to 3% growth in Nogales and 4% growth in Patagonia.
Population, Santa Cruz County
Total Population
2001 2008 Growth 2001 – 2008
Nogales 20,990 21,709 719 (3%)
Patagonia 895 934 39 (4%)
Unincorporated 17,440 24,828 7,388 (42%)
Az.gov, Arizona Department of Commerce. (2009). Historical Estimates: Arizona Population Estimated Summary. Available at
<http://www.azcommerce.com/econinfo/demographics/Population+Estimates.html>.

First Things First Arizona Early Childhood Health and Development Board
Regional Needs and Assets Report — Santa Cruz County Regional Partnership Council — 7
Births
The number of births in Santa Cruz County has held steady over the last 10 years. The number of children born in 2009 (759) was somewhat less than the number born in 1999 (798). In comparison, annual births in the state as a whole increased 8% since 2000.
Births by Year
Santa Cruz
County
ArizonaBirths by Year
Santa Cruz
County
Arizona
2000 798 84,985 2005 781 95,798
2001 759 85,213 2006 753 102,042
2002 762 87,379 2007 766 102,687
2003 792 90,783 2008 796 99,215
2004 808 93,396 2009 759 92,080
Arizona Department of Health Services. (2000 – 2009). Arizona Vital Statistics: Birth Statistics. Available at <http://www.azdhs.gov/plan/menu/for/births.htm>.
Most births in Santa Cruz County occur in Nogales and Rio Rico, representing 95% of all births in the county as of 2008. While the number of births in Nogales decreased since 2000, the number of births in Rio Rico increased. A reminder: Amado is included in the table below and in subsequent tables, as it is part of Santa Cruz County.
Total Births
2000 Total
2000
% of Santa Cruz Births
2008 Total
2008
% of Santa Cruz Births
Amado 31 4% 15 2%
Elgin 4 1% 5 1%
Nogales 498 62% 407 51%
Patagonia 11 1% 12 2%
Rio Rico 231 29% 347 44%
Sonoita 6 1% 3 0%
Tubac 7 1% 4 1%
Tumacacori 7 1% 3 0%
Santa Cruz County 798 100% 796 100%
Arizona Department of Health Services. (2008). Arizona Health Status and Vital Statistics Annual Report. Available at <http://www.azdhs.gov/plan/report/ahs/ahs2008/toc08.htm>.

First Things First Arizona Early Childhood Health and Development Board
Regional Needs and Assets Report — Santa Cruz County Regional Partnership Council — 8
Deaths: infants and pre‐schoolers
The infant death rate in Santa Cruz County, at 5 deaths per 1,000 births as of 2008, was lower than the state average (6.3 per 1,000) and better than the target rate of 6 per 1,000 for Healthy Arizona 2010. Provisional data for 2009 show a small number of deaths in the infant and pre‐schooler age groups, with 4 deaths of infants under the age of 1 in Santa Cruz County and no deaths for preschoolers ages 1 – 4. The state as a whole reported 527 deaths among infants and 126 deaths among pre‐schoolers. Likely due to the small total numbers of deaths, Santa Cruz County’s rate of infant mortality has fluctuated considerably over the last 10 years, from a low of 1.3 deaths per 1,000 births in 2003 to a high of 8.7 in 2004.
First Things First Arizona Early Childhood Health and Development Board
Additional Population Characteristics
Additional analysis of the population living within Santa Cruz County shows that county residents are similar to the rest of the state in many ways. However, a few differences stand out.
Most county residents are Hispanic. There are, therefore, a high percentage of births to Hispanic mothers and Hispanic families with children under age 6.
Families speak a language other than English at home more frequently in Santa Cruz County than the state as a whole.
Age groups among mothers in the county and Arizona are similar, but mothers’ ages differ within jurisdictions within the county.
Average household size in the county is larger than the state average.
Race/ethnicity of all residents
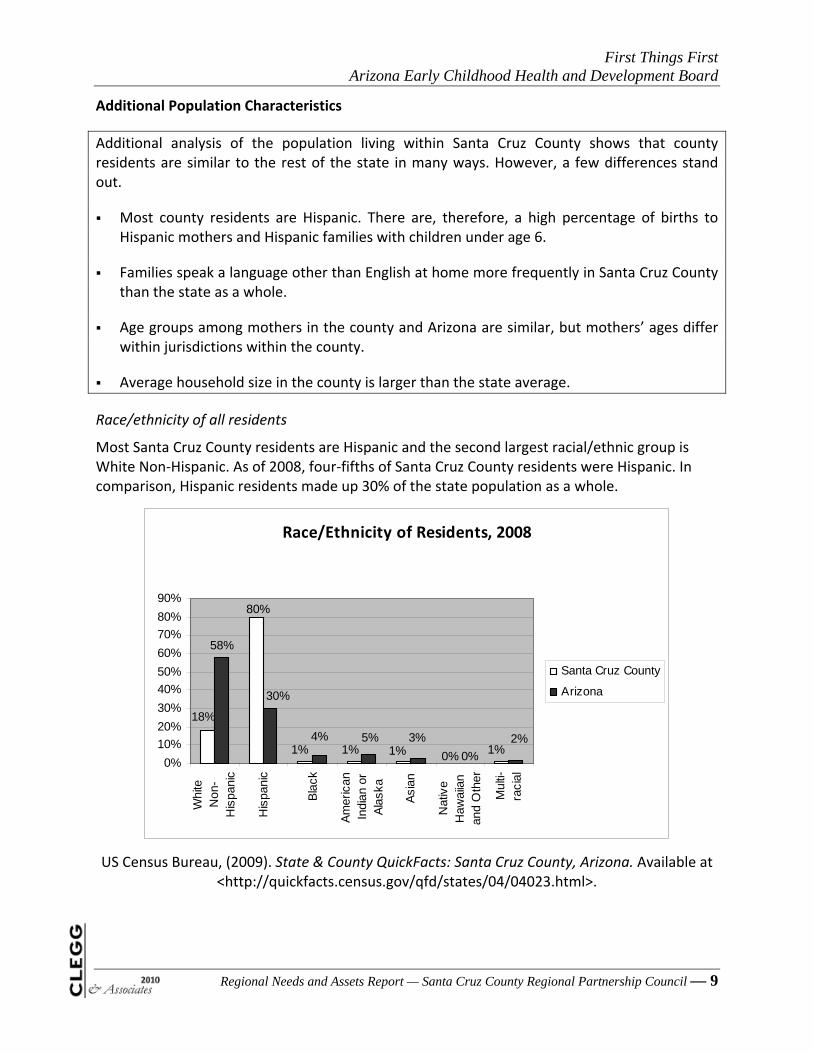
Most Santa Cruz County residents are Hispanic and the second largest racial/ethnic group is White Non‐Hispanic. As of 2008, four‐fifths of Santa Cruz County residents were Hispanic. In comparison, Hispanic residents made up 30% of the state population as a whole.
Race/Ethnicity of Residents, 2008
1%0%1%1%1%
18%
80%
2%
0%
3%5%4%
30%
58%
0%
10%
20%
30%
40%
50%
60%
70%
80%
90%
Whi
teN
on-
His
pani
c
His
pani
c
Bla
ck
Am
eric
anIn
dian
or
Ala
ska
Asi
an
Nat
ive
Haw
aiia
nan
d O
ther
Mul
ti-ra
cial
Santa Cruz County
Arizona
US Census Bureau, (2009). State & County QuickFacts: Santa Cruz County, Arizona. Available at <http://quickfacts.census.gov/qfd/states/04/04023.html>.
Regional Needs and Assets Report — Santa Cruz County Regional Partnership Council — 9
First Things First Arizona Early Childhood Health and Development Board
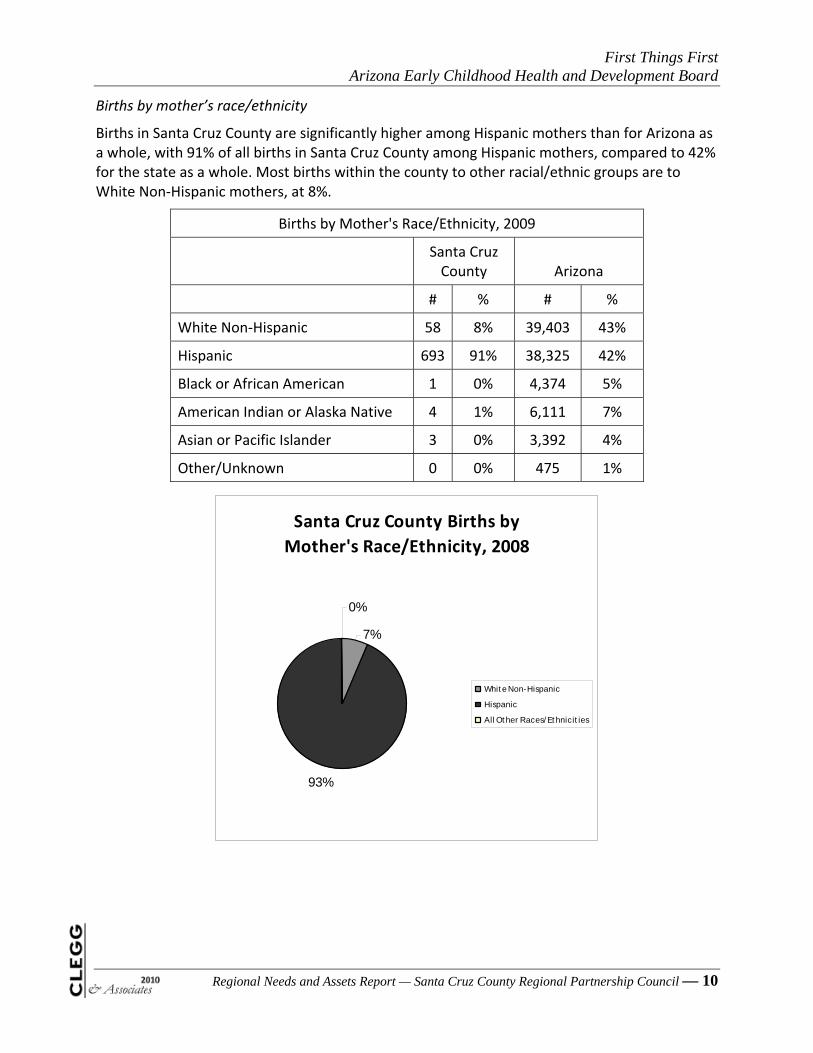
Births by mother’s race/ethnicity
Births in Santa Cruz County are significantly higher among Hispanic mothers than for Arizona as a whole, with 91% of all births in Santa Cruz County among Hispanic mothers, compared to 42% for the state as a whole. Most births within the county to other racial/ethnic groups are to White Non‐Hispanic mothers, at 8%.
Births by Mother's Race/Ethnicity, 2009
Santa Cruz County Arizona
# % # %
White Non‐Hispanic 58 8% 39,403 43%
Hispanic 693 91% 38,325 42%
Black or African American 1 0% 4,374 5%
American Indian or Alaska Native 4 1% 6,111 7%
Asian or Pacific Islander 3 0% 3,392 4%
Other/Unknown 0 0% 475 1%
Santa Cruz County Births by
Mother's Race/Ethnicity, 2008
7%
93%
0%
Whit e Non-Hispanic
Hispanic
All Ot her Races/ Et hnicit ies
Regional Needs and Assets Report — Santa Cruz County Regional Partnership Council — 10

First Things First Arizona Early Childhood Health and Development Board
Arizona Births by
Mother's Race/Ethnicity, 2008
42%
43%
14%
Whit e Non-Hispanic
Hispanic
All Ot her Races/ Et hnicit ies
Arizona Department of Health Services. (2000 – 2009). Arizona Vital Statistics: Birth Statistics, Resident Births by Mother’s Race/Ethnicity. Available at
<http://azdhs.gov/plan/menu/info/trend/births2000_2009.xls>.
Data from 2008 show a highly uneven distribution of births by mother’s race/ethnicity when looking at different communities within Santa Cruz County. For example, 100% of births in Sonoita and Tubac were to White Non‐Hispanic mothers, compared to Nogales, where 98% of births were to Hispanic mothers.
Births by Mother's Race/Ethnicity and Community, 2008
Total BirthsWhite Non‐Hispanic % of Births Hispanic % of Births
Amado 15 4 27% 11 73%
Elgin 5 3 60% 2 40%
Nogales 407 7 2% 398 98%
Patagonia 12 9 75% 3 25%
Rio Rico 347 21 6% 324 93%
Sonoita 3 3 100% 0 0%
Tubac 4 4 100% 0 0%
Tumacacori 3 1 33% 2 67%
Santa Cruz County 796 52 7% 740 93%
Regional Needs and Assets Report — Santa Cruz County Regional Partnership Council — 11

First Things First Arizona Early Childhood Health and Development Board
Regional Needs and Assets Report — Santa Cruz County Regional Partnership Council — 12
Births by Mother's Race/Ethnicity and Community, 2008 (Cont’d)
Total Births Black or
African American
% of Births
American Indian or Alaska Native
% of Births Asian
% of Births
Amado 15 0 0% 0 0% 0 0%
Elgin 5 0 0% 0 0% 0 0%
Nogales 407 0 0% 0 0% 2 0%
Patagonia 12 0 0% 0 0% 0 0%
Rio Rico 347 1 0% 0 0% 1 0%
Sonoita 3 0 0% 0 0% 0 0%
Tubac 4 0 0% 0 0% 0 0%
Tumacacori 3 0 0% 0 0% 0 0%
Santa Cruz County 796 1 0% 0 0% 3 0%
Arizona Department of Health Services. (1998 – 2008). Arizona Vital Statistics: Birth Statistics. Available at <http://azdhs.gov/plan/menu/for/births.htm>.

First Things First Arizona Early Childhood Health and Development Board
Regional Needs and Assets Report — Santa Cruz County Regional Partnership Council — 13
Race/ethnicity of families with children under 6
Santa Cruz County families with children under age 6 are predominantly Hispanic. Families are considerably more likely to be Hispanic than is typical for the state of Arizona. The following table shows the distribution of Hispanic families with children under age 6 in communities within Santa Cruz County and the state as a whole.
Race/Ethnicity of Families with Children Under 6, 2000
Hispanic
Amado 50%
Elgin 27%
Nogales 96%
Patagonia 44%
Rio Rico Northeast 73%
Rio Rico Northwest 87%
Rio Rico Southeast 91%
Rio Rico Southwest 90%
Sonoita 24%
Tubac 48%
Tumacacori‐Carmen 78%
Santa Cruz County 88%
Arizona 35%
First Things First. (2010). Regional Profiles. (Unpublished Data).

First Things First Arizona Early Childhood Health and Development Board
Regional Needs and Assets Report — Santa Cruz County Regional Partnership Council — 14
Children living in linguistically isolated households
Six percent of children ages 5 – 17 in Santa Cruz County are living in linguistically isolated households, defined as a household in which no one over age 14 speaks only English or speaks English "very well." This is three times the average (2%) for the state of Arizona. These data, however, were collected in 2000 and are comparatively old, but there is no more up‐to‐date information available.
Children Living in Linguistically Isolated Households, 2000
%
Elgin 0
Nogales 9%
Patagonia <1%
Rio Rico Northeast 1%
Rio Rico Northwest 7%
Rio Rico Southeast 4%
Rio Rico Southwest 5%
Sonoita <1%
Tubac 0
Tumacacori‐Carmen 0
Santa Cruz County 6%
Arizona 2%
First Things First. (2010). Regional Profiles. (Unpublished Data).
Language use and country of origin
Not surprisingly, Santa Cruz County families are highly likely to speak a language other than English at home. As of 2000, 81% of families with children age 5 and older spoke a language other than English at home, compared to 26% in the state as a whole.
A significant number of Santa Cruz County residents are foreign born. According to American Community Survey estimates for 2006 – 2008, 37% of county residents were born outside the US.
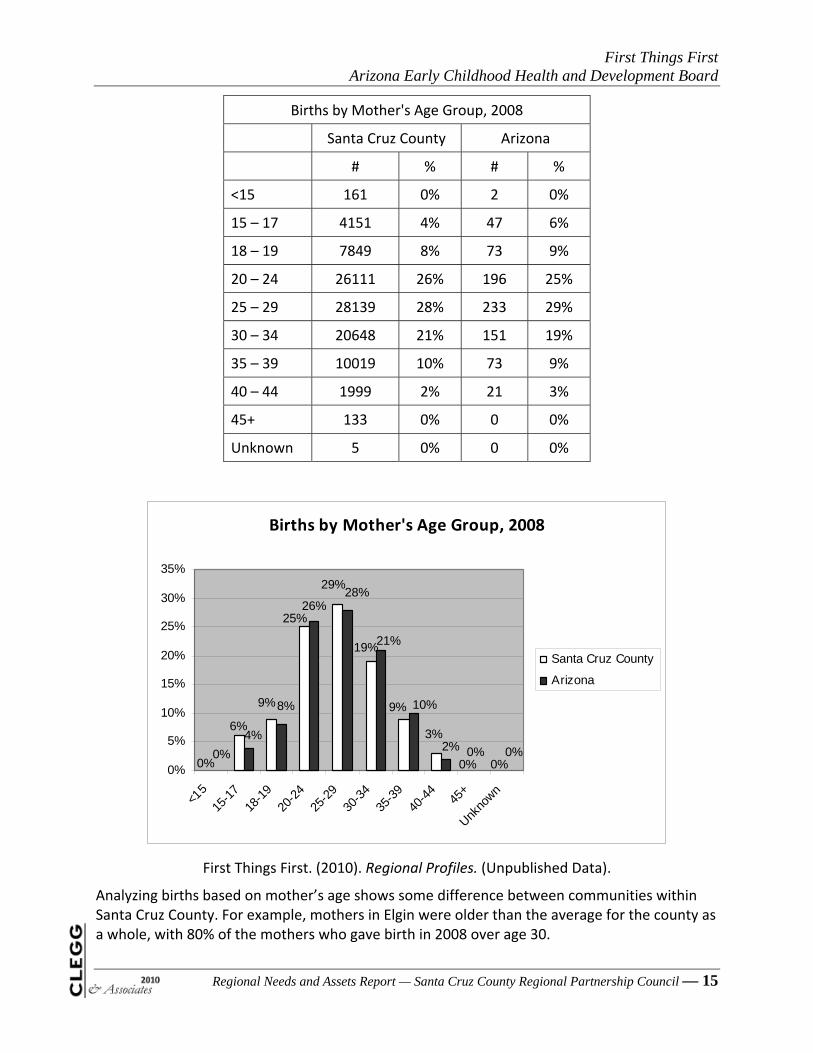
Births by mother’s age group
Mothers’ age groups at the birth of their children are quite similar for Santa Cruz County and the state of Arizona as a whole. The most common age group for mothers in both Santa Cruz County and the state is 25 – 29 years old. Mothers also frequently fall within 20 – 24 and 30 – 34 year age groups in Santa Cruz County, at 26% and 21% of mothers, respectively.
First Things First Arizona Early Childhood Health and Development Board
Births by Mother's Age Group, 2008
Santa Cruz County Arizona
# % # %
<15 161 0% 2 0%
15 – 17 4151 4% 47 6%
18 – 19 7849 8% 73 9%
20 – 24 26111 26% 196 25%
25 – 29 28139 28% 233 29%
30 – 34 20648 21% 151 19%
35 – 39 10019 10% 73 9%
40 – 44 1999 2% 21 3%
45+ 133 0% 0 0%
Unknown 5 0% 0 0%
Births by Mother's Age Group, 2008
26%
0%0%
3%
9%
19%
29%
25%
9%
6%
0%0%0%2%
10%
21%
28%
8%
4%
0%0%
5%
10%
15%
20%
25%
30%
35%
<15
15-1
7
18-1
9
20-2
4
25-2
9
30-3
4
35-3
9
40-4
445
+
Unkno
wn
Santa Cruz County
Arizona
First Things First. (2010). Regional Profiles. (Unpublished Data).
Analyzing births based on mother’s age shows some difference between communities within Santa Cruz County. For example, mothers in Elgin were older than the average for the county as a whole, with 80% of the mothers who gave birth in 2008 over age 30.
Regional Needs and Assets Report — Santa Cruz County Regional Partnership Council — 15

First Things First Arizona Early Childhood Health and Development Board
Regional Needs and Assets Report — Santa Cruz County Regional Partnership Council — 16
Births by Mother's Age and Community, 2008
Total Births <19 % 20 – 29 % 30 – 39 % 40+ %
Amado 15 2 13% 8 53% 5 33% 0 0%
Elgin 5 0 0% 1 20% 2 40% 2 40%
Nogales 407 74 18% 223 55% 101 25% 9 2%
Patagonia 12 2 17% 5 42% 5 42% 0 0%
Rio Rico 347 44 13% 186 54% 109 31% 8 2%
Sonoita 3 0 0% 2 67% 1 33% 0 0%
Tubac 4 0 0% 2 50% 0 0% 2 50%
Tumacacori 3 0 0% 2 67% 1 33% 0 0%
Santa Cruz County 796 122 15% 429 54% 224 28% 21 3%
Arizona Department of Health Services. (1998 – 2008). Arizona Vital Statistics: Birth Statistics. Available at <http://azdhs.gov/plan/menu/for/births.htm>.
Teen birth rates were slightly higher for Santa Cruz County than the state as a whole, at 15% of all births in 2009, compared to 12% for the state. The distribution of births to teenage mothers reflects the county’s distribution of population, with the highest numbers in Nogales and Rio Rico.
Teen Births, 2008
Total Number Percent of Births
Santa Cruz County 122 15%
Amado 2 13%
Elgin 0 0%
Nogales 74 18%
Patagonia 2 17%
Rio Rico 44 13%
Sonoita 0 0%
Tubac 0 0%
Tumacacori 0 0%
Arizona Department of Health Services. (1998 – 2008). Arizona Vital Statistics: Birth Statistics. Available at <http://azdhs.gov/plan/menu/for/births.htm>.

First Things First Arizona Early Childhood Health and Development Board
Regional Needs and Assets Report — Santa Cruz County Regional Partnership Council — 17
Births to unwed mothers
In Santa Cruz County, 47% of all births were to unwed mothers as of 2009 and 45% as of 2008. This is comparable to the state rate of 45% of all births. Within the county, the highest rates of births to unwed mothers are in Amado and Nogales, where more than half of all births are to unwed mothers.
Births to Unwed Mothers, 2008
Total
Number
Percent of
Births
Amado 8 53%
Elgin 0 0%
Nogales 215 53%
Patagonia 3 25%
Rio Rico 128 37%
Sonoita 0 0%
Tubac 0 0%
Tumacacori 1 33%
Santa Cruz County 355 45%
Arizona Department of Health Services. (1998 – 2008). Arizona Vital Statistics: Birth Statistics. Available at <http://azdhs.gov/plan/menu/for/births.htm>.
Household and family size
According to Census 2006 – 2008 American Community Survey estimates, average household size for Santa Cruz County is considerably larger than the state average, at 4 people per household compared to 2.6 people. In addition, the average household size in the county increased by 25% between 2000 and 2008.
Average family size in Santa Cruz County was larger than average household size, at 4.6 people per family.
Grandparents responsible for their grandchildren
According to the 2008 Kids Count study, among the grandparents who live in the same household as their grandchildren in Santa Cruz County, 47% are responsible for taking care of their grandchildren’s basic needs. This is slightly higher than the state average of 40%.

First Things First Arizona Early Childhood Health and Development Board
Regional Needs and Assets Report — Santa Cruz County Regional Partnership Council — 18
Economic Trends
Families in Santa Cruz County bring home less income than is average for the state as a whole. The poverty rate in Santa Cruz County is substantial, with more than 1 in 5 families with children 0 – 5 living in poverty. While many families and children in Santa Cruz County are at risk economically, their use of income supports and benefits is not uniformly high. While Santa Cruz County households are increasingly participating in the Supplemental Nutrition Assistance Program (SNAP), TANF participation rates have remained relatively stable since 2000 but may be threatened by proposed budget cuts to the program for 2010 and 2011.
This puts children at risk for hunger despite the high rates of children eligible for free and reduced lunch in Santa Cruz County school districts and the number of pounds of food distributed by food banks.
Median household and family income
Median household income for Santa Cruz County is comparatively low, at $35,661 in 2007 and $38,607 in 2008. Median family income is higher, at $43,076 in 2008. In comparison, the 2008 state median income for households is considerably higher at $51,124 and the family median income is $60,426.
Median Household Income, 2008
Santa Cruz County Arizona
$38,607 $51,124
US Census Bureau, American Community Survey Office. (2006 – 2008). 2006 – 2008 American Community Survey 3‐Year Estimates. Available from American FactFinder at
<http://factfinder.census.gov/servlet/DatasetMainPageServlet?_program=ACS&_submenuId=datasets_2&_lang=en&_ts=>.
Families with children 0 – 5 in poverty
First Things First estimates that out of a total of 149,931 children 0 – 5 living in poverty in the state in 2009, 1,589 were living in Santa Cruz County. The poverty rate for children 0 – 5 in Santa Cruz County, at 33%, is significantly higher than the rate for the state as a whole, which is 23%. The percentage of children in poverty in Santa Cruz County is also up slightly from the 2000 rate of 21%.
People living 200% above poverty line
In addition to the large number of families living below the poverty line in Santa Cruz County, many other families are earning between 100 – 200% of the poverty level, which puts them at risk. As of the 2000, the most recent time period for which the data are available, less than half (46%) of people in Santa Cruz County were living at 200% above the poverty line.
First Things First Arizona Early Childhood Health and Development Board
Regional Needs and Assets Report — Santa Cruz County Regional Partnership Council — 19
Children in households receiving TANF
The number of children in households receiving TANF has increased slightly in the state over the past 3 years, but decreased slightly in Santa Cruz County during that same time period. Because statistics on income and poverty indicate no reduction in the level of need among families in Santa Cruz County, the decrease in use of TANF is likely the result of fluctuations in the relatively small numbers of families receiving TANF in the county. In addition, changes in eligibility or budget cuts could have an impact on the number of families receiving assistance. The following table shows TANF participation for Santa Cruz County and the state.
Families with Children Age 0 – 5 Participating in the TANF Program
Jan 2007 June 2007 Jan 2009 June 2009 Jan 2010 % Increase
Santa Cruz County 94 85 110 95 89 ‐5%
Arizona 16,511 15,527 18,477 18,045 18,129 10%
Arizona Department of Economic Security. (2007, 2009). DES Multidata pulled on May 4, 2010 from Database. (Unpublished Data).
Data from an additional source, the Annie E. Casey Foundation’s Kids Count Data Center, tracks family participation in TANF by percentage of families rather than total numbers. The percentage of children in families receiving TANF in Santa Cruz County peaked in 2004 at 6%, with 2008 participation falling close to the levels of 2000. The following chart shows the percentage of children in families receiving TANF in the county from 2000 – 2008.
Children in Families Receiving TANF, Santa Cruz County
Year %
2000 4%
2002 6%
2004 6%
2005 4%
2008 4%
The Annie E Casey Foundation, Kids Count Data Center. (2008). Data By State: Arizona. Available at < http://datacenter.kidscount.org/data/bystate/StateLanding.aspx?state=AZ>.
Current state budget proposals may further decrease the number of families receiving TANF. A recommendation to reduce the maximum benefit period from 60 months to 36 months would disqualify many families from benefits.
Children in Supplemental Nutrition Assistance Program
The number of children receiving assistance through the Supplemental Nutrition Assistance Program (SNAP) has increased dramatically in Santa Cruz County and in the state as a whole. The following table shows enrollment numbers for the county and the state.

First Things First Arizona Early Childhood Health and Development Board
Regional Needs and Assets Report — Santa Cruz County Regional Partnership Council — 20
Children Age 0 – 5 in the Supplemental Nutrition Assistance Program,
Santa Cruz County and Arizona
Jan‐07 Jun‐07 Jan‐09 Jun‐09 Jan‐10 % Increase
Santa Cruz County 1,289 1,319 1,696 1,882 2,056 60%
Arizona 134,697 139,170 179,831 199,367 215,837 60%
Arizona Department of Economic Security. (2007, 2009). DES Multidata pulled on May 4, 2010 from Database. (Unpublished Data).
However, when looking at the percentage of families receiving SNAP in Santa Cruz County rather than the numbers of children receiving assistance, participation has remained relatively stable at 27% in 2000 to 26% in 2008. This suggests that SNAP participation has kept pace with population growth in the county.
Free and reduced lunch eligibility
Eligibility for free and reduced lunch is related to both low‐income status and potential food hardship. Children qualify for free lunch at or below 130% of federal poverty guidelines, while reduced lunch eligibility is between 130 – 185% of poverty. With the exception of Sonoita, the majority of students in Santa Cruz County qualify for free and reduced lunches. The following chart shows rates of eligibility by school district.
Free and Reduced Lunch Eligibility, Santa Cruz County, October 2009
School District % Eligible
Nogales Unified District 80%
Patagonia Union High School District 66%
Santa Cruz Catholic School 74%
Santa Cruz Elementary District 70%
Santa Cruz Valley Unified District 76%
Santa Cruz Valley Union High School District 81%
Sonoita Elementary District 28%
Arizona Department of Education, Child Nutrition Programs. (2009). Percentage of Free and Reduced Reports. Available at < http://www.ade.az.gov/health‐safety/cnp/frpercentages/>.
A higher proportion of students in Santa Cruz County qualify for free and reduced lunch than the state as a whole. As of 2008, 77% of students in Santa Cruz County qualified for free or reduced lunch, compared to 52% in the state.
Eligibility for free or reduced‐price lunch has remained relatively stable in the county as a whole over time. The following table shows the percentage of children eligible for free or reduced lunch from 2000 – 2008.

First Things First Arizona Early Childhood Health and Development Board
Regional Needs and Assets Report — Santa Cruz County Regional Partnership Council — 21
Children Eligible for Free or Reduced Lunch
Santa Cruz County
% Average Eligibility for
Santa Cruz County
2000 70%
2002 72%
2004 76%
2005 77%
2008 73%
Arizona Department of Education, Child Nutrition Programs. (2009). Percentage of Free and Reduced Reports. Available at < http://www.ade.az.gov/health‐safety/cnp/frpercentages/>.
Within the county, the percentage of children eligible for free and reduced lunch varies considerably by school and school district. Several schools in the Nogales Unified District had particularly high rates of eligibility for free and reduced lunch, at more than 90%. These schools are:
AJ Mitchell Elementary School
Lincoln Elementary School
Mary L Welty Elementary School
Pierson Vocational High School
Pimeria Alta Academy
Wade Carpenter Middle School
In comparison, only 28% of students at Elgin Elementary School in Sonoita Elementary District are eligible for free and reduced lunch.
Households experiencing food hardship
A substantial proportion of families in Arizona are experiencing food hardship. While specific data for Santa Cruz County are not available, as of 2009 one in five households in Arizona reports not having enough money to buy needed food for their family within the past 12 months. As poverty rates are higher in Santa Cruz County than the state as a whole, it is reasonable to speculate that a higher proportion of households in Santa Cruz County may experience food hardship.
Number of emergency food assistance agencies and food distributed
Santa Cruz County has a number of emergency food assistance agencies. As of 2008, 10 emergency food assistance agencies served the county. They distributed a total of 1,638,509 pounds of food from 2007 – 2008, also suggesting that there are a significant number of households with food and nutrition needs.

First Things First Arizona Early Childhood Health and Development Board
Regional Needs and Assets Report — Santa Cruz County Regional Partnership Council — 22
Homeless children
A number of children and families in Santa Cruz County and in Arizona are homeless and living on the streets, in emergency shelters, in transitional housing, or in permanent supportive housing. The following table shows the results of a December 2009 point‐in‐time count of homeless individuals and families. Point‐in‐time counts are often criticized for under‐representing homeless populations because they count only the individuals and families that those conducting the study encounter on a single day. However, despite their limitations, point‐in‐time surveys are one of the primary sources of information in understanding the number of children in families experiencing homelessness.
Point‐in‐Time Count of Homeless Children in Families, 2009
Children in Families Unsheltered
Emergency Shelter
Transitional Housing
Permanent Supportive Housing
Total Count
Santa Cruz County 1 9 0 NA 10
Arizona 303 1,012 1,589 776 3,680
Arizona Department of Economic Security Homeless Coordination Office. (December 2009). Current Status of Homelessness in Arizona Annual Reports. Available at
<https://www.azdes.gov/appreports.aspx?category=60&subcategory=41>.
Santa Cruz County school districts report a somewhat higher number of homeless students based on McKinney‐Vento eligibility — a total of 19 students in Santa Cruz County, from pre‐kindergarten through grade 12.
Unemployment
Unemployment rates in Santa Cruz County are higher than for the state as a whole and vary over time due largely to seasonal employment in the produce industry. The unemployment rate for Santa Cruz County averaged 14.6% in 2009, rising from 12% during spring of 2009 to considerably higher rates in the summer and fall, averaging 17% from July through October. The unemployment rate decreased at the end of the year, averaging 15% in December.

First Things First Arizona Early Childhood Health and Development Board
Santa Cruz County Unemployment Rate
10.00%10.00%10.10%9.80%
9.70%9.40%9.50%
9.40%
8.90%
8.60%8.20%7.70%8.8%8.9%
9.4%9.6%
9.7%9.9%9.6%
8.9%8.4%
8.7%8.4%8.2%
14.5%
15.1%
17.4%17.4%17.3%17.3%
14.6%
12.4%11.7%
12.4%12.4%12.3%
0.00%
2.00%
4.00%
6.00%
8.00%
10.00%
12.00%
14.00%
16.00%
18.00%
20.00%
Jan
Feb
Mar
chApr
ilM
ayJu
ne July
AugSep
tOct
NovDec
United States
Arizona (%s in white)
Santa Cruz County
Arizona Workforce Informer. (2009). Local Area Unemployment Statistics: Special Unemployment Report. Available at <http://www.workforce.az.gov/?PAGEID=67&SUBID=160.
Within Santa Cruz County, all areas followed the same general trend of increased unemployment during summer and fall. However, the overall level of unemployment within the county varied substantially, from an annual average of 0% in Tumacacori‐Carmen to 24% in Amado. While both of these locales have small total labor forces (fewer than 300 each) a wide degree of variance in unemployment rates was also true for areas with larger workforces. The following chart shows unemployment rates for areas within Santa Cruz County.
Regional Needs and Assets Report — Santa Cruz County Regional Partnership Council — 23

First Things First Arizona Early Childhood Health and Development Board
Unemployment Rates within Areas in Santa Cruz County, 2009
14.6%
23.9%
10.7% 10.7%
15.5%
21.2%
6.4%
0.0%
5.0%3.1%
17.5%
13.6%
0.0%
5.0%
10.0%
15.0%
20.0%
25.0%
30.0%
Unempl
oym
ent R
ate
Santa
Cru
z Cou
nty
Amad
oElg
in
Nogale
s
Patag
onia
Rio Rico
Nor
theas
t
Rio R
ico N
orth
west
Rio Rico
Sou
thea
st
Rio Rico
Sou
thwes
t
Sonoit
a
Tubac
Tumac
acor
i-Car
men
Arizona Workforce Informer. (2009). Local Area Unemployment Statistics: Special Unemployment Report. Available at <http://www.workforce.az.gov/?PAGEID=67&SUBID=160.
Unemployment rates in 2010 to date appear relatively stable, with a slight decrease in unemployment in Santa Cruz County. It is unclear at this point whether this trend will continue. The following table shows unemployment rates by month for Santa Cruz County in 2010.
Unemployment Rates in 2010, Santa Cruz County
Month Santa Cruz County
January 2010 15.3%
February 2010 15.1%
March 2010 14.8%
April 2010 14.7%
Arizona Workforce Informer. (2009). Local Area Unemployment Statistics: Special Unemployment Report. Available at <http://www.workforce.az.gov/?PAGEID=67&SUBID=160.
Children under 6 with all of their parents in the labor force
The majority of children in Santa Cruz County have both parents in the labor force. As of 2008, 57% of children under 6 years of age have both of their parents in labor force. This is an increase from 42% in 2007.
Housing foreclosures
Unemployment and poverty frequently contribute to housing instability. Foreclosure data suggests a significant amount of financial distress among Santa Cruz County residents. RealtyTrac rates housing foreclosure actions in the county as high. In January 2010, one in every 204 houses in the county received a foreclosure notice.
Regional Needs and Assets Report — Santa Cruz County Regional Partnership Council — 24

First Things First Arizona Early Childhood Health and Development Board
The following map shows variations in the rate of housing foreclosures within the county. The areas with the highest foreclosure rates are also areas with high unemployment rates.
RealtyTrac. (2010). Santa Cruz County, AZ Real Estate Trends. Available at < http://www.realtytrac.com/trendcenter/az/santa+cruz+county‐trend.html >.
In addition, a number of households appear to be contending with debt. As of 2008, 23% of housing units in Santa Cruz County with a mortgage also had a second mortgage and/or a home equity loan.
Monthly housing costs and percentage of household income
Renters also are struggling economically. As of 2000, 38% of renters in Santa Cruz County were spending 30% or more of their income on rent, a percentage of their income that is generally considered by HUD and other housing and social services experts to be a financial hardship.
Regional Needs and Assets Report — Santa Cruz County Regional Partnership Council — 25
First Things First Arizona Early Childhood Health and Development Board
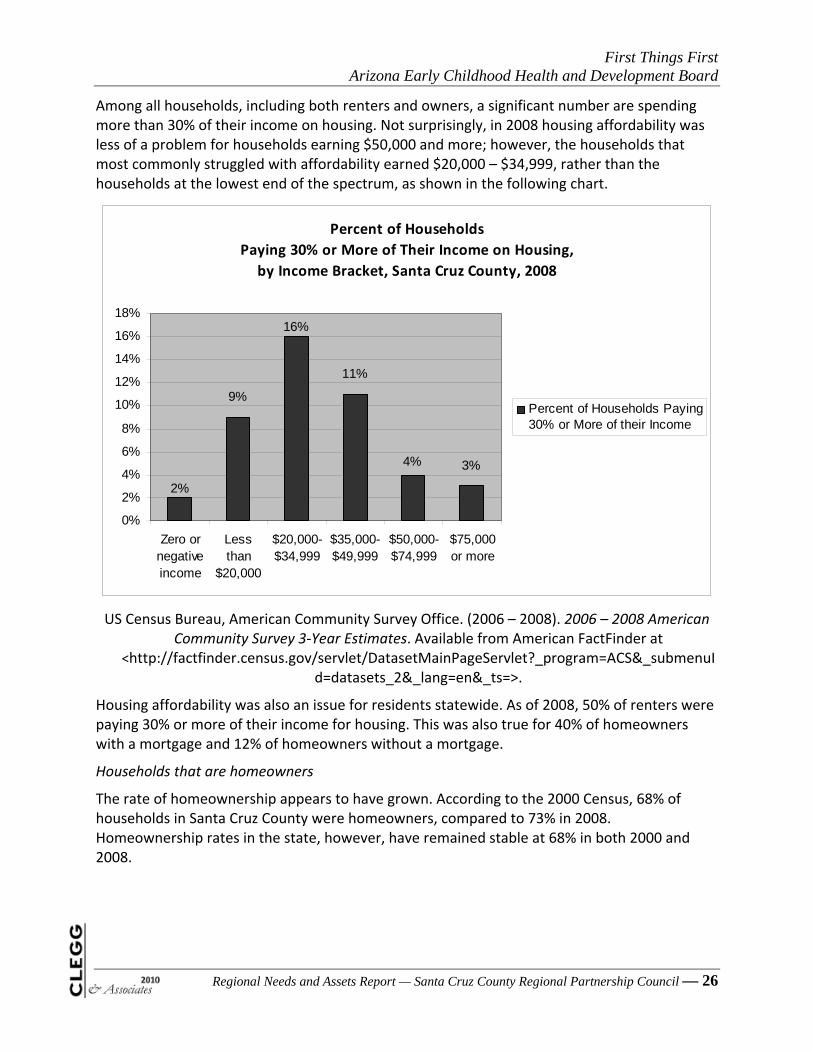
Among all households, including both renters and owners, a significant number are spending more than 30% of their income on housing. Not surprisingly, in 2008 housing affordability was less of a problem for households earning $50,000 and more; however, the households that most commonly struggled with affordability earned $20,000 – $34,999, rather than the households at the lowest end of the spectrum, as shown in the following chart.
Percent of Households
Paying 30% or More of Their Income on Housing,
by Income Bracket, Santa Cruz County, 2008
3%4%
16%
11%
9%
2%
0%
2%
4%
6%
8%
10%
12%
14%
16%
18%
Zero ornegativeincome
Lessthan
$20,000
$20,000-$34,999
$35,000-$49,999
$50,000-$74,999
$75,000or more
Percent of Households Paying30% or More of their Income
US Census Bureau, American Community Survey Office. (2006 – 2008). 2006 – 2008 American Community Survey 3‐Year Estimates. Available from American FactFinder at
<http://factfinder.census.gov/servlet/DatasetMainPageServlet?_program=ACS&_submenuId=datasets_2&_lang=en&_ts=>.
Housing affordability was also an issue for residents statewide. As of 2008, 50% of renters were paying 30% or more of their income for housing. This was also true for 40% of homeowners with a mortgage and 12% of homeowners without a mortgage.
Households that are homeowners
The rate of homeownership appears to have grown. According to the 2000 Census, 68% of households in Santa Cruz County were homeowners, compared to 73% in 2008. Homeownership rates in the state, however, have remained stable at 68% in both 2000 and 2008.
Regional Needs and Assets Report — Santa Cruz County Regional Partnership Council — 26
First Things First Arizona Early Childhood Health and Development Board
Regional Needs and Assets Report — Santa Cruz County Regional Partnership Council — 27
Education Trends
Overall, residents of Santa Cruz County have significantly lower levels of education than the state as a whole. Adults in Santa Cruz County are considerably less likely to have graduated from high school or obtained a college degree. There are differences in educational levels between men and women and between people speaking English and Spanish in the home. Women are more likely to graduate from high school, but less likely to go to college. People who speak English at home are more likely to graduate from high school and more likely to have a bachelors or higher degree.
Standardized testing, while a limited tool for measuring children’s skills, shows that children in Santa Cruz County may be entering kindergarten with comparatively high barriers for educational achievement, including being categorized as at some or high risk for not achieving at grade level. However, school participation seems to make a positive difference as test scores for third graders are considerably higher and are comparable to the state as a whole. One area where Santa Cruz County’s third graders test particularly well is their writing scores.
Within the county, however, there are very large differences between schools and students’ scores on literacy, math, reading, and writing tests. While some schools excel, many schools show high proportions of students who fail to meet state benchmarks on tests. Similarly, the state’s performance ratings for elementary schools in the county range from high performing to underperforming.
Adult education levels
Overall, education levels in Santa Cruz County are lower than the state average. Adults in the county are twice as likely to have less than a high school degree and are significantly less likely to have some college or a college degree. The following chart shows educational attainment for adults ages 25 and older in Santa Cruz County and Arizona.

First Things First Arizona Early Childhood Health and Development Board
Educational Attainment, Adults Ages 25 and Older
Santa Cruz County and Arizona, 2008
16%15%
31%33%
25%
32%
26%
16%
0%
5%
10%
15%
20%
25%
30%
35%
Less than highschool graduate
High schoolgraduate(including
equivalency)
Some college orassociates
degree
Bachelorsdegree or higher
Santa Cruz County
Arizona
US Census Bureau, American Community Survey Office. (2006 – 2008). 2006 – 2008 American Community Survey Educational Attachment. Available from American FactFinder at
<http://factfinder.census.gov/servlet/DatasetMainPageServlet?_program=ACS&_submenuId=datasets_2&_lang=en&_ts=>.
While women are more likely to finish high school, they are less likely than men to obtain a college education. The following table shows education levels for men and women in Santa Cruz County.
Educational Attainment, Santa Cruz County, 2008
Age 18 – 24 Age 25 and
Older
Educational Attainment Male Female Male Female
Less than high school graduate 42% 34% 32% 34%
High school graduate (including equivalency) 36% 39% 23% 36%
Some college or associates degree 19% 27% 18% 12%
Bachelors degree or higher 4% 0% 21% 12%
US Census Bureau, American Community Survey Office. (2006 – 2008). 2006 – 2008 American Community Survey Educational Attachment. Available from American FactFinder at
<http://factfinder.census.gov/servlet/DatasetMainPageServlet?_program=ACS&_submenuId=datasets_2&_lang=en&_ts=>.
Regional Needs and Assets Report — Santa Cruz County Regional Partnership Council — 28

First Things First Arizona Early Childhood Health and Development Board
People speaking English at home are considerably more likely to graduate from high school and obtain a bachelors or higher degree than people speaking Spanish at home in Santa Cruz County. As of 2008, only 7% of people speaking English at home had less than a high school degree, compared to 39% of people speaking Spanish at home.
Educational Attainment by Language Spoken at Home
Age 25 and Older, Santa Cruz County, 2008
37%
26%
31%
7%
11%
19%
30%
39%
0%
5%
10%
15%
20%
25%
30%
35%
40%
45%
Less thanhigh school
graduate
High schoolgraduate(including
equivalency)
Some collegeor associates
degree
Bachelorsdegree or
higher
People Speaking Only Englishat Home
People Speaking Spanish orSpanish Creole
US Census Bureau, American Community Survey Office. (2006 – 2008). 2006 – 2008 American Community Survey Educational Attachment. Available from American FactFinder at
<http://factfinder.census.gov/servlet/DatasetMainPageServlet?_program=ACS&_submenuId=datasets_2&_lang=en&_ts=>.
Births by educational attainment of mother
A significant proportion, 28%, of infants in Santa Cruz County are born to mothers with less than 12 years of education. The state average is slightly lower at 26%. Overall, mothers’ education levels in Santa Cruz County are similar but slightly lower than the state, as shown in the following table.
Regional Needs and Assets Report — Santa Cruz County Regional Partnership Council — 29

First Things First Arizona Early Childhood Health and Development Board
Regional Needs and Assets Report — Santa Cruz County Regional Partnership Council — 30
Percent of Births by Mother's Education, Santa Cruz County and Arizona, 2008
Mother's education
<8 8 9 – 11 12 13 – 16 17+ Unknown
Santa Cruz County 3% 2% 23% 34% 32% 6% 0%
Arizona 5% 2% 19% 30% 34% 8% 1%
Arizona Department of Health Services. (1998 – 2008). Arizona Vital Statistics: Birth Statistics. Available at < http://www.azdhs.gov/plan/index.htm >.
High school graduation rate
An average of 75% of all students in Arizona graduate from high school in four years, as of 2008. The school drop out rate for Santa Cruz County of 3.3% for the 2007 – 2008 school year is slightly better than the state average of 3.6%.
Graduation rates vary considerably among Santa Cruz County’s school districts, ranging from a high of 81% for the Nogales Unified School District to a low of 13% for Santa Cruz County Regional School District (an accommodation school program). The following table shows graduation rates for different districts within Santa Cruz County.
Four Year Graduation Rates, 2007
Nogales Unified District 81%
Patagonia Union High School District 68%
Pinnacle Education – Kino, Inc. 39%
Santa Cruz County Regional School District (Accommodation School) 13%
Santa Cruz Valley Unified District 76%
Arizona Department of Education, Research and Evaluation Section. (2009). 2008 – 2009 State Report Card. Available at < http://www.ade.az.gov/srcs/statereportcards/>.
In Arizona, there is a considerable gap between Native American students who graduate at a rate of 46%, Hispanic students at 61%, Asian students at 81%, and White students at 74%. In Santa Cruz County, the disparity between graduation rates for White and Hispanic students is less pronounced, but female students graduate at a considerably higher rate than male students among both White and Hispanic students. The following chart shows four year graduation rates for Santa Cruz County students.

First Things First Arizona Early Childhood Health and Development Board
Regional Needs and Assets Report — Santa Cruz County Regional Partnership Council — 31
Four Year Graduation Rates, Santa Cruz County, 2007
Total in Cohort Graduated
Graduation Rate
Hispanic Female 347 278 80%
Hispanic Male 362 248 69%
White Female 17 14 82%
White Male 24 17 71%
Arizona Department of Education, Research and Evaluation Section. (2007). Reports: Graduation Rates. Available at < http://www.ade.az.gov/researchpolicy/>.
Population enrolled in college
A significant number of Santa Cruz County residents are enrolled in college and graduate school. As of 2008, 1,764 county residents were enrolled in college and 180 in graduate or professional school.
Pre‐school and kindergarten enrollment
According to the 2008 American Community Survey, 20% of 3‐ and 4‐year‐olds in the county were enrolled in school and 99% of 5‐ to 9‐year‐olds. Pre‐school and kindergarten enrollment in Santa Cruz County increased in the early 2000s and has remained relatively stable since then. As of October 2009, there were 114 children ages 3 and older in Santa Cruz County who were enrolled in preschool and 779 enrolled in kindergarten.

First Things First Arizona Early Childhood Health and Development Board
Santa Cruz County: October Enrollment by Grade
114128111121116126171
84414546
779
679
760717
753788735
714740
709
574
0
100
200
300
400
500
600
700
800
900
1999 2000 2001 2002 2003 2004 2005 2006 2007 2008 2009
Pre-School
Kindergarten
Arizona Department of Education, Research and Evaluation Section. (2009). Reports: October 1st Enrollment Figures. Available at < http://www.ade.az.gov/researchpolicy/>.
Kindergarteners’ early literacy DIBELS scores
The Dynamic Indicators of Basic Early Literacy Skills (DIBELS) measures pre‐reading and early reading skills. DIBELS assesses only some aspects of students’ skills in language and literacy; it is not a full assessment of their readiness or skills. The measures are short tests and used regularly to monitor the development of early literacy skills. Not all school districts administer the DIBELS — this report presents information from the schools in Santa Cruz County that do.
Data from schools administering the DIBELS show improvement in scores from the beginning of the year to the end of the year. The following table indicates that only a small percentage of children beginning kindergarten (22% overall) in the Santa Cruz County School District are meeting the benchmark, defined as low‐risk. A higher number fall into the strategic category, defined as some risk; and the intensive category, defined as high risk of not achieving at grade level.
Regional Needs and Assets Report — Santa Cruz County Regional Partnership Council — 32

First Things First Arizona Early Childhood Health and Development Board
Regional Needs and Assets Report — Santa Cruz County Regional Partnership Council — 33
2008 – 2009 Kindergarten DIBELS Scores at Santa Cruz County School District Schools
School Beginning of the Year End of the Year
%
Benchmark%
Strategic%
Intensive%
Benchmark %
Strategic%
Intensive
Mountain View School 20% 41% 39% 54% 35% 12%
Pena Blanca Elementary School 17% 45% 38% 35% 23% 42%
San Cayetano Elementary School 27% 35% 38% 59% 21% 21%
Santa Cruz County School District 22% 39% 38% 47% 23% 31%
Santa Cruz County School District. (2009). District DIBELS Totals, 2008 – 2009. (Unpublished Data).
When tested at the end of the year, students most frequently fell in the benchmark (low risk) category. However, it should be noted that more than half of students remained in the strategic and intensive categories. The percentage of kindergartners meeting the benchmark in Santa Cruz County (47%) at the end of the year is much smaller than the average for Reading First schools in the state as a whole (87%).
Data from Nogales Unified School District schools are similar to schools in Santa Cruz County School District. The following table shows kindergartner’s entry scores on DIBELS tests. (Data from the end of the year is not yet available.)
2009 – 2010 Kindergarten DIBELS Scores at Nogales Unified School District Schools
Beginning of the Year
%
Benchmark%
Strategic%
Intensive
AJ Mitchell Elementary School 13% 44% 44%
Challenger Elementary School 12% 38% 51%
Lincoln Elementary School 10% 15% 75%
Mary L Welty Elementary School 11% 42% 47%
Robert Bracker Elementary 19% 38% 44%
Nogales Unified School District. (2010). District DIBELS Totals, 2009 – 2010. (Unpublished Data).

First Things First Arizona Early Childhood Health and Development Board
Regional Needs and Assets Report — Santa Cruz County Regional Partnership Council — 34
Third grade achievement scores — AIMS
The Arizona Instrument to Measure Standards (AIMS) tests third graders’ math, reading, and writing skills. Students are categorized as exceeding, meeting, approaching, or falling far below the state standards. Within Santa Cruz County, there were significant differences in students’ level of achievement on the test. For example, 88% of third graders at Elgin Elementary School passed or exceeded standards for math while only 37% of third graders did so at Lincoln Elementary School.
Overall, a higher percentage of students met or exceeded expectations for writing than for math and reading. While Santa Cruz County scores were comparable to the Arizona average overall, students scored considerably higher on the writing portion of the test than the state as a whole. The following chart shows AIMS scores for elementary schools in Santa Cruz County.
Percent of Third Graders Meeting or Exceeding
AIMS Standards, 2008
Math Reading Writing
AJ Mitchell Elementary School 59% 57% 83%
Challenger Elementary School 87% 80% 92%
Elgin Elementary School 88% 82% 94%
Lincoln Elementary School 37% 43% 79%
Little Red Schoolhouse 87% 92% 86%
Mary L Welty Elementary School 82% 75% 88%
Mexicayotl Charter School 54% 46% 54%
Montessori De Santa Cruz – St Ann’s Hall 42% 66% 75%
Mountain View School 60% 56% 76%
Pena Blanca Elementary School 47% 45% 58%
Robert Bracker Elementary 82% 79% 89%
San Cayetano Elementary School 53% 52% 68%
Vasquez De Coronado Francisco 79% 75% 89%
Average for Santa Cruz County Schools 71% 71% 86%
Arizona 71% 69% 72%
Arizona Department of Education, Research and Evaluation Services. (2008). AIMS Information Center. Available at < http://www.ade.az.gov/standards/default.asp>.
Students at Santa Cruz County School District schools include a large number of students with barriers that would impact their ability to perform well on tests. The following table shows

First Things First Arizona Early Childhood Health and Development Board
Regional Needs and Assets Report — Santa Cruz County Regional Partnership Council — 35
English Language Learners and students with autism or other language difficulties at elementary schools for which the information is available.
English Language Learners and Students with Autism and Other Language Difficulties at Santa Cruz County Schools, 2009 – 2010
School Total
Students
English Language Learners
Autistic or Other Language Difficulty
% of Students Learning English or With Autism or Other
Language Difficulty
Lincoln Elementary School 366 161 44 56%
Pena Blanca Elementary School 520 190 35 43%
San Cayetano Elementary School 605 223 67 48%
Arizona Department of Education. (2010). ADE Student Demographics data pulled on April 13, 2010. (Unpublished Data).
Lack of proficiency in English is a significant barrier to educational success. Only 48% of students with limited English proficiency graduate from high school in four years in Arizona.
School performance ratings
Arizona schools are assigned an AZ Learns achievement profile and a determination of whether they are adequately meeting Adequate Yearly Progress (AYP) measures of performance, as mandated by the No Child Left Behind Act. According to AZ Learns achievement profiles and AYP measures, schools in Santa Cruz County vary dramatically in their performance — from Pena Blanca Elementary School, which is rated as Underperforming, to Vasquez De Coronado Francisco School, Little Red Schoolhouse, and Elgin Elementary School, which are rated as Highly Performing. None of the schools in Santa Cruz County fall within the lowest (Failing to Meeting the Academic Standards) or highest (Excelling) performance categories. The following table shows the performance ratings for each school.

First Things First Arizona Early Childhood Health and Development Board
Regional Needs and Assets Report — Santa Cruz County Regional Partnership Council — 36
Santa Cruz County School Performance, 2008 – 2009
School Achievement Profile AYP
Determination
AJ Mitchell Elementary School Performing Plus Yes
Challenger Elementary School Performing Yes
Elgin Elementary School Highly Performing Yes
Lincoln Elementary School Underperforming No
Little Red Schoolhouse Highly Performing Yes
Mary L Welty Elementary School Performing Plus Yes
Mexicayotl Charter School Performing Yes
Montessori De Santa Cruz – St Ann's Hall Performing Yes
Mountain View School Performing Yes
Patagonia Elementary School Performing Yes
Patagonia Montessori School Performing Yes
Pena Blanca Elementary School Underperforming No
Pimeria Alta Academy Performing Yes
Robert Bracker Elementary Performing Plus Yes
San Cayetano Elementary School Performing No
Vasquez De Coronado Francisco School Highly Performing Yes
Arizona Department of Education, Research and Evaluation Section. (2009). 2008 – 2009 State Report Card. Available at < http://www.ade.az.gov/srcs/statereportcards/>.
Student‐teacher ratio
In the 2007 – 2008 school year, the most recent data available, the student‐teacher ratio for Santa Cruz County was 18 students per teacher, lower than the state average of 21. Arizona ranks second to last in the nation in student‐teacher ratio.

First Things First Arizona Early Childhood Health and Development Board
Regional Needs and Assets Report — Santa Cruz County Regional Partnership Council — 37
Demographic, Economic, and Education Issues of Importance for the Regional Partnership Council
The population in Santa Cruz County is growing, particularly in unincorporated areas of the county where access to services for children and families is more limited than in established communities and where transportation may pose an additional barrier to families seeking assistance.
The region’s population is principally Hispanic, an historical trend — not a new one. The large number of Hispanic families represented in the population warrants attention to ensuring that services are available and accessible for those who are predominantly Spanish‐speaking. Children raised with the capacity to speak more than one language may have advantages as they move through school and into the job world, but Spanish‐speaking parents in need of assistance may not get it, potentially jeopardizing the successful development of that same child.
Ensuring that schools are able to address the needs of young children from Spanish‐speaking families will be important to supporting these children’s academic achievement. Assisting students with limited English proficiency is essential if they are to achieve a basic education that enables them to earn a good living.
A cause for optimism is the level of achievement demonstrated by test scores among third grade students in many Santa Cruz County elementary schools. Although test scores among entering kindergarteners are low, they improve by third grade, catching up to and sometimes surpassing the state averages in math, reading, and writing.
The number of births to unwed mothers in Nogales, and to a lesser degree in Rio Rico, is an issue. Although the rates are not out of keeping with the remainder of the state; they are high in these communities, and research has established that children raised in single parent families are more likely to grow up in poverty than those with two parents. It is critical that these mothers and children have access to basic income supports, services available for low‐income families, and the developmental programs targeting young children.
The high level of poverty in the county is of significant concern given the wide range of impacts this can have on young children. Providing the basics of shelter and food is a major problem for these families. And when they are paying more than a third of their income for housing, it seriously limits their ability to buy groceries, medicines, and other essentials. Low educational achievement combined with a poor job market limits the earning power of many individuals in the county, making it difficult to imagine that poverty trends can be reversed without efforts to support education and career development. In the meantime, assisting low‐income families and children with access to the benefits they are eligible for is crucial to ensuring children have basic food, shelter, and medical care.
Longer term and more substantial efforts, including economic development and affordable housing initiatives, would be needed to make significant improvements on the standard of living for many children in the region.

First Things First Arizona Early Childhood Health and Development Board
Regional Needs and Assets Report — Santa Cruz County Regional Partnership Council — 38
3 — Early Care and Education
Quality and Access to Child Care
A variety of types of early childhood care and education centers exist in Santa Cruz County, including regulated and unregulated facilities. Because not all facilities are licensed or registered, the total number is unknown. Data are available for licensed centers, small group homes, alternately approved family child care homes, and unregulated providers who voluntarily register with the state’s Child Care Resource and Referral Service.
Much of the data available comes from the Child Care Market Rate Survey conducted by the Arizona Department of Economic Security (DES), which includes licensed centers providing fee‐paying child care, Head Start programs with fee‐paying wraparound care, small group homes, family child care providers certified by DES and approved for the Child and Adult Care Food Programs, and unregulated providers who voluntarily register to be listed. This section of the report presents the data that they self‐report on service levels and costs.
Child care centers and homes in Santa Cruz County provide services to all age groups. However, most centers do not provide services 24 hours a day and many do not provide services seven days a week. As more children receive care at centers than approved homes, this likely creates gaps in access to care based on time of day and day of week. Cost is also an access issue likely affecting many families in the county.
Among the licensed and registered facilities, the great majority are located in Nogales and Rio Rico. This corresponds with the population centers of Santa Cruz County. It is reasonable to assume that throughout the county there are a significant number of additional unregulated providers who have chosen not to register with the Child Care Resource and Referral Service, particularly, smaller scale family businesses.
Number of child care centers, certified group homes, approved homes, and unregulated homes
As previously noted, the total number of child care centers and homes is unknown, because data are available only for facilities that are licensed and approved and for homes that voluntarily register with the Child Care Resource and Referral Service. However, based on the data available, Santa Cruz County has 17 child care centers and 67 approved child care homes as of 2010. The licensed centers include:
Lourdes Catholic Elementary School
Smart Kids Preschool
Sunshine Preschool
Early Learning Center at Lincoln School
Patagonia Montessori School
San Cayetano Preschool

First Things First Arizona Early Childhood Health and Development Board
Regional Needs and Assets Report — Santa Cruz County Regional Partnership Council — 39
Early Reading First Preschool
First Steps Daycare & Preschool Learning Center
St Andrew's Preschool & Child Care Center
Rainforest Montessori Preschool & Daycare Center, Inc
Small Steps Child Care
Sonshine Christian Preschool
Montessori de Santa Cruz
Dinobones Preschool & Day Care
Head Start – Nogales Neighborhood
Head Start – Challenger
Head Start – Western
Head Start – Rio Rico
The centers are approved to care for a total of 941 children, and the homes for a total of 273 children. However, as shown in the following table, the average number of children served is lower, as of 2008 — the last year for which average service level data is available.
Number and Capacity of Centers and Homes, Santa Cruz County, 2008
Total
NumberApproved Number
of Children Average Number of Children Served
Centers 9 484 351
Homes 66 287 253
Arizona Department of Economic Security. (2008). DES Reports. Available at < https://www.azdes.gov/appreports.aspx?Category=73>.
While the number of licensed child care centers in Santa Cruz County has increased, the number of approved homes has decreased. As shown in the following table, the number of child care centers increased by 113% between 2004 and 2010, the number of approved family child care homes decreased by 47%.

First Things First Arizona Early Childhood Health and Development Board
Regional Needs and Assets Report — Santa Cruz County Regional Partnership Council — 40
Number of Centers and Homes, Santa Cruz County, 2004 – 2010
Licensed Centers Approved Family Child Care Homes
2004 8 125
2006 10 67
2008 9 66
2010* 17 67 * 2010 data is from a data analysis conducted in April 2010 by Child Care Resource and Referral. The analysis is for the Santa Cruz region, rather than the county.
Arizona Department of Economic Security. (2008). DES Reports. Available at < https://www.azdes.gov/appreports.aspx?Category=73>.
While the total number of licensed centers and approved homes has decreased since 2004, the average number of children served at the individual facilities has increased. Interestingly, despite steady growth in the number of children 0 – 5 in the county, the average number of children served peaked in 2006. This may point to barriers encountered, such as families’ inability to pay child care costs. The following chart shows children served over time.
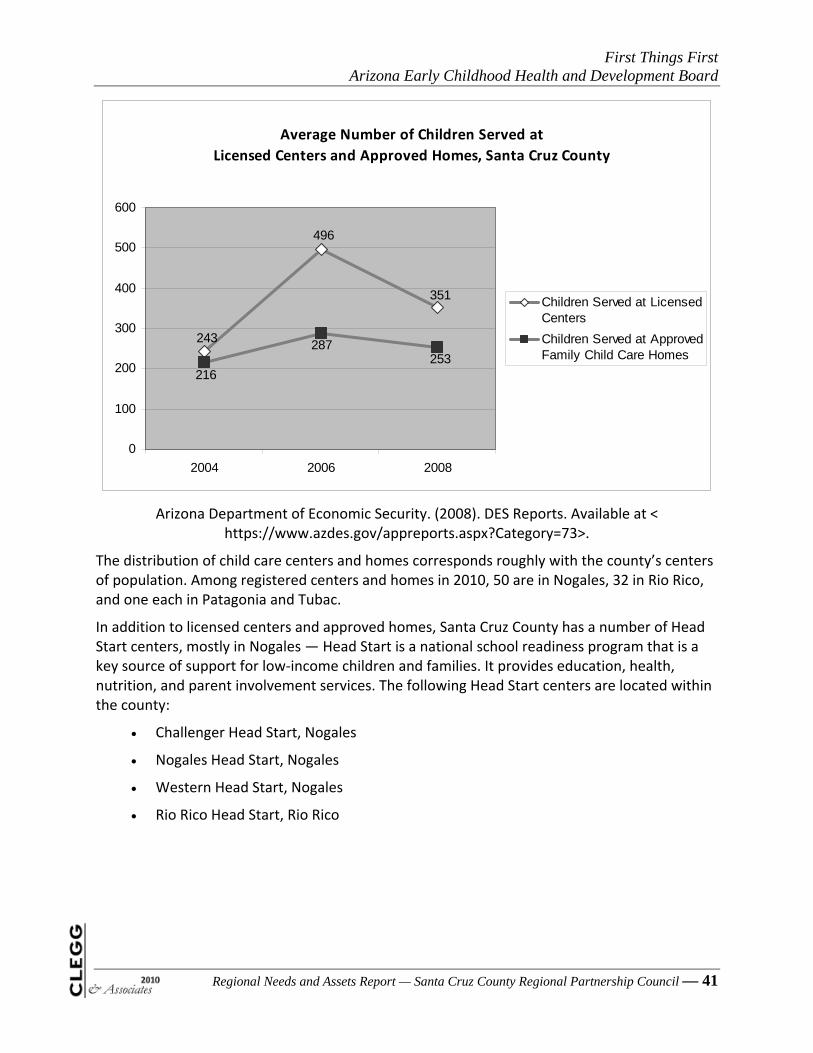
First Things First Arizona Early Childhood Health and Development Board
Average Number of Children Served at
Licensed Centers and Approved Homes, Santa Cruz County
351
496
243
253287
216
0
100
200
300
400
500
600
2004 2006 2008
Children Served at LicensedCenters
Children Served at ApprovedFamily Child Care Homes
Arizona Department of Economic Security. (2008). DES Reports. Available at < https://www.azdes.gov/appreports.aspx?Category=73>.
The distribution of child care centers and homes corresponds roughly with the county’s centers of population. Among registered centers and homes in 2010, 50 are in Nogales, 32 in Rio Rico, and one each in Patagonia and Tubac.
In addition to licensed centers and approved homes, Santa Cruz County has a number of Head Start centers, mostly in Nogales — Head Start is a national school readiness program that is a key source of support for low‐income children and families. It provides education, health, nutrition, and parent involvement services. The following Head Start centers are located within the county:
Challenger Head Start, Nogales
Nogales Head Start, Nogales
Western Head Start, Nogales
Rio Rico Head Start, Rio Rico
Regional Needs and Assets Report — Santa Cruz County Regional Partnership Council — 41

First Things First Arizona Early Childhood Health and Development Board
Regional Needs and Assets Report — Santa Cruz County Regional Partnership Council — 42
Number of children cared for at child care centers and approved homes
Arizona’s Child Care Market Rate Survey asks child care centers and homes to voluntarily self‐report on their service levels and costs. The responses they provide are analyzed by the Department of Economic Survey only at the district level, and not for individual counties. Santa Cruz County’s child care centers and homes are included within District 6, which also includes Cochise, Graham, and Greenlee Counties. Child care centers in District 6 tend to be smaller than those in the rest of the state. As seen in the table below, child care centers in Santa Cruz County most frequently serve between 11 and 20 children per day. In comparison, when looking at child care centers statewide, centers most frequently serve between 51 and 100 children.
Number of Children Cared for at Each Child Care Center on an Average Day, 2008
Average Number of Children
District 6 (Cochise, Graham, Greenlee, Santa Cruz) State of Arizona
Number % Number %
1 – 10 0 0% 35 2%
11 – 20 13 30% 179 10%
21 – 30 5 11% 254 14%
31 – 40 9 20% 223 12%
41 – 50 6 14% 234 13%
51 – 100 7 16% 641 35%
101 – 150 1 2% 169 9%
151 – 200 2 5% 68 4%
201 + 1 2% 39 2%
Total 44 100% 1842 100%
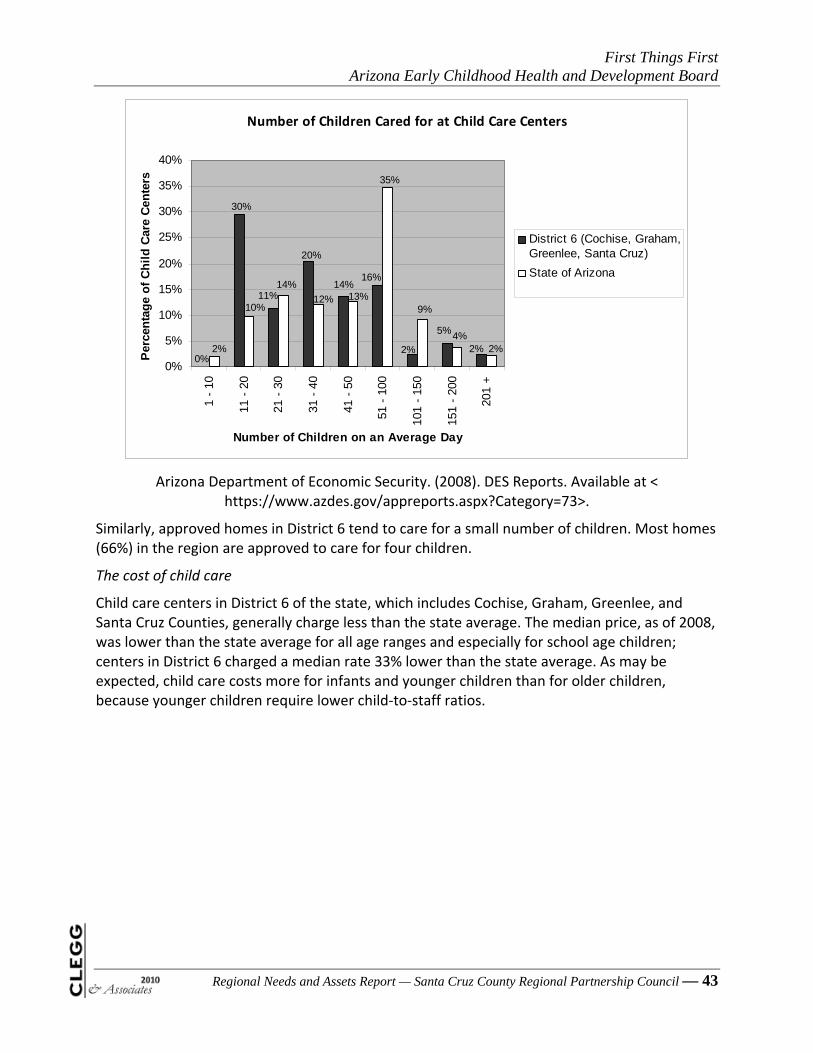
First Things First Arizona Early Childhood Health and Development Board
Number of Children Cared for at Child Care Centers
2%
5%
2%
16%14%
20%
11%
30%
0%2%
4%
9%
35%
13%12%
14%
10%
2%
0%
5%
10%
15%
20%
25%
30%
35%
40%
1 -
10
11 -
20
21 -
30
31 -
40
41 -
50
51 -
100
101
- 15
0
151
- 20
0
201
+
Number of Children on an Average Day
Per
cen
tag
e o
f C
hil
d C
are
Cen
ters
District 6 (Cochise, Graham,Greenlee, Santa Cruz)
State of Arizona
Arizona Department of Economic Security. (2008). DES Reports. Available at < https://www.azdes.gov/appreports.aspx?Category=73>.
Similarly, approved homes in District 6 tend to care for a small number of children. Most homes (66%) in the region are approved to care for four children.
The cost of child care
Child care centers in District 6 of the state, which includes Cochise, Graham, Greenlee, and Santa Cruz Counties, generally charge less than the state average. The median price, as of 2008, was lower than the state average for all age ranges and especially for school age children; centers in District 6 charged a median rate 33% lower than the state average. As may be expected, child care costs more for infants and younger children than for older children, because younger children require lower child‐to‐staff ratios.
Regional Needs and Assets Report — Santa Cruz County Regional Partnership Council — 43

First Things First Arizona Early Childhood Health and Development Board
Regional Needs and Assets Report — Santa Cruz County Regional Partnership Council — 44
Median Rate Charged Per Day by Centers for Full‐Time (6 or more hours) Child Care
District 6 (Cochise, Graham, Greenlee,
Santa Cruz) State of Arizona
% Difference in Median Price
Under 1 $29.00 $36.80 ‐27%
1 – 2 Year Olds $25.20 $32.55 ‐29%
3 – 5 Year Olds $24.00 $28.14 ‐17%
School Age $19.00 $25.20 ‐33%
Arizona Department of Economic Security. (2008). DES Reports. Available at < https://www.azdes.gov/appreports.aspx?Category=73>.
Child care costs within the region, however, have increased over time. For example, while a family with a preschooler paid an average of $17 per day for full‐time care in 2004, the average in 2008 was considerably higher at $21. Costs have increased for all age groups and for all types of providers. The following chart shows average daily costs for the different types of facilities and age groups, as well as costs for full time compared to part time care.
First Things First Arizona Early Childhood Health and Development Board
Regional Needs and Assets Report — Santa Cruz County Regional Partnership Council — 45
Average Daily Cost of Early Care and Education, District 6
Type of Facility Infants Toddlers Preschoolers
Full Time Daily Cost of Care — $21.00 $21.00 Licensed centers
Part Time Daily Cost of Care — $15.00 $15.00
Full Time Daily Cost of Care $20.00 $20.00 $20.00 DES certified family child care homes
Part Time Daily Cost of Care $11.00 $11.00 $11.00
Full Time Daily Cost of Care $19.00 $19.00 $19.00
2008
DES certified in home providers
Part Time Daily Cost of Care $8.00 $8.00 $8.00
Full Time Daily Cost of Care $16.00 $18.00 $18.00 Licensed centers
Part Time Daily Cost of Care $24.00 $17.00 $17.00
DHS certified group homes
Part Time Daily Cost of Care — $8.00 $8.00
Full Time Daily Cost of Care $18.00 $17.00 $17.00 DES certified family child care homes
Part Time Daily Cost of Care $10.00 $10.00 $10.00
2006
DES certified in home providers
Full Time Daily Cost of Care $15.00 $15.00 $15.00
Full Time Daily Cost of Care — $18.00 $17.00 Licensed centers
Part Time Daily Cost of Care $15.00 $13.00 $12.00
DHS certified group homes
Part Time Daily Cost of Care — — $10.00
Full Time Daily Cost of Care $16.00 $16.00 $16.00 DES certified family child care homes
Part Time Daily Cost of Care $8.00 $9.00 $8.00
2004
DES certified in home providers
Part Time Daily Cost of Care — — $10.00
First Things First. (2010). Regional Profiles. (Unpublished Data).
Obtaining child care at approved homes tends to be slightly less expensive than licensed child care centers in the region, with the exception of school age children. The following table shows daily costs for full‐time care by age group and type of facility.

First Things First Arizona Early Childhood Health and Development Board
Regional Needs and Assets Report — Santa Cruz County Regional Partnership Council — 46
Median Daily Rates for Centers and Approved Homes, District 6, 2008
Centers Approved Homes Difference in Median Price
Under 1 $29.00 $23.44 19%
1 – 2 Year Olds $25.20 $21.70 14%
3 – 5 Year Olds $24.00 $20.00 17%
School Age $19.00 $20.00 5%
Arizona Department of Economic Security. (2008). DES Reports. Available at < https://www.azdes.gov/appreports.aspx?Category=73>.
Within Santa Cruz County, there does not appear to be a significant difference in child care costs based on location. Available data show that the average cost for full‐time child care in Nogales is $105, compared to $110 in Rio Rico.
Given the county’s low median income and the costs for care, child care is not affordable for many families. Compounding this difficulty, the number of families receiving Child Care Assistance subsidies from the state has decreased, both in Santa Cruz County and the state as a whole, due to budget cuts. Families are increasingly placed on a waiting list or turned away from the program. The table below provides the most recent information available about subsidy assistance.
Families and Children 0 – 5 Receiving Child Care Assistance Subsidy
January 2009 June 2009 January 2010
Number of
Families
Number of
Children
Number of
Families
Number of
Children
Number of
Families
Number of
Children
Santa Cruz County 161 204 136 174 87 116
Arizona Total 21,378 29,011 17,155 24,184 13,014 17,856
Arizona Department of Economic Security. (2007, 2009). DES Multidata pulled on May 4, 2010 from Database. (Unpublished Data).
Compared to most child care centers statewide, centers in District 6 are less likely to offer a discount for a second child. While 63% of centers statewide offered a discount for a second child, as of 2008, only 45% of centers in District 6 offered a discount. The centers in the district

First Things First Arizona Early Childhood Health and Development Board
Regional Needs and Assets Report — Santa Cruz County Regional Partnership Council — 47
that fail to offer this discount may be located outside of Santa Cruz County. The majority of homes providing child care in District 6 and the state as a whole offer a discount for a second child (52% and 56%, respectively).
Number of child care centers and approved homes offering late night, all night, weekend, or extended care
Only a small number of child care centers in District 6 offer late night, all night, weekend, or extended care. Approved homes were considerably more likely to offer these services. More than half of approved homes offered late night care and nearly half provided all night and weekend care, as of 2008. Most homes provided these services for no extra fee. Except for one center, there was no extra fee for these services as of 2008.
Key informant interviews: perceptions of availability and access
Staff at community health centers report that only a small portion of the county’s 0 – 5 population attend either a day care home, center, or preschool. Staff report that the children who are able to obtain this care are either in families with the resources to pay for the care or eligible for their care through the Department of Economic Security, leaving a large number of families unable to afford child care. In addition, those interviewed believe that families are more likely to hire a “babysitter” from across the Mexican border to do household chores like cleaning and ironing while keeping an eye on their children.
Additionally, people interviewed raised concerns about budget cuts reducing the early childhood system’s capacity to reach families. The reductions to the Early Childhood Education Program have resulted in the closing of preschools and reduced outreach programs, which help parents gain access to services.
Parents’ perceptions of services
The 2008 Family and Community Survey, which was administered to parents and caregivers statewide by First Things First, asked parents of children ages 0 – 5 a series of questions about the early childhood services they received, which include both child care and early education programs. Parents’ responses are grouped by region for larger counties, but not for small regions such as Santa Cruz County, which are reported only at the district level. Overall, parents in Santa Cruz County’s region, District 6, reported a high level of satisfaction. For example, 81% of surveyed parents in the district reported that it is easy to locate the services that they need or want. Additionally, 79% of surveyed parents in the district reported that available services are very good. It is encouraging that, despite the high numbers of families speaking languages other than English, only a small percentage (7%) of parents found that service providers do not speak their language or that materials are not in their language. However, a majority (57%) of parents in the district reported that services are not available at times and at locations that are convenient. This suggests that there are gaps in many parents’ ability to access services.
Number of centers and homes enrolled in Quality First
The Quality First system is a statewide quality improvement initiative that rates the quality of early care and education. The system is intended to help families, communities, and early childhood professionals to assess and improve the quality of care that they provide. Two

First Things First Arizona Early Childhood Health and Development Board
Regional Needs and Assets Report — Santa Cruz County Regional Partnership Council — 48
centers and four homes in Santa Cruz County are participating in the Quality First initiative, including:
Sonshine Christian Preschool, Nogales
NUSD Early Learning Center, Nogales
Leon Montessori Child Care, Nogales
Ana Velasco, Rio Rico
Danira Esparza, Nogales
Maria Bustamante, Nogales

First Things First Arizona Early Childhood Health and Development Board
Regional Needs and Assets Report — Santa Cruz County Regional Partnership Council — 49
Professional Development in Child Care Settings
The majority of child care teachers and assistants in Santa Cruz County and in Arizona do not have a degree beyond high school. Child care teachers in Santa Cruz County bring slightly higher levels of education to their positions than the state average, while assistants in Santa Cruz County tend to have slightly less education than the state average.
Child care professionals in Santa Cruz County are paid less than the state average across all categories of child care. Child care wages dropped in Santa Cruz County between 2004 and 2007. This low level of compensation is important as it may well create barriers to recruiting and retaining high quality child care staff in the county.
Child care professionals’ educational background
Child care teachers in Santa Cruz County are more likely to hold a degree than their counterparts in the state as a whole. Assistants, however, are slightly less educated than the state average. However, both teachers and assistants are more likely to hold a Child Development Associates (CDA) degree in Santa Cruz County. This may be due to the presence of a 30 hour CDA program at Central Arizona College within the county, as well as child development associate degree programs at Pima Community College and Cochise College.
However, a significant number of child care professionals — 50% of teachers and 87% of assistants — hold no degree at all. Only 22% of teachers and 6% of assistants have a bachelors degree. The following table shows child care professionals’ educational background as of 2007.
Child Care Professionals' Educational Background, 2007
Type of degree
Santa Cruz County Child Care Teachers
Arizona Child Care Teachers
Santa Cruz County Child Care Assistants
Arizona Child Care Assistants
None 50% 61% 87% 82%
CDA 18% 9% 10% 7%
Associates 22% 15% 6% 8%
Bachelors 22% 19% 6% 7%
Masters 6% 6% 0% <1%
Arizona First Things First, Santa Cruz County Regional Partnership Council. (2008). Reports and Publications: Santa Cruz Need and Assets Report 2008. Available at <http://www.azftf.gov/RC020/Pages/ReportsAndPublications.aspx>.
The ability of child care professionals to obtain advanced degrees may be limited by the availability of professional development options. While local colleges offer a Child Development Associates degree, the cost of credits and a fee for the actual certificate may pose barriers to completion.

First Things First Arizona Early Childhood Health and Development Board
Regional Needs and Assets Report — Santa Cruz County Regional Partnership Council — 50
TEACH Arizona scholarships provide financial support for child care professionals to pursue an Early Childhood Associates Degree. As of 2010, 10 child care professionals in the Santa Cruz region were receiving TEACH scholarships.
Average wages for child care professionals
Child care is not a highly paid industry almost anywhere in the US. However, data for 2007 shows a startling drop in average hourly wages for child care teachers and even more so for teacher/directors in Santa Cruz County. While average hourly wages in 2004 for Santa Cruz County professionals was comparable and in some categories slightly higher than state averages, by 2007 Santa Cruz wages had uniformly dropped below state averages. The following table shows average hourly wages by type of child care professional.
Average Hourly Wages for Child Care Professionals
Santa Cruz Regional Council Arizona
2004 2007 2004 2007
Assistant Teachers $8.03 $8.69 $8.02 $9.00
Teachers $13.48 $11.00 $11.62 $11.80
Administrative Directors $21.36 NA $19.03 NA
Teacher Directors $19.21 $12.24 $13.35 $14.84
Arizona First Things First, Santa Cruz County Regional Partnership Council. (2008). Reports and Publications: Santa Cruz Need and Assets Report 2008. Available at <http://www.azftf.gov/RC020/Pages/ReportsAndPublications.aspx>.
First Things First Arizona Early Childhood Health and Development Board
Regional Needs and Assets Report — Santa Cruz County Regional Partnership Council — 51
Early Childhood Care and Education Issues of Importance for the Regional Partnership Council
Santa Cruz County contains a variety of different types of child care homes and centers. However, because not all facilities are licensed or registered, the total number and their locations and characteristics are unknown. Most of the county’s licensed and registered facilities are in Nogales and Rio Rico, but it is reasonable to assume that there are a significant number of smaller‐scale family businesses throughout the county that have chosen not to register with the Child Care Resource and Referral Service.
Most children do not attend a day care home or center. This is in large part a cost issue. While Santa Cruz County child care centers generally charge less than the state average, costs have increased over time and the county is home to a large number of low‐income households and families living in poverty. Many parents are not able to afford child care, which leaves them without access to some of the early childhood development learning and school readiness services that are available through quality centers.
Funding cuts to the state’s Child Care Assistance program will further limit the number of families able to pay for child care. Despite steady growth in the county’s population of children 0 – 5, the average number of children served at child care homes and centers has decreased since 2006, which may be related to families inability to pay child care costs.
In addition, many families do not believe that paying for child care is a reasonable cost, particularly when they can obtain less expensive services from a babysitter, who is also doing many household chores. However, because their attention is divided and they are not trained in early education, babysitters likely do not provide children with the type of engagement that they would receive from a professional at a child care center or home.
Staff at child care agencies in Santa Cruz County are paid low wages. While this is common throughout the nation, average hourly wages for child care teachers and directors in Santa Cruz County have actually decreased. Low compensation likely presents barriers to recruiting and retaining high quality child care staff.
Professional development opportunities for child care staff are important because they play a vital role in preparing young children for their school years. Most child care teachers and assistants in Santa Cruz County do not have a degree beyond high school. While Central Arizona College offers a child development associates degree, the cost of credits and a fee for the actual certificate pose barriers to completion.

First Things First Arizona Early Childhood Health and Development Board
Regional Needs and Assets Report — Santa Cruz County Regional Partnership Council — 52
4 — Supporting Families
Support Service Availability
Accessibility of social and recreational services in the county
Santa Cruz County has a number of social and recreational services that support families, ranging from food banks to legal services, to libraries. However, services are not evenly distributed throughout the county. A large number of social services agencies are located in Nogales with far fewer throughout the rest of the county. Rio Rico, despite being the second largest community within the county, is home to comparatively few social services agencies. Smaller communities, such as Patagonia and Tubac, also have relatively few social services locally available. Feedback from surveyed parents confirms that accessibility to services is a problem for some families in the region.
Preschools, Head Start, and child care centers and homes throughout the county work directly with children and families on early childhood education. However, First Things First is the only organization in the county primarily dedicated to bringing attention to and improving early childhood development and parenting, with the exception of parenting trainings provided through Child Protective Services, preschools, and the Mariposa Community Health Center.
Services available for children and families
Santa Cruz County has a variety of service agencies providing a wide range of different services for children and families, including basic human services, such as food and housing, as well as services particularly aimed at children and families, such as parent skills training, early education, and nutrition assistance. However, recent funding cutbacks have reduced the availability of many services. Nogales is by far the most common location for social services agencies in the county. Few social services agencies are located in Rio Rico, despite its relatively large population, and fewer still in the smaller communities. The county’s social services agencies include organizations that address:
behavioral health services
child abuse and domestic violence
emergency and law enforcement
disability services
economic development
education programs and parent skills training
employment services
financial assistance
food banks and nutrition programs

First Things First Arizona Early Childhood Health and Development Board
Regional Needs and Assets Report — Santa Cruz County Regional Partnership Council — 53
health care
housing assistance
immigration
individual and family counseling
legal assistance
senior services
substance abuse
Emergency housing is an area where the county’s resources for families seem to be particularly scarce. Only Crossroads Nogales Mission serves homeless families. Many of Santa Cruz County’s housing agencies focus on helping low‐income families pursue homeownership, which is important, but does not meet the needs of families with immediate housing needs. In addition, resources for substance abuse and addiction appear to be slim.
Recreational services in the area provide opportunities for children and families through organizations that include:
art and museums
libraries
nature trails and other environmentally‐oriented activities
parks and other recreation
Community resource guides list an abundance of recreation opportunities, particularly related to art and nature. Because of the county’s geography and population distribution, recreation resources do not correlate with population centers. For example, Patagonia has a variety of arts and nature opportunities while Nogales and Rio Rico offer fewer.
The First Things First 2008 Family and Community Survey asked parents about their satisfaction with services and their ability to access them. Santa Cruz County’s parents’ responses are represented within the District 6 region and are not available for the county alone. Overall, parents who completed the survey provide mixed feedback about the availability of services, both in District 6 and throughout Arizona. While most parents agree that it is easy to locate services, a majority also agree that services are not available at times or locations that are convenient. The perception that services are not available at convenient times or locations is more prevalent in District 6 than is true for the state.
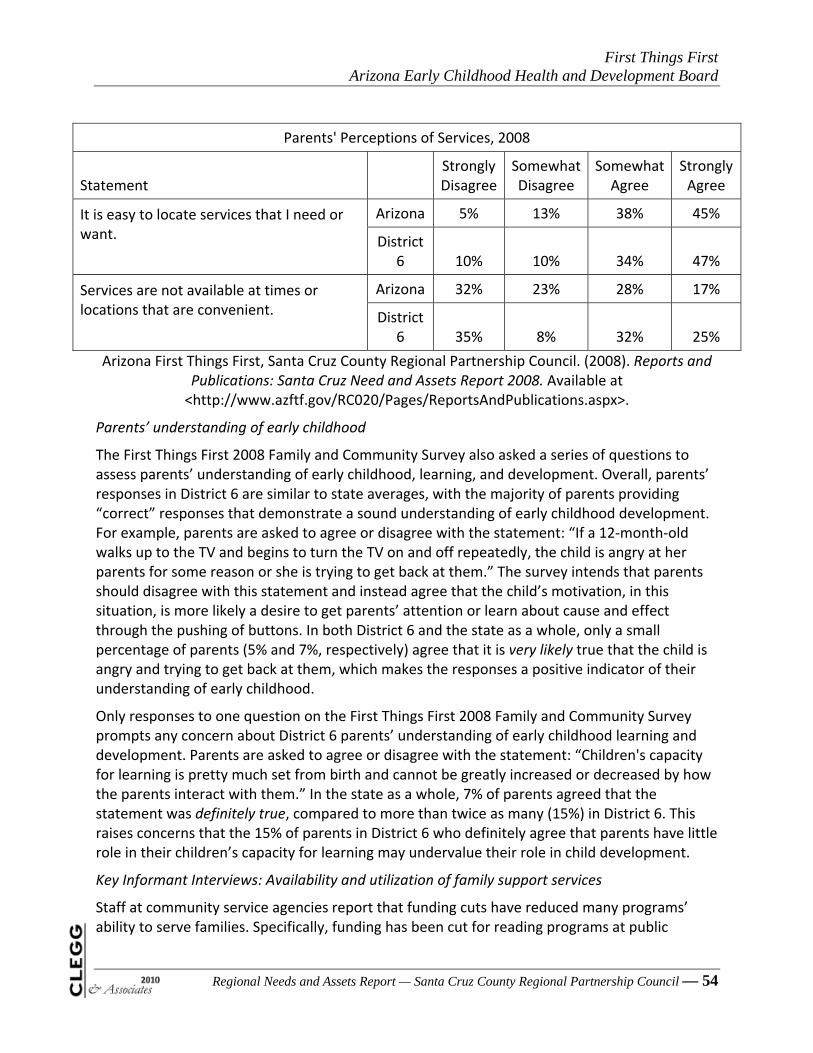
First Things First Arizona Early Childhood Health and Development Board
Regional Needs and Assets Report — Santa Cruz County Regional Partnership Council — 54
Parents' Perceptions of Services, 2008
Statement Strongly Disagree
Somewhat Disagree
Somewhat Agree
Strongly Agree
Arizona 5% 13% 38% 45% It is easy to locate services that I need or want.
District
6 10% 10% 34% 47%
Arizona 32% 23% 28% 17% Services are not available at times or locations that are convenient.
District
6 35% 8% 32% 25%
Arizona First Things First, Santa Cruz County Regional Partnership Council. (2008). Reports and Publications: Santa Cruz Need and Assets Report 2008. Available at <http://www.azftf.gov/RC020/Pages/ReportsAndPublications.aspx>.
Parents’ understanding of early childhood
The First Things First 2008 Family and Community Survey also asked a series of questions to assess parents’ understanding of early childhood, learning, and development. Overall, parents’ responses in District 6 are similar to state averages, with the majority of parents providing “correct” responses that demonstrate a sound understanding of early childhood development. For example, parents are asked to agree or disagree with the statement: “If a 12‐month‐old walks up to the TV and begins to turn the TV on and off repeatedly, the child is angry at her parents for some reason or she is trying to get back at them.” The survey intends that parents should disagree with this statement and instead agree that the child’s motivation, in this situation, is more likely a desire to get parents’ attention or learn about cause and effect through the pushing of buttons. In both District 6 and the state as a whole, only a small percentage of parents (5% and 7%, respectively) agree that it is very likely true that the child is angry and trying to get back at them, which makes the responses a positive indicator of their understanding of early childhood.
Only responses to one question on the First Things First 2008 Family and Community Survey prompts any concern about District 6 parents’ understanding of early childhood learning and development. Parents are asked to agree or disagree with the statement: “Children's capacity for learning is pretty much set from birth and cannot be greatly increased or decreased by how the parents interact with them.” In the state as a whole, 7% of parents agreed that the statement was definitely true, compared to more than twice as many (15%) in District 6. This raises concerns that the 15% of parents in District 6 who definitely agree that parents have little role in their children’s capacity for learning may undervalue their role in child development.
Key Informant Interviews: Availability and utilization of family support services
Staff at community service agencies report that funding cuts have reduced many programs’ ability to serve families. Specifically, funding has been cut for reading programs at public
First Things First Arizona Early Childhood Health and Development Board
Regional Needs and Assets Report — Santa Cruz County Regional Partnership Council — 55
libraries — reducing children’s access to reading and literacy programs — and outreach programs that previously informed parents about developmental issues.
Those interviewed confirmed that, geographically, access varies for the different communities within Santa Cruz County. They pointed out that Patagonia, Tucumcacori, Tubac, Sonoita, and Elgin, being smaller communities, simply have fewer services available. They also noted that the geographical barrier to families’ accessing to services in smaller communities is compounded by the lack of public transportation.

First Things First Arizona Early Childhood Health and Development Board
Regional Needs and Assets Report — Santa Cruz County Regional Partnership Council — 56
Family Needs and Concerns
Reports of child abuse, out‐of‐home placements, and juvenile justice placements often indicate that families are in turmoil, which can create serious barriers to early childhood development. Both reports of child abuse and new juvenile justice commitments decreased in Santa Cruz County and in the state as a whole between 2004 and 2010, a preliminary but potentially encouraging trend. At the same time, interpretation of these trends is difficult in that many funding sources for social services have decreased dramatically over the last several years, which may be a contributing cause to the reductions in reported cases.
Out of home placements increased substantially during this same period. While the actual number of out of home placements in the county is small, they may represent family instability. Similar to the challenges in interpreting the data discussed above, the changes in out of home placements may or may not be related to the incidence of this problem or may be the result of changes in practice.
Reports of child abuse
Reports of child abuse and neglect in Santa Cruz County have fluctuated over time. Data from 2008 and the first three quarters of 2009 show fewer reports of child abuse and neglect than previous years, which may represent an encouraging trend (see discussion above). Data at the state level also show a decrease since 2004. The following table shows total reports of child abuse and neglect for 2004 through 2008.
Reports of Child Abuse and Neglect, Santa Cruz County and Arizona
Santa Cruz County Arizona
2004 183 39,176
2005 193 37,546
2006 196 34,537
2007 206 34,690
2008 166 35,121
% Decrease from 2004 to 2008 9% 10%
The Annie E Casey Foundation, Kids Count Data Center. (2008). Data By State: Arizona Community‐Level Profiles. Available at
<http://datacenter.kidscount.org/data/bystate/Default.aspx?state=AZ>.
Since 2008, reports of child abuse for Santa Cruz County have made up a small and decreasing proportion of reports of abuse statewide. Reports of child abuse from Santa Cruz County constituted .4% of reports statewide for April 1, 2008 through September 30, 2008, decreasing to .1% for October 1, 2008 through March 31, 2009, and less than .1% for April 1, 2009 through September 30, 2009. One of the areas where the decrease was most evident was in reports of neglect. For example, while there were 58 reports of neglect in Santa Cruz County from October 1, 2007 through March 31, 2008, there were only 2 reports of neglect for April 1, 2009 through September 30, 2009.
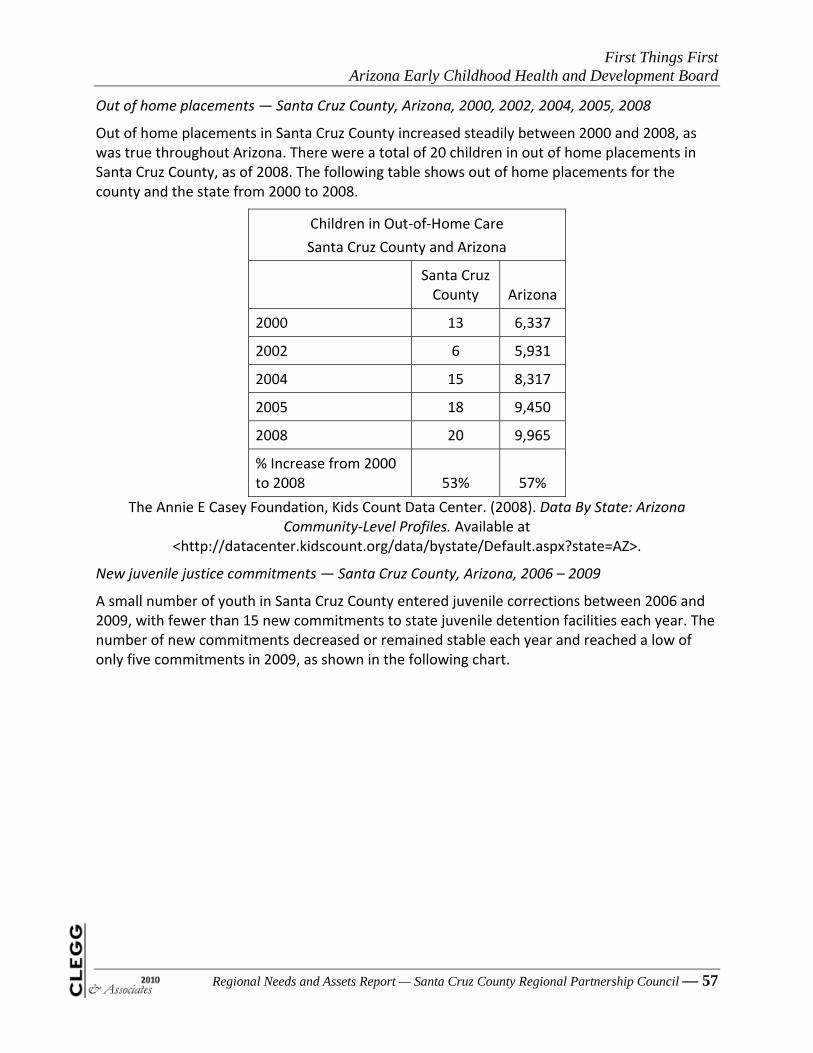
First Things First Arizona Early Childhood Health and Development Board
Regional Needs and Assets Report — Santa Cruz County Regional Partnership Council — 57
Out of home placements — Santa Cruz County, Arizona, 2000, 2002, 2004, 2005, 2008
Out of home placements in Santa Cruz County increased steadily between 2000 and 2008, as was true throughout Arizona. There were a total of 20 children in out of home placements in Santa Cruz County, as of 2008. The following table shows out of home placements for the county and the state from 2000 to 2008.
Children in Out‐of‐Home Care
Santa Cruz County and Arizona
Santa Cruz County Arizona
2000 13 6,337
2002 6 5,931
2004 15 8,317
2005 18 9,450
2008 20 9,965
% Increase from 2000 to 2008 53% 57%
The Annie E Casey Foundation, Kids Count Data Center. (2008). Data By State: Arizona Community‐Level Profiles. Available at
<http://datacenter.kidscount.org/data/bystate/Default.aspx?state=AZ>.
New juvenile justice commitments — Santa Cruz County, Arizona, 2006 – 2009
A small number of youth in Santa Cruz County entered juvenile corrections between 2006 and 2009, with fewer than 15 new commitments to state juvenile detention facilities each year. The number of new commitments decreased or remained stable each year and reached a low of only five commitments in 2009, as shown in the following chart.

First Things First Arizona Early Childhood Health and Development Board
Juvenile Corrections: New Commitments in Santa Cruz
5
88
14
0
2
4
6
8
10
12
14
16
2006 2007 2008 2009
Santa Cruz County
Arizona Department of Juvenile Corrections. (2009). Publications/Statistics: New Commitment Profile. Available at < http://www.juvenile.state.az.us/Offices/Research/Publications/Pubs‐
Stats.htm>.
Juvenile corrections admissions also decreased in the state as a whole, but at a considerably less dramatic pace. While admissions decreased by 64% in Santa Cruz County, they dropped by only 2% throughout Arizona. However, it is important to note that the small number of juvenile detentions in Santa Cruz County contributes to the more dramatic percentage of decrease.
Juvenile Corrections: New Commitments in Santa Cruz County and Arizona
Santa Cruz County Arizona
2006 14 674
2007 8 734
2008 8 746
2009 5 662
% Decrease from 2006 to 2009 64% 2%
Arizona Department of Juvenile Corrections. (2009). Publications/Statistics: New Commitment Profile. Available at < http://www.juvenile.state.az.us/Offices/Research/Publications/Pubs‐
Stats.htm>.
Regional Needs and Assets Report — Santa Cruz County Regional Partnership Council — 58

First Things First Arizona Early Childhood Health and Development Board
Regional Needs and Assets Report — Santa Cruz County Regional Partnership Council — 59
Family Support Services Issues of Importance for the Regional Partnership Council
While social services are available in the county, they do not provide a comprehensive array of support for families and their children. Geographic access is of particular concern given transportation limitations. Nogales is the most common location for social services agencies. Rio Rico, despite being the second largest community within the county, is home to comparatively few social services agencies. Smaller communities, such as Patagonia and Tubac, also have a limited number of services available.
Because families in Santa Cruz County are primarily Hispanic, it is important that agencies have Spanish‐speaking staff and that services are culturally appropriate. Survey responses suggest that the county’s service agencies are doing a good job of providing materials and services in both Spanish and English. However, additional attention to cultural norms may be needed as well to fully support families and promote early childhood development.
Abuse, neglect, and family crisis have long‐term impacts on children. While indicators such as reported cases of abuse and out‐of‐home placements have remained relatively stable in the county and represent a very small number of families, those facing serious problems may lack access to services and support that could help them.
Agencies that have historically provided services in the county are currently losing capacity due to sizable funding reductions. The budget cuts will make it even more difficult for Santa Cruz families to obtain the help they need. The safety net, which is already slim in areas such as emergency shelter for homeless families, will likely be increasingly inadequate to meet demand.
Like other social services, programs particularly focused on early childhood development are experiencing budget reductions. Funding has been cut, for example, for reading programs at public libraries — reducing children’s access to reading and literacy development assistance — and for outreach programs that previously informed parents about children’s health and development.
Overall, parents in Santa Cruz County appear to have a solid understanding of early childhood issues. Parents generally provide the “correct” responses to questions intended to gauge their understanding of healthy development. However, there are also areas for concern, particularly the 15% of parents who believe that children’s ability to learn is pre‐determined and the parents who believe that listening to English on television is adequate for developing language skills. These misconceptions may result in parents undervaluing the importance of engaging with their children to promote learning.
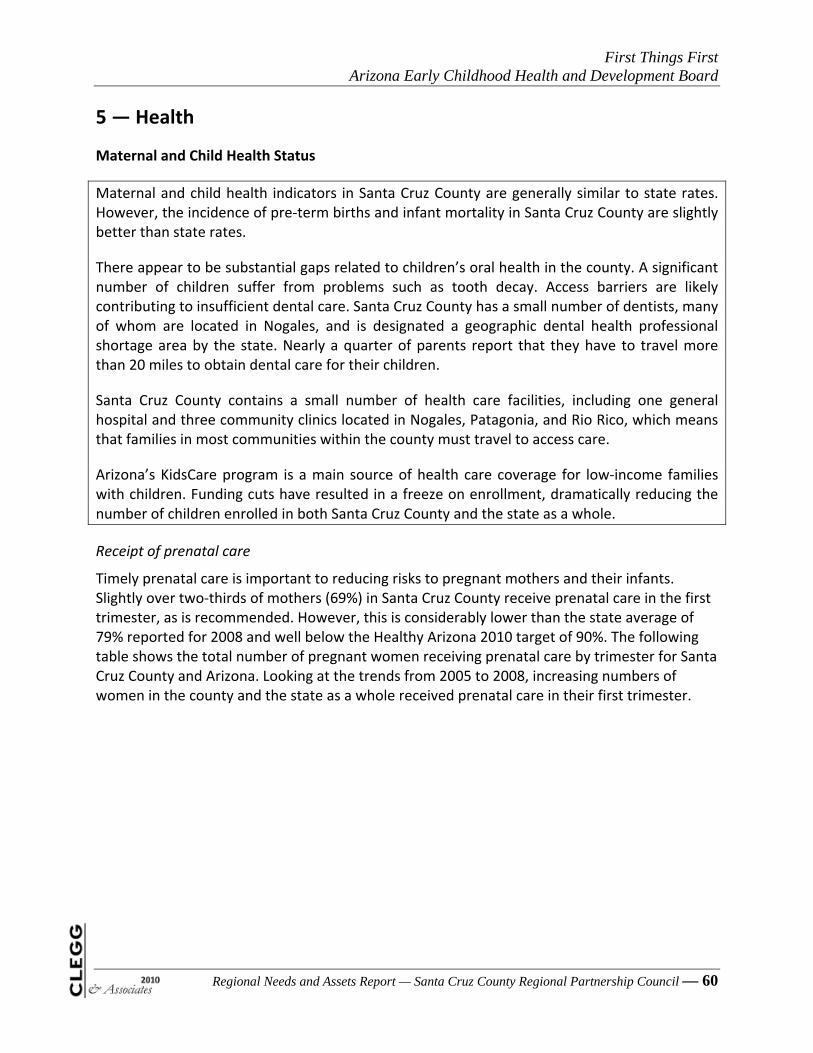
First Things First Arizona Early Childhood Health and Development Board
Regional Needs and Assets Report — Santa Cruz County Regional Partnership Council — 60
5 — Health
Maternal and Child Health Status
Maternal and child health indicators in Santa Cruz County are generally similar to state rates. However, the incidence of pre‐term births and infant mortality in Santa Cruz County are slightly better than state rates.
There appear to be substantial gaps related to children’s oral health in the county. A significant number of children suffer from problems such as tooth decay. Access barriers are likely contributing to insufficient dental care. Santa Cruz County has a small number of dentists, many of whom are located in Nogales, and is designated a geographic dental health professional shortage area by the state. Nearly a quarter of parents report that they have to travel more than 20 miles to obtain dental care for their children.
Santa Cruz County contains a small number of health care facilities, including one general hospital and three community clinics located in Nogales, Patagonia, and Rio Rico, which means that families in most communities within the county must travel to access care.
Arizona’s KidsCare program is a main source of health care coverage for low‐income families with children. Funding cuts have resulted in a freeze on enrollment, dramatically reducing the number of children enrolled in both Santa Cruz County and the state as a whole.
Receipt of prenatal care
Timely prenatal care is important to reducing risks to pregnant mothers and their infants. Slightly over two‐thirds of mothers (69%) in Santa Cruz County receive prenatal care in the first trimester, as is recommended. However, this is considerably lower than the state average of 79% reported for 2008 and well below the Healthy Arizona 2010 target of 90%. The following table shows the total number of pregnant women receiving prenatal care by trimester for Santa Cruz County and Arizona. Looking at the trends from 2005 to 2008, increasing numbers of women in the county and the state as a whole received prenatal care in their first trimester.
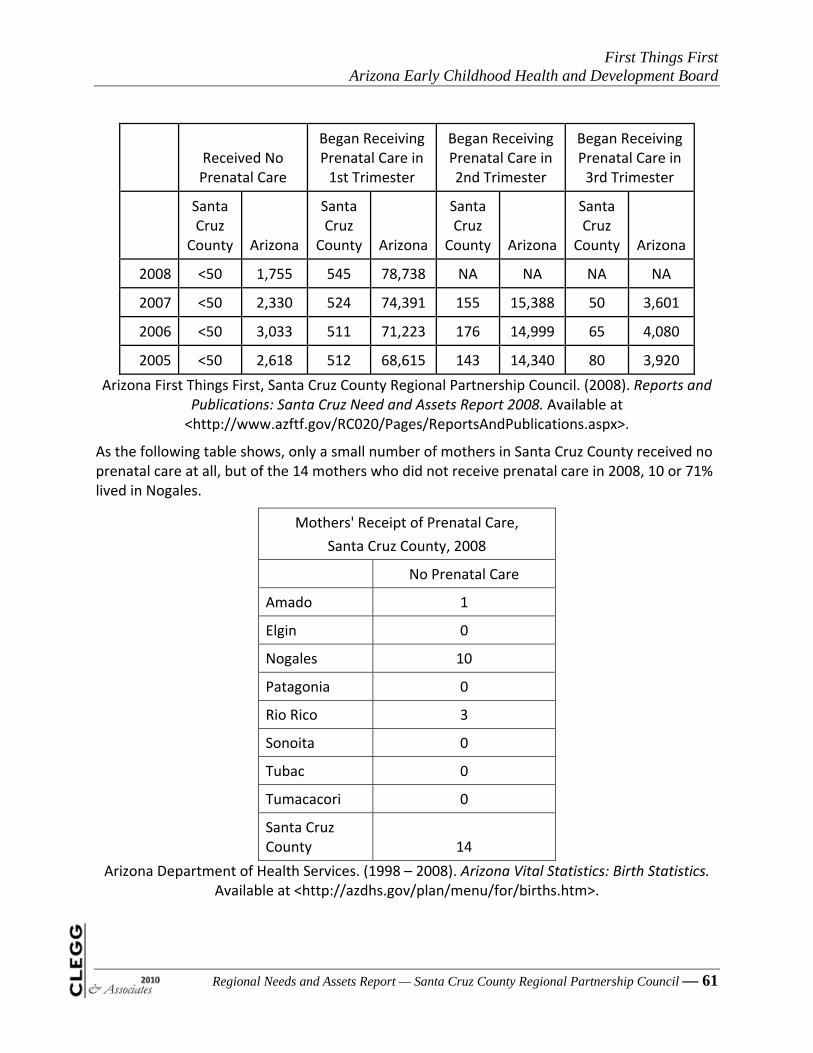
First Things First Arizona Early Childhood Health and Development Board
Regional Needs and Assets Report — Santa Cruz County Regional Partnership Council — 61
Received No Prenatal Care
Began Receiving Prenatal Care in 1st Trimester
Began Receiving Prenatal Care in 2nd Trimester
Began Receiving Prenatal Care in 3rd Trimester
Santa Cruz
County Arizona
Santa Cruz
County Arizona
Santa Cruz
County Arizona
Santa Cruz
County Arizona
2008 <50 1,755 545 78,738 NA NA NA NA
2007 <50 2,330 524 74,391 155 15,388 50 3,601
2006 <50 3,033 511 71,223 176 14,999 65 4,080
2005 <50 2,618 512 68,615 143 14,340 80 3,920
Arizona First Things First, Santa Cruz County Regional Partnership Council. (2008). Reports and Publications: Santa Cruz Need and Assets Report 2008. Available at <http://www.azftf.gov/RC020/Pages/ReportsAndPublications.aspx>.
As the following table shows, only a small number of mothers in Santa Cruz County received no prenatal care at all, but of the 14 mothers who did not receive prenatal care in 2008, 10 or 71% lived in Nogales.
Mothers' Receipt of Prenatal Care,
Santa Cruz County, 2008
No Prenatal Care
Amado 1
Elgin 0
Nogales 10
Patagonia 0
Rio Rico 3
Sonoita 0
Tubac 0
Tumacacori 0
Santa Cruz County 14
Arizona Department of Health Services. (1998 – 2008). Arizona Vital Statistics: Birth Statistics. Available at <http://azdhs.gov/plan/menu/for/births.htm>.

First Things First Arizona Early Childhood Health and Development Board
Regional Needs and Assets Report — Santa Cruz County Regional Partnership Council — 62
Smoking and drinking during pregnancy
Smoking and drinking are high risk behaviors during pregnancy, linked to major impacts on infants’ health. Only a small proportion of mothers in Santa Cruz County self‐reported smoking or consuming alcohol during pregnancy (1.5% and .4%, respectively), and the data show small increases in these behaviors between 2004 and 2008.
Mothers Who Smoked or Consumed Alcohol During Pregnancy,
Santa Cruz County
2004 2005 2006 2007 2008
Consumed Alcohol 0.2% 0.3% 0.3% 0.5% 0.4%
Smoked 1.0% 0.3% 0.8% 1.0% 1.5%
The Annie E Casey Foundation, Kids Count Data Center. (2008). Data By State: Arizona Community‐Level Profiles. Available at
<http://datacenter.kidscount.org/data/bystate/Default.aspx?state=AZ>.
Low birth weight
Low birth weight (an infant weight at birth of less than or equal to 2,500 grams) can contribute
to infant health problems and deaths. As the following table shows, the rate of low‐weight
births in Santa Cruz County and Arizona has fluctuated over time. In 2008, Santa Cruz County
averaged a low birth weight rate of 7.7 per 100 births, which is comparable to the state average
of 7.1, but higher than the Healthy Arizona 2010 target of 5.0.
Rate of Low Weight Births,
Santa Cruz County and Arizona
2000 2005 2006 2007 2008
Arizona 6.3 6.7 6.6 6.5 7.1
Santa Cruz County NA 7.6 10.0 6.5 7.7
Arizona First Things First, Santa Cruz County Regional Partnership Council. (2008). Reports and Publications: Santa Cruz Need and Assets Report 2008. Available at <http://www.azftf.gov/RC020/Pages/ReportsAndPublications.aspx>.
Within Santa Cruz County, most low‐weight births occur in Nogales and Rio Rico, which are the centers of population within the county. The following table shows the number of low‐weight births by community within the county.
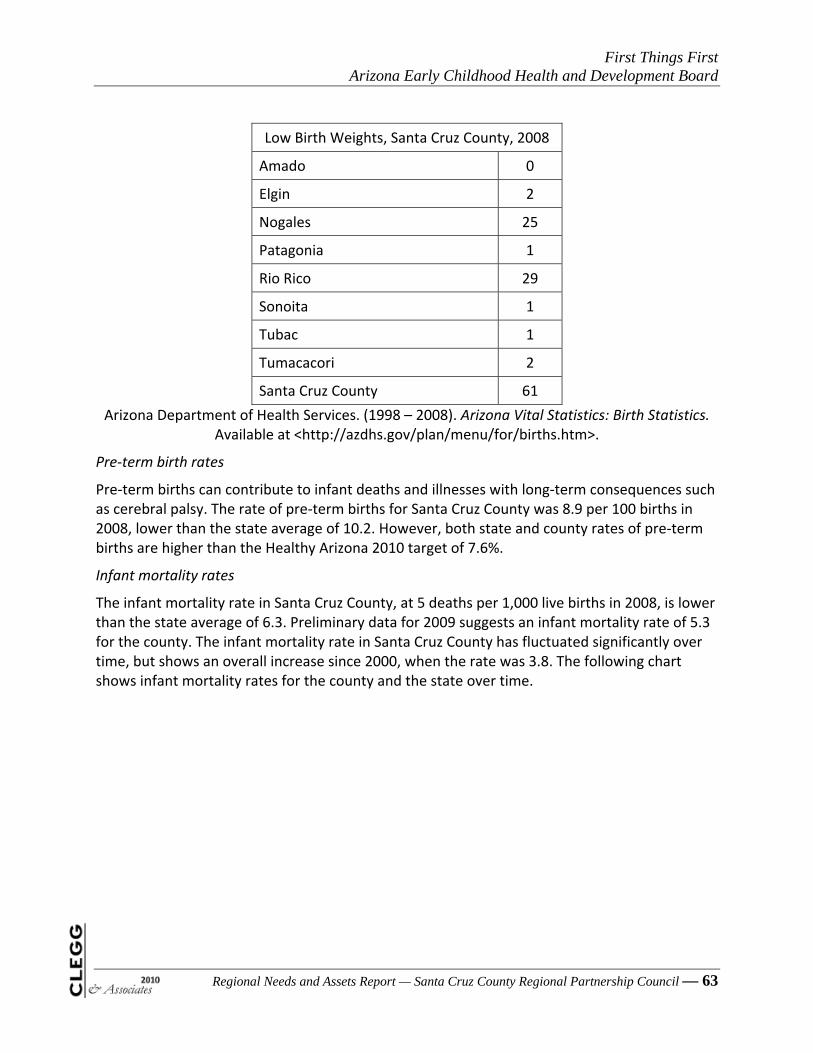
First Things First Arizona Early Childhood Health and Development Board
Regional Needs and Assets Report — Santa Cruz County Regional Partnership Council — 63
Low Birth Weights, Santa Cruz County, 2008
Amado 0
Elgin 2
Nogales 25
Patagonia 1
Rio Rico 29
Sonoita 1
Tubac 1
Tumacacori 2
Santa Cruz County 61
Arizona Department of Health Services. (1998 – 2008). Arizona Vital Statistics: Birth Statistics. Available at <http://azdhs.gov/plan/menu/for/births.htm>.
Pre‐term birth rates
Pre‐term births can contribute to infant deaths and illnesses with long‐term consequences such as cerebral palsy. The rate of pre‐term births for Santa Cruz County was 8.9 per 100 births in 2008, lower than the state average of 10.2. However, both state and county rates of pre‐term births are higher than the Healthy Arizona 2010 target of 7.6%.
Infant mortality rates
The infant mortality rate in Santa Cruz County, at 5 deaths per 1,000 live births in 2008, is lower than the state average of 6.3. Preliminary data for 2009 suggests an infant mortality rate of 5.3 for the county. The infant mortality rate in Santa Cruz County has fluctuated significantly over time, but shows an overall increase since 2000, when the rate was 3.8. The following chart shows infant mortality rates for the county and the state over time.

First Things First Arizona Early Childhood Health and Development Board
Infant Mortality Rates, Santa Cruz County and Arizona
5.35
5.35.1
1.3
5.2
2.6
3.8
6.5
8.7
5.76.3
6.8
6.3
6.86.76.56.3
6.96.7
0
1
2
3
4
5
6
7
8
9
10
2000 2001 2002 2003 2004 2005 2006 2007 2008 2009
Santa Cruz County
Arizona
Arizona Department of Health Services. (1998 – 2008). Arizona Vital Statistics: Birth Statistics. Available at <http://azdhs.gov/plan/menu/for/births.htm>.
Deaths Among Children ages 1– 4
Deaths among children ages 1 – 4 in Santa Cruz County happen infrequently. No deaths in this age group were recorded in 2009, and only one in 2008, as shown in the following table.
Deaths, Children Ages 1 – 4
Santa Cruz County 2009 0
2008 1
Arizona 2009 126
2008 128
Arizona Department of Health Services. (1998 – 2008). Arizona Vital Statistics: Birth Statistics. Available at <http://azdhs.gov/plan/menu/for/births.htm>.
Kindergartners with required immunizations
In 2008 nearly all of kindergartners (97%) in Santa Cruz County received all required immunizations. These immunizations are required to enter kindergarten and are provided by the schools at no cost. This is just slightly better than the state average of 96% and exceeds the Healthy Arizona 2010 target for vaccination coverage levels of 95%. Data regarding completion of recommended vaccinations for younger children is less comprehensive. Data are available only for two zip codes within the Santa Cruz County Regional Partnership Council boundaries,
Regional Needs and Assets Report — Santa Cruz County Regional Partnership Council — 64

First Things First Arizona Early Childhood Health and Development Board
Regional Needs and Assets Report — Santa Cruz County Regional Partnership Council — 65
Nogales and Rio Rico. They show considerably lower rates of complete vaccinations for children at 12 – 24 months and 19 – 35 months of age.
Vaccinations at 12 – 24 Months and 19 – 35 Months, 2009
Zip code Community
12 – 24 Months with Recommended Vaccinations
Complete
19 – 35 Months with Recommended Vaccinations
Complete
85621 Nogales 67% 50%
85648 Rio Rico 66% 57%
Arizona Department of Health. (2010). Vaccination Analysis. [Received via emailed on 5/6/10].
Children 0 – 3 found to be eligible through developmental screenings
Developmental screenings are important in identifying and addressing any developmental or health delays that will impact a child’s growth. The Arizona Early Intervention Program (AZEIP) is the state agency that serves infants and children diagnosed with developmental disabilities. The following table shows the small percentage and total number of children in Santa Cruz County found to be eligible for services through AZEIP. No other data are available to provide a more comprehensive picture of the number of young children who may be experiencing disabling conditions.
Percent of Children Screened and Found Eligible for Developmental Services
in the Santa Cruz Region
2005 2006
% of Children Screened Found to be Eligible for
AZEIP Services
Total Number Eligible
% of Children Screened Found to be Eligible for
AZEIP Services
Total Number Eligible
0 – 12 months 0.50% 4 0.30% 2
0 – 36 months 1.40% 30 1.70% 40
Arizona Department of Economic Security. (2007, 2009). DES Multidata pulled on May 4, 2010. (Unpublished Data).
Oral health
While data are available only for Nogales, oral health appears to be a problem for children in Santa Cruz County. The Nogales data show, in the table below, that almost three‐quarters of children experienced tooth decay in 2003, the most recent data available. This is considerably higher than the average for the state.

First Things First Arizona Early Childhood Health and Development Board
Oral Health, Children Ages 6 – 8, Nogales and Arizona, 2003
Tooth Decay Experience
Untreated Tooth Decay
Urgent Treatment Needs
Sealants Present
Nogales 72% 44% 4% 39%
Arizona 62% 40% 9% 28%
Arizona First Things First, Santa Cruz County Regional Partnership Council. (2008). Reports and Publications: Santa Cruz Need and Assets Report 2008. Available at <http://www.azftf.gov/RC020/Pages/ReportsAndPublications.aspx>.
Limited access to oral health care may be related, at least in part, to geographical barriers. Parents’ responses on the 2008 Family and Community Survey indicate that families in Santa Cruz County have to travel further than is the average for other state residents to obtain dental care for their children. Nearly 25% of Santa Cruz County families reported traveling more than 20 miles to obtain dental care for their children ages 5 and under, as shown in the following chart.
Miles Traveled to Get Dental Care for Children Age 5 and Under, 2008
24% 24%
5%
27%
20%
10%
13%14%
24%
40%
0%
5%
10%
15%
20%
25%
30%
35%
40%
45%
Less than 5miles
5-10 miles 10-20 miles More than 20miles
Noneavailable
Santa Cruz County
Arizona
Arizona First Things First, Santa Cruz County Regional Partnership Council. (2008). Reports and Publications: Santa Cruz Need and Assets Report 2008. Available at <http://www.azftf.gov/RC020/Pages/ReportsAndPublications.aspx>.
While travel distance presents a barrier to obtaining dental care for children, a sizable majority (66%) of parents responding to the 2008 Family and Community Survey reported that their
Regional Needs and Assets Report — Santa Cruz County Regional Partnership Council — 66
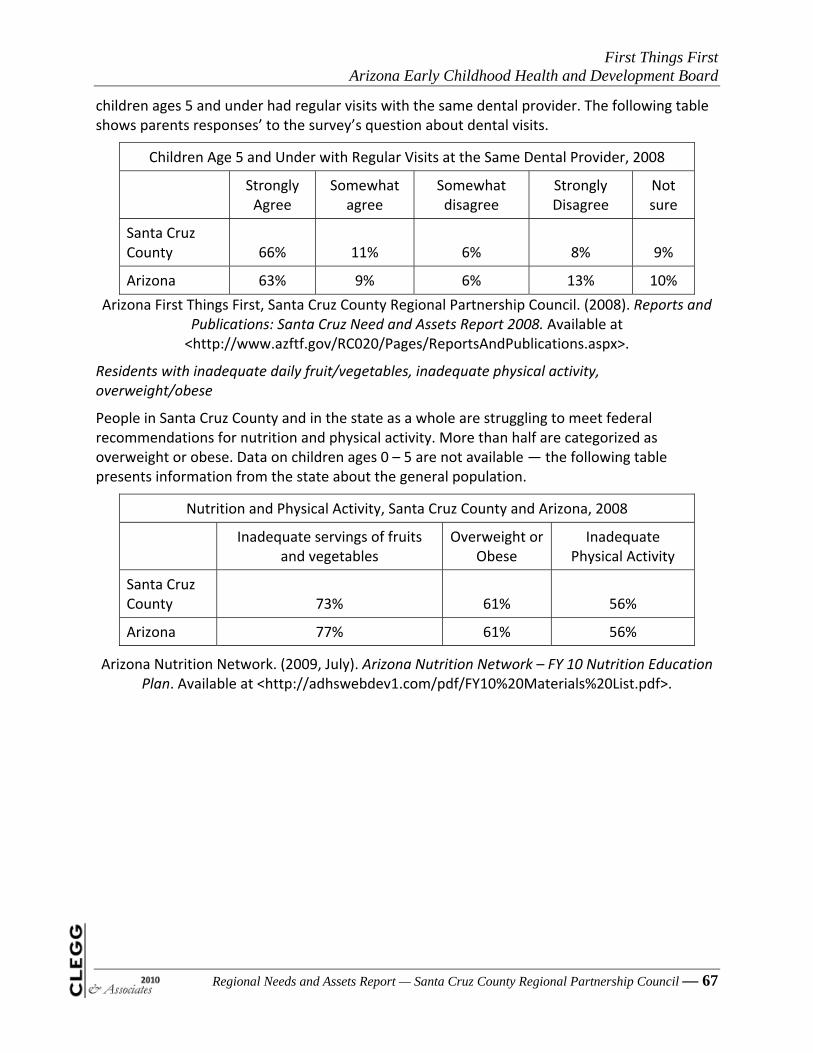
First Things First Arizona Early Childhood Health and Development Board
Regional Needs and Assets Report — Santa Cruz County Regional Partnership Council — 67
children ages 5 and under had regular visits with the same dental provider. The following table shows parents responses’ to the survey’s question about dental visits.
Children Age 5 and Under with Regular Visits at the Same Dental Provider, 2008
Strongly Agree
Somewhat agree
Somewhat disagree
Strongly Disagree
Not sure
Santa Cruz County 66% 11% 6% 8% 9%
Arizona 63% 9% 6% 13% 10%
Arizona First Things First, Santa Cruz County Regional Partnership Council. (2008). Reports and Publications: Santa Cruz Need and Assets Report 2008. Available at <http://www.azftf.gov/RC020/Pages/ReportsAndPublications.aspx>.
Residents with inadequate daily fruit/vegetables, inadequate physical activity, overweight/obese
People in Santa Cruz County and in the state as a whole are struggling to meet federal recommendations for nutrition and physical activity. More than half are categorized as overweight or obese. Data on children ages 0 – 5 are not available — the following table presents information from the state about the general population.
Nutrition and Physical Activity, Santa Cruz County and Arizona, 2008
Inadequate servings of fruits
and vegetables Overweight or
Obese Inadequate
Physical Activity
Santa Cruz County 73% 61% 56%
Arizona 77% 61% 56%
Arizona Nutrition Network. (2009, July). Arizona Nutrition Network – FY 10 Nutrition Education Plan. Available at <http://adhswebdev1.com/pdf/FY10%20Materials%20List.pdf>.

First Things First Arizona Early Childhood Health and Development Board
Regional Needs and Assets Report — Santa Cruz County Regional Partnership Council — 68
Health Care Access and Utilization
Santa Cruz County contains a small number of health care facilities, including one general hospital and three community clinics that offer services on a sliding fee scale basis. They are located in Nogales, Patagonia, and Rio Rico. This means that families in most areas of the county must travel to access health care.
Clinics and Hospitals in Santa Cruz County, 2008
Sliding Scale Fee
Clinics School Based
Clinics General Hospitals
Elgin 0 0 0
Nogales 1 0 1
Patagonia 1 0 0
Rio Rico Northeast 0 0 0
Rio Rico Northwest 0 0 0
Rio Rico Southeast 0 0 0
Rio Rico Southwest 1 0 0
Sonoita 0 0 0
Tubac 0 0 0
Tumacacori‐Carmen 0 0 0
Santa Cruz County 3 0 1
Arizona First Things First, Santa Cruz County Regional Partnership Council. (2008). Reports and Publications: Santa Cruz Need and Assets Report 2008. Available at <http://www.azftf.gov/RC020/Pages/ReportsAndPublications.aspx>.
Number of clinics, hospitals, physicians, other medical professions
Santa Cruz County has a total of 125 registered nurses, who are well distributed throughout communities within the county, with the exception of Elgin. The county has 10 nurse practitioners, only one physician assistant and one licensed and certified nurse midwife, but no psychiatrists. The number of dentists is also small with a total of eight dentists in the county as of 2008. Santa Cruz County has been designated a mental health professional shortage area and a geographic dental health professional shortage area. It is also designated as a federal

First Things First Arizona Early Childhood Health and Development Board
Regional Needs and Assets Report — Santa Cruz County Regional Partnership Council — 69
medically underserved area. The following table shows health care professionals working in the county as of 2008, the most recent data available.
Health Care Professionals in Santa Cruz County, 2008
Mental Health Care and Psychiatrist
Physicians Primary Care Physicians Nurse Practitioners
Amado 0 0 0
Elgin 0 0 0
Nogales 0 18 4
Patagonia 0 1 1
Rio Rico Northeast 0 1 1
Rio Rico Northwest 0 0 0
Rio Rico Southeast 0 0 0
Rio Rico Southwest 0 1 1
Sonoita 0 0 0
Tubac 0 1 0
Tumacacori‐Carmen 0 1 0
Santa Cruz County 0 24 10
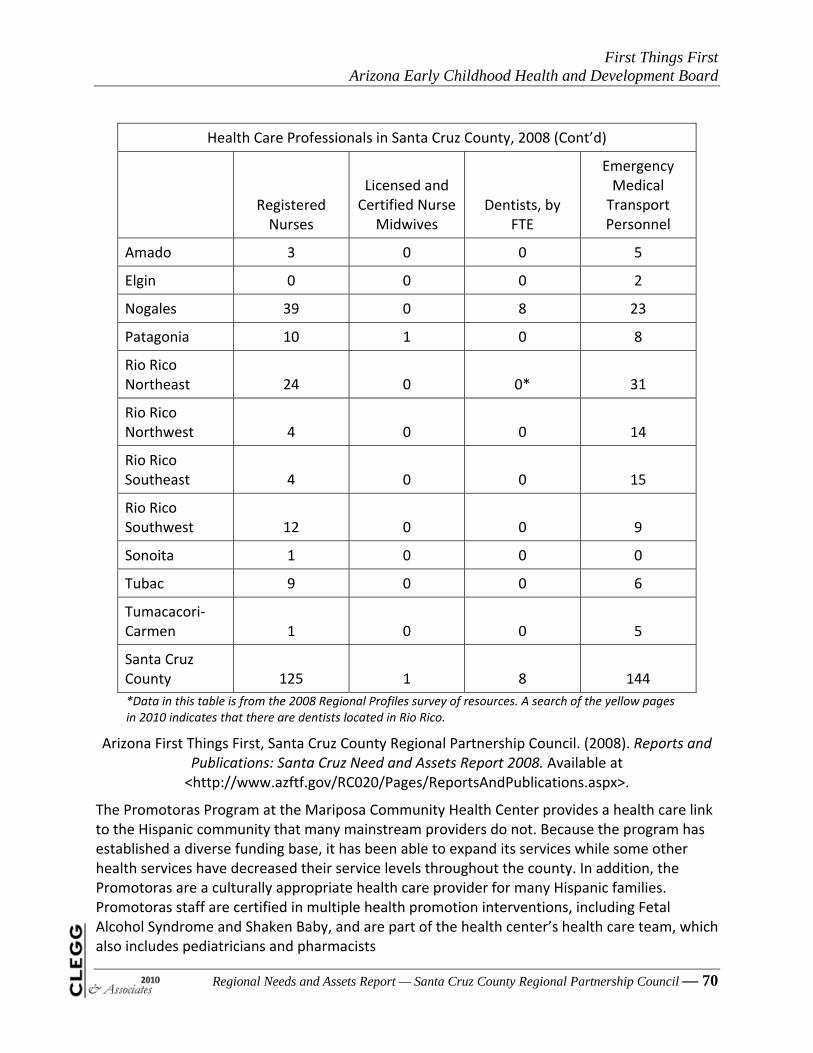
First Things First Arizona Early Childhood Health and Development Board
Regional Needs and Assets Report — Santa Cruz County Regional Partnership Council — 70
Health Care Professionals in Santa Cruz County, 2008 (Cont’d)
Registered Nurses
Licensed and Certified Nurse
Midwives Dentists, by
FTE
Emergency Medical Transport Personnel
Amado 3 0 0 5
Elgin 0 0 0 2
Nogales 39 0 8 23
Patagonia 10 1 0 8
Rio Rico Northeast 24 0 0* 31
Rio Rico Northwest 4 0 0 14
Rio Rico Southeast 4 0 0 15
Rio Rico Southwest 12 0 0 9
Sonoita 1 0 0 0
Tubac 9 0 0 6
Tumacacori‐Carmen 1 0 0 5
Santa Cruz County 125 1 8 144
*Data in this table is from the 2008 Regional Profiles survey of resources. A search of the yellow pages in 2010 indicates that there are dentists located in Rio Rico.
Arizona First Things First, Santa Cruz County Regional Partnership Council. (2008). Reports and Publications: Santa Cruz Need and Assets Report 2008. Available at <http://www.azftf.gov/RC020/Pages/ReportsAndPublications.aspx>.
The Promotoras Program at the Mariposa Community Health Center provides a health care link to the Hispanic community that many mainstream providers do not. Because the program has established a diverse funding base, it has been able to expand its services while some other health services have decreased their service levels throughout the county. In addition, the Promotoras are a culturally appropriate health care provider for many Hispanic families. Promotoras staff are certified in multiple health promotion interventions, including Fetal Alcohol Syndrome and Shaken Baby, and are part of the health center’s health care team, which also includes pediatricians and pharmacists

First Things First Arizona Early Childhood Health and Development Board
In addition to delivering health promotion services, the Promotoras connect children and their families to community resources like housing, emergency bill‐paying, and other services. They conduct home visits and educate families about their children’s needs and follow up with the children.
Children under 6 enrolled in KidsCare
KidsCare, a program of the Arizona Department of Health, provides publicly funded, low cost health insurance for children in low‐income families. However, due to a freeze on funding, KidsCare enrollment has decreased substantially in Santa Cruz County — by 40% between February 2008 and February 2010. Total state enrollment in KidsCare decreased 34% throughout the state.
The following chart shows steady declines in enrollment for Santa Cruz County from month to month over the past year. It is likely that the decreased capacity of the KidsCare program is presenting significant challenges for low‐income families to provide their children with health care.
KidsCare Enrollment for Santa Cruz County, 2009 ‐ 2010
573603617639634
657674726743
797793801833
0
100
200
300
400
500
600
700
800
900
Feb-09
Mar-09
Apr-09
May-09
Jun-09
Jul-09 Aug-09
Sep-09
Oct-09
Nov-09
Dec-09
Jan-10
Feb-10
The Annie E Casey Foundation, Kids Count Data Center. (2008). Data By State: Arizona Community‐Level Profiles. Available at
<http://datacenter.kidscount.org/data/bystate/Default.aspx?state=AZ>.
Percent of children 0 – 5 continuously enrolled in KidsCare with a primary care visit
Health care coverage makes it more affordable for families to obtain care for their children, and therefore, more likely that children under age 5 will visit primary care practitioners. As the following table shows, most children ages 1 – 5, with continuous KidsCare coverage, visited a primary care practitioner at least once. The percentage of KidsCare‐enrolled children who
Regional Needs and Assets Report — Santa Cruz County Regional Partnership Council — 71
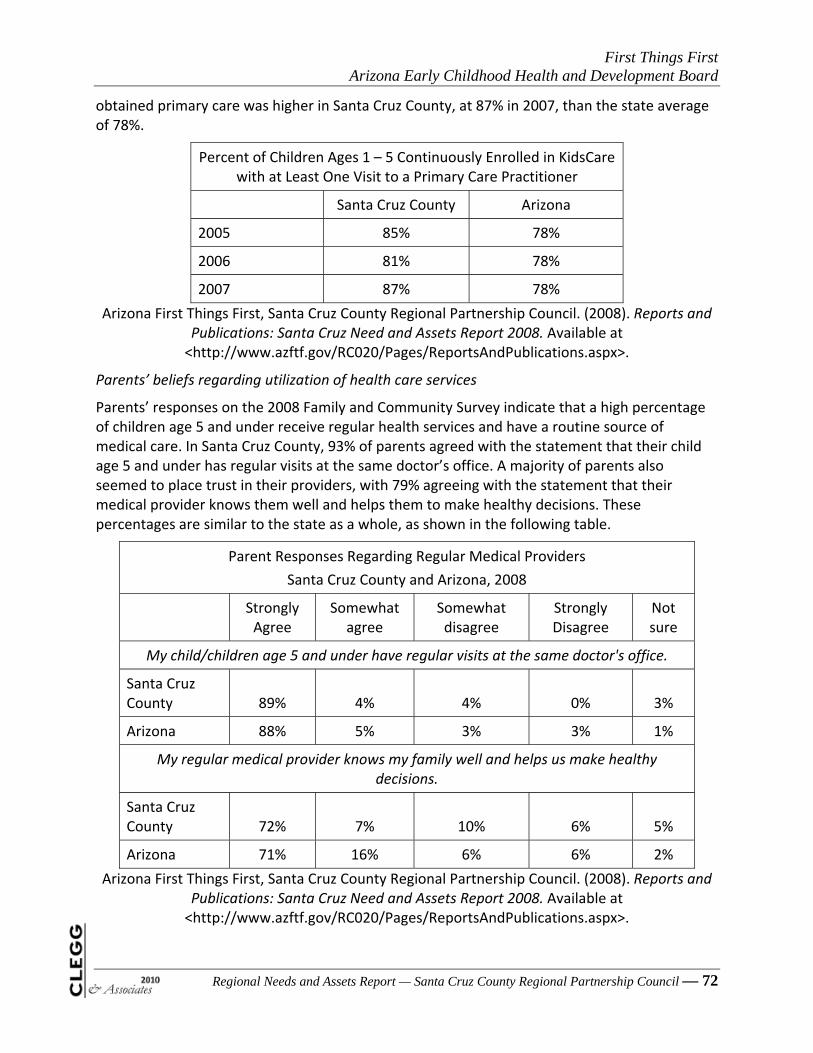
First Things First Arizona Early Childhood Health and Development Board
Regional Needs and Assets Report — Santa Cruz County Regional Partnership Council — 72
obtained primary care was higher in Santa Cruz County, at 87% in 2007, than the state average of 78%.
Percent of Children Ages 1 – 5 Continuously Enrolled in KidsCare with at Least One Visit to a Primary Care Practitioner
Santa Cruz County Arizona
2005 85% 78%
2006 81% 78%
2007 87% 78%
Arizona First Things First, Santa Cruz County Regional Partnership Council. (2008). Reports and Publications: Santa Cruz Need and Assets Report 2008. Available at <http://www.azftf.gov/RC020/Pages/ReportsAndPublications.aspx>.
Parents’ beliefs regarding utilization of health care services
Parents’ responses on the 2008 Family and Community Survey indicate that a high percentage of children age 5 and under receive regular health services and have a routine source of medical care. In Santa Cruz County, 93% of parents agreed with the statement that their child age 5 and under has regular visits at the same doctor’s office. A majority of parents also seemed to place trust in their providers, with 79% agreeing with the statement that their medical provider knows them well and helps them to make healthy decisions. These percentages are similar to the state as a whole, as shown in the following table.
Parent Responses Regarding Regular Medical Providers
Santa Cruz County and Arizona, 2008
Strongly Agree
Somewhat agree
Somewhat disagree
Strongly Disagree
Not sure
My child/children age 5 and under have regular visits at the same doctor's office.
Santa Cruz County 89% 4% 4% 0% 3%
Arizona 88% 5% 3% 3% 1%
My regular medical provider knows my family well and helps us make healthy decisions.
Santa Cruz County 72% 7% 10% 6% 5%
Arizona 71% 16% 6% 6% 2%
Arizona First Things First, Santa Cruz County Regional Partnership Council. (2008). Reports and Publications: Santa Cruz Need and Assets Report 2008. Available at <http://www.azftf.gov/RC020/Pages/ReportsAndPublications.aspx>.

First Things First Arizona Early Childhood Health and Development Board
Regional Needs and Assets Report — Santa Cruz County Regional Partnership Council — 73
Key informant interviews: perceptions of availability and use of services
Staff interviewed at community service agencies reported that funding cuts have significantly reduced capacity for health services in the county. KidsCare enrollment has been capped. Reductions in Medicaid have further reduced access to health care for children, and cuts to Santa Cruz County’s general fund budget have reduced support for the Mariposa Community Health Center — a major source of affordable health care for children and families.
Key informants also pointed to major gaps in the county’s early intervention screening, which is not available for all children in the county. They also noted the limited access to dental screening and treatment services for young children.
First Things First Arizona Early Childhood Health and Development Board
Regional Needs and Assets Report — Santa Cruz County Regional Partnership Council — 74
Key Issues of Importance to the Regional Partnership Council
Almost one‐third of pregnant women in Santa Cruz County are not obtaining prenatal care during their first trimester. This is an important finding and one that can have significant implications for the health and development of the area’s young children.
Just one‐third of children ages 12 – 24 months and close to half of children ages 19 – 36 months are up‐to‐date on recommended immunizations. These young children, therefore, are at risk prior to entering kindergarten at age 5, when they catch up with immunizations required for entry into school.
Healthy nutrition and proper weight management are just as challenging for Santa Cruz County residents as they are for people in other parts of the state and the U.S. Obesity is a significant problem for adults and increasingly for children and youth. Addressing it is vitally important in preventing the development of chronic diseases.
Families understand the importance of obtaining health care services for their children; however, the limitations on service capacity and funding reductions are making it harder for families to obtain the care they need. Many families have to drive a fair distance to obtain health care, particularly those living in rural areas. The lack of capacity across the county for behavioral and oral health services is particularly challenging.
Local health care providers have developed culturally‐responsive care approaches to address the needs of local families. The Promotoras program, in particular, is an effort that has established a vital link between the health care system and many local Spanish‐speaking families.

First Things First Arizona Early Childhood Health and Development Board
Regional Needs and Assets Report — Santa Cruz County Regional Partnership Council — 75
6 — Public Awareness and Collaboration
Family Awareness Regarding Early Childhood Development Issues
Santa Cruz County families demonstrate a fairly high level of awareness regarding childhood development issues. Parents throughout the state were asked to respond to the First Things First 2008 Family and Community Survey, which poses a series of questions to assess parents’ understanding of early childhood, learning, and development. Parents’ responses are grouped regionally, and Santa Cruz County falls within District 6. In a number of areas, the region’s parents exhibit a greater understanding of appropriate childhood development approaches than does the state as a whole. For example, District 6 parents are clear that a child’s first year can have a major impact on school performance. In addition, the region’s parents have a clearer understanding than parents throughout the state that a 12‐month‐old turning the TV on and off repeatedly suggests that the child enjoys learning about what happens when buttons are pressed.
On the negative side of the ledger, more parents in the region than statewide believe that a child’s capacity for learning is “pretty much set from birth” and cannot be greatly increased or decreased by how the parents interact with them. In addition, more parents in District 6 than those statewide believe that children’s language development receives equal benefit from hearing someone talk on TV versus hearing a person in the same room talking to them. Both of these findings are cause for concern and potential action areas for the Santa Cruz Regional Partnership Council.
The following table shows parents’ responses to questions assessing their understanding of early childhood, learning, and development. The table presents parents’ responses for the state as a whole and for District 6, which includes Santa Cruz County. First Things First, which administered the survey to parents throughout the state in 2008, does not provide data at the county level for smaller regions such as Santa Cruz County.

First Things First Arizona Early Childhood Health and Development Board
Regional Needs and Assets Report — Santa Cruz County Regional Partnership Council — 76
Prenatal/from
birth Up to 6 months
7 months or older
Arizona
78% 9% 13% When do you think a parent can begin to significantly impact a child's brain development? Region
76% 16% 8%
Up to 1 month 2 – 6 months 7 months or
older
Arizona 51% 31% 18% At what age do you think an infant or young child begins to really take in and react to the world around them?
Region 48% 40% 12%
First year has a little impact on
school performance
First year has a major impact on school performance
Arizona 21% 79% Which do you agree with more?
Region 12% 88%
Up to 2 months 3 – 6 months
7 months or older
Arizona 57% 17% 27% At what age do you think a baby or young child can begin to sense whether or not his parent is depressed or angry, and can be affected by his parent’s mood?
Region 63% 17% 20%

First Things First Arizona Early Childhood Health and Development Board
Regional Needs and Assets Report — Santa Cruz County Regional Partnership Council — 77
Definitely false
Probably false
Probably true
Definitely true
Arizona 78% 11% 4% 7% Children’s capacity for learning is pretty much set from birth and cannot be greatly increased or decreased by how the parents interact with them.
Region 68% 11% 6% 15%
Arizona 53% 18% 12% 17% In terms of learning about language, children get an equal benefit from hearing someone talk on TV versus hearing a person in the same room talking to them.
Region 44% 21% 21% 14%
Arizona 1% 1% 10% 89% Parents’ emotional closeness with their baby can strongly influence that child’s intellectual development.
Region 2% 0% 9% 89%
Playing is crucial
Arizona 90% For a 5‐year‐old, how important do you think playing is for that child's healthy development?
Region 95%
Arizona 92% For a 3‐year‐old, how important do you think playing is for that child's healthy development?
Region 85%
Arizona 79% For a 10‐month‐old, how important do you think playing is for that child's healthy development?
Region 73%

First Things First Arizona Early Childhood Health and Development Board
Regional Needs and Assets Report — Santa Cruz County Regional Partnership Council — 78
Very likely Somewhat
likely Not at all likely
Arizona 54% 32% 14% If a 12‐month‐old walks up to the TV and begins to turn the TV on and off repeatedly, the child wants to get her parents' attention?
Region 54% 30% 16%
Arizona 78% 16% 6% If a 12‐month‐old walks up to the TV and begins to turn the TV on and off repeatedly, the child enjoys learning about what happens when buttons are pressed?
Region 85% 12% 2%
Arizona 7% 17% 76% If a 12‐month‐old walks up to the TV and begins to turn the TV on and off repeatedly, the child is angry at her parents for some reason or she is trying to get back at them?
Region 5% 15% 80%
Misbehaving Not misbehaving
Arizona 8% 92% In this case of turning the TV on and off, would you say that the child is misbehaving, or not? Region 9% 91%

First Things First Arizona Early Childhood Health and Development Board
Regional Needs and Assets Report — Santa Cruz County Regional Partnership Council — 79
Yes, a 15‐month‐old can be expected to
share No, too young
to share
Arizona 40% 60% Should a 15 month old baby be expected to share her toys with other children?
Region 42% 58%
A 3‐year‐old should be
expected to sit quietly
A 3‐year‐old should not be expected
Arizona 26% 74% Should a 3‐year‐old child be expected to sit quietly for an hour or so?
Region 22% 78%
A 6‐month‐old is too young to
spoil
A 6‐month‐old is not too
young to spoil
Arizona 36% 64% Can a 6‐month‐old be spoiled? Or is he too young?
Region 34% 66%

First Things First Arizona Early Childhood Health and Development Board
Regional Needs and Assets Report — Santa Cruz County Regional Partnership Council — 80
Appropriate Will likely spoil
the child
Arizona 62% 38% Picking up a 3‐month‐old every time she cries?
Region 56% 44%
Arizona 30% 70% Rocking a 1‐year‐old to sleep every night because the child will protest if this is not done? Region 31% 69%
Arizona 58% 42% Letting a 2‐year‐old get down from the dinner table before the rest of the family has finished their meal? Region 52% 48%
Arizona 77% 23% Letting a 5‐year‐old choose what to wear to school every day?
Region 75% 25%
Key Informant Interviews: Parents’ Understanding of Early Childhood Issues
Key informant interviews were conducted with a number of local experts in early childhood issues, including members of the Regional Partnership Council, community organizations, health facilities, and schools. Key informants shared their perspectives on the degree to which the region’s parents have a comprehensive understanding of their children’s developmental needs and the methods that they would recommend for ensuring that these needs are met. Key informants raised a number of concerns about parenting and early childhood development in Santa Cruz County, including the following.
An income‐based disparity in knowledge about childhood development — low‐income families in the county need more information about the ways in which their children are developing and their associated needs.
More information about prenatal care is especially needed, including important developmental information, such as the need to obtain timely check‐ups, take prescribed vitamins, and maintain a nutritious diet. Young parents are particularly vulnerable as they lack good information about pregnancy.
Many parents in Santa Cruz County have old‐fashioned values about how to raise children — these values do not conform to current evidence‐based practices.

First Things First Arizona Early Childhood Health and Development Board
Regional Needs and Assets Report — Santa Cruz County Regional Partnership Council — 81
Many families do not understand the importance of providing a stimulating educational environment for children birth to 5. Families often use babysitters to care for their children, rather than formal day care or child care centers, and the babysitters’ focus is not on providing stimulating experiences for the children. They are often hired to do household chores like cooking, cleaning, and ironing and watch the children at the same time.
Many parents rely on television programs such as Sesame Street to teach their children basic language skills.
Many families are not aware of the impact of too much television viewing on their children’s development.
The community undervalues the need for education for even the youngest children to make sure they are developing appropriately. Too many families believe that children begin their education once they go to school at the age of 5.
Many key informants discussed cultural influences on families’ beliefs about child‐rearing practices and pointed out that mainstream social services agencies may not be using culturally appropriate approaches to improve parents’ understanding of these issues. A transition to culturally competent education for parents struck many key informants as essential in promoting more effective parenting practices for the region’s parents.
Accessibility and Quality of Information Available to Families
The First Things First 2008 Family and Community Survey asked parents a series of questions about their ability to access services for their families and for their children. The survey also asked parents for their feedback about the quality of available services. Feedback from District 6, which includes Santa Cruz County, makes it clear that the region’s parents are concerned that they have to complete eligibility paperwork for services many times during the course of seeking assistance for themselves and their children. Redundant paperwork creates a barrier for families as they try to access the services that they and their children need.
In addition, families in the region are more likely than parents statewide to identify basic problems with the availability of services in the region. Parents in the region are unable to find services to prevent problems; many report that they qualify for services only after problems become severe. Many parents in the region agree that services are not available at times or locations that are convenient, and a noticeable proportion do not perceive the quality of the services they receive as “very good.”
On the positive side, it appears that it is not an inability to locate the services they need that prevents parents from using them, but rather the factors described in the previous paragraphs. The majority of parents in the region agree that it is easy to locate the services they need or want.
The following table presents the responses of parents and caregivers of children ages 0 – 5 years old to the 2008 First Things First Family and Community Survey regarding the availability and quality of the services and information available to them.
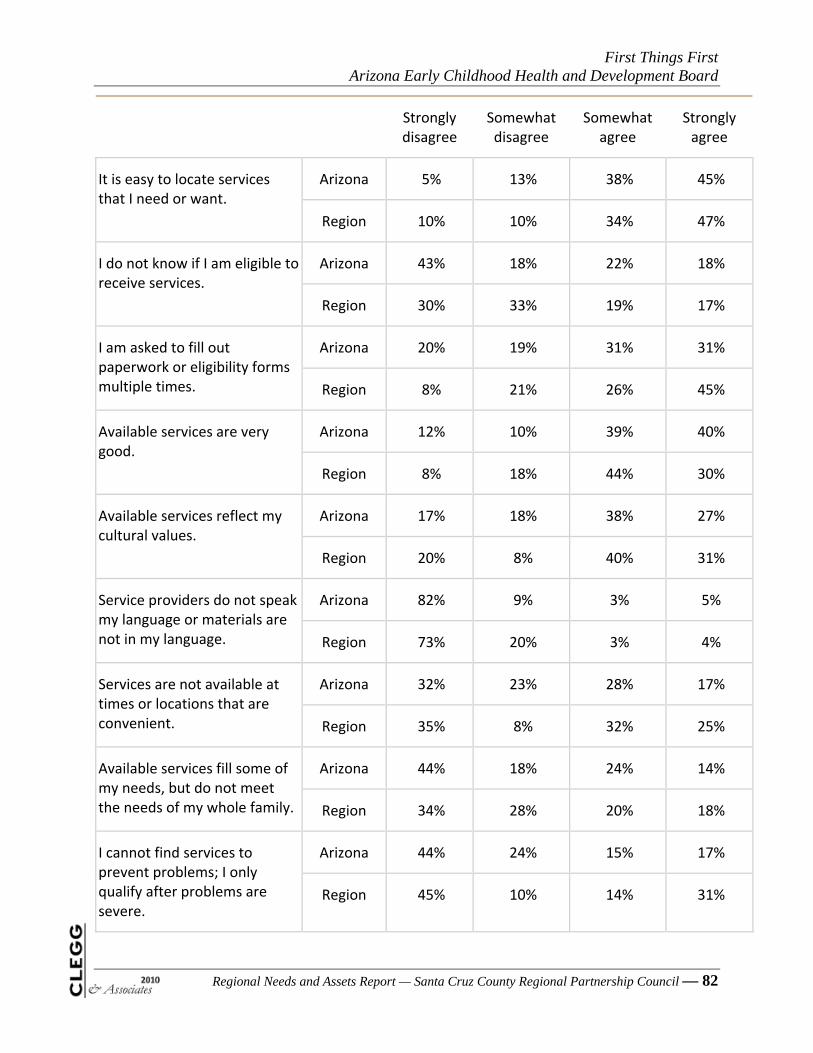
First Things First Arizona Early Childhood Health and Development Board
Regional Needs and Assets Report — Santa Cruz County Regional Partnership Council — 82
Strongly disagree
Somewhat disagree
Somewhat agree
Strongly agree
Arizona 5% 13% 38% 45% It is easy to locate services that I need or want.
Region 10% 10% 34% 47%
Arizona 43% 18% 22% 18% I do not know if I am eligible to receive services.
Region 30% 33% 19% 17%
Arizona 20% 19% 31% 31% I am asked to fill out paperwork or eligibility forms multiple times. Region 8% 21% 26% 45%
Arizona 12% 10% 39% 40% Available services are very good.
Region 8% 18% 44% 30%
Arizona 17% 18% 38% 27% Available services reflect my cultural values.
Region 20% 8% 40% 31%
Arizona 82% 9% 3% 5% Service providers do not speak my language or materials are not in my language. Region 73% 20% 3% 4%
Arizona 32% 23% 28% 17% Services are not available at times or locations that are convenient. Region 35% 8% 32% 25%
Arizona 44% 18% 24% 14% Available services fill some of my needs, but do not meet the needs of my whole family. Region 34% 28% 20% 18%
Arizona 44% 24% 15% 17% I cannot find services to prevent problems; I only qualify after problems are severe.
Region 45% 10% 14% 31%

First Things First Arizona Early Childhood Health and Development Board
Regional Needs and Assets Report — Santa Cruz County Regional Partnership Council — 83
Key Informant Interviews: Availability and Quality of Service‐related Information
Local representatives of the Regional Partnership Council, health and social services organizations, and schools were interviewed and shared their perceptions regarding the availability and quality of service‐related information for families in the region. Their input falls into three main categories: needs, assets, and opportunities.
Needs
Regional Partnership Council members and other key informants agreed that the region’s service delivery systems do not provide either sufficient or customized information regarding the services that are available for the parents of children birth to 5. For example, respondents identified the following gaps with current approaches.
Information for families is mostly provided through “American‐style systems” that require parents to have the education, language, and systems navigation skills that are not familiar for many Hispanic families. It is not a culturally competent approach for the largely Hispanic communities in Santa Cruz County. For example, services, such as the Rural Women’s Health Network, are unlikely to recruit a Hispanic clientele. An exception is the Promotoras Program, which is designed to provide culturally appropriate services to Hispanic families.
Families that are uninvolved, undocumented, low‐income, non‐English speakers, illiterate, and/or lacking education are less likely to obtain services for their children. There is a significant segment of the county’s population whose lives are so impacted by poverty that their children’s needs rarely expand beyond survival.
Capacity to provide information to parents about early childhood development has eroded over the last few years due to budget cuts. For example, Child and Family Resources used to provide families with information about early childhood development during home visits, but this agency lost most of its staff due to recent budget cuts.
Parents do not always know what questions to ask and health and social services providers may not cover important basic developmental information with them.
Pediatricians are a common source of information among families that have them; however, many families do not have a pediatrician.
Obtaining information about early childhood development is challenging for families without internet access.
Some geographic areas of the county have less access to information about early childhood development, including the Hispanic population in Patagonia and people living in rural areas.
Many people lack transportation to get to the physician or to visit an agency that can provide developmental information about their children.
In addition to challenges in obtaining accurate, culturally‐competent information about early childhood development and how to access the region’s services, there are major problems with
First Things First Arizona Early Childhood Health and Development Board
Regional Needs and Assets Report — Santa Cruz County Regional Partnership Council — 84
service capacity. It has been particularly difficult to increase the number of families receiving services for children birth to 5 given the many cuts that have taken place. Funding cuts have dramatically affected many programs, including:
funds for reading programs at the public libraries have been cut — this reduces many children’s access to reading and literacy programs
outreach programs have been cut — these programs used to help parents learn about developmental issues
KidsCare has been capped — this is a primary source of health care coverage for children in low‐income families
reductions in Medicaid — have reduced access to health care for children
capacity in the Early Childhood Education Program has been lost due to cuts in funding — this has resulted in preschools closing
Race to the Top funding will not be continued
Santa Cruz County has cut general fund dollars going to Mariposa Community Health Center — the only health program the county now funds is Tuberculosis Control
Some communities within the county face particular challenges accessing services. Patagonia, Tucumcacori, Tubac, and Sonoita/Elgin have smaller concentrations of population and fewer services available. For families in these communities, transportation can be a significant barrier to accessing services.
In addition to geographic distribution, many parts of the region do not have sufficient agency capacity to meet the developmental needs of local children. Examples follow.
There is a lack of child specialized services, such as physical and occupational therapists and speech and language therapists, as well as specialized play groups and specialized providers. Many families must travel to Tucson for the help that their child needs and many families lack the resources to make that trip.
ChildFind, an important screening program, is not available in all school districts throughout the county.
Many child care centers are not providing evidence‐based services.
Early intervention screening for all children is not available.
Dental screening and treatment for young children is a big gap in services in the county.
Home visiting services for families are unstable due to changes in their funding. The Promotoras Program can serve only 250 families per year and the HIPPY Program (Home Instruction for Parents of Preschool Youngsters) is limited in scope.
Staff at community health centers report that only a small portion of the county’s 0 – 5 population attend either a day care home, center, or preschool. The children who are able to obtain this care are either in families with the resources to pay for the care or eligible for their care through the Department of Economic Security — leaving a large

First Things First Arizona Early Childhood Health and Development Board
Regional Needs and Assets Report — Santa Cruz County Regional Partnership Council — 85
number of families unable to afford child care. Key informants believe that families are more likely to hire a “babysitter” from across the Mexican border to do household chores like cleaning and ironing while keeping an eye on their children.
It is unclear whether the teachers in the region’s preschools understand developmental sequences.
Assets
While key informants identified many needs among the county’s families with young children, they also shared their perspectives on the positive assets that are in place locally. These capacities, while often not the full measure of what the community needs, contribute to the county’s ability to address the early childhood development needs of the region’s children. Examples follow.
Pediatricians are viewed as a common source of information — for families that have access to a pediatrician. However, many families work with a family physician or other non‐specialist, rather than a pediatrician, or have no regular source of medical care at all.
The WIC and ACCESS programs have improved the early childhood development information that is available, including in smaller communities.
Access to information is good for parents whose children are enrolled in preschool programs; these families have a connection to the system.
Many families contact their local school district, the county superintendent, or their health care provider to obtain the information they need about services.
The HIPPY literacy program has been successful in the region.
The Arizona Department of Economic Security Arizona Early Intervention Program is important; however, there is only one staff person in Santa Cruz County.
Cochise College, with multiple campus locations in Santa Cruz County, offers continuing education courses in early childhood development.
The Promotoras at the Mariposa Community Health Center (a First Things First‐funded effort) do home visits and educate families about their children’s needs. They also connect children and their families to community resources like housing, emergency bill‐paying, and other services. The Promotoras are certified in multiple health promotion interventions, including Fetal Alcohol Syndrome and Shaken Baby.
The community health center is expanding into community education efforts around early childhood development issues, including the importance of training staff at day care centers and homes.
The First Things First Home Visitation Program provides important services for families with young children. This is the only home visitation program in the county and has a limited number of children and families that it has funding to serve.

First Things First Arizona Early Childhood Health and Development Board
Regional Needs and Assets Report — Santa Cruz County Regional Partnership Council — 86
Most of the region’s program information is available in Spanish and English. While there are exceptions, most parents are literate in either Spanish or English.
Some of the county’s smaller communities use their libraries as a source of information for families. For example, the Patagonia Library is a well‐utilized resource.
Rio Rico and Nogales school districts have Parent Liaisons. These staff help parents identify the services they need and help connect them.
Radio and other media are somewhat helpful in informing families where to go for assistance of different kinds.
People in the community have a positive attitude toward the hospital in Nogales; it is viewed as a reliable source of information about services.
Opportunities for addressing needs and building assets
Following thorough discussions regarding Santa Cruz County’s needs and assets, the Regional Partnership Council and key informants shared their ideas regarding the avenues that the local First Things First program could pursue. These ideas reflect their knowledge of the region and their understanding of the importance of providing sufficient levels of information and services to support early childhood development among the area’s children.
Key informants suggested that the Regional Partnership Council implement the family resource centers in Nogales and Rio Rico as hubs for service providers and families. To ensure that the new centers function effectively, the Council should:
make the family resource centers a hub for screenings of all kinds, including childhood development, health, and dental
invite paraprofessionals to come into the center to add to staff capacity
create a travelling family resource center function, using a model such as the bookmobile, so that families in Patagonia, Sonoita, and other areas can get services and information
make the family resource center a one‐stop shopping location for young children’s needs
not limit the family resource center’s target population to low‐income families; open it to families of all income levels
educate families about their children’s developmental needs
ensure that it is easy for low‐income families to investigate the Family Resource Centers to see what services they offer; for example, families can learn about parenting classes during the intake process
realize that Family Resource Centers could play a crucial role in providing information for families; it is important that the Regional Partnership Council has recognized that this is a missing connection — the Family Resource Centers can bring together the other strategies that the Council has created

First Things First Arizona Early Childhood Health and Development Board
Regional Needs and Assets Report — Santa Cruz County Regional Partnership Council — 87
Key informants and members of the Regional Partnership Council provided a number of additional suggestions for the Council to consider. Those suggestions follow.
The Regional Partnership Council should develop a communications plan to guide its work in reaching out to families in the county to educate them about their children’s developmental needs. The Council can use radio and television to connect with people and billboards to educate parents about their children’s developmental needs.
Establish a unified network of preschool care providers. This network could assist in making sure that all care providers obtain the training necessary to deliver high quality care.
A key approach is to maximize the amount of information and services parents get once they are engaged in a program, such as making sure that families enrolled in WIC also connect with the other programs for which they are eligible.
There are untapped resources throughout Santa Cruz County that could help to increase young children’s school readiness. For example, there are lots of retired people who could serve as volunteer tutors for young children.
The community could make early childhood development a priority. Right now the issue is on very few people’s radar screens.
Local libraries could be a source of early childhood development information for local families. The number of books on this topic would need to increase dramatically, particularly books in Spanish.
System Coordination
Key informants also weighed in on collaboration among agencies and service systems in Santa Cruz County. Many of them described positive assets in the county as well as system challenges and opportunities to improve the coordination of services.
Assets
Key informants pointed to many indicators of effective collaboration among the agencies and systems working within the county.
Many of the agencies and service providers work well together; examples mentioned during key informant interviews included the Mariposa Community Health Center, HIPPY, and the County Superintendent of Schools. Key informants also identified Child and Family Resources as a good partner agency; however, it has lost much of its funding and had to cut the majority of its staff.
The Santa Cruz Community Foundation formed an Executive’s Roundtable that brings together nonprofit agency directors to forge relationships and support development of collaborative working relationships among the agencies. The foundation also conducts board trainings on collaboration and convened a nonprofit summit attended by 70 people from 35 agencies. The summit included workshops on collaboration and partnerships. Outcomes of the summit included the formation of collaboratives for arts and one for funders.

First Things First Arizona Early Childhood Health and Development Board
Regional Needs and Assets Report — Santa Cruz County Regional Partnership Council — 88
Funding collaboratives bring various entities together. Agencies accept their roles in forming a coalition that is greater than the sum of their parts. Local agencies are, for the most part, excellent at resource sharing. They generally accept that one agency receiving assistance may result in other agencies benefitting as well.
Collaboration is based on relationships among people who have known each other and have worked together successfully in the past.
Local agencies strive to create a comprehensive service system out of the many siloed federal and state programs. This is not easy as the programs have confusing and overlapping eligibility criteria and complex rules governing enrollment.
The Mariposa Community Health Center has built considerable assets and works frequently with other entities. As one key informant put it, “We only have one real agency in Santa Cruz County — the Mariposa Community Health Center.” The community health center works closely with the Mexican Consulate and has a booth at the consulate in Nogales where Promotoras provide health education, information on community resources, oral health screenings, insurance eligibility, and application renewal for Mexican immigrants and their families on a weekly basis.
Challenges
Despite the overall goodwill among agencies serving families with children ages 0 – 5 in Santa Cruz County, there are significant challenges to service coordination. Following are some of the challenges that key informants identified.
The city and county governments in Santa Cruz County do not coordinate services with the other parts of the system. The local governmental role is limited and the city’s and county’s leadership are not particularly supportive of early childhood development issues.
There is some competition among the agencies. The recent cuts in funding have exacerbated turf battles among the agencies.
Collaboration takes time, energy, and money. With capacity and resources stretched thin, services providers struggle to find time to collaborate.
Arizona’s state‐level First Things First program has become highly bureaucratic and, as one key informant described the situation, “FTF coordinators don’t have time to work in their communities to build collaborations and service capacity because they have so much bureaucracy to deal with.” Required funding applications are also overly complicated and should be streamlined.
The structure of the First Things First Santa Cruz Regional Partnership Council does not lend itself to effective coordination because it bypasses mainstream local social services and health care delivery systems, and operates as a separate state‐run system. Santa Cruz County’s First Things First program needs to reach out more to other service providers and share what it is trying to accomplish in order to develop its role as a change agent. First Things First is seen as an agency that has money to distribute; it is not perceived as a leader or advocate for improved early childhood services for children.
First Things First Arizona Early Childhood Health and Development Board
Regional Needs and Assets Report — Santa Cruz County Regional Partnership Council — 89
Coordination among churches is weak — the denominations do not work together on issues.
The Santa Cruz County United Way is not a significant player as a leader, funder, or collaborator. Agencies in the county are more likely to work with the United Way of Southern Arizona, as the staff there are more responsive.
There is not much coordination across geographic areas, and communities within the county rarely look to other communities for help. This is a challenge in the smaller communities as they do not have the infrastructure to get what they need.
Agencies cannot provide a one‐size‐fits‐all approach to services across the county as there are multiple micro‐cultures. The service approach that works in Sonoita may not be effective in Patagonia, Nogales, or Rio Rico, or vice versa.
People’s expectations concerning what the public schools can provide is often unrealistic. The schools’ lack of collaborative working relationships with community agencies thwarts effective referrals to other sources of assistance.
Collaboration between the primary care providers and Head Start is weak. Head Start operates as a self‐contained program with insufficient links to other agencies in the community.
The behavioral health system could be better connected to the primary care system.
Opportunities for addressing needs and building assets
Key informants and the Council members believed that the family resource centers could play a critical role in improving coordination among the agencies working in the county. Agencies are willing to work together, but lack the leadership and structure to facilitate this willingness to cooperate — which is a role that the family resource centers could play. Key informants recommended that the family resource centers should identify all of the agencies that serve children birth to 5 and bring them together to coordinate their services and activities. With one central entity in both Nogales and Rio Rico, there should be better orchestration of services and minimized duplication of efforts.
Key informants had a number of additional suggestions regarding opportunities to improve service coordination. Those suggestions follow.
The RPC could bring together information about the agencies providing early childhood development services in the county and publicize it through billboards, pamphlets, and online. This public information and awareness role could be provided directly by the Council or contracted out.
Additional trainings for agency boards and staffs in how to work together collaboratively would be helpful.
Clarify the relationship between First Things First and the Santa Cruz County public schools, particularly whether they are partnering to add early childhood development services or working to increase access to other sources of help for families. The schools
First Things First Arizona Early Childhood Health and Development Board
Regional Needs and Assets Report — Santa Cruz County Regional Partnership Council — 90
are not as engaged with early childhood development as they could be. They could develop better connections with the preschools and child care facilities in the county.
Linking First Things First funding to taking a collaborative approach would be a powerful incentive for agencies to increase their collaborations.
There are real opportunities to build stronger ties between health care, literacy, and development efforts targeting children birth to 5. A comprehensive child wellness effort would link all of these components together.
Mariposa Community Health Center is applying for a federal grant to create stronger linkages between children’s behavioral health and health care for children birth to 8.

First Things First Arizona Early Childhood Health and Development Board
Regional Needs and Assets Report — Santa Cruz County Regional Partnership Council — 91
Key Issues of Importance to the Regional Partnership Council
Community awareness of child development
Many families in the region are unaware of the importance of creating a stimulating environment for children when they are very young. Overreliance on television and babysitters engaged in doing other household work can lead to numerous children missing opportunities for brain development during critical early‐life stages.
The large percentage of mothers going without prenatal care in their first trimester, noted in the previous section of this report, may be an indication that these women lack an understanding of the importance of prenatal care in supporting a child’s development. The delay in seeking prenatal care until the second trimester could result in health and development problems for children born to these mothers.
Access to services
The safety net for services in the county is not as strong as would be helpful. This is particularly the case given recent funding cutbacks. Many families, particularly those in the most rural parts of the county, must travel long distances to obtain services for their children. In addition, many parents report that the locations and hours of operations for some services are not convenient.
Providing useful information to families about the services that are available for themselves and for their young children is critical to ensuring that they can seek and find help they need. Communications often miss many of the families they are intended to reach and special efforts may need to be made to target those who could benefit most from the community services that are available.
System coordination
There are very mixed perspectives about whether the service agencies in Santa Cruz County work well together to form a unified network of services for the local families. While some of those interviewed believe that coordination is effective while others stated that they view territoriality and “turf” as major impediments to a well‐coordinated system of services.
As noted in this section of the report, the key informants had a number of very helpful suggestions about the ways the Regional Partnership Council could knit together the programs and agencies serving families with young children.
First Things First Arizona Early Childhood Health and Development Board
Regional Needs and Assets Report — Santa Cruz County Regional Partnership Council — 92
7 — Summary and Conclusion
Santa Cruz County has a number of important assets available to support young children’s development, including committed staff at community agencies and parents with a generally sound understanding of early childhood issues. While the community’s social, health, and educational services safety net is strained by community demand and a lack of resources, there is a core of concerned residents in most of the local communities that work very hard to make sure that families are able to care for and educate their children.
This is particularly important as there are a large number of families in the county that are low‐income or living in poverty and are unable to pay for the child care, health care, and other basic services that their children need to grow into healthy young adults. The capacity of local communities to address these needs is decreasing steadily as the federal, state, and local governments cut funding for the key services these children and families need. Major reductions in critical programs such as KidsCare and the Child Care Assistance Program have had a particularly pronounced impact on local agencies and the clients they serve.
The data compiled and stakeholders interviewed for this report suggest many areas of need and key opportunities to improve services that address early childhood development in the county. It is likely that the Regional Partnership Council will need to make hard decisions about how to spend limited dollars in the current environment. The following section describes key issues for the Regional Partnership Council to consider as it moves forward.
Child Care Centers and Homes
While child care in Santa Cruz County is generally less expensive than in other regions of the state, it remains unaffordable for many of the region’s families. In addition, the cost of child care in the county has increased over time, while the availability of subsidies through the state’s Child Care Assistance Program has decreased. It can, therefore, be expected that an increasing number of children will be unable to take advantage of the early development and school readiness opportunities that child care centers and homes provide because their parents are unable to afford the cost of such care.
Data on the wages and educational background of child care professionals in Santa Cruz County is also of concern. Wages for child care teachers and directors in the county have actually decreased over time and may threaten the ability of child care centers to recruit and retain high quality staff. Additionally, most child care professionals in the county lack a degree beyond a high school diploma. The cost of obtaining additional training and certification, coupled with low wages, creates a large barrier to professional development for child care teachers and assistants. The impact over time may be an early childhood education system without sufficient personnel to provide high quality care.
Engaging Parents in their Children’s Early Learning
Overall, parents in Santa Cruz County demonstrate a strong understanding of early childhood development. The majority provide appropriate responses to questions designed to gauge their

First Things First Arizona Early Childhood Health and Development Board
Regional Needs and Assets Report — Santa Cruz County Regional Partnership Council — 93
awareness of issues affecting young children. However, a few areas of divergence suggest that more education may be needed about the importance of parents’ engaging with children and the impact this engagement has on children’s learning. For example, a significant minority of parents believe that children’s ability to learn is pre‐determined from birth and that listening to English on the television is adequate for language development. Similarly, key stakeholders report that many families hold a general belief that children’s learning begins at age 5, when they enter kindergarten. These misconceptions suggest that opportunities are being lost for parents to engage with their young children and foster their children’s early learning ability.
This combination of beliefs about children’s learning needs and the cost of child care homes and centers may be making it more difficult to interest some families in enrolling their pre‐schoolers in child care. For many families, a “babysitter” is the alternative — this low‐wage worker is usually carrying out a variety of household chores, while also charged with overseeing the young children in the household. As a result, these children most likely do not benefit from the learning environment that youngsters participating in child care homes and centers are experiencing.
Working with Schools
The lack of emphasis in engaging young children and developing their ability to learn before they enter school may partially contribute to the generally low scores on DIBELS tests administered in kindergarten. Santa Cruz County children entering kindergarten score below state averages, suggesting that they start the school system at a disadvantage for academic success. Test scores are much improved, however, for Santa Cruz County children once they reach the third grade.
This indication of progress, along with feedback from key stakeholders that many families view the school system as a primary source of information about development and services for their children, suggests that schools in the county can be a strong partner to support child development and education. It is important to note that schools within the county appear to vary in quality; schools report dramatically different test score results and receive highly divergent ratings of their effectiveness from the state.
Health Care Gaps
Santa Cruz County’s health care system lacks capacity in several key areas and has been designated as a federal medically underserved area. There is also a shortage of mental and dental health care, where again, Santa Cruz County has been designated a mental health professional shortage area and a geographic dental health professional shortage area. For example, some county residents report travelling 20 miles or more to obtain services from a dentist.
Data on immunizations, nutrition, and physical activity also suggest unmet health needs among Santa Cruz County’s children. Available data on immunizations indicate that many families do not keep their children up‐to‐date on their vaccinations during the pre‐school years and only catch up when the children are entering kindergarten.
First Things First Arizona Early Childhood Health and Development Board
Regional Needs and Assets Report — Santa Cruz County Regional Partnership Council — 94
The data regarding the receipt of prenatal care during the first trimester is also worrisome. Approximately one‐third of pregnant women living in the county did not access prenatal care during this critical phase of their pregnancy. While the percentage of women initiating their prenatal care during the first trimester is increasing, it is an issue deserving of attention.
In addition, as is true for communities throughout the United States, physical activity, nutrition, and weight are issues of concern for children in the county. These risk factors bring with them a variety of chronic diseases which these children may develop over the course of their lives. Physical activity programs in schools and local communities, while difficult to fund in the current environment, offer a much‐needed opportunity for many local children.
Funding cuts will likely further reduce the ability of children in Santa Cruz County to access needed health care. Cuts to the KidsCare program, a primary source of health care coverage for low‐income children, will leave more families without access to care. Additionally, these reductions have the potential to impact the capacity of the Mariposa Community Health Center, the primary source of affordable health care for families in the county.
Basic Needs
The current safety net of services for families is stretched extremely thin. Data suggest that a large number of families have basic needs for assistance with food and housing that they are unable to meet. The current environment of continued poverty and unemployment can only increase the demand for such assistance. At the same time, state budget deficits are likely to result in additional cuts to basic assistance programs.
As families in the region experience greater hardship, they will be hard pressed to find the services their children need. This fundamental undermining of the local safety net has the potential to dramatically impact the ability of the region’s families to obtain the food, clothing, and housing necessary to support their children’s basic growth and development.
Overcoming Geographic Barriers to Services
Communities within Santa Cruz County range from larger jurisdictions such as Nogales and Rio Rico in the western portion of the county, to smaller and more isolated towns such as Elgin in the eastern part of the county. Services are heavily concentrated in Nogales. Coupled with a lack of effective public transportation, the distribution of services creates access barriers for families living in the eastern portions of the county.
Many surveyed parents agree that location, as well as hours of service, are key obstacles to getting the services they need. Key stakeholders also suggest that a mobile model of outreach and service provision, such as the bookmobile, may be a good approach to reach the households living in the more rural areas of the county.
Culturally Appropriate Services
Most families with children in Santa Cruz County are Hispanic. According to surveyed parents, service providers in Santa Cruz County do a good job of ensuring that materials and services are available in Spanish. In addition, culturally‐appropriate program models such as Mariposa Community Health Center’s Promotoras program is an excellent example of a service designed around the cultural values and approaches familiar to the Hispanic community.
First Things First Arizona Early Childhood Health and Development Board
Regional Needs and Assets Report — Santa Cruz County Regional Partnership Council — 95
However, key stakeholders suggest that the region’s safety net could do more to ensure that the services provided are truly effective for Hispanic families. These individuals point out that generic community education messages and service models that do not specifically incorporate the values and methods familiar to Hispanic families are not likely to work in Santa Cruz County.
Service Coordination
Stakeholders describe varying levels of collaboration among Santa Cruz County’s service providers. As is often the case, many line staff appear to have forged solid working relationships across agencies while staff higher up in their organizations have more competitive relationships as they seek community resources and support. While this is common in many communities, it often leads to less than optimal coordination of services.
Building a stronger safety net, including strengthening the coordination among service providers, is a leadership role the Regional Partnership Council could take on. It is particularly important now as resources are diminishing and families’ needs are growing. Bringing service providers and community members together to align resources and services in ways that best meet the needs of local families and their young children is a vital role the Council could play.
In addition, the implementation of family resource centers in Nogales and Rio Rico offers the opportunity to improve coordination by bringing many service providers together in one location. This step is often critical in helping families find the services they need for their young children. However, families in the eastern portion of the county are not likely to use these centers as they are too far away. This provides another opportunity for the Regional Partnership Council: to provide leadership in developing approaches that will bring additional capacity in early childhood development to families in the rural areas of the county.

First Things First Arizona Early Childhood Health and Development Board
Regional Needs and Assets Report — Santa Cruz County Regional Partnership Council — 96
A — Appendix — Child Care Providers
Total Licensed Capacity Zip Days of Care 24‐Hour?
Population Age Group Accreditation?
4 85621 M, TU, W, TH, F N 2, 3, 4 – 5, 5 – 12
4 85621 M, TU, W, TH, F,
SA, SU Y Under 1, 2, 3, 4 –
5, 5 – 12
45 85621 M, TU, W, TH, F N 2, 3, 4 – 5, 5 – 12
30 85621 M, TU, W, TH, F N 4 – 5
42 85621 M, TU, W, TH, F N 3, 4 – 5
4 85621 M, TU, W, TH, F N Under 1, 1, 2, 3, 4
– 5, 5 – 12
4 85621 M, TU, W, TH, F N Under 1, 1, 2, 3, 4
– 5, 5 – 12
4 85621 M, TU, W, TH, F N Under 1, 1, 2, 3, 4
– 5, 5 – 12
4 85621 M, TU, W, TH, F N Under 1, 1, 2, 3, 4 – 5, 5 – 12, 13+
4 85621 M, TU, W, TH, F,
SA N Under 1, 1, 2, 3, 4
– 5
4 85621 M, TU, W, TH, F N Under 1, 1, 2, 3, 4
– 5, 5 – 12
4 85621 M, TU, W, TH, F,
SA Y Under 1, 1, 2, 3, 4 – 5, 5 – 12, 13+
4 85621 M, TU, W, TH, F,
SA N Under 1, 1, 2, 3, 4 – 5, 5 – 12, 13+
4 85621 M, TU, W, TH, F,
SA N Under 1, 1, 2, 3, 4
– 5, 5 – 12
37 85621 M, TU, W, TH, F N 2, 3, 4 – 5
4 85621 M, TU, W, TH, F,
SA, SU Y Under 1, 1, 2, 3, 4
– 5, 5 – 12
4 85621 M, TU, W, TH, F N Under 1, 1, 2, 3, 4
– 5, 5 – 12
4 85621 M, TU, W, TH, F Y Under 1, 1, 2, 3, 4
– 5, 5 – 12
4 85621 M, TU, W, TH, F N Under 1, 1, 2, 3, 4
– 5, 5 – 12
4 85621 M, TU, W, TH, F N Under 1, 1, 2, 3, 4
– 5, 5 – 12
65 85621 M, TU, W, TH, F N 2, 3, 4 – 5
4 85621 M, TU, W, TH, F N 1, 2, 3
4 85621 M, TU, W, TH, F,
SA, SU Y Under 1, 1, 2, 3, 4
– 5, 5 – 12
4 85621 M, TU, W, TH, F Y Under 1, 1, 2, 3, 4
– 5, 5 – 12
35 85621 M, TU, W, TH, F,
SA N 2, 3, 4 – 5, 5 – 12
4 85621 M, TU, W, TH, F,
SA N Under 1, 1, 2, 3, 4
– 5, 5 – 12
4 85621 M, TU, W, TH, F,
SA, SU Y Under 1, 1, 2, 3, 4
– 5, 5 – 12
25 85621 M, TU, W, TH, F N 2, 3, 4 – 5, 5 – 12
100 85621 M, TU, W, TH N 3, 4 – 5, 5 – 12
4 85621 M, TU, W, TH, F,
SA, SU Y Under 1, 1, 2, 3, 4
– 5, 5 – 12

First Things First Arizona Early Childhood Health and Development Board
Regional Needs and Assets Report — Santa Cruz County Regional Partnership Council — 97
Total Licensed Capacity Zip Days of Care 24‐Hour?
Population Age Group Accreditation?
4 85621 M, TU, W, TH, F,
SA N Under 1, 1, 2, 3, 4
– 5, 5 – 12
4 85621 M, TU, W, TH, F,
SA Y Under 1, 1, 2, 3, 4
– 5, 5 – 12
4 85621 M, TU, W, TH, F,
SA N Under 1, 1, 2, 3, 4
– 5, 5 – 12
4 85621 M, TU, W, TH, F N Under 1, 1, 2, 3, 4
– 5, 5 – 12
4 85621 M, TU, W, TH, F N Under 1, 1, 2, 3, 4
– 5, 5 – 12
4 85621 M, TU, W, TH, F Y Under 1, 1, 2, 3, 4
– 5, 5 – 12
124 85621 M, TU, W, TH, F N 3, 4 – 5 Yes
4 85621 M, TU, W, TH, F,
SA Y 1, 2, 3, 4 – 5, 5 –
12
25 85621 M, TU, W, TH, F N 4 – 5 Years Old‐‐
4 85621 M, TU, W, TH, F N Under 1, 1, 2, 3, 4
– 5, 5 – 12
4 85621 M, TU, W, TH, F Y Under 1, 1, 2, 3, 4
– 5, 5 – 12
4 85621 M, TU, W, TH, F N Under 1, 1, 2, 3, 4
– 5, 5 – 12
4 85621 M, TU, W, TH, F N Under 1, 1, 2, 3, 4
– 5, 5 – 12
4 85621 M, TU, W, TH, F N Under 1, 1, 2, 3, 4
– 5, 5 – 12
4 85621 M, TU, W, TH, F,
SA, SU N 3, 4 – 5, 5 – 12 ,
13+
10 85621 M, TU, W, TH, F N 3, 4 – 5, 5 – 12 Yes
60 85621 M, TU, W, TH, F N 4 – 5
40 85621 M, TU, W, TH, F N 3, 4 – 5
4 85621 M, TU, W, TH, F N 2, 3, 4 – 5, 5 – 12
4 85621 M, TU, W, TH, F N Under 1, 1, 2, 3, 4
– 5, 5 – 12
65 85624 M, TU, W, TH, F N 3, 4 – 5
105 85646 M, TU, W, TH, F N 3, 4 – 5, 5 – 12
4 85648 M, TU, W, TH, F N Under 1, 1, 2, 3, 4
– 5, 5 – 12
4 85648 M, TU, W, TH, F,
SA, SU N Under 1, 1, 2, 3, 4
– 5, 5 – 12
30 85648 M, TU, W, TH, F N
4 85648 M, TU, W, TH, F,
SA, SU N Under 1, 1, 2, 3, 4 – 5, 5 – 12, 13+
4 85648 M, TU, W, TH, F,
SA, SU Y Under 1, 1, 2, 3, 4
– 5, 5 – 12
40 85648 M, TU, W, TH N 3, 4 – 5
4 85648 M, TU, W, TH, F,
SA N Under 1, 1, 2, 3, 4
– 5, 5 – 12
4 85648 M, TU, W, TH, F,
SA, SU N Under 1, 1, 2, 3, 4
– 5, 5 – 12
4 85648 M, TU, W, TH, F,
SA Y Under 1, 1, 2, 3, 4 – 5, 5 – 12, 13+
4 85648 M, TU, W, TH, F,
SA, SU Y Under 1, 1, 2, 3, 4 – 5, 5 – 12, 13+
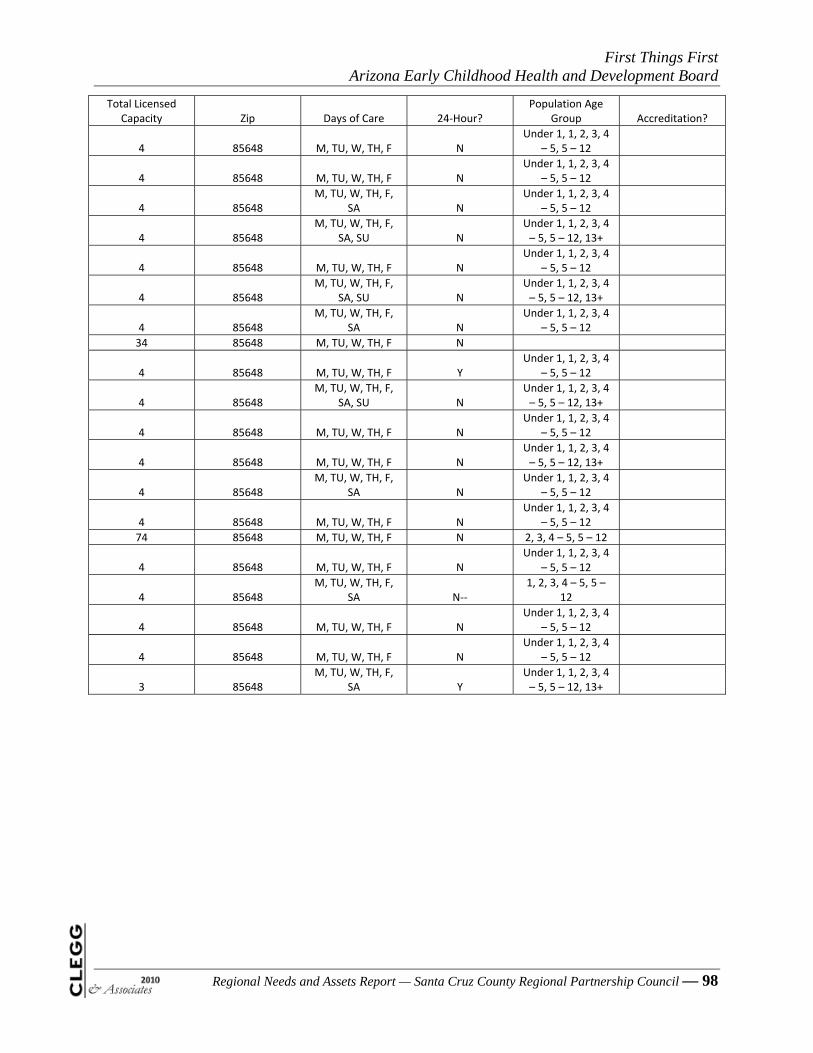
First Things First Arizona Early Childhood Health and Development Board
Regional Needs and Assets Report — Santa Cruz County Regional Partnership Council — 98
Total Licensed Capacity Zip Days of Care 24‐Hour?
Population Age Group Accreditation?
4 85648 M, TU, W, TH, F N Under 1, 1, 2, 3, 4
– 5, 5 – 12
4 85648 M, TU, W, TH, F N Under 1, 1, 2, 3, 4
– 5, 5 – 12
4 85648 M, TU, W, TH, F,
SA N Under 1, 1, 2, 3, 4
– 5, 5 – 12
4 85648 M, TU, W, TH, F,
SA, SU N Under 1, 1, 2, 3, 4 – 5, 5 – 12, 13+
4 85648 M, TU, W, TH, F N Under 1, 1, 2, 3, 4
– 5, 5 – 12
4 85648 M, TU, W, TH, F,
SA, SU N Under 1, 1, 2, 3, 4 – 5, 5 – 12, 13+
4 85648 M, TU, W, TH, F,
SA N Under 1, 1, 2, 3, 4
– 5, 5 – 12
34 85648 M, TU, W, TH, F N
4 85648 M, TU, W, TH, F Y Under 1, 1, 2, 3, 4
– 5, 5 – 12
4 85648 M, TU, W, TH, F,
SA, SU N Under 1, 1, 2, 3, 4 – 5, 5 – 12, 13+
4 85648 M, TU, W, TH, F N Under 1, 1, 2, 3, 4
– 5, 5 – 12
4 85648 M, TU, W, TH, F N Under 1, 1, 2, 3, 4 – 5, 5 – 12, 13+
4 85648 M, TU, W, TH, F,
SA N Under 1, 1, 2, 3, 4
– 5, 5 – 12
4 85648 M, TU, W, TH, F N Under 1, 1, 2, 3, 4
– 5, 5 – 12
74 85648 M, TU, W, TH, F N 2, 3, 4 – 5, 5 – 12
4 85648 M, TU, W, TH, F N Under 1, 1, 2, 3, 4
– 5, 5 – 12
4 85648 M, TU, W, TH, F,
SA N‐‐ 1, 2, 3, 4 – 5, 5 –
12
4 85648 M, TU, W, TH, F N Under 1, 1, 2, 3, 4
– 5, 5 – 12
4 85648 M, TU, W, TH, F N Under 1, 1, 2, 3, 4
– 5, 5 – 12
3 85648 M, TU, W, TH, F,
SA Y Under 1, 1, 2, 3, 4 – 5, 5 – 12, 13+

First Things First Arizona Early Childhood Health and Development Board
Regional Needs and Assets Report — Santa Cruz County Regional Partnership Council — 99
B — Appendix — Citations for Resources
Alliance for Excellent Education. (2009, July). Understanding High School Graduation Rates in
Arizona. Available at <http://www.all4ed.org/files/Arizona_wc.pdf>.
Annie E. Casey Foundation. (2010). Kids Count Data Center: Arizona. Available at
<http://datacenter.kidscount.org/data/bystate/StateLanding.aspx?state=AZ>.
Arizona Department of Economic Security. (2007, 2009). DES Multidata (Unpublished Data).
Retrieved on May 4, 2010 from database.
Arizona Department of Economic Security, Arizona Homeless Coordination Office. (2009,
December). Current Status of Homelessness in Arizona and Efforts to Prevent and Alleviate
Homelessness, 18th Annual Report. Available at
<https://www.azdes.gov/InternetFiles/Reports/pdf/2009_homelessness_report.pdf>.
Arizona Department of Education. (2009). 2008 – 2009 State Report Card. Available at
<http://www.ade.state.az.us/srcs/statereportcards/StateReportCard08‐09.pdf>.
Arizona Department of Education. ADE Student Demographics (Unpublished Data). Retrieved on
April 13, 2010 from database.
Arizona Department of Education, National School Lunch Program & School Breakfast Program.
(2009, October). Free and Reduced Reports: NSLP Free/Reduced as Percent of Total Eligible
Claim Month of October 2009. Available at <http://www.ade.state.az.us/health‐
safety/cnp/frpercentages/free‐educedpercentage_OCT09.pdf>.
Arizona Department of Education. (2010). Graduation Rate and October 1st Enrollment Figures.
Available at <http://www.ade.state.az.us/researchpolicy>.

First Things First Arizona Early Childhood Health and Development Board
Regional Needs and Assets Report — Santa Cruz County Regional Partnership Council — 100
Arizona Department of Health Services (2005, 2007, 2009). Arizona State Immunization
Information System Data Base (ASIIS)(Unpublished Data). Retrieved on May 4, 2010 from
database.
Arizona Department of Health Services. (1998 – 2009). Health Status and Vital Statistics.
Available at < http://www.azdhs.gov/plan/index.htm>.
Arizona Nutrition Network. (2009, July). Arizona Nutrition Network – FY 10 Nutrition Education
Plan. Available at <http://adhswebdev1.com/pdf/FY10%20Materials%20List.pdf>.
Child Care Resource and Referral Southern Arizona. (2010). CC&R Data Pulled April 12, 2010
from Database (Unpublished Data).
Children’s Action Alliance. (2008). A Decade of Data: The Compensation and Credentials of
Arizona’s Early Care and Education Workforce. Available at <http://www.azchildren.org>.
Children’s Action Alliance. (2010). FY 10/11 Arizona Budget Proposals: How Vulnerable Children
and Families Fare. Available at
<http://www.azchildren.org/MyFiles/10%20legislature/leg_budget_3‐10.pdf>.
First Things First. (2008). Complete by Region, Family and Community Survey (Unpublished
Data).
First Things First. (2010). Final Table IV‐Proposed FY 2011 Regional Allocations. Report
presented at the meeting of First Things First – Arizona Early Childhood Development and
Health Board, Flagstaff, AZ.
First Things First. (2010). Final Fiscal Year 2010 Population and Potential Discretionary
Allocation. Report presented at the meeting of First Things First – Arizona Early Childhood
Development and Health Board, Flagstaff, AZ.

First Things First Arizona Early Childhood Health and Development Board
Regional Needs and Assets Report — Santa Cruz County Regional Partnership Council — 101
Food Research and Action Center. (2010, January). Food Hardship: A Closer Look at Hunger —
Data for the Nation, States, 100 MSAs, and Every Congressional District. Available at
<http://www.frac.org/pdf/food_hardship_report_2010.pdf>.
Healthy Communities Institute. Arizona Health Matters. Available at
<http://www.arizonahealthmatters.org/>.
NACCRRA and Association for Supportive Child Care. (2009, March). 2009: Child Care in the
State of: Arizona. Available at <http://www.naccrra.org/randd/data/docs/AZ.pdf>.
National Center for Educational Statistics. Education Statistics — Elementary & Secondary —
Pupil/Teacher Ratio (most recent) by state — Arizona. Available from Rapid Intelligence:
Statemaster.com at <http://www.statemaster.com/graph/edu_ele_sec_pup_rat‐
elementary‐secondary‐pupil‐teacher‐ratio>.
US Census Bureau, American Community Survey Office. (2006 – 2008). 2006 – 2008 American
Community Survey 3‐Year Estimates. Available from American FactFinder at
<http://factfinder.census.gov/servlet/DatasetMainPageServlet?_program=ACS&_submenuI
d=datasets_2&_lang=en&_ts=>.
Wolfersteig, W., Moratto, M., Emge, C., Katz, L., & Valdivia, A. (2009, June). Arizona Reading
First Final External Evaluation Report. Arizona State University. Available at
<http://www.ade.state.az.us/AZReads/reading1st/ExternalEval/FY09APRCANNUALREPORT.
pdf>.