Regional Liquidity Risk and Covered Interest Parity during the
29
1 Regional Liquidity Risk and Covered Interest Parity during the Global Financial Crisis: Evidence from Tokyo, London, and New York * Shin-ichi Fukuda ∗∗ The University of Tokyo 2-9-5 Hongo Bunkyo-ku Tokyo 113-0033, JAPAN Abstract During the global financial crisis, there were substantial deviations from covered interest parity (CIP) condition. In particular, during the post Lehman period, the US dollar interest rate became very low on the forward market, as compared to the rate suggested by the CIP condition. However, the deviations from CIP condition varied not only across currencies but also across markets. After presenting a simple model, the following analysis examines how the CIP condition between the Japanese yen and the US dollar was violated in Tokyo, London, and New York markets. We show that the US dollar interest rate became lowest in the New York market soon after the Lehman shock but was lowest in the Tokyo market during most of the turmoil period. The regression results suggest that credit risk in interbank markets and central banks’ liquidity provisions explain the difference across the markets. However, we observe varieties of asymmetric effects across the markets. JEL codes: G15, G12, F36 Keywords: covered interest parity, credit risk, liquidity risk, interbank market, global financial crisis * This paper was presented at 24th Australasian Finance & Banking Conference to be held at Sydney, Australia on December 14-16, 2011. Earlier versions of this paper were presented at ISE Conference in Noboribetu, Yonsei University, and Annual Hawaii International Business Research Conference. I would like to thank M. Hanazaki, J. Booth, and the other participants of the conferences for their useful comments. ∗∗ Correspondence address: Shin-ichi FUKUDA, Faculty of Economics, University of Tokyo, 2-9-5 Hongo Bunkyo-ku Tokyo 113-0033, JAPAN. E-mail: [email protected] , Fax: +81-3-5841-5521.
Transcript of Regional Liquidity Risk and Covered Interest Parity during the
1
Regional Liquidity Risk and Covered Interest Parity during the Global Financial Crisis:
Evidence from Tokyo, London, and New York *
Shin-ichi Fukuda ∗∗∗∗∗∗∗∗
The University of Tokyo
2-9-5 Hongo Bunkyo-ku Tokyo 113-0033, JAPAN
Abstract
During the global financial crisis, there were substantial deviations from covered interest parity (CIP)
condition. In particular, during the post Lehman period, the US dollar interest rate became very low
on the forward market, as compared to the rate suggested by the CIP condition. However, the
deviations from CIP condition varied not only across currencies but also across markets. After
presenting a simple model, the following analysis examines how the CIP condition between the
Japanese yen and the US dollar was violated in Tokyo, London, and New York markets. We show
that the US dollar interest rate became lowest in the New York market soon after the Lehman shock
but was lowest in the Tokyo market during most of the turmoil period. The regression results
suggest that credit risk in interbank markets and central banks’ liquidity provisions explain the
difference across the markets. However, we observe varieties of asymmetric effects across the
markets.
JEL codes: G15, G12, F36
Keywords: covered interest parity, credit risk, liquidity risk, interbank market, global financial crisis
* This paper was presented at 24th Australasian Finance & Banking Conference to be held at Sydney, Australia on December 14-16, 2011. Earlier versions of this paper were presented at ISE Conference in Noboribetu, Yonsei University, and Annual Hawaii International Business Research Conference. I would like to thank M. Hanazaki, J. Booth, and the other participants of the conferences for their useful comments. ∗∗ Correspondence address: Shin-ichi FUKUDA, Faculty of Economics, University of Tokyo, 2-9-5 Hongo Bunkyo-ku Tokyo 113-0033, JAPAN. E-mail: [email protected], Fax: +81-3-5841-5521.

2
1. Introduction
In a well-integrated money market, covered interest parity (CIP) condition was perceived to
be solidly anchored in riskless arbitrage for international asset pricing. However, reflecting various
risk characteristics, deviations from CIP condition became substantial during previous crises (see, for
example, Taylor, 1989; Rhee and Chang, 1992 for earlier contributions in literature). For unsecured
rates such as LIBOR, deviations were widened reflecting creditworthiness of financial institutions.
However, even for secured rates such as overnight index swap (OIS) rates, deviations were still
substantial during the global financial crisis. From June 1, 2006 to June 14, 2010, Figure 1 depicts
daily deviations from CIP condition between the US dollar and each of the five non-US dollar
currencies: Japanese yen, Singapore dollar, Sterling pound, Euro, and Danish krone. We calculated
deviations from CIP condition by the annualized value of (1+iust) – (1+int)(ft+1/et), where i
ust is
three-month US dollar OIS rate, int is three-month non-US dollar OIS rate, et is the spot exchange rate
between the two currencies, and ft+1 is its three-month forward exchange rate. For all combinations,
deviations from the CIP condition had been negligible until the beginning of August 2007. But
significant downward deviations had occurred since mid August 2007. In particular, there were large
downward deviations after the Lehman shock on September 15 in 2008. The downward deviations
were stabilized around the end of 2008 but had been significant until summer of 2009.
Among the five non-US dollar currencies, the deviations were largest in Danish krone and
smallest in Singapore dollar. But the choice of the currencies did not make substantial difference for
the deviations. The OIS rates are secured rates that measure market participants’ expected average
policy rate over the relevant term. Since secured arbitrage, as opposed to unsecured, removes many
of the counter-party credit risks, this may imply that potential liquidity risk in the US dollar was the
dominant source in violating the CIP condition. During the global financial crisis, the US dollar as
international liquidity came to have lower interest rate on the forward market. However, liquidity
risk may differ not only across currencies but also across markets. In particular, it is likely that the
US dollar funding is tighter when the New York market is closed.

3
The purpose of this paper is to examine how deviations from the CIP condition varied across
the markets during the global financial crisis. During the crisis, financial sectors expanded their
prudential hoarding of the US dollar in the face of growing internal funding and liquidity needs, as
well as limited capital to pledge in exchange for liquid funds. Consequently, only the US dollar
interest rate became low on the forward market during the global financial crisis. After presenting a
simple model that describes such an economy, we calculate CIP condition between the Japanese yen
and the US dollar and examine how it was violated in 2007-2009 in the three markets: Tokyo, London,
and New York. We show that the US dollar interest rate temporarily became lowest in the New York
market soon after the Lehman shock but was lowest in the Tokyo market during most of the post
Lehman turmoil. This implies that liquidity shortage of the US dollar during the post Lehman
turmoil was most serious in Tokyo time when the New York market is closed. The regression results
suggest that credit risk in interbank markets and central banks’ liquidity provisions explain the
difference across the markets. However, we find various asymmetric effects across the markets.
In previous literature, several studies have explored sources of deviations from CIP condition
under the global financial crisis. Baba and Packer (2009a,b) are one of the first attempts and find
that deviations from covered interest parity were negatively associated with the creditworthiness of
European and US financial institutions. The authors such as Fong, Valente, and Fung (2009) and
Coffey, Hrung, and Sarkar (2009) show that in addition to credit risk, liquidity and market risk played
important roles in explaining the deviations. Grioli and Ranaldo (2010) find that the results were
essentially the same even if we used secured rates such as OIS.
The following analysis confirms many of the findings in previous studies. However, unlike
previous studies, this analysis investigates how CIP condition was violated in three alternative
markets: Tokyo, London, and New York. We show that deviations from CIP condition showed
different features across the markets soon after the Lehman shock. We find that market-specific risk
premiums discussed in Fukuda (2011) explain the difference across the interbank markets. We also
find that some coordinated central bank liquidity provision was useful in reducing liquidity risk.
4
There are several studies on the effects of central bank liquidity provisions during the global financial
crisis in recent literature. Taylor and Williams (2009) show how TAF affected risk premiums in the
US interbank market. Goldberg, Grittini, Miu, and Rose (2009) show the contribution of foreign
exchange swap lines among central banks to reducing dollar funding pressures and limiting stresses in
money markets (see also Genberg, Hui, Wong and Chung, 2009; Aizenman and Pasricha, 2009 for
their recent contribution to the same topic). However, unlike these studies, we find that central bank
liquidity provisions had varieties of asymmetric effects across the markets.
The rest of the paper is organized as follows. After exploring a simple model of our analysis
in Section 2, Section 3 investigates deviations from CIP condition in the three markets. After
explaining a basic framework of our econometric tests in Section 4, Section 5 explains how to
measure counter-party credit risk and liquidity risk. Section 6 and Section 7 report the results of our
regressions. Section 8 concludes and refers to the implications.
2. A Theoretical Model
To see how international liquidity risk is reflected in CIP condition, we consider a
representative agent model in a small open economy. In the economy, there are one illiquid asset
and two liquid assets. The illiquid asset which is used for production is domestic fixed asset
denominated in the local currency. The two liquid assets which mitigate losses from liquidity shocks
are domestic liquid asset and foreign liquid asset. The domestic liquid asset is denominated in the
local (non-US dollar) currency, whereas the foreign liquid asset is denominated in the international
currency (that is, the US dollar). The representative consumer chooses his or her real consumption
stream and the combination of the illiquid and liquid assets so as to maximize the following expected
utility:
(1) 0
( ),it t jj
E u Cβ∞
+=∑

5
where β is discount factor such that 0 < β < 1 and E t is conditional expectation operator based on the
information at period t. In the following analysis, we denote real value of illiquid asset at the end of
period t by Kt and nominal values of domestic and foreign liquid assets at the end of period t by At and
A*t respectively. Then, for all t, the consumer’s budget constraint is written as:
(2) Pt Kt + At + StA*t = (1+it-1) At-1 + (1+i*t-1)FtA*t-1 + Pt {θtY(Kt-1) – Lt – Ct },
where Pt = domestic price, it-1 = nominal interest rate of domestic liquid asset, i*t-1 = nominal interest
rate of foreign liquid asset, St = spot exchange rate, Ft = forward exchange rate, and Lt = real loss from
liquidity shocks. For all variables, subscript denotes time period. θt Y(Kt-1) is real output in period t
which is increasing and concave function of Kt-1. θt is multiplicative productivity shock.
Because of nominal contract, the consumer cannot hedge domestic inflation risk for the two liquid
assets under the budget constraint (2). However, since Ft is forward exchange rate contracted in
period t-1, the consumer covers the foreign asset’s exchange risk by the forward contract. Thus,
even if the spot exchange rate is volatile, the consumer faces no uncertainty on the one-period
nominal return from holding the foreign liquid asset.
In our economy, real output in period t depends on productivity shock in period t and illiquid asset
at the end of period t-1. However, both local and international liquidity shocks hit the economy and
deteriorate the output at the beginning of each period. As previous studies such as Allen, Carletti,
and Gale, (2009) suggest, the size of the production loss Lt depends on real values of the liquid assets
the consumer holds in period t. Following a shopping time model of money in literature, we assume
that the loss from the local liquidity shock LDt(At/Pt) is decreasing and convex function of At/Pt,
whereas the loss from the international liquidity shock LFt (A*t/P*t) is decreasing and convex function
of A*t/P*t where P*t is foreign price in period t. We can thus denote the total loss from the liquidity
shocks as follows

6
(3) Lt = LDt (At/Pt) + (StP*t /Pt)L
Ft (A*t/P*t),
where LDt' (⋅) < 0, LD
t" (⋅) > 0, LF
t' (⋅) < 0, and LF
t" (⋅) > 0. Since the loss from the international shock
is denominated in the international currency, it is multiplied by (StP*t /Pt) to adjust the real exchange
rate.
The representative consumer maximizes (1) subject to (2) and (3). The first-order conditions of
the constrained maximization lead to
(4) u' (C t) = β Y' (Kt) E t{θt+1 u' (C t+1)},
= β [(1+it)/{1+LDt' (At/Pt)}] E t{(Pt/Pt+1)u
' (C t+1)},
= β [(1+i*t)(Ft+1/St)/{1+LFt' (A*t/P*t)}] E t{(Pt/Pt+1)u
' (C t+1)}.
Rearranging the last equality of the first-order conditions, we obtain the following modified CIP
condition:
(5) (1+it)/{1+LDt' (At/Pt)} = (1+i*t)(Ft+1/St)/{1+L
Ft' (A'*t/P*t)}.
Since LDt' (At/Pt) = L
Ft' (A*t/Pt) = 0 without liquidity shocks, equation (5) is degenerated into
standard CIP condition when there is no liquidity shock. However, when the two liquid assets have
different marginal contributions in mitigating the liquidity shocks, the condition (5) implies that the
standard CIP condition does not hold. Equation (5) indicates that the difference between 1+it and
(1+i*t)(St/Ft+1) depends on the relative magnitude between LDt' (At/Pt) and L
Ft' (A*t/P*t). In particular,
when LFt' (A*t/P*t) < L
Dt' (At/Pt) < 0, it holds that 1+it > (1+i*t)(Ft+1/St).
During the global financial crisis, the shortage of international liquidity increased marginal benefits
of holding the US dollar large in many countries. To the extent that A*t is foreign liquid assets

7
denominated in the US dollar, this implies that the absolute value of LFt' (AF
t/P*t) became large during
the crisis. The condition (5) thus explains why the US dollar interest rate became lower on the
forward market during the crisis. However, we need to note that the loss from the shortage of
international liquidity may differ across different markets. For example, in terms of volume of the
US dollar transactions, the London and the New York markets are thicker than the Tokyo market. In
addition, the New York market is always closed when the Tokyo market is open, so that it is less likely
that FRB supplies US dollar liquidity directly when the Tokyo market is open. This may imply that
the Tokyo market may have larger absolute value of LFt' (A*t/P*t) than the other two markets. In the
following sections, we test the validity of this conjecture.
3. Deviations from CIP in the Three Markets
In the following analysis, we examine the degree of deviations from CIP condition before and
after the global financial crisis. By using daily data of three-month OIS rates, we calculate CIP
condition between the Japanese yen and the US dollar and examine how it was violated in the three
markets during the global financial crisis in 2007-2009. The spot exchange rates and three-month
forward exchange rates used for each market are their interbank middle rates at 5pm in Tokyo time, at
4pm in London time, and at 5pm in New York time respectively. Unfortunately, yen-denominated
OIS rates are available only in Tokyo time, whereas dollar-denominated OIS rates are available only
in NY time. For dollar-denominated OIS rates, we thus approximate date t rates in Tokyo time by
date t-1 rates in NY time and date t rates in London time by date t rates in NY time. Similarly, for
yen-denominated OIS rates, we approximate date t rates in London and NY times by date t rates in
Tokyo time. The approximations are based on the assumption that market participants expect no
policy change of FRB when the NY market is closed and no policy change of the BOJ when the
Tokyo market is closed. Since the daily changes of the OIS rates are very small, the effects of the
time difference on the CIP condition will be negligible by the approximations.
For the three markets, we calculate deviations from CIP condition by the annualized value of

8
(1+iust) – (1+ijpt)(ft+1/et), where i
ust is three-month US dollar OIS rate, i
jpt is three-month Japanese yen
OIS rate, et is the yen-dollar spot exchange rate, and ft+1 is its three-month forward exchange rate.
The units of the interest rates are basis points. The spot and forward exchange rates in London time
and the dollar-denominated OIS rates are downloaded from the Datastream, whereas the spot and
forward exchange rates in Tokyo and NY times are downloaded from the Nikkei Quick database.
The yen-denominated OIS rates are from Tokyo Tanshi Co. Ltd.
Table 1 summarizes biannual average of the deviations from the CIP condition in the three
markets from 2007 to 2009. It indicates that the absolute value of the deviations from the CIP
condition were less than 10 basis points in all of the markets in the first half of 2007. But after the
latter half of 2007, the negative deviations were more than quadruplicated in the three markets. In
particular, the absolute value of the deviations exceeded 130 basis points in the latter half of 2008.
In the latter half of 2009, the deviations were almost stabilized but their absolute values were larger
than those in the first half of 2007. The absolute values of the deviations were similar across the
three markets. But except in the first half of 2008, the Tokyo market had the largest deviations.
The Tokyo market had larger deviations than the other two markets especially after the second half of
2008.
Table 2 reports monthly average of the deviations from the CIP condition in the three markets
from July 2008 to March 2009. To see the changes before and after the Lehman shock, it also
reports averaged deviations in the three markets in the first-half and the second-half of September
2008. The New York market had the largest deviations in September 2008. In particular, the
difference between the New York and the other two markets became substantial in the second half of
September 2008. This suggests that reflecting a series of unexpected shocks originated in New York
or in Washington D.C., the New York market faced more serious liquidity shortage soon after the
Lehman shock. However, except in September 2008 and in November 2008, the Tokyo market still
had the largest deviations. This implies that the Tokyo market faced the largest liquidity shortage
and had the lowest US dollar interest rate during most of the turmoil period.

9
To test whether the deviations from the CIP condition in the Tokyo market are significantly
different from those in the other two markets, Table 3 reports mean value of the difference between
the markets and its t-statistics for three alternative sample periods: from January 2, 2007 to August 31,
2008, from September 1, 2008 to September 30, 2008, and from October 1, 2008 to December 31,
2009. In the table, “Tokyo-London” indicates the difference between the Tokyo and London markets
and “Tokyo-NY” indicates the difference between the Tokyo and New York markets. Each mean
value indicates that the Tokyo market had larger negative deviations than the other two markets from
January 2, 2007 to August 31, 2008 and had smaller negative deviations from September 1, 2008 to
September 30. But its t-value implies that the differences across the markets were not statistically
significant before October 2008. In contrast, the Tokyo market had not only larger but also
statistically significant negative deviations than the other two markets from October 1, 2008 to
December 31, 2009. Each t-value suggests that the Tokyo market had significantly lower US dollar
interest rate than the other two markets during the post-Lehman turmoil period.
4. Empirical Specification
The purpose of the following sections is to examine what caused substantial deviations from
CIP condition during the global financial crisis. Since our main interest is to compare deviations in
different markets, the following analysis allows market-specific factors for the deviations.
Specifically, we define deviations from CIP condition in market h in period t by Devt(h) ≡ {1+i us t(h)}
– {1+ijp t(h)}{ft+1(h)/et(h)} for all h, where i us t(h) is three-month US dollar OIS rate, i
jp t(h) is
three-month yen OIS rate, et(h) is the yen-dollar spot exchange rate in market h, and ft+1(h) is its
three-month forward exchange rate. We then estimate the following equation:
(6) Devt(h) = constant term + ∑h ah Creditt(h) + ∑h bh Liquidityt(h) + c Markett,
where h = Tokyo, London, or New York. The unit of Devt(h) is basis point.

10
Our theoretical result implies that the degree of the deviations depends on LFt' (A*t/P*t) and
LDt' (At/Pt). Unfortunately, we cannot observe such notional variables directly. We thus use not
only liquidity risk measure in market h in period t but also credit risk measure in interbank market h in
period t. As previous studies mentioned, deviations from CIP condition might depend on credit risk
in interbank markets even if we use secured rates. This is because liquidity risk may increase as
credit risk increases in interbank markets. The following analysis follows this idea and explores how
some credit and liquidity risk measures in interbank markets affected deviations from CIP condition
during the global financial crisis.
In the right hand side of (6), Creditt(h) is credit risk measure in interbank market h in period
t. During the global financial crisis, the credit quality of European and US banks deteriorated
substantially, but that of Japanese banks did not. This suggests that some credit risk might be
market-specific in the sense that the London and the New York interbank markets might have carried
a larger counter-party credit risk than did the Tokyo interbank market during the crisis.
Liquidityt(h) is liquidity risk measure in market h in period t which may not be correlated
with our credit risk measure. In the financial turmoil, some traders are not given as much “balance
sheet” to invest, which is perceived as a shortage of liquidity to them. Under this situation, the
traders at one bank are reluctant to expose their bank’s funds during a period of time where the funds
might be needed to cover the bank’s own shortfalls. Consequently, term loan markets come under
stress, and term interest rates may be disconnected from overnight interest rates. Because of the role
of the US dollar as international liquidity, the traders were especially sensitive to a liquidity shortage
of the US dollar in international transactions. It is likely that Liquidityt(h) is more conspicuous in
terms of the US dollar and in the market where the US dollar transactions are less thick.
In addition to these variables, we include the Chicago Board Options Exchange Volatility
Index (VIX) for Markett in (6). The VIX is a popular measure of the implied volatility of S&P 500
index options. A high value corresponds to a more volatile market and therefore, more costly
options. Often referred to as the fear index, the VIX represents a measure of the market’s

11
expectation of volatility over the next 30-day period. We use this measure as a proxy of market risk
in the US market.
5. “Credit Risk” and “Liquidity Risk”
5.1. Credit risk
To measure credit risk in interbank markets, the following analysis uses the spreads between
LIBOR and OIS rate and those between TIBOR and OIS rate. LIBOR (London Interbank Offered
Rate) is a daily reference rate in the London interbank market, while TIBOR (Tokyo Interbank
Offered Rate) is a daily reference rate in the Tokyo offshore market. Both dollar-denominated and
yen-denominated rates are available for LIBOR and TIBOR. Since LIBOR and TIBOR are based on
the interest rates at which banks borrow unsecured funds from other banks in each interbank market,
each spread reflects a counterparty credit risk in each currency in each interbank market. That is, the
US dollar-denominated LIBOR–OIS spread reflects US dollar-specific credit risk in the London
market, while the yen-denominated LIBOR–OIS spread reflects yen-specific credit risk in the London
market. Similarly, the US dollar-denominated TIBOR–OIS spread reflects US dollar-specific credit
risk in the Tokyo market, while the yen-denominated TIBOR–OIS spread reflects yen-specific credit
risk in the Tokyo market.
Both dollar-denominated and yen-denominated LIBORs are published by the British
Bankers’ Association, after 11:00 a.m. each day (Greenwich Mean Time). Yen-denominated TIBOR
is published by Japanese Bankers Association after 11:00 a.m. each business day (Tokyo time), while
dollar-denominated TIBOR is the data collected by Bloomberg and Nikkei Quick News Inc. at the
Tokyo close. In calculating the spreads, we use daily data of their three-month rates. The data of
yen-denominated TIBOR was downloaded from the Nikkei Quick data base, while the data of
dollar-denominated LIBOR was downloaded from DataStream. The data sources of OIS rates are
the same as those in section 3. Given the time differences across the markets, we used the
LIBOR–OIS spreads on the same calendar day for the London and the New York markets but those on

12
the last business day for the Tokyo market. In contrast, we used the TIBOR–OIS spreads on the
same calendar day for all of the markets.
Unfortunately corresponding credit risk measure is not available in New York market.
Given the integration between London and New York markets, we thus use the LIBOR–OIS spreads
as credit risk measures for the New York market. We also use daily cross-sectional standard
deviation of Federal Funds (FF) rates as a proxy of dollar-denominated credit risk in the New York
market. To the extent that credit risk is heterogeneous, the standard deviation will increase as credit
risk increases in the New York interbank market. To adjust the time differences, we used the
standard deviation of FF rates on the same calendar day for the New York market but those on the last
business day for the Tokyo and the London markets.
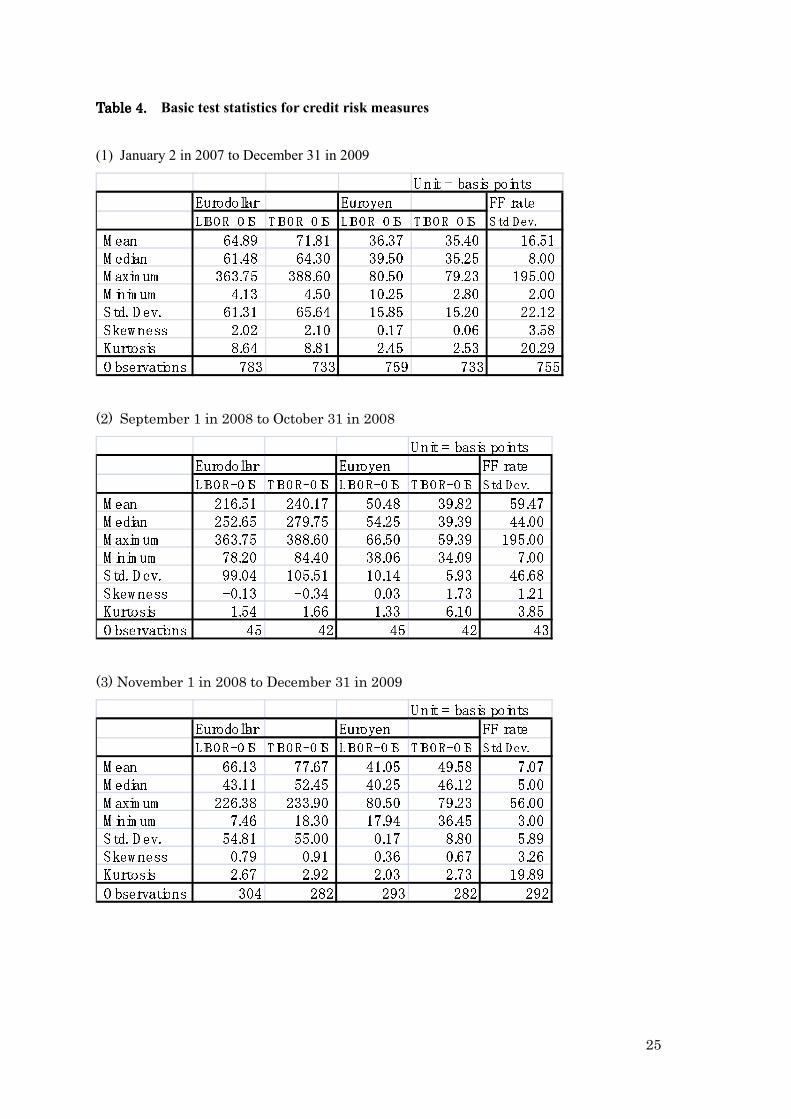
Table 4 summarizes basic test statistics for these daily credit risk measures for the whole
sample period from the beginning of January 2007 to the end of December 2009. It also reports
those for the two subsample periods: from September 2008 to October 2008 and from November 2008
to December 2009. Concerning the currency-specific spreads, the dollar-denominated spreads have
larger mean, standard deviation, and skewness than the yen-denominated spreads. This indicates that
the dollar-denominated spreads are not only larger but also are more volatile and more skewed in the
distribution. The feature was especially conspicuous from September 2008 to October 2008 when
the Lehman shock occurred. During the most turbulent period, the dollar-denominated spreads were
more than tripled, while the yen-denominated spreads were widened only modestly. This implies
that currency-specific risk rose mainly in the US dollar soon after the Lehman shock. However, the
difference between the two currency-specific spreads became smaller from November 2008 to
December 2009. During the post Lehman period, the dollar-denominated spreads decreased
substantially, while the yen-denominated spreads still remained large.
Concerning the market-specific spreads, TIBOR-OIS spreads are larger than LIBOR-OIS
spreads when denominated in the US dollar but smaller when denominated in the Japanese yen. This
was especially true from September 2008 to October 2008. This implies that dollar-specific risk

13
went up more in the Tokyo market than in the London market soon after the Lehman shock. But the
other statistics are essentially the same between the two types of the spreads. In addition, the
yen-denominated TIBOR-OIS spreads turned to be larger than the yen-denominated LIBOR-OIS
spreads after November 2008. The statistics for standard deviation of FF rates indicates that the
volatility of the FF rates changed substantially during the turmoil period. The standard deviation of
FF rates increased dramatically soon after the Lehman shock. But they were stabilized substantially
after November 2008.
5.2. Liquidity risk
Unlike credit risk, it is difficult to measure liquidity risk directly. But during the global
financial crisis, the central banks made several attempts to improve liquidity premiums in money
markets. To the extent that each central bank has the ability to reduce the liquidity risk premium
effectively, measuring the effects of these attempts is a first step toward understanding the nature of
the liquidity risk premium. In the following analysis, we estimate the effects of the Federal Reserve
Bank (FRB)’s Foreign Exchange (FX) Swap Lines with the Bank of Japan (BOJ) and the Bank of
England (BOE). The FX swap facilities are designed to improve liquidity conditions in global
money markets by providing foreign central banks with the capacity to deliver U.S. dollar funding to
institutions in their jurisdictions. Using funds accessed through the swaps, several central banks
such as BOJ and BOE provided dollar liquidity to institutions in the regions. For each FX swap lines,
we include a dummy which equals to the amount allocated on the dates for the operations and zero
otherwise. The unit of the amount is billion US dollar.
In addition, to measure the effects of alternative central banks’ attempts to reduce liquidity
risk premium, we include dummies for the FRB’s Term Auction Facility (TAF)1 and two types of
BOJ’s liquidity provisions, that is, “outright purchases of CP” and “special funds-supplying
1 Under the Term Auction Facility (TAF), the FRB auctions term funds to depository institutions in the United States. All depository institutions that are eligible to borrow under the primary credit program is eligible to participate in TAF auctions.

14
operations to facilitate corporate financing”.2 The dummy variable for each liquidity provision
equals to the amount allocated on the dates for the operations and zero otherwise. The unit of the
amount is billion US dollar for the FRB’s operation and billion Japanese yen for each BOJ’s operation
respectively. These liquidity provisions and the FX swaps could have different effects on deviations
from CIP condition in each market. The swaps credit of the US dollar was available only to
depositories outside the U.S. in the countries in which the central bank participated in the swaps
program, while the TAF credit of the US dollar was only directly available to depository institutions
located in the U.S. The BOJ’s “outright purchases of CP” and “special funds-supplying operations
to facilitate corporate financing” increase availability of the Japanese yen only for financial
institutions located in Japan. Comparing the effects of these facilities, we can see the difference of
the liquidity premiums across the markets and across the currency denominations.
We constructed the BOJ’s liquidity provision dummies based on the same calendar day for
all of the markets. However, to allow the time differences across the markets, we constructed the
BOE’s swap line dummy variable based on the same calendar day for the London and the New York
markets but based on the last business day for the Tokyo market. We also constructed the FRB’s
TAF dummy variable based on the same calendar day for the New York market but based on the last
business day for the Tokyo and the London markets.
6. Econometric Tests
This section reports our empirical results concerning the effects of various credit risk
measures and liquidity measures on the deviations from the CIP condition in the three markets. In
each regression we use daily data during the sample period from January 2, 2007 through December
30, 2009, a span of time that includes both the market turmoil period and a comparable period of time
2“Outright purchases of CP” is operations to purchase CP and ABCP that are deemed eligible as collateral by the BOJ and are a-1 rated, with a residual maturity of up to three months. “Special funds-supplying operations to facilitate corporate financing” is operations by which the BOJ extends loans to its counterparties for an unlimited amount against the value of corporate debt submitted to the BOJ as collateral.

15
before and after the turmoil. The units of the interest rates are basis points. We run OLS
regressions for equation (6) with two lagged dependent variables. The standard errors of the
coefficients are calculated by Newey-West HAC Standard Errors & Covariance with lag truncation 6.
The estimated results are summarized in Table 5. Several credit and liquidity risks had significant
but asymmetric effects on the CIP condition across the markets.
6.1 The effects of credit risk measures
Most market-specific credit risk measures have a significant effect on the deviations from
the CIP condition in the three markets. In the Tokyo market, the dollar-denominated TIBOR–OIS
spread (i.e., “Dollar TIBOR spread”) had a significantly negative effect, while the yen-denominated
TIBOR–OIS spread (i.e., “Yen TIBOR spread”) had a significantly positive effect. In contrast, in the
London and NY markets, the dollar-denominated LIBOR–OIS spread (i.e., “Dollar LIBOR spread”)
and the standard deviation of FF rates (i.e, “Std Dev. of FF rate”) had a significantly negative effect,
while the yen-denominated LIBOR–OIS spread (i.e., “Yen LIBOR spread”) had a significantly
positive effect. Given the integration between the London and the NY markets, these results indicate
that an increase in US dollar-specific credit risk in each market exacerbates the negative deviations in
the forward contract market, while an increase in yen-specific credit risk in each market reduces the
deviations.
However, when both TIBOR spreads and LIBOR spreads are included in the same equation,
most credit risk measures have a significant but asymmetric effect on the deviations from the CIP
condition in the three markets. That is, in contrast to “Dollar TIBOR spread”, “Dollar LIBOR
spread” had a significantly positive effect in the Tokyo market. In contrast to LIBOR spreads,
“Dollar TIBOR spread” had a significantly positive effect, while “Yen TIBOR spread” had a
significantly negative effect in the London and NY markets. These asymmetries indicate that the
effects of the increased credit risk on the deviations are market-specific and might be mean-reverting
in the other markets. In violating the CIP condition, credit risk in each market might be transmitted
16
to the different market in an opposite direction.
The estimated coefficients of these spreads are very similar in the London and NY markets.
This is consistent with the fact that the CIP deviations are similar in the two markets for most of the
period. However, the estimated coefficients are not only asymmetric but also have different
magnitudes in Tokyo market. In particular, the estimated coefficients of “Yen TIBOR spread” in
Tokyo market are only half of those of “Yen LIBOR spread” in the other two markets. After the
Lehman shock, dollar-specific shocks were largely stabilized in a few months but yen-specific shocks
remained high until 2009. Given the large yen-specific shocks, different coefficients of the yen
spreads may explain why the US dollar interest rate was lower in the Tokyo market than in the other
two during most of the post Lehman period.
Unlike the other credit risk measures, the standard deviation of FF rates always took
negative sign in all of the three markets. This indicates that the standard deviation of FF rates may
reflect different types of credit risks which are not captured by the LIBOR and TIBOR spreads.
However, the coefficient of the standard deviation of FF rates is largest in the New York market, while
it is not significant in the Tokyo market. Even the standard deviation of FF rates has a
market-specific feature in that the increased standard deviation of FF rates exacerbates the negative
deviations from CIP condition mostly in the New York market and least in the Tokyo market. Noting
that standard deviation of FF rates surged up dramatically in September 2008 but was stabilized after
November 2008, the market-specific feature may explain why the CIP deviations were largest in the
New York market soon after the Lehman shock.
6.2. The effects of liquidity risk measures
Among the dummies for the liquidity risk measures, two dummy variables of the BOJ’s yen
liquidity provisions, that is, “special funds-supplying operations to facilitate corporate financing” and
“outright purchases of CP”, were not statistically significant in any market. The BOJ’s yen liquidity
provisions to local financial institutions were not effective in reducing the deviations from the CIP

17
condition during the global financial crisis. This may reflect the fact that shortage of yen liquidity
was not serious even during the post Lehman period. In contrast, several US dollar liquidity
provisions are significant. However, their effects are market-specific in that US dollar liquidity
provisions did not always reduce the deviations from the CIP conditions in all markets.
The dummy for the BOJ’s FX swap line has a positive effect in all markets. However, they
has the largest effect in the Tokyo market and the smallest in the New York Market. The BOJ’s US
dollar liquidity provisions were effective in reducing US dollar liquidity risk mostly in the Tokyo
market. In contrast, the dummy for the BOE’s FX swap line and the dummy for the FRB’s TAF
credit have a negative effect in all markets. This indicates that US dollar liquidity provisions outside
Japan may exacerbate the deviations from the yen-dollar CIP condition. Comparing the significance
of these two dummies, the BOE’s FX swap line dummy is statistically significant in the London and
New York markets, while the FRB’s TAF dummy is statistically significant in the Tokyo market.
The time differences may be partly responsible for these differences in the significance level.
When VIX is included in the regression, its estimated coefficient is positive in the Tokyo
market and is negative in the London and New York markets. Its absolute value is largest in the New
York market. However, it is not significant in any case. This indicates that the market risk has a
limited effect on deviations from CIP condition when secured rates are used.
7. Determinants of Market-specific Deviations
In the previous sections, we investigated determinants of the deviations from the CIP
condition in each market and found that both credit and liquidity risks had various asymmetric effects
across the markets. This section explores the asymmetry more directly through investigating explicit
linkages across the markets. Specifically, we examine how the change of the deviations from the
CIP condition from one market to another is correlated with the change of the deviations in the last
few hours. In our data set, the time difference is 10 hours (9 hours in summer time) between the
New York and Tokyo markets, 8 hours (9 hours in summer time) between the Tokyo and London

18
markets, 6 hours between the London and New York markets. The correlation thus indicates how the
time differences as well as market-specific features are responsible for the deviations from the CIP
condition.
Recalling that Devt(h) is the deviations from the CIP condition in market h in period t, define
∆Devt(Tokyo) ≡ Devt(Tokyo) – Devt-1(New York), ∆Devt(London) ≡ Devt(London) – Devt(Tokyo), and
∆Devt(New York) ≡ Devt(New York) – Devt(London). Noting that Devt(h) is calculated at the end of
business hours in market h, these differenced variables essentially reflect the changes of the CIP
deviations during the business hours in each market. We run these dependent variables on the latest
changes in the other markets and on several measures of credit risk and liquidity risk. The latest
changes in the other markets are the last few-hour values of ∆Devt(h) in the other two markets.
We include some measures of credit risk and liquidity risk in the regressions. As in the last
section, we use the standard deviation of FF rates as a credit risk measure for the New York market.
However, unlike in the last section, we use the changes of the US-dollar denominated and
yen-denominated spreads across the markets as credit risk measures. This corresponds to the fact
that each dependent variable is the change across the markets. To adjust the time difference, we
calculated the date t change of the spread by subtracting the date t TIBOR spread from the date t
LIBOR spread for the London and New York markets and the date t change of the spread by
subtracting the date t-1 LIBOR spread from the date t TIBOR spread for the Tokyo market.
Regarding the measures of liquidity risk, we use the dummy for the BOJ’s FX swap line and the
dummy for either the BOE’s FX swap line or FRB’s TAF. We include the dummy for the BOJ’s FX
swap line for all of the markets but the dummy for the BOE’s FX swap line only for the London and
New York markets and the dummy for FRB’s TAF only for the Tokyo market. The latter choice is
based on the regression results in the last section.
The estimated results are summarized in Table 6. The standard errors of the coefficients
are calculated by Newey-West HAC Standard Errors & Covariance with lag truncation 6. A
noteworthy finding in the table is that the coefficients of the latest value of ∆Devt(h) are different
19
across the markets. That is, we find significant relationships that the change in the Tokyo market is
negatively correlated with the latest change in the New York market, whereas the change in the New
York time is positively correlated with the latest change in the Tokyo market. This implies that the
decreased deviations in the New York market increased the deviations in the following Tokyo market,
whereas the decreased deviations in the Tokyo market decreased the deviations in the following New
York market. The asymmetric transmission may explain why the Tokyo market experienced
relatively larger deviations during the post Lehman period when the deviations started to be stabilized
in the other market.
Unlike in the Tokyo market, we see some positive transmission of the deviations from the
New York market to the following London market. However, the correlation is not statistically
significant, although its coefficient is not small. The positive spillover from the New York market to
the following London market is, if any, not stable over time. This may explain why the CIP
deviations are similar in the two markets for most of the period.
Regarding the effects of the credit risk measures, the standard deviation of FF rates has a
significantly negative effect in the New York market. The change of the spreads is also significant in
the London market: a significantly negative effect of the change of the dollar-denominated spreads
and a significantly positive effect of the change of the yen-denominated spreads. In contrast, there is
no credit risk measure that has a significant effect in the Tokyo market. This indicates that given
lagged deviations in the other markets, the deviations from the CIP condition are attributable to
market-specific credit risk in the London and New York markets but not in the Tokyo market. This
may reflect the fact that the credit quality of European and US banks deteriorated substantially,
whereas that of the Japanese banks did not during the global financial crisis.
Regarding the effects of the liquidity risk measures, the coefficient of the BOJ’s swap line is
significantly positive in the Tokyo and New York markets but significantly negative in the London
market. This indicates that the effect of the BOJ’s swap line in Tokyo market might partially extinct
in London market but partly recover in the New York market. In contrast, neither the dummy for the
20
BOE’s FX swap line nor the dummy for FRB’s TAF is significant given lagged deviations in the other
markets. The effects of these liquidity provisions might not be market-specific.
8. Concluding Remarks
The global financial crisis increased various risk premiums in national and regional financial
markets. But unlike medium- or long-term financial markets, shortage of the US dollar as liquidity
became vital in the international money markets during financial crisis. In this paper, we examined
how CIP condition between the Japanese yen and the US dollar was violated in the Tokyo, London,
and New York markets. During the global financial crisis, there were substantial deviations from
CIP condition. We found that the CIP deviations temporarily became largest in the New York market
soon after the Lehman shock but was largest in the Tokyo market during most of the turmoil period.
One of the major findings in the paper is that such liquidity shortage of the US dollar might
be serious in Tokyo time when New York market is closed. Reflecting size of Japanese economy, the
role of Tokyo market as a financial center remained large during the past decades. However, Japan’s
international transactions still rely heavily on the US dollar. For example, Table 7 reports currency
shares of foreign exchange turnover in the Tokyo Market. It indicates that more than 70% of the
foreign exchange turnovers in the Tokyo Market have been those from the US dollar to either
Japanese yen or to Euro. This implies that it is important to mitigate shortage of the US dollar
especially in the Tokyo market during financial crisis. Coordinated central banks’ liquidity
provisions can be an important tool in reducing liquidity risk in the US dollar transactions. However,
we observe varieties of asymmetric effects across the markets. This suggests that some regional
specific policy prescriptions might be desirable in stabilizing the international financial market.

21
References
Aizenman, J., and G. K. Pasricha, (2009), Selective Swap Arrangements and the Global Financial
Crisis, Analysis and Interpretation, NBER Working Paper 14821.
Allen, F., E. Carletti, and D. Gale, (2009), Interbank Market Liquidity and Central Bank Intervention,
Journal of Monetary Economics 56, 639-652.
Baba, N., and F. Packer, (2009a) Interpreting Deviations from Covered Interest Parity During the
Financial Market Turmoil of 2007-08, Journal of Banking and Finance 33(11), 1953-62.
——— (2009b) From Turmoil to Crisis: Dislocations in the FX Swap Market Before and After the
Failure of Lehman Brothers, Journal of International Money and Finance 28(8), 1350-74.
Coffey, N., W. B. Hrung, and A. Sarkar, (2009), Capital Constraints, Counterparty Risk, and
Deviations from Covered Interest Rate Parity, Federal Reserve Bank of New York Staff
Report no. 393.
Fong, W.-M., G. Valente, and J. K. W. Fung, (2009), "Covered Interest Arbitrage Profits: the Role of
Liquidity and Credit risk," Journal of Banking and Finance, forthcoming.
Fukuda, S., (2011) Market-specific and Currency-specific Risk during the Global Financial Crisis:
Evidence from the Interbank Markets in Tokyo and London, NBER Working Paper #16962.
Galpin, W., B. Resnick, and G. Shoesmith, (2009), Eurocurrency Risk Premia. International Journal
of Business, 14(3): 199--220.
Genberg, H., C.-H. Hui, A. Wong and T.-K. Chung, (2009) The Link between FX Swaps and
Currency Strength during the Credit Crisis of 2007-2008, Hong Kong Monetary Authority
Working Paper.
Goldberg, L. S., S. Grittini, J. Miu, and D. Rose, (2009) FX Swap Lines and Dollar Funding Costs,
working paper
Gyntelberg, J., and P. Wooldridge, (2008) Interbank Rate Fixings during the Recent Turmoil. BIS
Quarterly Review, March.
Grioli, T. M., and A. Ranaldo, (2010) Limits to Arbitrage during the Crisis: Funding Liquidity
Constraints and Covered Interest Parity, Swiss National Bank.
Lustig, H. and A. Verdelhan (2007), The Cross-Section of Foreign Currency Risk Premia and
Consumption Growth Risk. American Economic Review 97, 89-117.
Obstfeld, M., and Rogoff, K. (1996), Foundations of International Macroeconomics, MIT Press,
Cambridge.
Rhee, G. S. and R. P. Chang, (1992), Intra-Day Arbitrage Opportunities in Foreign Exchange and
Eurocurrency Markets, Journal of Finance, 47(1), 363-379.
Taylor, J., and J. Williams, (2009) A Black Swan in the Money Market. American Economic Journal:
Macroeconomics, 1(1): 58--83.
Taylor, M. P., (1989), Covered Interest Arbitrage and Market Turbulence, Economic Journal 99,

22
376-391.

23
Table 1. Biannual average of the deviations from the CIP condition
Unit: basis pointsTokyo London New York
Jan. 2007 - June 2007 -9.53 -9.45 -9.53July 2007 - Dec. 2007 -46.65 -46.51 -46.15Jan. 2008 - June 2008 -42.36 -42.36 -42.18July 2008 - Dec. 2008 -135.79 -134.50 -135.38Jan. 2009 - June 2009 -50.42 -49.11 -49.29July 2009 - Dec. 2009 -21.02 -20.62 -20.46
This table summarizes biannual average of the deviations from the CIP condition in the three markets
from 2007 to 2009.
Table 2. Monthly average of the deviations from the CIP condition
Unit: basis pointsTokyo London New York
Average July 2008 -60.11 -59.57 -59.88Average August 2008 -67.61 -66.68 -66.33Average September 2008 -150.61 -159.10 -169.30 2008/9/1-9/15 -57.62 -61.72 -62.01 2008/9/16-9/30 -243.59 -256.48 -266.84Average October 2008 -304.92 -293.74 -293.49Average November 2008 -135.00 -134.99 -135.46Average December 2008 -92.63 -88.14 -86.23Average January 2009 -56.05 -53.68 -54.57Average February 2009 -71.23 -69.97 -69.65Average March 2009 -60.52 -57.08 -57.88
This table reports monthly average of the deviations from the CIP condition in the three markets
from July 2008 to March 2009.

24
Table 3. Table 3. Table 3. Table 3. Mean value of the difference between the markets and its t-statistics
Tokyo-London Tokyo-NYSample period sample mean t-statistic sample mean t-statisticJanuary 2, 2007 to December 31, 2009 -0.604 -1.632 -0.548 -1.262January 2, 2007 to August 31, 2008 -0.118 -0.385 -0.245 -0.760September 1, 2008 to September 30, 2008 7.752 0.958 13.969 1.318October 1, 2008 to December 31, 2009 -1.852 -2.981 ** -1.901 -2.951 **
In the table, “Tokyo-London” indicates the difference of the deviations from the CIP condition
between the Tokyo and London markets and “Tokyo-NY” indicates the difference between the Tokyo
and New York markets. The negative sign in the sample mean implies that the negative deviations are
bigger in the Tokyo market.
** Statistical significance at the 5% level.
25
Table 4. Table 4. Table 4. Table 4. Basic test statistics for credit risk measures
(1) January 2 in 2007 to December 31 in 2009 � ���� ����� ������� ���� ����� �� �������� ��� �� � ��� ��� �� ���� ��� �� � ��� ��� �� ��� ���� ��� !"#$% &'#$' (!#(& ()#"* '!#)' � ��� !'#"$ !"#(* (%#)* ()#+) $#** �,�- �- (!(#&) ($$#!* $*#)* &%#+( '%)#** ���- �- "#'( "#)* '*#+) +#$* +#**.� #/ �0# !'#(' !)#!" ')#$) ')#+* ++#'+.1�2 ���� +#*+ +#'* *#'& 3*#*! (#)$4������ $#!" $#$' +#") +#)( +*#+%5 ����0����� &$( &(( &)% &(( &))
(2) September 1 in 2008 to October 31 in 2008 6 789: ;<=8= >?879=@AB?C?DD<B @AB?EF7 GG B<9FHIJK LMK IN O IJK LMK IN HIJK LMK IN O IJK LMK IN NPQ RSTUV F<7 WXYZ[X W\]ZX^ []Z\_ `aZ_W [aZ\^V FC8<7 W[WZY[ W^aZ [ [\ZW[ `aZ a \\Z]]V <b8c Ac `Y`Z [ `__ZY] YYZ[] [aZ a Xa[Z]]V 878c Ac ^_ZW] _\Z\] `_Z]Y `\Z]a ^Z]]d9CZe FfZ aaZ]\ X][Z[X X]ZX\ [Za` \YZY_dgFh 7F== i]ZX` i]Z \ ]Z]` XZ ` XZWXjAB9?=8= XZ[\ XZYY XZ ` YZX] `Z_[k ;=FBf<98?7= \[ \W \[ \W \`
(3) November 1 in 2008 to December 31 in 2009 6 789: ;<=8= >?879=@AB?C?DD<B @AB?EF7 GG B<9FHIJK LMK IN O IJK LMK IN HIJK LMK IN O IJK LMK IN NPQ RSTUV F<7 YYZX` ^^ZY^ \XZ][ \aZ[_ ^Z]^V FC8<7 \`ZXX [WZ\[ \]ZW[ \YZXW [Z]]V <b8c Ac WWYZ _ W``Za] _]Z[] ^aZW` [YZ]]V 878c Ac ^Z\Y X_Z ] X^Za\ `YZ\[ `Z]]d9CZe FfZ [\Z_X [[Z]] ]ZX^ _Z_] [Z_adgFh 7F== ]Z a ]ZaX ]Z Y ]ZY^ `ZWYjAB9?=8= WZY^ WZaW WZ]` WZ ` XaZ_ak ;=FBf<98?7= `]\ W_W Wa` W_W WaW

26
Table 5. The estimated results of Equation (6)
Tokyo Market London Market New York MarketConstant term lmnopq lrnppo lrnqpo lqnqqo lqnrmm lqnsrotlonuorv tlmnrrqvwww tlmnmxsvww tlmnuyuvww tlonmqov tlonrysvw
Lagged Dependent Var. (-1)unsps unrup unymz unypo unyos unymu
dependenttlrnsmxv{{{ tpnqyzvwww tsnoqpvwww tounmmsvwww tznxxmvwww tsnpyrvwww
var. Dependent Var. (-2) lunuux unumy lunouu lunumr lunomm lunuxqtlunuxyv tunqpmv tlonmpsv tlunqozv tlonprpv tlunxqzvMeasure Dollar LIBOR spread
unzop lunmpo lunsox lunmmx lunssrof credit
tmnmqyvww tlmnrumvww tlmnspmvww tlmnusuvww tlmnzosvwwrisk in Yen LIBOR spread
unmqu unqmu unzmq unqrp unsroinrerbank
tunxuxv tonxozvw tmnsrmvww tonypzvw tmnzyuvwwmarkets Dollar TIBOR spread lunmup lunyor unpxy unpxqtlqnqrovwww tlqnmxpvwww tmnuqovww tonsxpvw
Yen TIBOR spreadunorz unmmx lunqms lunpsztmnuoqvww tmnuxrvww tlmnqspvww tlmnpzxvww
Std Dev. of FF rate lunoyr lunoxz lunopz lunoqq lunmxx lunqpqtlonrurv tlonrqrv tlmnoyyvww tlmnmyqvww tlmnzpxvww tlmnqxpvwwFRB FX BOJ Swap line
unprq unzxo unmom unmrz unosu unoyxswap
tmnooyvww tmnqpovww tonzyyv tonrsovw tunxyzv tonusovlines BOE Swap line lunqmp lunmuz lunzox lunqsu lunrmu lunzmmtlmnzmsvww tlonmzmv tlqnmppvwww tlmnmzmvww tlmnoupvww tlonpqqvThe other FRB TAF facility lpynyuu lrqnxuu lqrnruu lpqnyuu lxnoqu lmynsuucentral
tlmnmxrvww tlmnzpzvww tlonmzuv tlonqyuv tlunpmov tlonpprvbanks' BOJ Corporate facility lunmom lunuuy lunupx unuqr lunuxr unurxliquidity
tlonmsyv tlunoouv tlunpspv tunqrsv tlunspsv tunrpuvprovisions BOJ CP facility lunuyz unmuu lunopz unzpx lunxsm lunxpztlunoquv tunqqxv tlunmuxv tunysxv tlonoypv tlonoyrvMarket VIX
unuqq lunumq lunosmrisk
tunqmqv tlunmzyv tlonrqsvAdjusted R-squared
unxzp unxzx unxpp unxpp unxpu unxpm
This table gives results of OLS regressions testing the impact of various credit risk measures, several types
of US dollar liquidity provisions, and two types of Japanese yen liquidity provisions on deviations from
CIP condition in the three markets.
* Statistical significance at the 10% level.
** Statistical significance at the 5% level.
*** Statistical significance at the 1% level.

27
Table 6. The estimated results on the determinants of market-specific deviations
Tokyo Market London Market NY Market
Constant term |}~��� |�~��� �~����|}~���� �|�~���� ��~������Latest Latest change in Tokyo }~}�� }~}��change
�}~���� ��~}�����in the other Latest change in London |}~}�� }~}��markets
�|}~���� �}~����Latest change in NY |}~��� }~����|�~��}��� ��~����
Change of Change of dollar spread |}~}�� |}~��� }~�}}credit risk
�|}~���� �|�~}����� ��~����measures Change of yen Spread }~}�� }~�}� }~}}}in
��~���� ��~������ �|}~}}��inrerbank Std Dev. of FF rate |}~}��markets
�|�~������Central BOJ Swap line }~��� |}~��� }~���banks'
��~����� �|�~������ ��~�����liquidity BOE Swap line }~}�} }~}��provisions
�}~�}�� �}~����FRB TAF facility |��~�}}�|�~����Adjusted R-squared }~}�� }~}�� }~���
This table gives results of OLS regressions testing how the change of deviations from CIP condition in
one market is correlated with those in the other markets in the last few hours. The latest changes in
the other markets (i.e, “Latest changes in Tokyo”, “Latest changes in London”, and “Latest changes in
NY”) are the last few-hour values of ∆Devt(h) in the other two markets.
* Statistical significance at the 10% level.
** Statistical significance at the 5% level.
*** Statistical significance at the 1% level.

28
Table 7. Currency Shares of Foreign Exchange Turnover in the Tokyo Market
������Apr-04 Apr-07 Apr-10
Yen � US Dollar 60.6 ���� ����Euro � US Dollar 11.7 ���� ���Euro � Yen 6.9 ��� ���Others 20.8
���� ����
This table reports currency shares of foreign exchange turnover in the Tokyo Market. The data is
from The Bank of Japan.

29
Figure 1. Deviations from the CIP condition between the US dollar and five currencies
-500
-400
-300
-200
-100
0
100
200
2006/1/2
2006/4/2
2006/7/2
2006/10/2
2007/1/2
2007/4/2
2007/7/2
2007/10/2
2008/1/2
2008/4/2
2008/7/2
2008/10/2
2009/1/2
2009/4/2
2009/7/2
2009/10/2
2010/1/2
2010/4/2
Japan Singapore Euro UK Denmark
basis points
This figure depicts daily deviations from CIP condition between the US dollar and each of the five
non-US dollar currencies. The downward deviations imply that the US dollar had lower interest rate
on the forward market during the global financial crisis.