Regional Geomechanics - Southern Ontario · Regional Geomechanics – Southern Ontario March 2011...
105
DGR-GUID-00531-0001-R000 Regional Geomechanics – Southern Ontario March 2011 Prepared by: Nuclear Waste Management Organization and AECOM Canada Ltd. NWMO DGR-TR-2011-13
-
Upload
phungkhanh -
Category
Documents
-
view
218 -
download
4
Transcript of Regional Geomechanics - Southern Ontario · Regional Geomechanics – Southern Ontario March 2011...

DGR-GUID-00531-0001-R000
Regional Geomechanics – Southern Ontario March 2011 Prepared by: Nuclear Waste Management Organization
and AECOM Canada Ltd. NWMO DGR-TR-2011-13

Regional Geomechanics – Southern Ontario March 2011 Prepared by: Nuclear Waste Management Organization
and AECOM Canada Ltd. NWMO DGR-TR-2011-13

Regional Geomechanics - ii - March 2011
THIS PAGE HAS BEEN LEFT BLANK INTENTIONALLY

Regional Geomechanics - iii - March 2011
Document History
Title: Regional Geomechanics - Southern Ontario
Report Number: NWMO DGR-TR-2011-13
Revision: R000 Date: March 2011
Nuclear Waste Management Organization and AECOM Canada Ltd.
Prepared by: T. Lam (NWMO), S. Usher (AECOM Canada Ltd.)
Reviewed by: T. Engelder (Pennsylvania State University)
Approved by: R.E.J. Leech
Nuclear Waste Management Organization
Reviewed by: M. Jensen
Accepted by: M. Jensen

Regional Geomechanics - iv - March 2011
THIS PAGE HAS BEEN LEFT BLANK INTENTIONALLY

Regional Geomechanics - v - March 2011
EXECUTIVE SUMMARY
This report presents a comprehensive review of the state of knowledge regarding the geomechanical framework of southern Ontario. The information in this report supports Ontario Power Generation’s (OPG) proposed Deep Geologic Repository (DGR) project at the Bruce nuclear site in the Municipality of Kincardine, Ontario. The report draws information from southern Ontario and the neighbouring states of Michigan, Ohio, Pennsylvania and New York to present a synthesis of current scientific understanding of the Precambrian-Paleozoic sequence within the Regional Study Area (RSA) surrounding the Bruce nuclear site.
The purpose of the regional geomechanical review is to present a regional understanding of the geomechanical properties of the deep sedimentary formations that will host and enclose the proposed DGR as they relate to the ability of the sedimentary sequence to isolate and contain Low and Intermediate Level radioactive waste. For the regional geomechanical review this includes establishing existing knowledge as it relates to:
Bedrock jointing and structural discontinuities; Geomechanical intact rock properties; Geomechanical rock mass properties, including sub-surface excavation experience in
similar rock formations; and Regional In situ stress.
This regional geomechanical review was compiled from existing published data found in the scientific literature, coupled with unpublished data and reports internal to OPG or the academic community, as well as consulting reports. These data were examined and summarized for presentation in this report. In addition, experts in the various fields of structural geology and geomechanics were extensively consulted on the interpretation and summary of the findings.
As identified in the regional geology study, the region is characterized by predictable near-horizontally layered undeformed sedimentary bedrock of the Paleozoic Era, comprised of dolostone, limestone and shale. This predictable setting allows the comparison of regional findings to the Bruce nuclear site. Key findings from this review are described below.
1. Regional jointing data identify the presence of systematic joint sets that are locally consistent. These joint sets likely occur at depth but are expected to be closed and/or sealed (this finding is consistent with the measurement of low rock mass permeabilities and elevated brine [300 g/L] concentrations observed within the Ordovician sequence). Joint orientation at depth will influence DGR design layout for cavern stability, and may vary from that found at surface.
2. The strength and geomechanical properties determined on a regional basis are favourable in the argillaceous limestone of the Cobourg Formation. Comparison of regional and Bruce nuclear site uniaxial compressive strength (UCS) data indicate that, beneath Bruce nuclear site, the Cobourg Formation is significantly stronger (113 MPa) than the regional mean (72 MPa). Previous underground engineered structures at Darlington, Wesleyville, Niagara Falls and other locations in southern Ontario have been successfully excavated, at shallower depths, in the Ordovician bedrock relevant to the Bruce nuclear site. These cases demonstrate that stable and dry openings can be created in Ordovician argillaceous limestone and shales.

Regional Geomechanics - vi - March 2011
3. The magnitude of compressive in situ stresses is generally predictable with depth using regional information. Based on the 680 m depth of the DGR, the maximum horizontal stress is predicted to be about 38 MPa, and the minimum horizontal stress to be about 18 MPa. The current maximum horizontal in situ stress in the region is oriented in an ENE direction. The analysis of the regional in situ stress data allows an estimate of the approximate range of stress ratios at repository depth beneath Bruce nuclear site. At the repository horizon H /v will likely vary from 1.7 to 2.5; h /v from 1.0 to 1.2; and H/h from 1.5 to 2.1. Given that h /v is apparently greater than 1, the rock is currently in an overthrust stress regime.

Regional Geomechanics - vii - March 2011
ACKNOWLEDGEMENTS
This report benefited from technical reviews by Dr. Derek Martin (University of Alberta) and Dr. Dougal McCreath (Laurentian University).

Regional Geomechanics - viii - March 2011
THIS PAGE HAS BEEN LEFT BLANK INTENTIONALLY
Regional Geomechanics - ix - March 2011
TABLE OF CONTENTS
Page
EXECUTIVE SUMMARY .............................................................................................................. v
ACKNOWLEDGEMENTS .......................................................................................................... vii
1. INTRODUCTION ............................................................................................................... 1
1.1 BACKGROUND .................................................................................................... 1
1.2 REPORT STRUCTURE ......................................................................................... 1
2. REGIONAL GEOLOGY .................................................................................................... 2
2.1 STRATIGRAPHY .................................................................................................. 2
2.2 STRUCTURAL GEOLOGY ................................................................................... 3
2.3 JOINTING .............................................................................................................. 4
2.3.1 Jointing Data Sources and Quality .................................................................... 9
2.3.2 Regional Setting ................................................................................................ 9
2.3.3 Joint Orientation by Geological Period ............................................................ 11
2.3.3.1 Precambrian ........................................................................................... 11
2.3.3.2 Cambrian ............................................................................................... 12
2.3.3.3 Ordovician .............................................................................................. 12
2.3.3.4 Silurian ................................................................................................... 13
2.3.3.5 Devonian ................................................................................................ 15
2.3.3.6 Mississippian and Pennsylvanian .......................................................... 15
2.3.3.7 All Formations ........................................................................................ 16
2.3.4 Joint Orientation by Location ........................................................................... 17
2.3.5 Joint Distribution with Depth ............................................................................ 17
2.3.6 Joint Spacing, Length and Inclination ............................................................. 18
2.4 FAULTING ........................................................................................................... 23
2.5 SUMMARY .......................................................................................................... 23
3. GEOMECHANICAL PROPERTIES AT A LABORATORY SCALE ............................... 24
3.1 INTRODUCTION ................................................................................................. 24
Regional Geomechanics - x - March 2011
3.2 REGIONAL ROCK STRENGTH DATABASE FOR UNITS OVERLYING THE TRENTON GROUP ..................................................................................... 24
3.3 REGIONAL ROCK STRENGTH DATABASE FOR TRENTON GROUP ........... 26
3.3.1 Uniaxial Compressive Strength ....................................................................... 29
3.3.2 Brazilian and Direct Tension Tests ................................................................. 34
3.3.3 Triaxial Compression Tests ............................................................................. 36
3.3.4 Direct Shear Test ............................................................................................ 37
3.3.5 Other Physical Property Relationships ............................................................ 37
3.4 STRENGTH ANISOTROPY ................................................................................ 41
3.5 TIME DEPENDENCY .......................................................................................... 43
3.5.1 Creep .............................................................................................................. 43
3.5.2 Swelling ........................................................................................................... 43
3.5.3 Slake Durability ............................................................................................... 47
3.5.4 Long-Term Strength Degradation ................................................................... 47
3.6 SUMMARY .......................................................................................................... 48
4. ROCK MASS PROPERTIES AT FIELD SCALE ............................................................ 50
4.1 ROCK MASS CONDITION .................................................................................. 50
4.2 ROCK MASS TIME DEPENDANT DEFORMATION: HISTORICAL EXPERIENCE FROM SOUTHERN ONTARIO TUNNELS ................................. 51
5. IN SITU STRESSES ....................................................................................................... 56
5.1 INTRODUCTION ................................................................................................. 56
5.1.1 In situ Stress Measurement Techniques ......................................................... 56
5.1.2 Regional Stress and Plate Tectonics .............................................................. 58
5.1.3 Geology and Stress ......................................................................................... 58
5.1.4 Glaciation ........................................................................................................ 59
5.2 DATA SOURCES ................................................................................................ 60
5.3 RESULTS ............................................................................................................ 62
5.3.1 Magnitudes ...................................................................................................... 62
5.3.2 Stress Ratios ................................................................................................... 65

Regional Geomechanics - xi - March 2011
5.3.3 Orientation ....................................................................................................... 68
5.4 INDIRECT OBSERVATIONS – REGIONAL ....................................................... 68
5.4.1 Pop-ups and Quarry Buckles .......................................................................... 69
5.4.2 Borehole Breakouts ......................................................................................... 73
5.4.3 Core Disking .................................................................................................... 74
5.5 SUMMARY .......................................................................................................... 75
6. CONCLUSIONS .............................................................................................................. 77
7. REFERENCES ................................................................................................................ 78
8. ABBREVIATIONS, ACRONYMS AND UNITS ............................................................... 89

Regional Geomechanics - xii - March 2011
LIST OF TABLES
Page
Table 2.1: Major Joint Orientation by Geological Period in Ontario ........................................ 16 Table 2.2: Major Joint Orientation by Location in Ontario ....................................................... 20 Table 3.1: Summary of Geomechanical Properties of Rock Units Overlying the Trenton
Group ..................................................................................................................... 26 Table 3.2: Selected Geomechanical Properties of Cobourg and Sherman Fall Formations ... 34 Table 3.3: Tensile Strength (MPa) of Cobourg and Sherman Fall Formations ....................... 34 Table 3.4: Typical Values of Mechanical and Swelling Properties of Some Rocks in
Southern Ontario .................................................................................................... 45 Table 3.5: Summary of Geomechanical Properties ................................................................ 49 Table 4.1: Synthesis of Time-Dependent Deformation in Niagara Fall Region ....................... 53 Table 5.1: Calculated Stress Ratios (Subdivided by Measurement Method) at Near
Repository Depths .................................................................................................. 68
LIST OF FIGURES
Page
Figure 2.1: Geologic Map of Southern Ontario ........................................................................... 3 Figure 2.2: Stratigraphic Column ................................................................................................ 5 Figure 2.3: Tectonic Blocks Based on Sanford’s (1985) Interpretation ...................................... 6 Figure 2.4: Summary of Spatial Distribution of Joint Orientation in Southern Ontario and
Nearby Great Lake States ........................................................................................ 7 Figure 2.5: Common Joint Orientation and Naming Convention ................................................ 9 Figure 2.6: Joint Distribution in Upper and Lower Lockport Formation .................................... 10 Figure 2.7: Measurements of Joint Orientation in Precambrian Rocks .................................... 12 Figure 2.8: Cambrian Joint Sets in Northern Michigan ............................................................. 13 Figure 2.9: Comparison of Ordovician Joint Orientations ......................................................... 14 Figure 2.10: Inverhuron Joint Data ............................................................................................. 15 Figure 2.11: Joint Orientation – Mapped Outcrops on Bruce Peninsula .................................... 19 Figure 2.12: Joint Strike with Depth, Darlington UN1 and UN2 .................................................. 22 Figure 3.1: Location of Geomechanical Property Measurements ............................................ 25 Figure 3.2: Unconfined Compressive Strength of Queenston Shale ........................................ 27 Figure 3.3: Elastic Modulus of Queenston Shale ..................................................................... 27 Figure 3.4: Unconfined Compressive Strength of Georgian Bay Shale ................................... 28 Figure 3.5: Elastic Modulus of Georgian Bay Shale ................................................................. 28 Figure 3.6: Unconfined Compressive Strength of Cobourg Formation .................................... 29 Figure 3.7: Elastic Modulus of Cobourg Formation .................................................................. 30 Figure 3.8: Unconfined Compressive Strength of Collingwood Member of Cobourg Formation30 Figure 3.9: Elastic Modulus of Collingwood Member of Cobourg Formation ........................... 31 Figure 3.10: Unconfined Compressive Strength of Sherman Fall Formation ............................. 31 Figure 3.11: Elastic Modulus of Sherman Fall Formation .......................................................... 32 Figure 3.12: Unconfined Compressive Strength of Kirkfield and Coboconk Formations ........... 32 Figure 3.13: Elastic Modulus of Kirkfield and Coboconk Formations ......................................... 33 Figure 3.14: Direct Tensile and Brazilian Strength of Cobourg Formation ................................. 35 Figure 3.15: Direct Tensile and Brazilian Strength of Sherman Fall Formation ......................... 35 Figure 3.16: Hoek-Brown Failure Envelopes for Middle Ordovician Limestone Data ................ 36 Figure 3.17: Peak Shear Strength Envelope for Cobourg Limestone ........................................ 38
Regional Geomechanics - xiii - March 2011
Figure 3.18: Residual Shear Strength Envelope for Sherman Fall Formation ........................... 39 Figure 3.19: UCS Data vs. P-wave Velocity for All Rock Groups ............................................... 40 Figure 3.20: UCS Data vs. Elastic Modulus for All Rock Groups ............................................... 40 Figure 3.21: UCS Data vs. Effective Porosity for All Rock Groups ............................................ 41 Figure 3.22: Modulus Ratio vs. UCS of Vertical Loaded Specimen ........................................... 42 Figure 3.23: Modulus Ratio vs. UCS of Horizontal Loaded Specimen ....................................... 42 Figure 3.24: Relationship Between Rate of Time-dependent Deformation (Swelling Potential)
and Calcite Content ................................................................................................ 46 Figure 3.25: Slake Durability Index of Different Sedimentary Rock in Ontario ........................... 47 Figure 3.26: Static-fatigue Curves for Luc du Bonnet (LdB) Granite and Yucca Mountain Tuff . 48 Figure 5.1: Anderson’s Fault Classification .............................................................................. 59 Figure 5.2: Locations of In Situ Stress Measurements within the Appalachian and Michigan
Basin ...................................................................................................................... 61 Figure 5.3: Distribution of Principal Stress with Depth in the Appalachian and Michigan
Basins .................................................................................................................... 64 Figure 5.4: Darlington Nuclear Station, Borehole UN-1: (A) In Situ Stress Profiles, and (B)
Orientation and Depth of Measured Maximum Horizontal Stress .......................... 65 Figure 5.5: Variation of H/v Ratio with Depth Showing also the Moving Median of the Stress
Ratio ....................................................................................................................... 66 Figure 5.6: Variation of h/v Ratio with Depth Showing also the Moving Median of the Stress
Ratio ....................................................................................................................... 67 Figure 5.7: Variation of H/h Ratio with Depth Showing also the Moving Median of the Stress
Ratio ....................................................................................................................... 67 Figure 5.8: Stress Map of Greater Study Area ......................................................................... 70 Figure 5.9: Pop-ups in Southern Ontario (circular standard deviation = 79.6⁰ ....................... 71 Figure 5.10: Quarries Floor Buckles in Southern Ontario .......................................................... 72 Figure 5.11: A Combination of Quarries Floor Buckles and Pop-ups in Southern Ontario ........ 73 Figure 5.12: Maximum In Situ Stress Orientation from Borehole Breakout Data ....................... 74 Figure 5.13: Core Disking from Oil/Gas Well in Chatham, Ontario ............................................ 76

Regional Geomechanics - xiv - March 2011
THIS PAGE HAS BEEN LEFT BLANK INTENTIONALLY

Regional Geomechanics - 1 - March 2011
1. INTRODUCTION
1.1 Background
The regional geomechanical review presented in this report represents one of the supporting technical reports that comprise the Geosynthesis Program for the proposed Deep Geologic Repository (DGR) located near Tiverton, Ontario.
An important aspect of the DGR Safety Case is the integrity and long-term stability of the sedimentary sequence to isolate Low and Intermediate Level Waste (L&ILW) at timeframes of 100,000 years and beyond. Through the Geoscientific Site Characterization Plan (INTERA1 2006), site specific field and laboratory investigations were established to further develop and enhance the existing geoscientific knowledge of sub-surface conditions as they relate to geosphere stability and evolution, engineered repository systems design, and long-term repository safety.
The purpose of the regional geomechanics study, in conjunction with the other supporting technical reports, is to present an understanding of the properties of the deep sedimentary Paleozoic formations surrounding the Bruce nuclear site. This includes establishing the existing geomechanical knowledge as it relates to material properties, in situ stress distribution, and macroscopic features such as joints and faults. This study is specifically designed to provide meaningful context to the site-specific investigations being undertaken as part of the Geoscientific Site Characterization Plan (INTERA 2006), and provides a framework for extrapolation of site conditions beyond the Bruce nuclear site boundary.
This work has encompassed the review of existing published data found in the scientific literature, coupled with unpublished data and reports internal to OPG or the academic community, as well as consulting reports. These data were examined and summarized for presentation in this report. In addition, experts in the various fields of structural geology, and geomechanics were extensively consulted on the interpretation and summary of the findings.
1.2 Report Structure
This report is structured in a fashion to lay out a conceptual understanding of the regional geomechanical setting, providing further detail as it progresses. Chapter 2 is a synopsis of the regional geology, as the stratigraphy and structural geology components are described in greater detail in the Regional Geology - Southern Ontario report (AECOM and ITASCA CANADA 2011). Chapter 2 also contains a description of the regional jointing patterns, as this is one of the key diagnostics for the history of tectonic forces in the region.
Chapter 3 of the report provides a synopsis of the regional rock properties within the study area. This includes intact rock strength, anisotropy, time dependent properties and shear strength Chapter 3 is complemented by Chapter 4 of the report that examines rock mass properties, that is the locally scaled properties, including experience from southern Ontario tunnels. All locations on the North American plate are under compressive stress, primarily as a result of plate tectonics. Chapter 5 provides the background to this, the results of regional in situ stress measurements, as well as indirect observations, to identify what may lie under the Bruce nuclear site. Chapter 6 provides a summary of conclusions and Chapter 7 provides a list of references consulted in the process of preparing this report.
1 Currently known as Geofirma Engineering Ltd.

Regional Geomechanics - 2 - March 2011
2. REGIONAL GEOLOGY
Southern Ontario is located in the northeast part of the North American continent and is part of the North American plate that extends from the mid-Atlantic ridge in the east to the Juan de Fuca/Pacific plate margin in the west. Geologically, the sedimentary rocks of Southern Ontario overlie the southern margin of the Canadian Shield (Figure 2.1).
2.1 Stratigraphy
The stratigraphic sequence begins with the basement Precambrian rocks of the Canadian Shield. The Cambrian rocks at the bottom of the Paleozoic sequence outcrop along the northern shore of Lake Huron and east of the Algonquin Arch; they are present at depth beneath the Bruce nuclear site. Overlying these are the sedimentary rocks of the Ordovician Period, which outcrop from the base of the Niagara Escarpment, laying east and north of it all the way to the Canadian Shield (Figure 2.1). The Silurian Period rocks outcrop mainly at the face of the Niagara Escarpment, although some of the upper formations underlie the overburden extending some 30 to 60 km southwest of the Niagara Escarpment. To the west of that contact, lie the Devonian Period sediments, which cover the rest of southern Ontario. Outside of the province, and mainly to the west in Michigan and south in Ohio, the younger rocks of the Mississippian Period are still present, but have largely been eroded on the Canadian side of the border. Above these, in Michigan, there are Pennsylvanian Period sediments present.
In total there are 20 m of unconsolidated Pleistocene deposits, and 841 m of sedimentary Paleozoic bedrock above the basement Precambrian rocks at the Bruce nuclear site (Sterling 2010). The Paleozoic rocks are subdivided as follows. Under the glacial drift there lie 104 m of Devonian Period limestone and dolostone bedrock. These lie unconformably on 324 m of Silurian Period dolostones, shales and anhydrites. The upper part of the underlying Upper Ordovician sediments are comprised of 204 m of Queenston, Georgian Bay and Blue Mountain shales. The contact with the middle Ordovician lies under this conformably with the upper member of the Cobourg Formation (Collingwood Member). The target horizon for the DGR is presently the low permeability limestone of the lower member of the Cobourg Formation, which is characterized by argillaceous limestone. The middle Ordovician Period rocks are 192 m thick, for a total of 396 m of Ordovician sediments. Below this, and about 161 m below the proposed DGR (floor depth at 683 m below ground surface) lie 17 m of Cambrian Period sandstone. The unconformity between the Cambrian and the Precambrian lies at a depth of 860.7 m at borehole DGR-2 (Sterling 2010).
The Paleozoic rock sequences of southern Ontario rest unconformably on an erosional surface developed on top of the Precambrian rocks of the Canadian Shield. This crystalline basement is composed of metamorphic and igneous rocks of the middle Proterozoic Grenville Province. Studies of the exposed unconformity surface between Georgian Bay and Kingston together with subsurface data indicate that this erosional surface is characterized by topography with relief of 10’s to 100’s m with a strong preferred orientation controlled by the structural grain of the basement rocks (Andjelkovic and Cruden 1998). The erosional surface was produced by uplift and erosion from the Grenville orogen from Himalayan altitudes about one billion years ago to an undulating peneplane by Cambrian times when the region experienced a marine transgression and deposition of the oldest Paleozoic sediments. Sediment accumulation was greatest in the Michigan and Appalachian basins and least above the intervening Algonquin Arch (Figure 2.1). Sedimentation in the Michigan Basin continued until the Mississippian, but was punctuated by periods of uplift and erosion marked by regional unconformities. The

Regional Geomechanics - 3 - March 2011
Algonquin Arch acted as a major control on depositional patterns since at least the Cambrian, rising and falling with respect to the Michigan and Appalachian basins in response to vertical epeirogenic movements and horizontal tectonic forces (Leighton 1996, Howell and van der Pluijm 1999).
Figure 2.1: Geologic Map of Southern Ontario
2.2 Structural Geology
Sanford et al. (1985) subdivided Southern Ontario and parts of the Canadian Shield into a number of tectonic blocks based upon the characteristics of basement structures, subsurface
Regional Geomechanics - 4 - March 2011
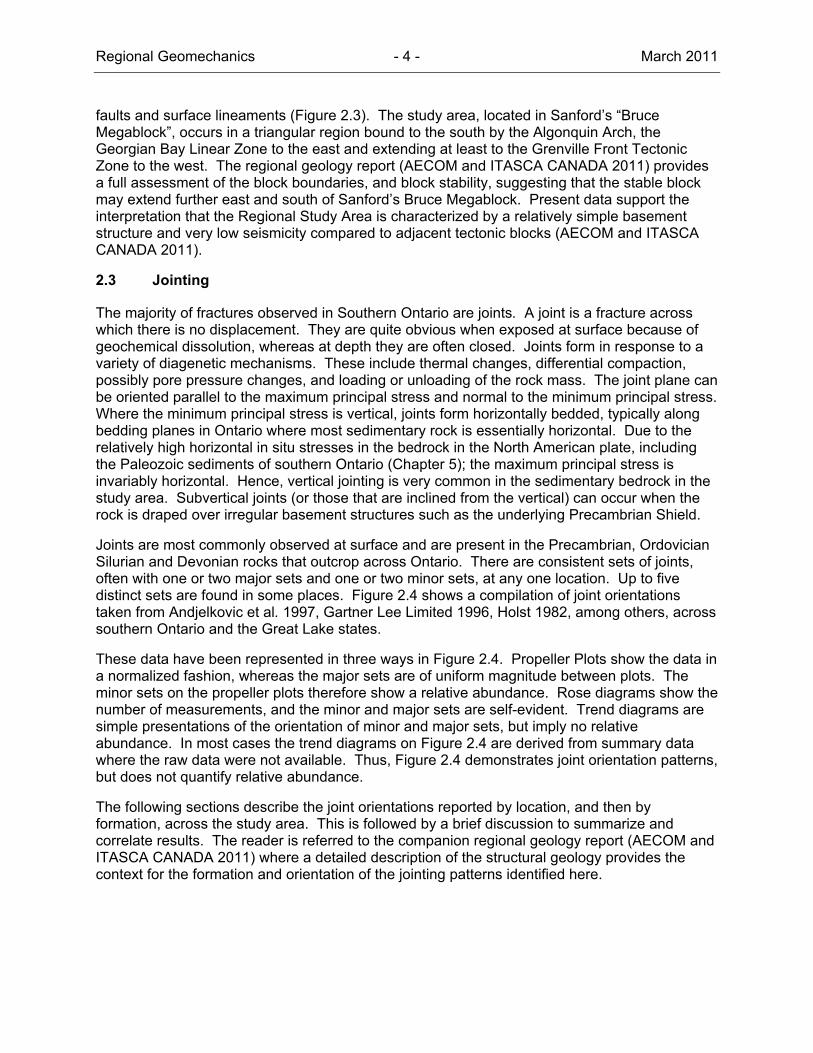
faults and surface lineaments (Figure 2.3). The study area, located in Sanford’s “Bruce Megablock”, occurs in a triangular region bound to the south by the Algonquin Arch, the Georgian Bay Linear Zone to the east and extending at least to the Grenville Front Tectonic Zone to the west. The regional geology report (AECOM and ITASCA CANADA 2011) provides a full assessment of the block boundaries, and block stability, suggesting that the stable block may extend further east and south of Sanford’s Bruce Megablock. Present data support the interpretation that the Regional Study Area is characterized by a relatively simple basement structure and very low seismicity compared to adjacent tectonic blocks (AECOM and ITASCA CANADA 2011).
2.3 Jointing
The majority of fractures observed in Southern Ontario are joints. A joint is a fracture across which there is no displacement. They are quite obvious when exposed at surface because of geochemical dissolution, whereas at depth they are often closed. Joints form in response to a variety of diagenetic mechanisms. These include thermal changes, differential compaction, possibly pore pressure changes, and loading or unloading of the rock mass. The joint plane can be oriented parallel to the maximum principal stress and normal to the minimum principal stress. Where the minimum principal stress is vertical, joints form horizontally bedded, typically along bedding planes in Ontario where most sedimentary rock is essentially horizontal. Due to the relatively high horizontal in situ stresses in the bedrock in the North American plate, including the Paleozoic sediments of southern Ontario (Chapter 5); the maximum principal stress is invariably horizontal. Hence, vertical jointing is very common in the sedimentary bedrock in the study area. Subvertical joints (or those that are inclined from the vertical) can occur when the rock is draped over irregular basement structures such as the underlying Precambrian Shield.
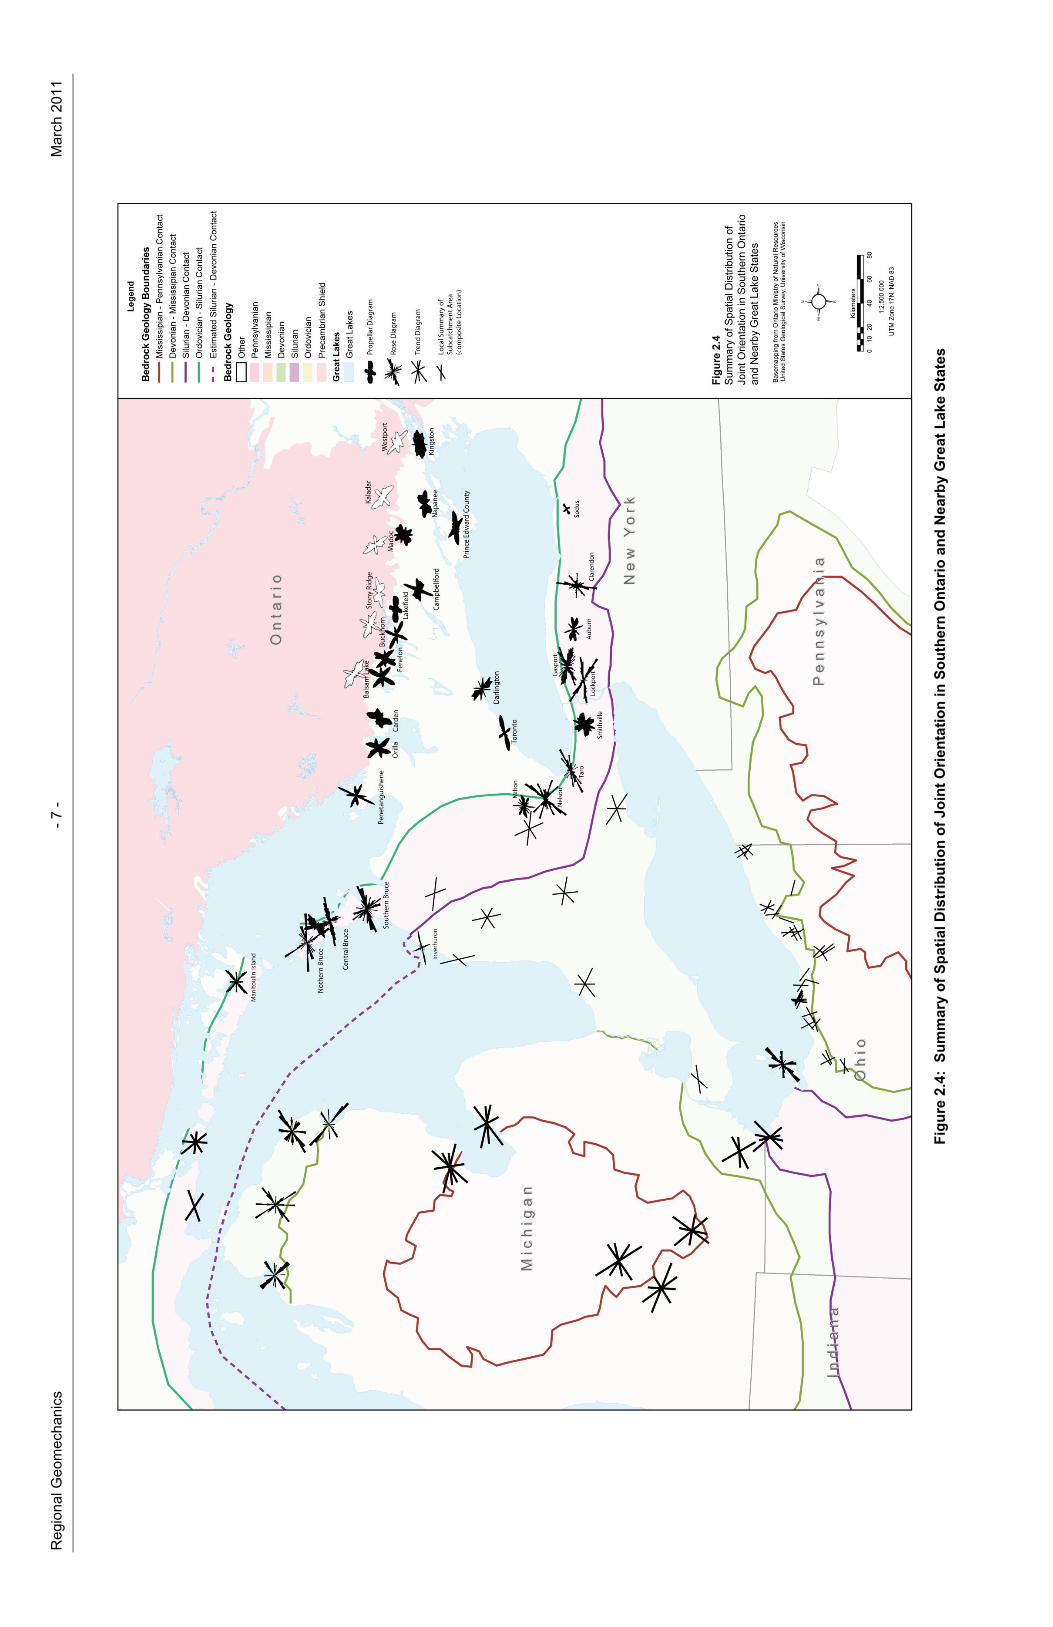
Joints are most commonly observed at surface and are present in the Precambrian, Ordovician Silurian and Devonian rocks that outcrop across Ontario. There are consistent sets of joints, often with one or two major sets and one or two minor sets, at any one location. Up to five distinct sets are found in some places. Figure 2.4 shows a compilation of joint orientations taken from Andjelkovic et al. 1997, Gartner Lee Limited 1996, Holst 1982, among others, across southern Ontario and the Great Lake states.
These data have been represented in three ways in Figure 2.4. Propeller Plots show the data in a normalized fashion, whereas the major sets are of uniform magnitude between plots. The minor sets on the propeller plots therefore show a relative abundance. Rose diagrams show the number of measurements, and the minor and major sets are self-evident. Trend diagrams are simple presentations of the orientation of minor and major sets, but imply no relative abundance. In most cases the trend diagrams on Figure 2.4 are derived from summary data where the raw data were not available. Thus, Figure 2.4 demonstrates joint orientation patterns, but does not quantify relative abundance.
The following sections describe the joint orientations reported by location, and then by formation, across the study area. This is followed by a brief discussion to summarize and correlate results. The reader is referred to the companion regional geology report (AECOM and ITASCA CANADA 2011) where a detailed description of the structural geology provides the context for the formation and orientation of the jointing patterns identified here.

Regional Geomechanics - 5 - March 2011
Note: After AECOM and ITASCA CANADA (2011)
Figure 2.2: Stratigraphic Column

Regional Geomechanics - 6 - March 2011
Note: The Bruce nuclear site is located within the Bruce Megablock (Mazurek 2004, Sanford et al. 1984, Easton
and Carter 1995 and Ontario Geological Survey 1991).
Figure 2.3: Tectonic Blocks Based on Sanford’s (1985) Interpretation
Reg
iona
l Geo
mec
hani
cs
-
7 -
Mar
ch 2
011
Fig
ure
2.4
: S
um
mar
y o
f S
pat
ial D
istr
ibu
tio
n o
f Jo
int
Ori
enta
tio
n in
So
uth
ern
On
tari
o a
nd
Nea
rby
Gre
at L
ake
Sta
tes

Reg
iona
l Geo
mec
hani
cs
-
8 -
Mar
ch 2
011
TH
IS P
AG
E H
AS
BE
EN
LE
FT
BL
AN
K IN
TE
NT
ION
AL
LY
Regional Geomechanics - 9 - March 2011
2.3.1 Jointing Data Sources and Quality
The joint data reviewed for this study were mostly drawn from published peer reviewed papers and technical reports. In many cases the findings in these sources were presented in the forms of rose diagrams or tables. Where possible rose diagrams have been reproduced here to allow comparison between formations and between locations, however, much of the raw data were unavailable and not examined in detail.
The dominant sources of data are in the form of surficial joint orientation measurements, as noted above. There are, however, a number of studies that examined jointing patterns with depth in boreholes, in particular: Hill et al. (2002) in New York; Dellapena (1991) in Michigan; and Ontario Hydro (1985) near Darlington, Ontario.
2.3.2 Regional Setting
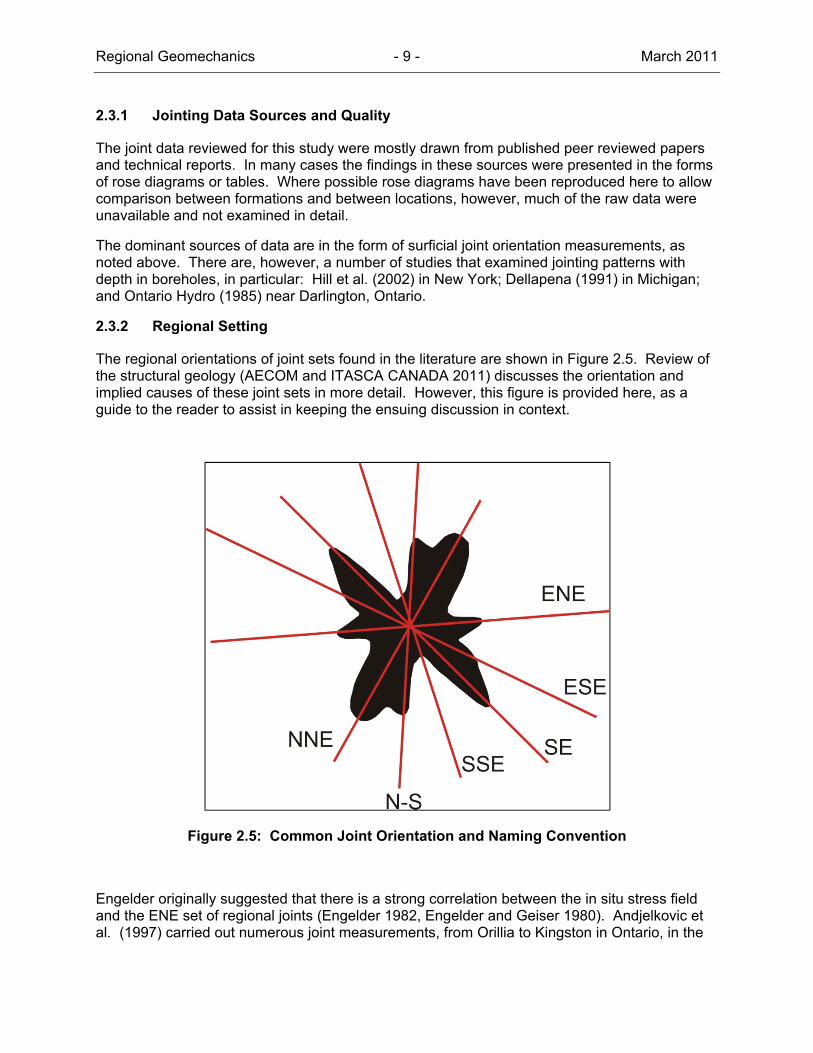
The regional orientations of joint sets found in the literature are shown in Figure 2.5. Review of the structural geology (AECOM and ITASCA CANADA 2011) discusses the orientation and implied causes of these joint sets in more detail. However, this figure is provided here, as a guide to the reader to assist in keeping the ensuing discussion in context.
Figure 2.5: Common Joint Orientation and Naming Convention
Engelder originally suggested that there is a strong correlation between the in situ stress field and the ENE set of regional joints (Engelder 1982, Engelder and Geiser 1980). Andjelkovic et al. (1997) carried out numerous joint measurements, from Orillia to Kingston in Ontario, in the

Regional Geomechanics - 10 - March 2011
Paleozoic and the Precambrian bedrock and found a correlation. This indicates a continuity of jointing patterns between the Precambrian into the Paleozoic era, suggesting the forces forming those joints occurred after the Paleozoic era. Based on the geologic evidence (AECOM and ITASCA CANADA 2011), the other sets of joints may predate the current stress field, rotating clockwise back with time. For example, the ESE set is thought to have formed in the Jurassic Period coincident with the breakup of the Atlantic Ocean. The SE set may have been created during the Appalachian orogeny before that (Andjelkovic et al. 1996, Andjelkovic et al. 1997; Andjelkovic and Cruden 1998).
Eyles and Scheidegger (1999) found a strong correlation between the joints found in the Pleistocene-aged glacial sediments of the Scarborough Bluffs, on the shores of Lake Ontario in eastern Toronto, and those in the underlying bedrock. There are many factors affecting formation of joints in unconsolidated sediments, including pore pressure build-up, shrinkage from changing moisture conditions, founding conditions or internal stretching. None of the papers reviewed provides a physical mechanism of the upward propagation of joints from the underlying bedrock, and the correlation may relate more to the geometry of the underlying rock and how it supports the sediments above.
There is, however, conflicting information between studies on changes of joint orientation with depth. Four major sub-vertical joint sets have been mapped at 142 sites situated on the northern Michigan Basin rim. As described by Holst (1982), the orientation of these joint sets is consistent regardless of bedrock formation age. A similar observation was noted in the deep boreholes at Darlington Generating Station (GS) (where the ENE joint set persists throughout the Paleozoic sequence and into the Precambrian), as well as by Engelder (1982) on the jointing of western New York State. On the other hand, Cruden and Usher (Gartner Lee Limited 1996) found that within the Silurian on the Niagara Escarpment that there was a subtle shift with depth. For example, in Figure 2.6 the ENE joint set labelled “D” is at 70° in the upper Lockport (Eramosa member) but is at 85° in the deeper Niagara Falls Submember (Gartner Lee Limited 1996).
Note: Data from Lincoln Quarry, Niagara, after Gartner Lee Limited 1996.
Figure 2.6: Joint Distribution in Upper and Lower Lockport Formation

Regional Geomechanics - 11 - March 2011
2.3.3 Joint Orientation by Geological Period
In determining patterns that might be useful in predicting what may lie below the Bruce nuclear site, the orientation of vertical joints has been examined on the basis of bedrock period and formation where possible. The following paragraphs show that there is a consistency to major joint sets across the study area, however, which sets are minor and which are major varies by location in each formation.
2.3.3.1 Precambrian
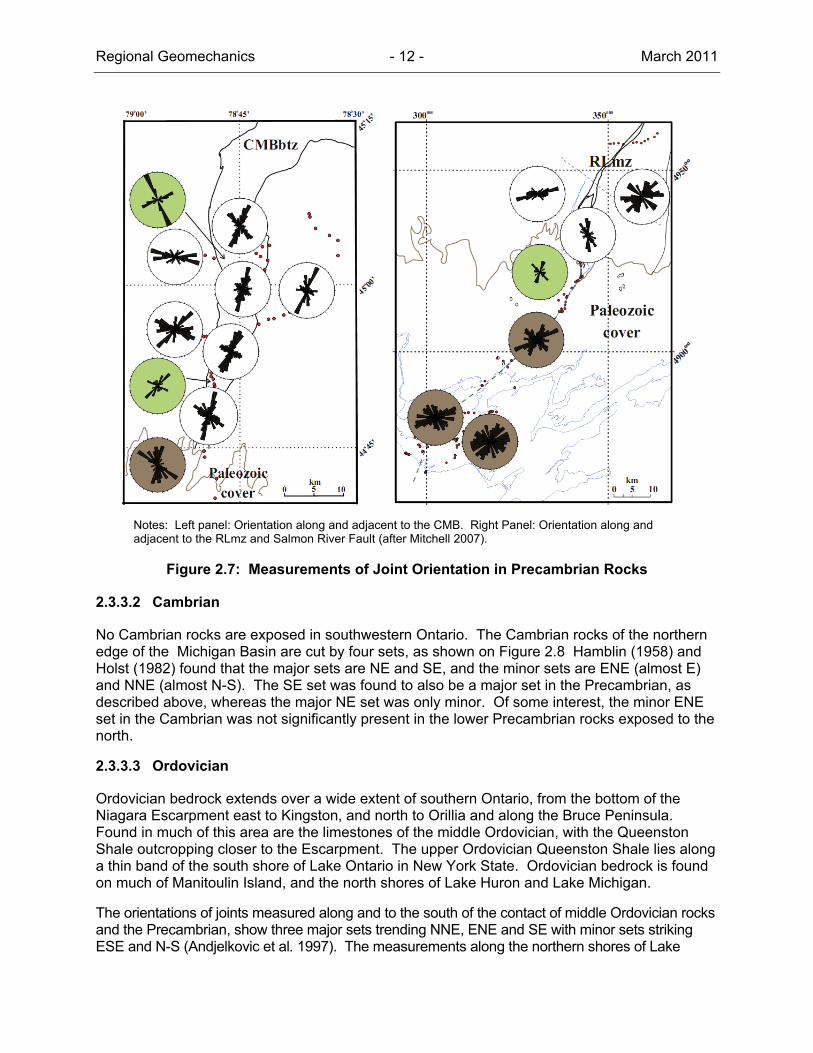
The Precambrian bedrock outcrops to the north of an irregular line from Kingston to Midland, as shown on Figure 2.4. It is also found along the north shore of Lake Huron, extending to northern Michigan. Measurements of 1516 joints at and near the Precambrian-Paleozoic contact at the Central Metasedimentary Belt (CMB), and the Central Gneiss Belt (CGB), indicates four jointing systems striking NNE-NE, SE, ENE, and SSE (Andjelkovic et al. 1997). These are shown as white rose diagrams on Figure 2.4 north of the Ordovician and Precambrian contact. Mitchell (2007) summarized approximately 3,700 joint measurements along and adjacent to the Central Metasedimentary Belt (CMB), and the Robertson Lake Mylonite Zone (RLmz) near Kaladar (Figure 2.7). The measurements along the CMB on the Precambrian Rocks show that the major joint set is parallel to the CMB at NNE (Figure 2.7). In all sets the ENE is present usually as a minor joint set. This is consistent with Andjelkovic’s findings, particularly the Balsam Lake, Buckhorn joint sets shown on Figure 2.4. Mitchell’s work also included the rocks near Kaladar (right panel of Figure 2.7), where the NE set is the major set in addition to the SE, and the ENE is a minor set.
In summary, their work showed two major jointing systems striking NNE-NE, and SE (Mitchell 2007), and one minor system striking N-S (that may only be present in the form of the NNE set away from the CMB) and one minor set at ENE. These measurements are generally in agreement with those made by Andjelkovic et al. 1997 on the Precambrian.
Much further to the west, the available measurements of lineaments and joints in the thin band of Precambrian rock in northern Michigan (Figure 2.4), showed a major set striking SE and a minor set striking NNE to NE (Hamblin 1958, Prouty 1976). These are consistent with the aforementioned findings in southern Ontario. Finally, Ontario Hydro (1978a, 1985) advanced two boreholes near Darlington, on the north shore of Lake Ontario. The boreholes intersected the Precambrian, and yielded vertical joints in the N-NNE, NE-ENE, and E-ESE directions.
In summary, the NE set of joints appears to both the west and east of the Bruce nuclear site as a minor set. The SE set was found to be a major set by all investigators, also being found west and east of the Bruce nuclear site. The NNE set of joints is a minor set in the Precambrian in northern Michigan but appears as a major set in the western half of the Canadian measurements, becoming minor set towards Kaladar. A similar distribution is found for the ENE and SSE sets of joints that are major sets towards north Lake Simcoe and minor sets towards Kingston. It is notable that neither joint set is present in appreciable numbers in northern Michigan.
Regional Geomechanics - 12 - March 2011
Notes: Left panel: Orientation along and adjacent to the CMB. Right Panel: Orientation along and adjacent to the RLmz and Salmon River Fault (after Mitchell 2007).
Figure 2.7: Measurements of Joint Orientation in Precambrian Rocks
2.3.3.2 Cambrian
No Cambrian rocks are exposed in southwestern Ontario. The Cambrian rocks of the northern edge of the Michigan Basin are cut by four sets, as shown on Figure 2.8 Hamblin (1958) and Holst (1982) found that the major sets are NE and SE, and the minor sets are ENE (almost E) and NNE (almost N-S). The SE set was found to also be a major set in the Precambrian, as described above, whereas the major NE set was only minor. Of some interest, the minor ENE set in the Cambrian was not significantly present in the lower Precambrian rocks exposed to the north.
2.3.3.3 Ordovician
Ordovician bedrock extends over a wide extent of southern Ontario, from the bottom of the Niagara Escarpment east to Kingston, and north to Orillia and along the Bruce Peninsula. Found in much of this area are the limestones of the middle Ordovician, with the Queenston Shale outcropping closer to the Escarpment. The upper Ordovician Queenston Shale lies along a thin band of the south shore of Lake Ontario in New York State. Ordovician bedrock is found on much of Manitoulin Island, and the north shores of Lake Huron and Lake Michigan.
The orientations of joints measured along and to the south of the contact of middle Ordovician rocks and the Precambrian, show three major sets trending NNE, ENE and SE with minor sets striking ESE and N-S (Andjelkovic et al. 1997). The measurements along the northern shores of Lake

Regional Geomechanics - 13 - March 2011
Ontario show the prominence of the ENE and SE sets. Again the pattern persists with the SE set being a major set, but in this case accompanied by a stronger presence of the ENE and NE sets. Of interest, the SSE set of joints, seems only to be present at the eastern end of this area, east of Madoc, which is similar to the Precambrian, and in a similar fashion do not extend further west. Measurements of about 1500 joints in Bruce Peninsula (OPG, 2007a) show two prominent sets, an ENE striking set and a SSE set with minor NNE set.
Note: Figure from Holst 1982.
Figure 2.8: Cambrian Joint Sets in Northern Michigan
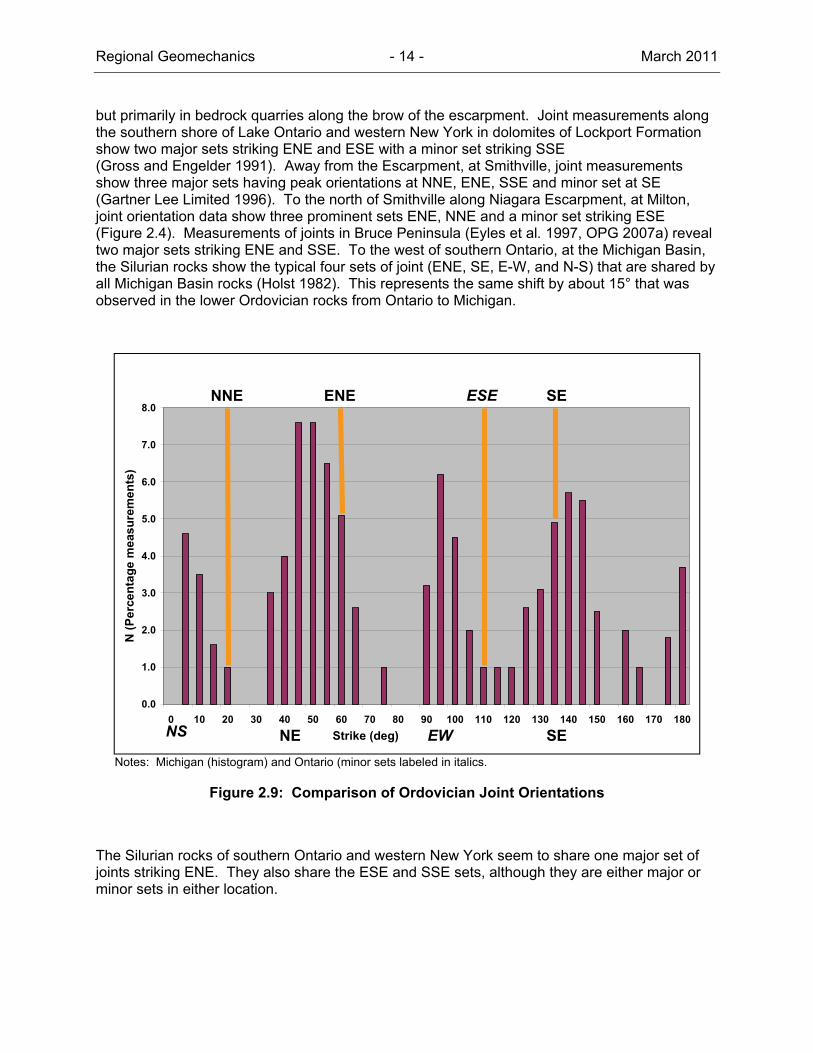
The Ordovician rocks of the northern Michigan Basin show four sets. Similar to the Cambrian to the north, the major sets are NE and SE, and the minor sets are N-S and E-W. This differs on a consistent basis from the orientation to the east in Ontario. Figure 2.9 is a histogram of the Michigan Ordovician joint set derived from the available data in the literature. The equivalent joint sets from Ontario have been shown in comparison, and it can be seen that there appears to be a 15o clockwise rotation in at least three sets. The major NE set in Michigan is oriented ENE in Ontario. The minor E-W set in Michigan is oriented in ESE in Ontario and is a major set there. The minor N-S in Michigan is oriented NNE in Ontario and is also a major set. There is a minor N-S set in the eastern half of Ontario, but is not seen moving west until Penetanguishene and then again into Michigan (Figure 2.4).
2.3.3.4 Silurian
The dolostones of the Silurian period are resistant rocks that form the leading edge of the Niagara Escarpment, extending from upstate New York, through southern Ontario, across Manitoulin Island, and then west through the upper Michigan Peninsula (Figure 2.4). Measurements have been made on the outcrops of the Niagara Escarpment in many places,
Regional Geomechanics - 14 - March 2011
but primarily in bedrock quarries along the brow of the escarpment. Joint measurements along the southern shore of Lake Ontario and western New York in dolomites of Lockport Formation show two major sets striking ENE and ESE with a minor set striking SSE (Gross and Engelder 1991). Away from the Escarpment, at Smithville, joint measurements show three major sets having peak orientations at NNE, ENE, SSE and minor set at SE (Gartner Lee Limited 1996). To the north of Smithville along Niagara Escarpment, at Milton, joint orientation data show three prominent sets ENE, NNE and a minor set striking ESE (Figure 2.4). Measurements of joints in Bruce Peninsula (Eyles et al. 1997, OPG 2007a) reveal two major sets striking ENE and SSE. To the west of southern Ontario, at the Michigan Basin, the Silurian rocks show the typical four sets of joint (ENE, SE, E-W, and N-S) that are shared by all Michigan Basin rocks (Holst 1982). This represents the same shift by about 15° that was observed in the lower Ordovician rocks from Ontario to Michigan.
Notes: Michigan (histogram) and Ontario (minor sets labeled in italics.
Figure 2.9: Comparison of Ordovician Joint Orientations
The Silurian rocks of southern Ontario and western New York seem to share one major set of joints striking ENE. They also share the ESE and SSE sets, although they are either major or minor sets in either location.
0.0
1.0
2.0
3.0
4.0
5.0
6.0
7.0
8.0
0 10 20 30 40 50 60 70 80 90 100 110 120 130 140 150 160 170 180
Strike (deg)
N (
Per
cen
tag
e m
eas
ure
men
ts)
NNE SEESEENE
NS NE EW SE
Regional Geomechanics - 15 - March 2011
2.3.3.5 Devonian
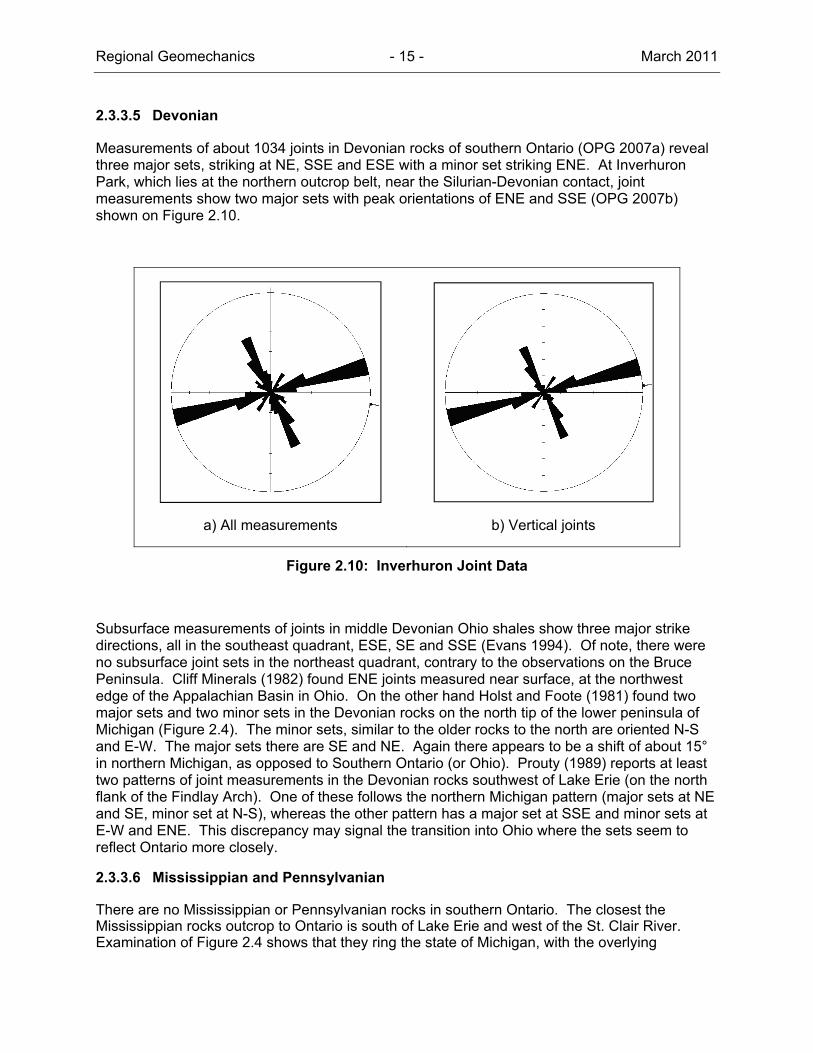
Measurements of about 1034 joints in Devonian rocks of southern Ontario (OPG 2007a) reveal three major sets, striking at NE, SSE and ESE with a minor set striking ENE. At Inverhuron Park, which lies at the northern outcrop belt, near the Silurian-Devonian contact, joint measurements show two major sets with peak orientations of ENE and SSE (OPG 2007b) shown on Figure 2.10.
a) All measurements b) Vertical joints
Figure 2.10: Inverhuron Joint Data
Subsurface measurements of joints in middle Devonian Ohio shales show three major strike directions, all in the southeast quadrant, ESE, SE and SSE (Evans 1994). Of note, there were no subsurface joint sets in the northeast quadrant, contrary to the observations on the Bruce Peninsula. Cliff Minerals (1982) found ENE joints measured near surface, at the northwest edge of the Appalachian Basin in Ohio. On the other hand Holst and Foote (1981) found two major sets and two minor sets in the Devonian rocks on the north tip of the lower peninsula of Michigan (Figure 2.4). The minor sets, similar to the older rocks to the north are oriented N-S and E-W. The major sets there are SE and NE. Again there appears to be a shift of about 15° in northern Michigan, as opposed to Southern Ontario (or Ohio). Prouty (1989) reports at least two patterns of joint measurements in the Devonian rocks southwest of Lake Erie (on the north flank of the Findlay Arch). One of these follows the northern Michigan pattern (major sets at NE and SE, minor set at N-S), whereas the other pattern has a major set at SSE and minor sets at E-W and ENE. This discrepancy may signal the transition into Ohio where the sets seem to reflect Ontario more closely.
2.3.3.6 Mississippian and Pennsylvanian
There are no Mississippian or Pennsylvanian rocks in southern Ontario. The closest the Mississippian rocks outcrop to Ontario is south of Lake Erie and west of the St. Clair River. Examination of Figure 2.4 shows that they ring the state of Michigan, with the overlying

Regional Geomechanics - 16 - March 2011
Pennsylvanian rocks in the middle. Prouty (1989) reports one joint set taken from quarries in the southwestern part of the state, and two sets flanking Saginaw Bay. These are shown on Figure 2.4. The Mississippian joint sets in Michigan indicate major sets at NE and SE, much the same as the older rocks to the north. A minor Mississippian joint set was documented at N-S by Prouty. The two Pennsylvanian joint sets reported by Prouty have major joint sets at NNE and SE, with minor sets at NE-ENE and ESE. No N-S or E-W sets were reported.
2.3.3.7 All Formations
Table 2.1 has been compiled from all sources for southern Ontario and includes anything south of North Bay down to the Great Lakes (including Manitoulin Island). Each joint set was reviewed and the major and minor peaks on the rosettes selected. It must be emphasized that this table has been compiled for surficial joint sets, that is, the surface expression of each formation laterally across the countryside in each area. It does not imply that joint sets will be consistent with depth at any one location.
Table 2.1: Major Joint Orientation by Geological Period in Ontario
Age Location N-S NNE NE ENE E-W ESE SE SSE Reference
Precambrian Ontario m M m M M M
Andjelkovic and Cruden (1999)
Andjelkovic et al. (1996, 1997)
Mitchell et al. (2006)
Cambrian
Ontario m M m M
Andjelkovic and Cruden (1999)
Andjelkovic et al (1996, 1997)
Mitchell et al. (2006)
Michigan Basin m M m M Hamblin (1958)
Holst (1982)
Ordovician
South of Canadian Shield m M M M
Andjelkovic and Cruden (1999)
Andjelkovic et al. (1996, 1997)
Lake Ontario north shore m M M
Andjelkovic and Cruden (1999)
Andjelkovic et al. (1996)
Ontario Hydro (1985)
Michigan Basin m M m M Holst (1982)
Silurian
New York M M m m Gross and Engelder (1991)
Ontario (Niagara) M M m M Gross and Engelder (1991)
Mississippian
Regional Geomechanics - 17 - March 2011
Age Location N-S NNE NE ENE E-W ESE SE SSE Reference
(1996)
Milton M M m GLL(1996)
Bruce Peninsula M M OPG (2007a)
Manitoulin Island m M M M Holst (1982)
Michigan Basin m M m M Holst (1982)
Prouty (1983)
Devonian
Ontario M m M M
Inverhuron M M OPG (2007b)
Michigan Basin m M M M
Holst (1982)
Holst and Foote (1981)
Prouty (1983)
Ohio m M m Miller (1996)
Mississippian Michigan Basin m M M OPG (2007b)
Pennsylvanian Michigan Basin M m m M M OPG (2007b)
Notes: M = Major joint set; m = Minor joint set
2.3.4 Joint Orientation by Location
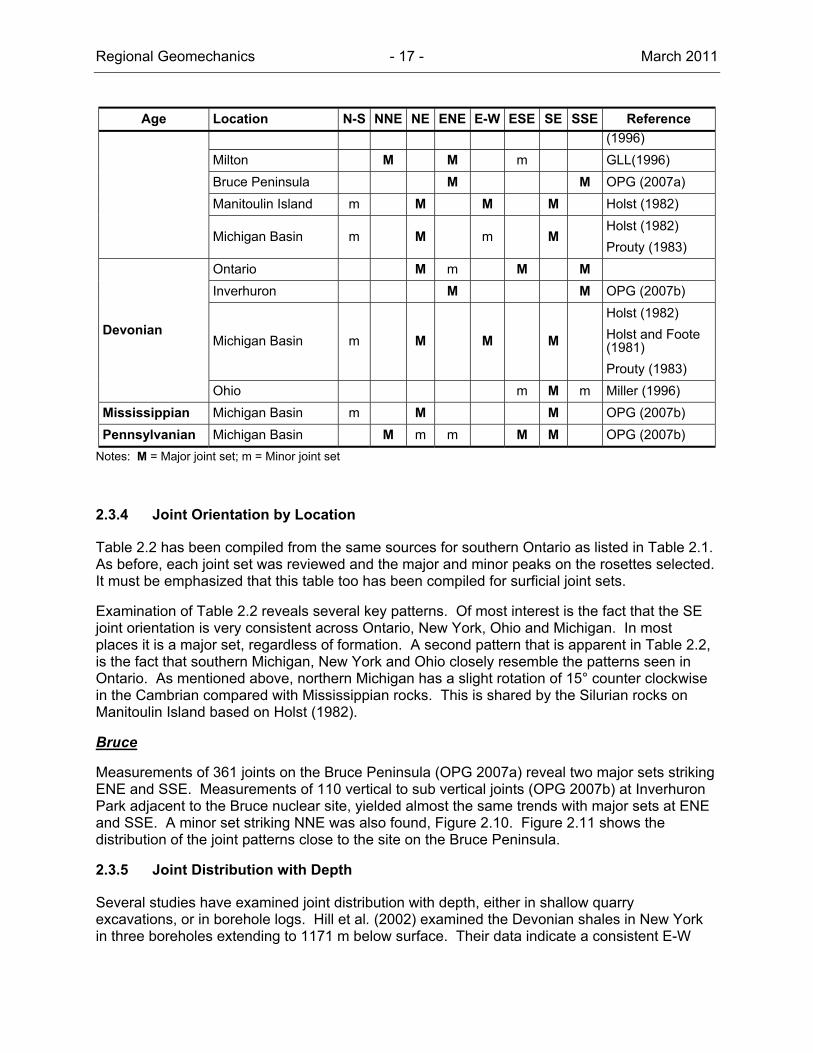
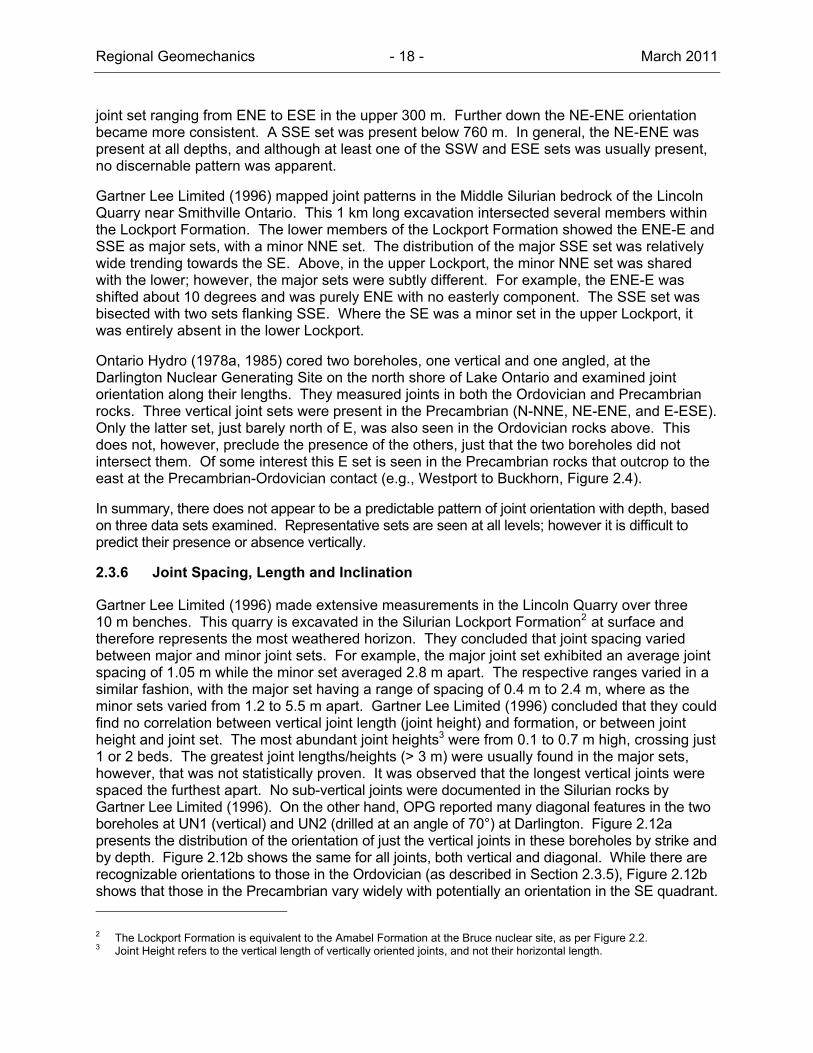
Table 2.2 has been compiled from the same sources for southern Ontario as listed in Table 2.1. As before, each joint set was reviewed and the major and minor peaks on the rosettes selected. It must be emphasized that this table too has been compiled for surficial joint sets.
Examination of Table 2.2 reveals several key patterns. Of most interest is the fact that the SE joint orientation is very consistent across Ontario, New York, Ohio and Michigan. In most places it is a major set, regardless of formation. A second pattern that is apparent in Table 2.2, is the fact that southern Michigan, New York and Ohio closely resemble the patterns seen in Ontario. As mentioned above, northern Michigan has a slight rotation of 15° counter clockwise in the Cambrian compared with Mississippian rocks. This is shared by the Silurian rocks on Manitoulin Island based on Holst (1982).
Bruce
Measurements of 361 joints on the Bruce Peninsula (OPG 2007a) reveal two major sets striking ENE and SSE. Measurements of 110 vertical to sub vertical joints (OPG 2007b) at Inverhuron Park adjacent to the Bruce nuclear site, yielded almost the same trends with major sets at ENE and SSE. A minor set striking NNE was also found, Figure 2.10. Figure 2.11 shows the distribution of the joint patterns close to the site on the Bruce Peninsula.
2.3.5 Joint Distribution with Depth
Several studies have examined joint distribution with depth, either in shallow quarry excavations, or in borehole logs. Hill et al. (2002) examined the Devonian shales in New York in three boreholes extending to 1171 m below surface. Their data indicate a consistent E-W
Regional Geomechanics - 18 - March 2011
joint set ranging from ENE to ESE in the upper 300 m. Further down the NE-ENE orientation became more consistent. A SSE set was present below 760 m. In general, the NE-ENE was present at all depths, and although at least one of the SSW and ESE sets was usually present, no discernable pattern was apparent.
Gartner Lee Limited (1996) mapped joint patterns in the Middle Silurian bedrock of the Lincoln Quarry near Smithville Ontario. This 1 km long excavation intersected several members within the Lockport Formation. The lower members of the Lockport Formation showed the ENE-E and SSE as major sets, with a minor NNE set. The distribution of the major SSE set was relatively wide trending towards the SE. Above, in the upper Lockport, the minor NNE set was shared with the lower; however, the major sets were subtly different. For example, the ENE-E was shifted about 10 degrees and was purely ENE with no easterly component. The SSE set was bisected with two sets flanking SSE. Where the SE was a minor set in the upper Lockport, it was entirely absent in the lower Lockport.
Ontario Hydro (1978a, 1985) cored two boreholes, one vertical and one angled, at the Darlington Nuclear Generating Site on the north shore of Lake Ontario and examined joint orientation along their lengths. They measured joints in both the Ordovician and Precambrian rocks. Three vertical joint sets were present in the Precambrian (N-NNE, NE-ENE, and E-ESE). Only the latter set, just barely north of E, was also seen in the Ordovician rocks above. This does not, however, preclude the presence of the others, just that the two boreholes did not intersect them. Of some interest this E set is seen in the Precambrian rocks that outcrop to the east at the Precambrian-Ordovician contact (e.g., Westport to Buckhorn, Figure 2.4).
In summary, there does not appear to be a predictable pattern of joint orientation with depth, based on three data sets examined. Representative sets are seen at all levels; however it is difficult to predict their presence or absence vertically.
2.3.6 Joint Spacing, Length and Inclination
Gartner Lee Limited (1996) made extensive measurements in the Lincoln Quarry over three 10 m benches. This quarry is excavated in the Silurian Lockport Formation2
F at surface and therefore represents the most weathered horizon. They concluded that joint spacing varied between major and minor joint sets. For example, the major joint set exhibited an average joint spacing of 1.05 m while the minor set averaged 2.8 m apart. The respective ranges varied in a similar fashion, with the major set having a range of spacing of 0.4 m to 2.4 m, where as the minor sets varied from 1.2 to 5.5 m apart. Gartner Lee Limited (1996) concluded that they could find no correlation between vertical joint length (joint height) and formation, or between joint height and joint set. The most abundant joint heights3 were from 0.1 to 0.7 m high, crossing just 1 or 2 beds. The greatest joint lengths/heights (> 3 m) were usually found in the major sets, however, that was not statistically proven. It was observed that the longest vertical joints were spaced the furthest apart. No sub-vertical joints were documented in the Silurian rocks by Gartner Lee Limited (1996). On the other hand, OPG reported many diagonal features in the two boreholes at UN1 (vertical) and UN2 (drilled at an angle of 70°) at Darlington. Figure 2.12a presents the distribution of the orientation of just the vertical joints in these boreholes by strike and by depth. Figure 2.12b shows the same for all joints, both vertical and diagonal. While there are recognizable orientations to those in the Ordovician (as described in Section 2.3.5), Figure 2.12b shows that those in the Precambrian vary widely with potentially an orientation in the SE quadrant.
2 The Lockport Formation is equivalent to the Amabel Formation at the Bruce nuclear site, as per Figure 2.2. 3 Joint Height refers to the vertical length of vertically oriented joints, and not their horizontal length.

Regional Geomechanics - 19 - March 2011
The presence of many orientations in the Precambrian may be related to preferential fracturing along the foliation of the rock.
Note: Data courtesy of D.K. Armstrong (OPG 2007a).
Figure 2.11: Joint Orientation – Mapped Outcrops on Bruce Peninsula

Reg
iona
l Geo
mec
hani
cs
- 20
-
Mar
ch 2
011
Tab
le 2
.2:
Maj
or
Join
t O
rien
tati
on
by
Lo
cati
on
in O
nta
rio
Lo
cati
on
A
rea
Ag
e N
-S
NN
EN
E
EN
E
E-W
ES
ES
ES
SE
Ref
eren
ce
On
tari
o
Pre
cam
bria
n-P
alae
ozoi
c co
ntac
t P
reca
mbr
ian
m
M
m
M
M
M
And
jelk
ovic
and
Cru
den
(199
9)
And
jelk
ovic
et a
l. (1
996,
199
7)
Mitc
hell
et a
l. (2
006)
Sou
th o
f Can
adia
n S
hiel
d C
ambr
ian
m
M
m
M
And
jelk
ovic
and
Cru
den
(199
9)
And
jelk
ovic
et a
l. (1
996,
199
7)
Mitc
hell
et a
l. (2
006)
Sou
th o
f Can
adia
n S
hiel
d O
rdov
icia
n m
M
M
M
And
jelk
ovic
and
Cru
den
(199
9)
And
jelk
ovic
et a
l. (1
996)
OP
G (
2007
b)
Lake
Ont
ario
nor
th
shor
e O
rdov
icia
n m
M
M
And
jelk
ovic
and
Cru
den
(199
9)
And
jelk
ovic
et a
l. (1
996)
Ont
ario
Hyd
ro (
1985
)
Nia
gara
S
iluria
n
M
M
m
M
M
issi
ssip
pian
(19
96)
Gro
ss a
nd E
ngel
der
(199
1)
Milt
on
Silu
rian
M
M
m
G
LL (
1996
)
Bru
ce P
enin
sula
S
iluria
n
M
M
O
PG
(20
07a)
Man
itoul
in Is
land
S
iluria
n m
M
M
M
H
olst
(19
82)
Inve
rhur
on
Dev
onia
n
M
M
O
PG
(20
07b)
Sou
thw
este
rn
Ont
ario
su
bcat
chm
ents
D
evon
ian
M
m
M
M
OP
G (
2007
a)
Mic
hig
an
Bas
in
Nor
ther
n M
ichi
gan
Bas
in
Cam
bria
n m
M
m
M
H
ambl
in (
1958
)
Hol
st (
1982
)
Nor
ther
n M
ichi
gan
Bas
in
Ord
ovic
ian
m
M
m
M
Hol
st (
1982
)
Hol
st a
nd F
oote
(19
81)

Reg
iona
l Geo
mec
hani
cs
- 21
-
Mar
ch 2
011
Lo
cati
on
A
rea
Ag
e N
-S
NN
EN
E
EN
E
E-W
ES
ES
ES
SE
Ref
eren
ce
Nor
ther
n M
ichi
gan
Bas
in
Silu
rian
m
M
m
M
Hol
st (
1982
)
Hol
st a
nd F
oote
(19
81)
Pro
uty
(198
3)
Nor
ther
n M
ichi
gan
Bas
in
Dev
onia
n m
M
M
M
Hol
st (
1982
)
Hol
st a
nd F
oote
(19
81)
Pro
uty
(198
3)
Sou
ther
n M
ichi
gan
Bas
in a
nd S
agin
aw
Bay
M
issi
ssip
pian
m
M
M
Pro
uty
(198
3)
Sou
ther
n M
ichi
gan
Bas
in
Pen
nsyl
vani
an
M
m
m
M
M
P
rout
y (1
983)
New
Yo
rk
Sou
th o
f Lak
e O
ntar
io
Silu
rian
M
M
m
m
Gro
ss a
nd E
ngel
der
(199
1)
Oh
io
Sou
th o
f Lak
e E
rie
Dev
onia
n
m
M
m
Mill
er (
1996
)
Not
es:
M =
Maj
or jo
int
set;
m =
Min
or jo
int
set

Regional Geomechanics - 22 - March 2011
Figure 2.12: Joint Strike with Depth, Darlington UN1 and UN2
0
50
100
150
200
250
300
350
0 10 20 30 40 50 60 70 80 90 100 110 120 130 140 150 160 170 180
Dep
th (
m)
Strike
Figure 2.12a. Relationship Between Orientation of Vertical and Sub-vertical Joints with Depth
Precambrian
Paleozoic
0
50
100
150
200
250
300
350
0 10 20 30 40 50 60 70 80 90 100 110 120 130 140 150 160 170 180
Dep
th (
m)
Strike
Figure 2.12b. Relationship Between Orientation of All Joints with Depth
Paleozoic
Precambrian
Dep
th (
m B
GS
) D
epth
(m
BG
S)

Regional Geomechanics - 23 - March 2011
2.4 Faulting
Most faults in Southern Ontario that are documented in the Paleozoic bedrock are also in the Precambrian basement, indicating basement tectonics (OGS 1991, Carter et al. 1996, Mazurek 2004). The majority of faults in southern Ontario are well over 200 km to the south of the Bruce nuclear site and are associated with the presence of the Chatham sag in the Algonquin Arch. These structures are reported to extend down into the Precambrian basement and are oriented in an E and ESE direction. Carter (1993) pointed out that these faults, including the Dawn and Electric Faults are coincident with the southern boundary of the Bruce Megablock. The Bruce nuclear site does not lie along the alignment of any known faults. The closest mapped fault in the Kincardine region of the Regional Study Area (RSA) is found at a distance of greater than 25 km away from the site.
2.5 Summary
The foregoing review allows some general conclusions to be drawn, with respect to jointing patterns that might be present under the Bruce nuclear site. First and foremost, most joint observations are at surface, where joint openings are enhanced by weathering. Observations of joints at depth depend upon whether a vertical borehole intersects them or not, which for vertical joints represents a lower probability. It can be expected that most joints will be vertical. Given the weight of overlying material, the horizontal bedding planes will be closed at depth.
The orientation of joints should be expected to be consistent with those at surface, although there is the possibility of a subtle rotation with depth. Certainly the SE and ENE joint sets revealed in the regional data are consistently present across southern Ontario (Table 2.2). There are many places where there are at least two major sets plus two minor sets. Gartner Lee Limited (1996) found that the minor sets were spaced further apart. The spacing and length of vertical joints observed at surface appears to be on the order of metres.
Regional Geomechanics - 24 - March 2011
3. GEOMECHANICAL PROPERTIES AT A LABORATORY SCALE
3.1 Introduction
A regional understanding of the geomechanical properties of the sedimentary formations hosting and enclosing the proposed Deep Geologic Repository (DGR) was used to perform assessments of geologic suitability of the Bruce nuclear site for implementation of the DGR concept. The recently completed site characterization program was designed to determine the suitability of the site as the location to construct the DGR. As part of the site characterization work, information regarding the geomechanical properties of the sedimentary formations intersected by the proposed DGR was assembled and reviewed. This compilation of available rock strength for southern Ontario and surrounding Great Lake region was used to establish input parameters for conceptual engineering of the DGR Facility. These parameters will serve to compliment data sets for the ongoing site-specific field and laboratory investigations.
Lam et al. (2007) in part provides a summary of the compilation of the regional geomechanical rock properties for Ordovician rock formations relevant to the DGR concept as they occur in southern Ontario. The data comprise over 700 test results from 29 sites as described in the public domain literature and laboratory reports (both published and proprietary). The database contains a wide range of information on bedrock formations of interest to the DGR project ranging in age from Devonian to Ordovician. Except for southwestern Ontario OPG sites and an anonymous site south of the Bruce facility, all sites are located along the shore or in the vicinity of Lake Ontario. The following sections are subdivided based on the Trenton Group rock formations and the rock units overlying them. The overlying rocks are those of the Devonian, Silurian and upper Ordovician formations. The proposed repository horizon is in the Cobourg Formation of the Trenton Group in the middle Ordovician Period. Figure 3.1 shows the regional bedrock geology and distribution of the sites where this information was gathered.
3.2 Regional Rock Strength Database for Units Overlying the Trenton Group
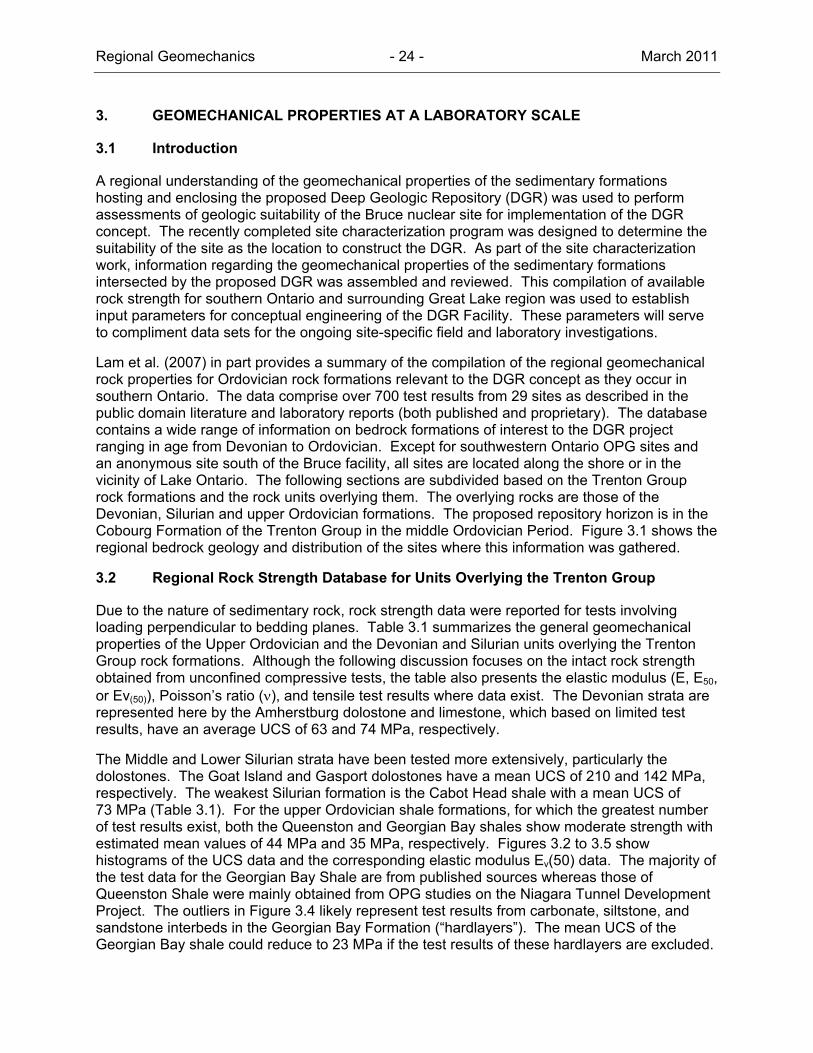
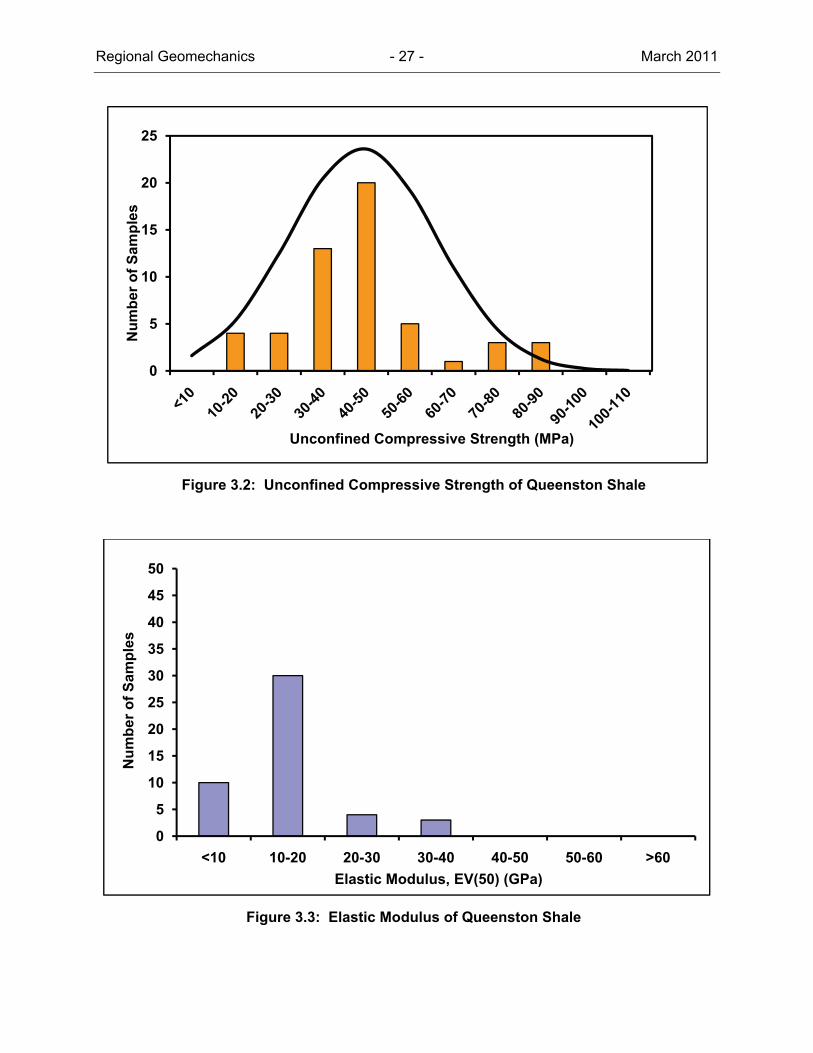
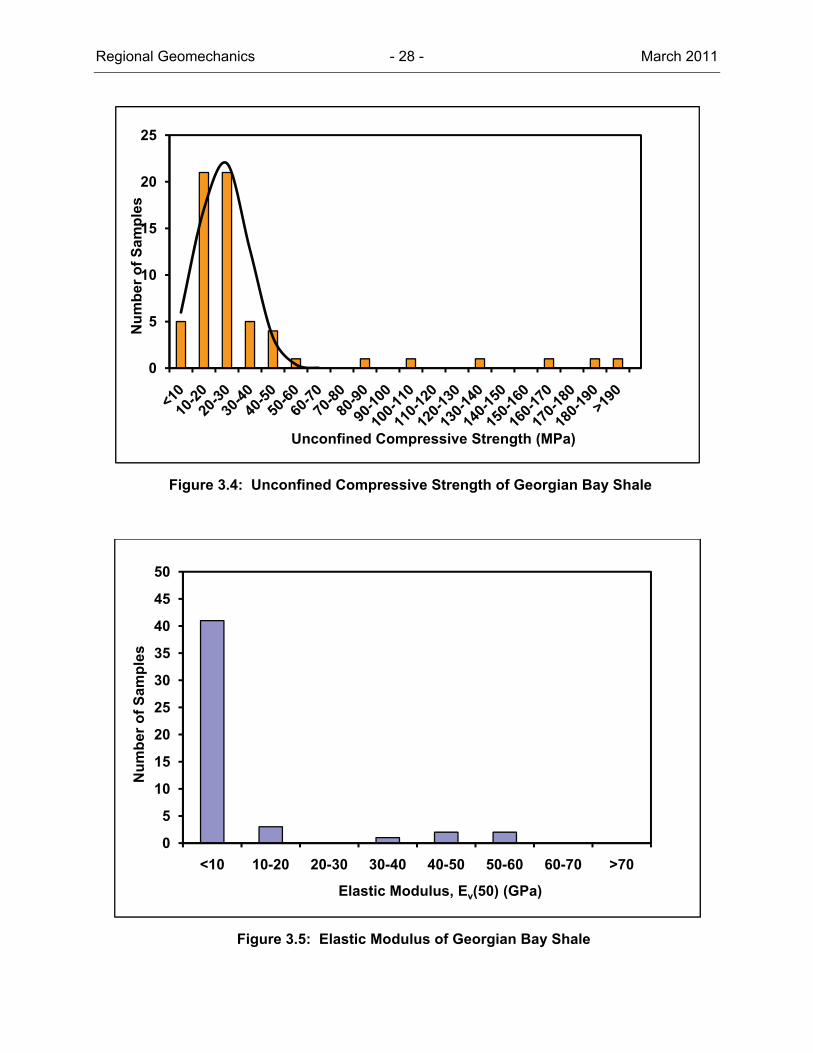
Due to the nature of sedimentary rock, rock strength data were reported for tests involving loading perpendicular to bedding planes. Table 3.1 summarizes the general geomechanical properties of the Upper Ordovician and the Devonian and Silurian units overlying the Trenton Group rock formations. Although the following discussion focuses on the intact rock strength obtained from unconfined compressive tests, the table also presents the elastic modulus (E, E50, or Ev(50)), Poisson’s ratio (), and tensile test results where data exist. The Devonian strata are represented here by the Amherstburg dolostone and limestone, which based on limited test results, have an average UCS of 63 and 74 MPa, respectively.
The Middle and Lower Silurian strata have been tested more extensively, particularly the dolostones. The Goat Island and Gasport dolostones have a mean UCS of 210 and 142 MPa, respectively. The weakest Silurian formation is the Cabot Head shale with a mean UCS of 73 MPa (Table 3.1). For the upper Ordovician shale formations, for which the greatest number of test results exist, both the Queenston and Georgian Bay shales show moderate strength with estimated mean values of 44 MPa and 35 MPa, respectively. Figures 3.2 to 3.5 show histograms of the UCS data and the corresponding elastic modulus Ev(50) data. The majority of the test data for the Georgian Bay Shale are from published sources whereas those of Queenston Shale were mainly obtained from OPG studies on the Niagara Tunnel Development Project. The outliers in Figure 3.4 likely represent test results from carbonate, siltstone, and sandstone interbeds in the Georgian Bay Formation (“hardlayers”). The mean UCS of the Georgian Bay shale could reduce to 23 MPa if the test results of these hardlayers are excluded.

Regional Geomechanics - 25 - March 2011
Figure 3.1: Location of Geomechanical Property Measurements

Regional Geomechanics - 26 - March 2011
Table 3.1: Summary of Geomechanical Properties of Rock Units Overlying the Trenton Group
Rock Formation UCS (MPa) Tensile Strength
(MPa)
Elastic Modulus
(GPa)
Poisson’s Ratio
Amherstburg Dolomite
Mean 63 (4) 27 (6)
Range 33 - 113 8 – 40
Amherstburg Limestone
Mean 74 (9) 31 (11)
Range 23 – 182 12 – 66
Eramosa Mean 118 63 0.4
Goat Island Mean 210 (10) 67 (6) 0.3 (6)
Range 137 – 282 58 - 81 0.2 – 0.4
Gasport Mean 142 (26) 57 (12) 0.3 (13)
Range 27 – 255 25 – 70 0.1 – 0.5
Decew Mean 107 (5) 5 54 (5) 0.4 (4)
Range 74 – 174 43 – 57 0.3 – 0.4
Irondequoit Mean 105 (11) 60 (11) 0.4 (11)
Range 60 – 185 50 - 78 0.1 – 0.5
Reynales Mean 107 (13) 33 (11) 0.4 (3)
Range 53 - 141 22 – 49 0.2 – 0.5
Cabot Head Mean 73 (7) 9 (22)
Range 20 – 127 5 – 14
Queenston Mean 44 (50) 10 (4) 15 (47) 0.4 (48)
Range 12 – 118 1 – 15 7 - 34 0.1 – 0.5
Georgian Bay Mean 35 (63) 9 (49) 0.3 (39)
Range 3 - 206 1 - 58 0.1 - 0.5
Note: (n) = number of data.
3.3 Regional Rock Strength Database for Trenton Group
A database of test results has been assembled to assess various regional geomechanical properties of the middle Ordovician Trenton Group shale and carbonates of southern Ontario (Cobourg, Sherman Fall and Kirkfield formations). The geomechanical testing data on the Trenton Group rock includes unconfined compressive strength (UCS), triaxial compressive strength, direct tensile strength, Brazilian (split) tensile strength and shear strength of bedding partings.
Regional Geomechanics - 27 - March 2011
Figure 3.2: Unconfined Compressive Strength of Queenston Shale
Figure 3.3: Elastic Modulus of Queenston Shale
0
0.005
0.01
0.015
0.02
0.025
0
5
10
15
20
25N
um
ber
of
Sam
ple
s
Unconfined Compressive Strength (MPa)
0
5
10
15
20
25
30
35
40
45
50
<10 10-20 20-30 30-40 40-50 50-60 >60
Nu
mb
er o
f S
amp
les
Elastic Modulus, EV(50) (GPa)
Regional Geomechanics - 28 - March 2011
Figure 3.4: Unconfined Compressive Strength of Georgian Bay Shale
Figure 3.5: Elastic Modulus of Georgian Bay Shale
0
0.005
0.01
0.015
0.02
0.025
0.03
0.035
0.04
0
5
10
15
20
25N
um
ber
of
Sam
ple
s
Unconfined Compressive Strength (MPa)
0
5
10
15
20
25
30
35
40
45
50
<10 10-20 20-30 30-40 40-50 50-60 60-70 >70
Nu
mb
er o
f S
amp
les
Elastic Modulus, Ev(50) (GPa)

Regional Geomechanics - 29 - March 2011
3.3.1 Uniaxial Compressive Strength
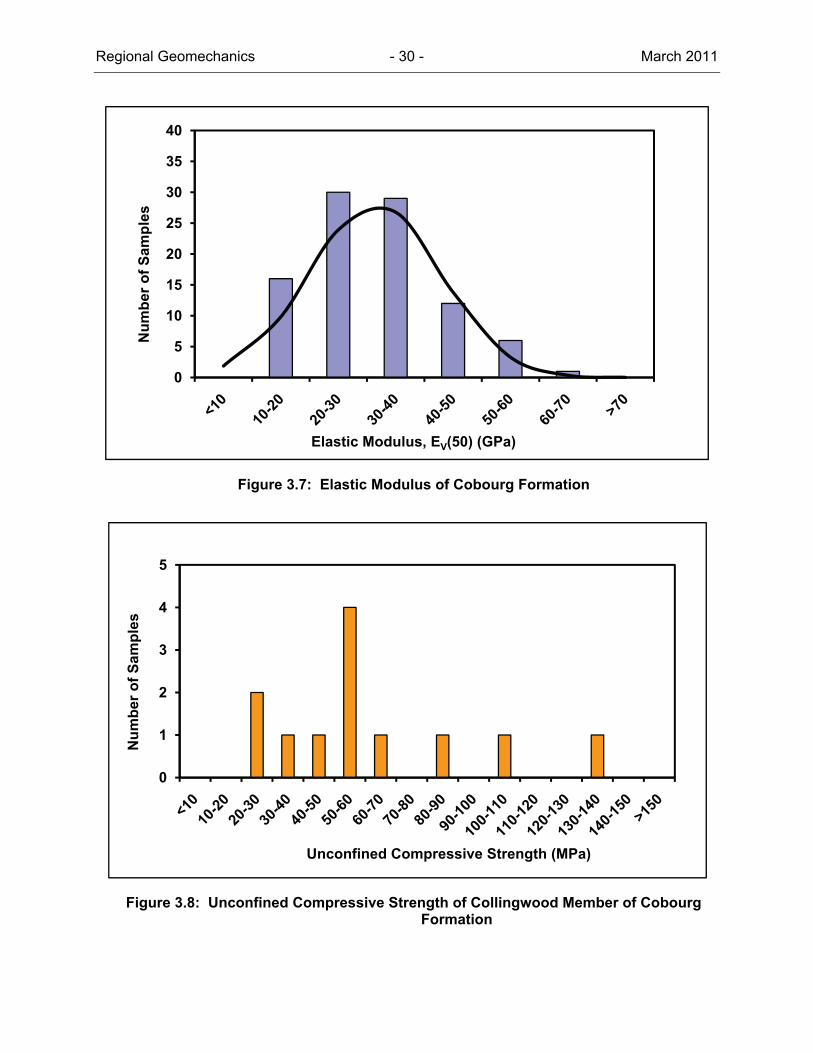
The uniaxial compressive strength of Cobourg argillaceous limestone was determined from the 94 available test results. The specimens tested were mainly rock samples of NQ and HQ size cores (45 mm and 61 mm in diameter) and were retrieved from sites at Mississauga, Pickering, Bowmanville, Wesleyville and Port Hope, Ontario (Figure 3.1). A well-defined unimodal distribution of strength measurements that range from 22 to 140 MPa is shown in Figure 3.6. The arithmetic mean is 72 MPa. Figure 3.7 illustrates a histogram of the corresponding elastic modulus of the limestone. It has a mean Ev(50) of 31.5 GPa.
Figure 3.6: Unconfined Compressive Strength of Cobourg Formation
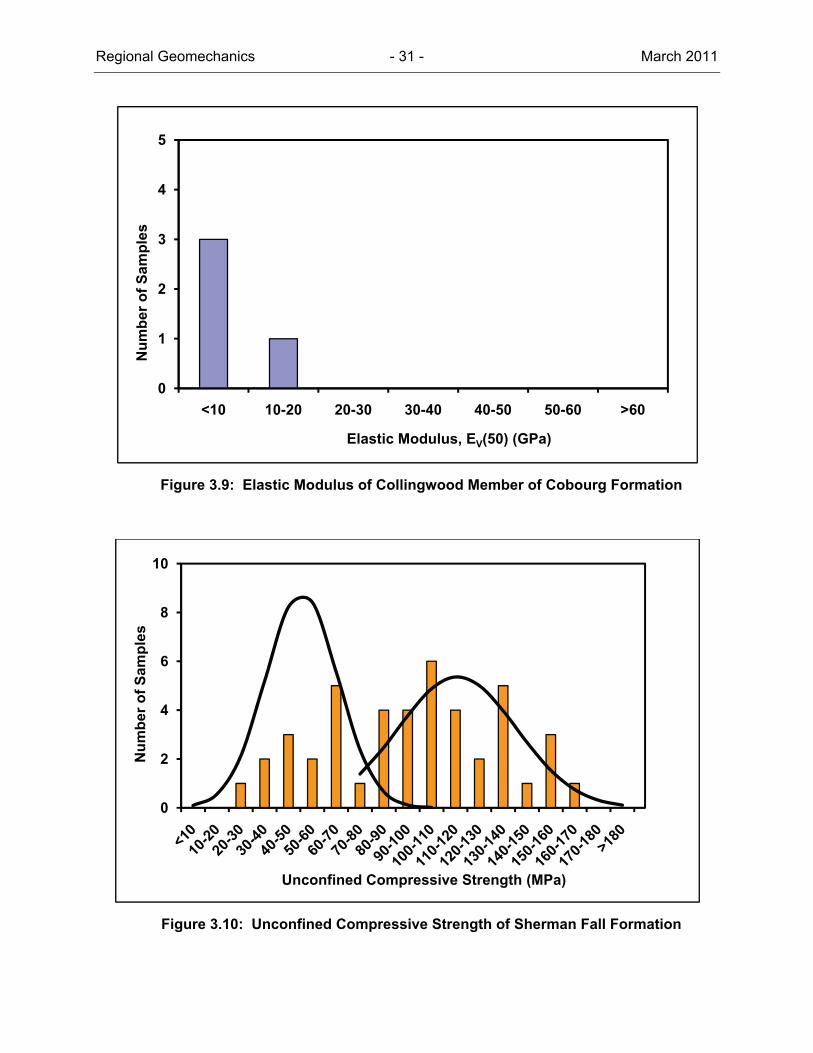
For the Collingwood shale, a Cobourg Formation sub-member, the average UCS based on testing of 12 samples is 62 MPa. Figures 3.8 and 3.9 show the histograms of the UCS and the corresponding elastic modulus. The latter has a mean of 13.5 GPa.
Similarly, for the underlying interbedded limestone and shale of the Sherman Fall Formation the characteristics of the rock can be illustrated by the bimodal distribution of the UCS data. It is inferred from Figure 3.10 that the average strength values for shale and limestone layers are 51 (13 samples) and 116 MPa (31 samples), respectively. All tests were loaded perpendicular to bedding with samples of diameters ranging from 32 to 61 mm. As there is insufficient information to separate the shale and carbonate in the elastic modulus data, both limestone and shale were analyzed as one rock group with a mean elastic modulus of 40 GPa.
0
0.005
0.01
0.015
0.02
0.025
0
5
10
15
20
25
30
Nu
mb
er o
f S
amp
les
Unconfined Compressive Strength (MPa)
Regional Geomechanics - 30 - March 2011
Figure 3.7: Elastic Modulus of Cobourg Formation
Figure 3.8: Unconfined Compressive Strength of Collingwood Member of Cobourg Formation
0
0.005
0.01
0.015
0.02
0.025
0.03
0.035
0.04
0.045
0.05
0
5
10
15
20
25
30
35
40N
um
ber
of
Sam
ple
s
Elastic Modulus, EV(50) (GPa)
0
1
2
3
4
5
Nu
mb
er o
f S
amp
les
Unconfined Compressive Strength (MPa)
Regional Geomechanics - 31 - March 2011
Figure 3.9: Elastic Modulus of Collingwood Member of Cobourg Formation
Figure 3.10: Unconfined Compressive Strength of Sherman Fall Formation
0
1
2
3
4
5
<10 10-20 20-30 30-40 40-50 50-60 >60
Nu
mb
er o
f S
amp
les
Elastic Modulus, EV(50) (GPa)
0
0.005
0.01
0.015
0.02
0.025
0.03
0
2
4
6
8
10
Nu
mb
er o
f S
amp
les
Unconfined Compressive Strength (MPa)

Regional Geomechanics - 32 - March 2011
Figure 3.11: Elastic Modulus of Sherman Fall Formation
Figure 3.12: Unconfined Compressive Strength of Kirkfield and Coboconk Formations
0
1
2
3
4
5
6
7
8
9
10
<10 10-20 20-30 30-40 40-50 50-60 60-70 >70
Nu
mb
er o
f S
amp
les
Elastic Modulus, EV(50) (GPa)
0
1
2
3
4
5
Nu
mb
er o
f S
amp
les
Unconfined Compressive Strength (MPa)
Regional Geomechanics - 33 - March 2011
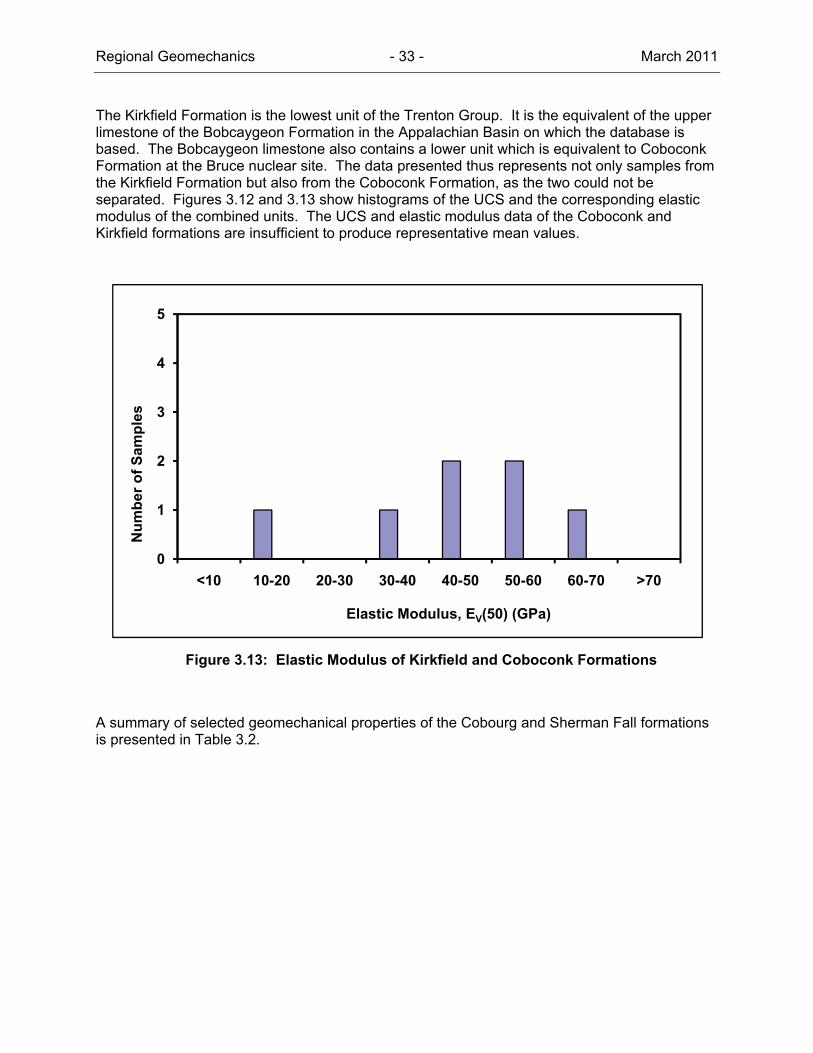
The Kirkfield Formation is the lowest unit of the Trenton Group. It is the equivalent of the upper limestone of the Bobcaygeon Formation in the Appalachian Basin on which the database is based. The Bobcaygeon limestone also contains a lower unit which is equivalent to Coboconk Formation at the Bruce nuclear site. The data presented thus represents not only samples from the Kirkfield Formation but also from the Coboconk Formation, as the two could not be separated. Figures 3.12 and 3.13 show histograms of the UCS and the corresponding elastic modulus of the combined units. The UCS and elastic modulus data of the Coboconk and Kirkfield formations are insufficient to produce representative mean values.
Figure 3.13: Elastic Modulus of Kirkfield and Coboconk Formations
A summary of selected geomechanical properties of the Cobourg and Sherman Fall formations is presented in Table 3.2.
0
1
2
3
4
5
<10 10-20 20-30 30-40 40-50 50-60 60-70 >70
Nu
mb
er o
f S
amp
les
Elastic Modulus, EV(50) (GPa)

Regional Geomechanics - 34 - March 2011
Table 3.2: Selected Geomechanical Properties of Cobourg and Sherman Fall Formations
Collingwood member
(Cobourg Fm.) Cobourg Fm. Sherman Falls Fm.
Mean Range Mean Range Mean Range
Shale Limestone Shale Limestone
UCS (MPa)
62.4 27 - 132 72 22 – 140 51 116 23 - 69 71 - 161
Ev (GPa) 14 2 - 31 32 10 – 67 40 1 – 73
0.2 0.2 – 0.3 0.3 0.1 – 0.6 0.3 0.1 – 0.4
(g/cm3) 2.6 2.5 – 2.7 2.7 2.6 – 2.9 2.7 2.5 – 2.7
3.3.2 Brazilian and Direct Tension Tests
In addition to the UCS data described in Section 3.3.1, the Brazilian and direct tension test data for the Cobourg and Sherman Fall formations were also compiled. Tensile strength data on the Collingwood member and Kirkfield Formation are not available. Figures 3.14 and 3.15 present the histograms of these data. It is noted that the direct tensile strength of both rocks are lower than those derived from Brazilian tests.
The cause for this variation is mainly due to the effect of bedding planes on the direct tension tests. Table 3.3 summarizes the tensile strengths of both formations.
Table 3.3: Tensile Strength (MPa) of Cobourg and Sherman Fall Formations
Type of Test Cobourg Formation
Sherman Fall Formation
Mean Range Mean Range
Direct Tension 1 0.04 – 2 1 0.1 – 3
Brazilian 6.5 3 – 10 6 1 – 12
For sedimentary formations such as these, it is probable that the Hoek-Brown envelope tends to overestimate the actual tensile strength of the rock mass in a direction normal to bedding planes.
For the Coboconk and Kirkfield formations, test data are insufficient for meaningful analysis.

Regional Geomechanics - 35 - March 2011
Notes: Direct tensile strength (blue), Brazilian strength (orange).
Figure 3.14: Direct Tensile and Brazilian Strength of Cobourg Formation
Notes: Direct tensile strength (blue), Brazilian strength (orange).
Figure 3.15: Direct Tensile and Brazilian Strength of Sherman Fall Formation
0
5
10
15
20
25
Nu
mb
er o
f S
amp
les
Tensile Strength (MPa)
0
5
10
15
Nu
mb
er o
f S
amp
les
Tensile Strength (MPa)
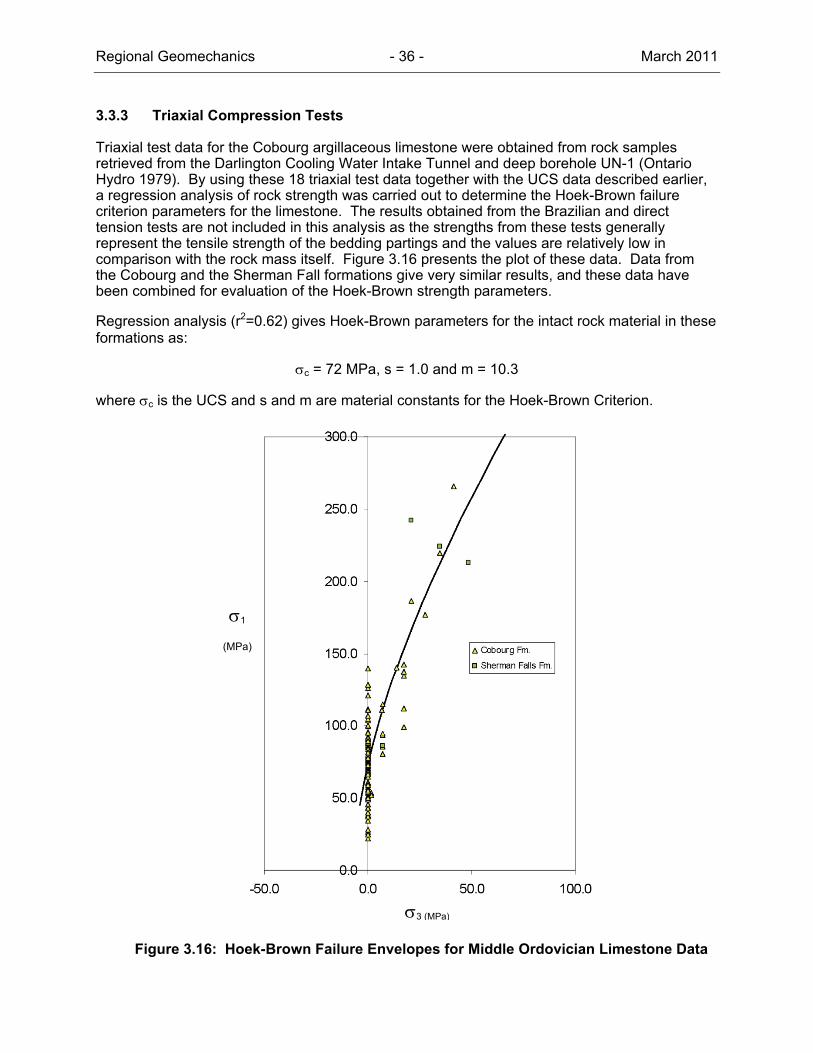
Regional Geomechanics - 36 - March 2011
3.3.3 Triaxial Compression Tests
Triaxial test data for the Cobourg argillaceous limestone were obtained from rock samples retrieved from the Darlington Cooling Water Intake Tunnel and deep borehole UN-1 (Ontario Hydro 1979). By using these 18 triaxial test data together with the UCS data described earlier, a regression analysis of rock strength was carried out to determine the Hoek-Brown failure criterion parameters for the limestone. The results obtained from the Brazilian and direct tension tests are not included in this analysis as the strengths from these tests generally represent the tensile strength of the bedding partings and the values are relatively low in comparison with the rock mass itself. Figure 3.16 presents the plot of these data. Data from the Cobourg and the Sherman Fall formations give very similar results, and these data have been combined for evaluation of the Hoek-Brown strength parameters.
Regression analysis (r2=0.62) gives Hoek-Brown parameters for the intact rock material in these formations as:
c = 72 MPa, s = 1.0 and m = 10.3
where c is the UCS and s and m are material constants for the Hoek-Brown Criterion.
Figure 3.16: Hoek-Brown Failure Envelopes for Middle Ordovician Limestone Data
1
(MPa)
3 (MPa)

Regional Geomechanics - 37 - March 2011
3.3.4 Direct Shear Test
The direct shear test is one of the standard tests in rock engineering to determine the frictional resistance along rock discontinuities such as joints and bedding plane. A number of direct shear test results were available for the Sherman Fall Formation from samples recovered from various OPG’s projects along the Trent and Otonabee Rivers (Ontario Hydro 1989a, 1989b and 1993) and from the Wesleyville GS (Ontario Hydro 1975). Specimens containing various discontinuity surface conditions, ranging from natural bedding planes to cut and ground surfaces, were tested. All tests were conducted under dry conditions and the normal pressure applied during the tests was limited to 0.7 MPa because of the loading requirement of hydraulic structures for those specific projects. The peak shear strength values measured from these tests are plotted against that of Cobourg Formation recovered from Darlington GS (Figure 3.17). Despite the difference in contact or shear plane conditions, the discontinuities tested under this normal stress range appear generally to behave similarly following the same trend with an average friction angle of about 37°. Comparing this peak friction angle with the angle of the residual shear strength envelope deduced from the data of the same tests (Figure 3.18), there appears to be very little roughness and directional influences from all samples tested. Thus, dilatancy, accompanying shearing of discontinuities in these formations, could be minimal.
Figure 3.17 shows the results of three shear tests on Cobourg limestone conducted at a higher normal stress of 1.4 MPa. These tests yield lower peak shear strengths at higher normal pressures, which could be best represented by a strength envelope in bi-linear or polynomial form.
3.3.5 Other Physical Property Relationships
Rock strength can be determined indirectly from geophysical log data if a strength-physical property relationship of the rock formation is established. The following parameters can be utilized to develop correlations with UCS:
1. P-wave velocity; 2. Elastic modulus; and 3. Effective porosity (absorption).
Figures 3.19 to 3.21 present plots exploring possible relationship between these parameters and UCS for all rock formations in the database. Despite a large scattering, approximate but notable trends are apparent when UCS is plotted against either the P-wave velocity or the elastic modulus. No correlation was found to exist between effective porosity and UCS.
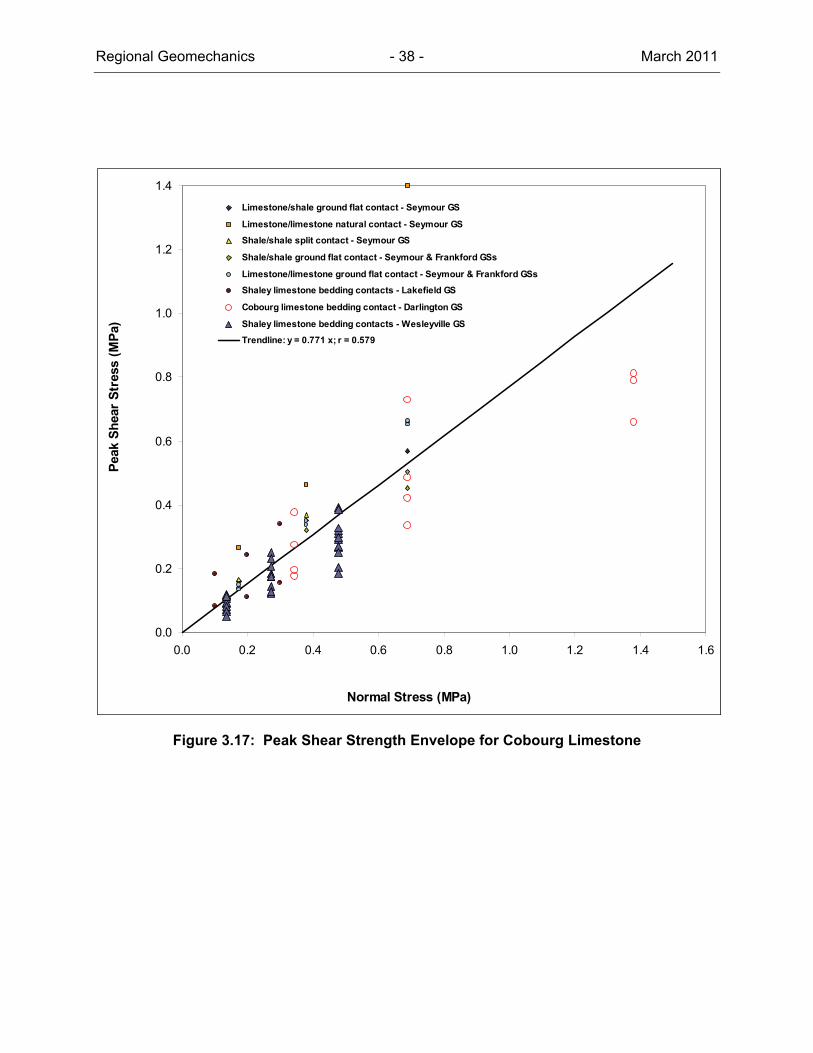
Regional Geomechanics - 38 - March 2011
Figure 3.17: Peak Shear Strength Envelope for Cobourg Limestone
0.0
0.2
0.4
0.6
0.8
1.0
1.2
1.4
0.0 0.2 0.4 0.6 0.8 1.0 1.2 1.4 1.6
Normal Stress (MPa)
Pea
k S
hea
r S
tres
s (M
Pa)
Limestone/shale ground flat contact - Seymour GS
Limestone/limestone natural contact - Seymour GS
Shale/shale split contact - Seymour GS
Shale/shale ground flat contact - Seymour & Frankford GSs
Limestone/limestone ground flat contact - Seymour & Frankford GSs
Shaley limestone bedding contacts - Lakefield GS
Cobourg limestone bedding contact - Darlington GS
Shaley limestone bedding contacts - Wesleyville GS
Trendline: y = 0.771 x; r = 0.579
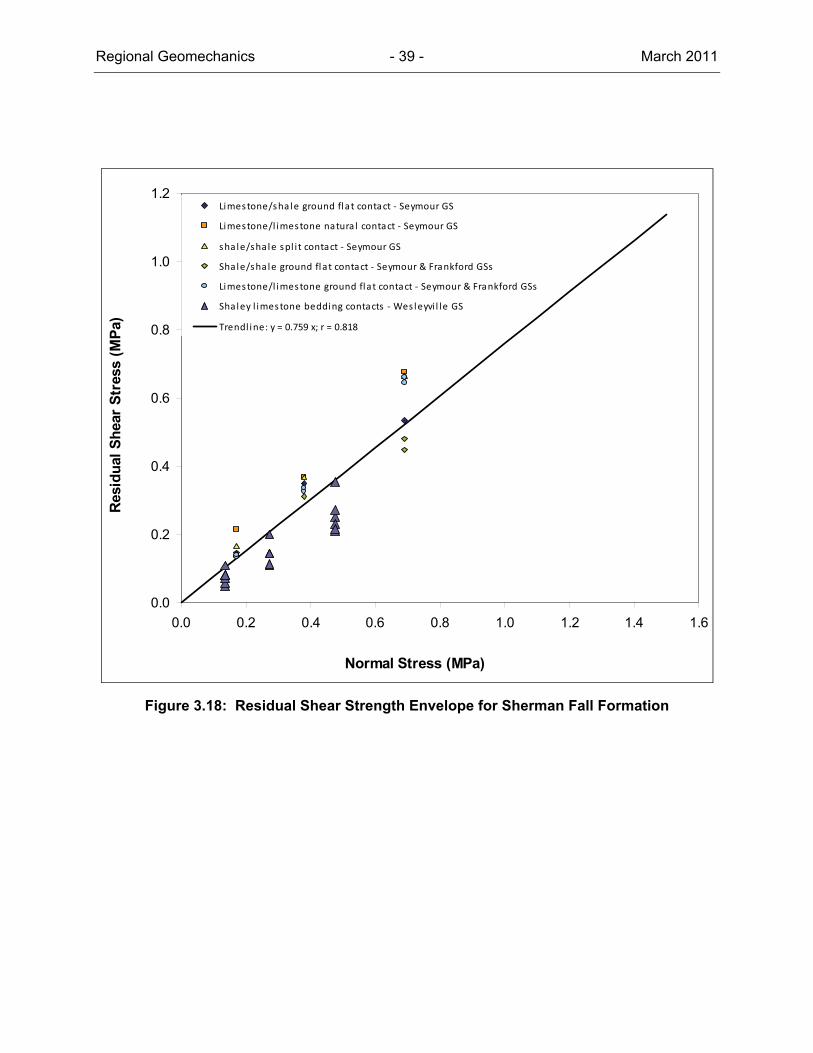
Regional Geomechanics - 39 - March 2011
Figure 3.18: Residual Shear Strength Envelope for Sherman Fall Formation
0.0
0.2
0.4
0.6
0.8
1.0
1.2
0.0 0.2 0.4 0.6 0.8 1.0 1.2 1.4 1.6
Normal Stress (MPa)
Res
idu
al S
hea
r S
tres
s (M
Pa)
Limestone/sha le ground flat contact ‐ Seymour GS
Limestone/l imestone natura l contact ‐ Seymour GS
shale/sha le spl i t contact ‐ Seymour GS
Shale/sha le ground flat contact ‐ Seymour & Frankford GSs
Limestone/l imestone ground flat contact ‐ Seymour & Frankford GSs
Shaley l imestone bedding contacts ‐ Wesleyvi l le GS
Trendl ine: y = 0.759 x; r = 0.818

Regional Geomechanics - 40 - March 2011
Figure 3.19: UCS Data vs. P-wave Velocity for All Rock Groups
Figure 3.20: UCS Data vs. Elastic Modulus for All Rock Groups
0
50
100
150
200
250
0 2000 4000 6000 8000
Vp (m/s)
UC
S (
MP
a)
Dolomite
Limestone
Sandstone
Shale
0
50
100
150
200
250
300
0 20 40 60 80 100
Ev(50), GPa
UC
S,
MP
a
Dolomite
Limestone
Sandstone
Shale
UCS on all data 2.305 Ev(50); R2 = 0.42

Regional Geomechanics - 41 - March 2011
Figure 3.21: UCS Data vs. Effective Porosity for All Rock Groups
3.4 Strength Anisotropy
Rock of sedimentary origin may often behave anisotropically in the direction orthogonal to bedding planes and isotropically along the bedding planes. Extensive studies on cross-anisotropic behaviour of sedimentary rocks of southern Ontario ranging in age range from Middle Ordovician to Middle Silurian have been carried out first by Lo and Hori (1979) and then by Lo and Yuen (1991) on the Heart Lake Tunnel in Mississauga, Ontario, and by OPG (1991) on the Sir Adam Beck Tunnel in Niagara Falls, Ontario. According to Lo and Hori (1979), except for the shaley limestone of the Gasport member of the Lockport Formation, the limestones and dolostones of the Lockport and Trenton formations do not exhibit significant anisotropic behaviour. Whereas, testing on the Georgian Bay and Collingwood specimens indicate strong mechanical anisotropy in these rock units. It appears that the ratio of the horizontal and vertical modulus (Eh/Ev) could be as high as 2.4.
Using the cross-anisotropic data from the above references, the ratio of the horizontal and vertical modulus are grouped by rock types and plotted against the unconfined compressive strength of vertically load samples in Figure 3.22. As observed by Lo and Hori (1979), the cross-anisotropic behaviour of rock diminishes as the sample becomes stronger. This trend is more pronounced if the UCS values are replaced by that of horizontally loaded samples (Figure 3.23).
0
20
40
60
80
100
120
140
160
180
200
0 5 10 15 20 25 30
Effective Porosity (%)
UC
S (
MP
a)
Dolomite
Limestone
Sandstone

Regional Geomechanics - 42 - March 2011
Figure 3.22: Modulus Ratio vs. UCS of Vertical Loaded Specimen
Figure 3.23: Modulus Ratio vs. UCS of Horizontal Loaded Specimen
0.0
0.5
1.0
1.5
2.0
2.5
3.0
0 50 100 150 200 250 300
Vertical UCS (MPa)
Dolomite
Dolomitic Limestone/LimestoneShaley Limestone
Shale
0.0
0.5
1.0
1.5
2.0
2.5
3.0
0 50 100 150 200 250 300
Horizontal UCS (MPa)
Av
era
ge
(E
h/E
v)
Dolomite
Dolomitic Limestone/ Limestone
Shaley Limestone
Shale

Regional Geomechanics - 43 - March 2011
The anisotropic effect of the rock should be taken into account to predict the behaviour of underground openings in softer shaley rock units of the Paleozoic sequence in southern Ontario. Because the target horizon of the DGR is the Cobourg limestone (with a high UCS), it is unlikely that the rock will be subjected to anisotropic effects in particular. In the field, the influence of the anisotropy on the rock deformation would likely be dominated by the presence of jointing and bedding planes.
3.5 Time Dependency
In southern Ontario, the geological conditions of the Paleozoic sequence are characterized by the presence of high horizontal stresses and also by the time-dependent behaviour particular to some rock formations. The latter phenomenon can be attributed to a number of environmental factors such as exposure time, temperature, chemical composition and the water content of the rock. Actions resulting from one or a few of these factors could lead to volumetric changes and/or the degradation of rock strength. Some rocks of sedimentary origin such as shales, anhydrites, marls and rock salts, are more susceptible to time-dependent deformation when stress change occurs. The controlling mechanism of the time-dependent deformation behaviour for these rocks will be explored in the subsections below.
3.5.1 Creep
Time dependent behaviour is seldom taken into account in the design of underground excavation. However, well after the end of excavation, tunnel convergence continues or even increases in some rocks particularly soft sedimentary rock. This phenomenon can be attributed to the rock creep around the tunnel opening, which also results in stress redistribution. This deformation could lead to an increase in loading on rock supports or progressive failure in the case of unsupported openings, which could affect the serviceability and even the integrity of tunnels. There are three stages of creep, the primary, secondary and tertiary stages. From laboratory creep experiments, it is well known that specimens are unlikely to reach beyond the primary stage when the creep load is less than 60% of the rock’s uniaxial compressive strength (Franklin and Dusseault 1989).
3.5.2 Swelling
Understanding of the swelling characteristics of rock is of particular importance to the design of shaft and cavern lining systems. Such time-dependent properties are common for shales and shaley limestones due to their clay mineral content, but also present in other materials such as anhydrites, marls and rock salts. The swelling behaviour of the rock formations in southern Ontario has been well documented and extensively studied in both the laboratory and in the field. Some of the best case histories on the effect of swelling induced deformation include the wheel pits in the Niagara and Toronto Power Generation Stations (Lee and Lo 1976) and Thorold and Heart Lake Tunnels (Lo et al. 1975 and Lo and Yuen 1981) in Niagara Falls and Mississauga. Based on these cases, it appears that the time-dependent deformation was generally initiated by relief of in situ stresses, subsequent to excavation.
There are several mechanisms associated with the swelling of argillaceous materials that exist within the sedimentary sequence at the Bruce nuclear site. These control mechanisms are briefly described in the following paragraphs.

Regional Geomechanics - 44 - March 2011
Swelling Due to Pyrite Oxidation
Biochemical alteration of pyrite due to iron- and sulphur-oxidizing bacteria, ferrobacilli and thiobacilli, could oxidize pyrite in rock into iron oxide. The by-products of this reaction are gypsum and jarosite. This reaction subsequently results in volumetric swelling due to crystal growth and the production of sulphuric acid. This process requires the availability of abundant oxygen. Examples of such swelling are the heave of basement floors founded on black shale of the Billings Formation, Ottawa. Based on Gratten-Bellew and Eden (1975), the reaction can be inhibited or stopped by preventing the rock from drying and ensuring low oxygen contact. From preliminary mineralogical analysis of all rock units encountered in DGR-1 and DGR-2 at the Bruce nuclear site, trace amounts of pyrite appear to be present locally throughout much of the sedimentary rock sequence. More noticeable amounts (up to 5%) occur locally in the Queenston, Georgian Bay, Blue Mountain, Cobourg, Sherman Falls and Kirkfield formations.
Swelling Due to Anhydrite-Gypsum Reaction
Another type of swelling occurs when anhydrite is hydrated to form gypsum. It was reported that this hydration process could result in a volume expansion of as much as 60% (Zanbak and Arthur 1984). Laboratory testing has shown that 3 to 12 months is required to complete the swelling process. High swelling pressure generated by this phase transition process is controlled by confining pressure, ground temperature and groundwater chemistry. The drilling of DGR-1 revealed that various Salina anhydrite units of thickness less than 5 m are present at Bruce nuclear sites.
Swelling Due to Double Layer Repulsion Reaction
The double layer theory developed in colloidal chemistry has been extensively used to successfully describe the swelling behaviour of clay, expansive soils and shales. For shale or shaley rock that contains kaolinites, the swelling is controlled by mechanical effects, whereas if smectite is present, swelling is controlled by physio-chemical reactions. The swelling of rock with illites is controlled both mechanically and physio-chemically. The swelling is stress dependent and is minimal when the rock is subjected to high confined pressure.
Swelling potential is the index used to characterize the time-dependent deformation characteristics of a rock and is defined as the rate of expansion strain measured within one logarithmic cycle of time in a rock sample. The test sample can be either fully submerged in formation or fresh water or stored under 100% relative humidity environment. Lo et al. (1978) described detailed testing procedures for the determination of the swelling potential. In general, three types of swell tests can be used to define the swelling potential: the free; semi-confined; and biaxial swell tests. The basic working principle of the free swell test is to monitor the dimensional change in three orthogonal directions of rock specimen under zero external stress. Whereas the semi-confined and biaxial swell tests study the effect of the applied stresses on swelling. The selection of an appropriate test depends on the type of prediction required for various elements of underground facilities. Table 3.4 presents typical horizontal swelling potentials of various rock units encountered in southern Ontario together with corresponding uniaxial strengths and modulus of elasticity (Lo 1989). These values are based on laboratory free swell tests on samples submerged in fresh water.

Regional Geomechanics - 45 - March 2011
Table 3.4: Typical Values of Mechanical and Swelling Properties of Some Rocks in Southern Ontario
Formation Type UCS
(MPa)
Elastic Modulus
(GPa)
Horiz. Swelling Potential
(% Log Cycle)
Lockport – Eramosa
Dolostone 120 63 0
Lockport (Goat Island)
Dolostone 200 62 0
Lockport (Gasport)
Shaly limestone 120 27 0.08
DeCew Dolostone w mudstone
74 57 0.04
Rochester Shale 85 23 0.07
Grimsby Sandstone and shale 25 8 0.27
Power Glen Shale and sandstone 26 9 0.17
Queenston Shale 30 10 0.30
Georgian Bay Shale 20 4 0.15
Blue Mountain Shale 27 2 0.15
Collingwood Black shale 80 20 0
Grey mudstone 58 10 0.15
Lindsay Limestone (shaly interbeds)
110 46 0.05
Verulam Limestone (shaly) 23 57 0.05
Gull River Limestone 143 63 0
Precambrian Medium grained 190 60 0
Granitic gneiss Coarse grained 140 46 0
Note: * data based on free swell test submerged in fresh water.
Figure 3.24 shows the results of some free swell tests on rock of southern Ontario. It can be seen that with the increase in calcite content in rock, both vertical and horizontal swelling potential decreases. There is also little or no swelling in rock containing over 15% calcite. The Queenston Shale shows the highest rate and magnitude of horizontal time dependent deformation among all the shale units tested in Southern Ontario (Table 3.4).
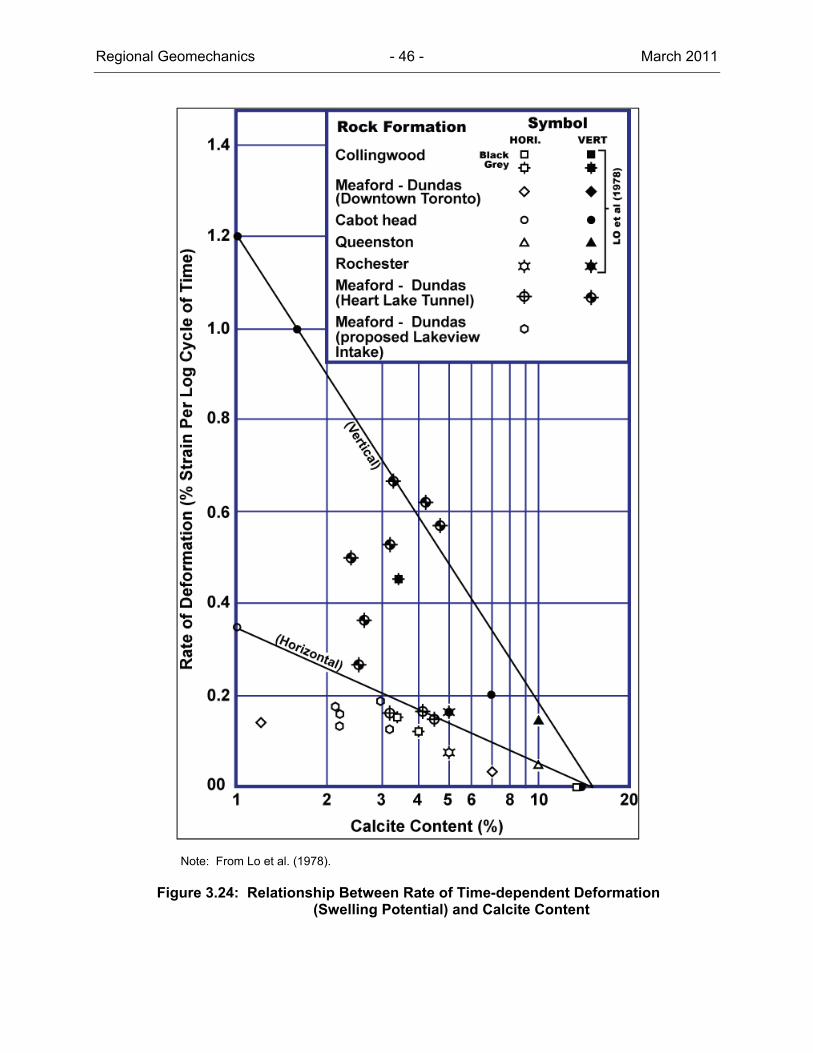
Regional Geomechanics - 46 - March 2011
Note: From Lo et al. (1978).
Figure 3.24: Relationship Between Rate of Time-dependent Deformation (Swelling Potential) and Calcite Content

Regional Geomechanics - 47 - March 2011
3.5.3 Slake Durability
The extent of slaking provides information on the rock ability to withstand cycles of wetting and drying cycles without softening or disintegration. This is one of the most important properties of the sedimentary rock in southern Ontario particularly for softer shale or shaley units. International Society of Rock Mechanics (ISRM) index testing, to standardize testing for the determination of slake durability, has been developed (Franklin and Chandra 1972). Figure 3.26 shows the result of these slake durability tests with corresponding point load strengths of various rock formations in Ontario. It appears that the index increases with the increase in age and strength of rock (Franklin 1983).
According to Franklin and Dusseault (1989), the slake durability index test can also be used as an indicator of rock prone to swelling because of a close relationship between the slaking resistance and swelling of rock.
Note: Figure modified from Franklin 1983.
Figure 3.25: Slake Durability Index of Different Sedimentary Rock in Ontario
3.5.4 Long-Term Strength Degradation
Various researchers have shown that the laboratory strength of small diameter unconfined cylindrical samples decrease with time. The duration of these laboratory experiments is generally less than 50 days and with loads greater than 60% of the peak strength. Using these data to extrapolate strength degradation to long-time periods of thousands of years is

Regional Geomechanics - 48 - March 2011
problematic. Schmidtke and Lajtai (1985) Martin et al. (1997) and OPG (2000) carried out laboratory tests to estimate the long-term strength of the Lac du Bonnet granite and the welded tuff of Yucca Mountain using uniaxial compression and triaxial creep tests. Because the conditions, such as state of stress of the specimen and the surrounding environment, are different in each test, the data sets were compared using a static-fatigue plot (Figure 3.27), a semi-logarithm plot of time to failure versus driving-stress ratio. The driving-stress ratio is the ratio of long-term and short-term deviatoric stresses. The data trends are considered to be similar, though the Lac du Bonnet data exhibits a flatter curve compared to the Yucca Mountain data. This indicates that under the same stress state, it will take longer time-to-failure for the fine-grained tuff than the coarse grained granite. This is because of the heterogeneous nature of the granite that promotes overstressing within the specimen (Damjanac et al. 2007).
Notes: LdB data from Schmidtke and Lajtai (1985) and OPG (2000); tuff data from Martin et al. (1997).
Figure 3.26: Static-fatigue Curves for Luc du Bonnet (LdB) Granite and Yucca Mountain Tuff
3.6 Summary
The above sections describe the results of a compilation of available rock strength across southern Ontario and surrounding Great Lake region. The data are intended to serve as a supplementary data set for the ongoing site-specific field and laboratory investigations, and as input parameters for conceptual engineering analyses of the DGR. Table 3.5 summarizes the general geomechanical properties of the Middle Ordovician, Upper Ordovician, Silurian and Devonian units. Although the following summary focuses on the intact rock strength obtained
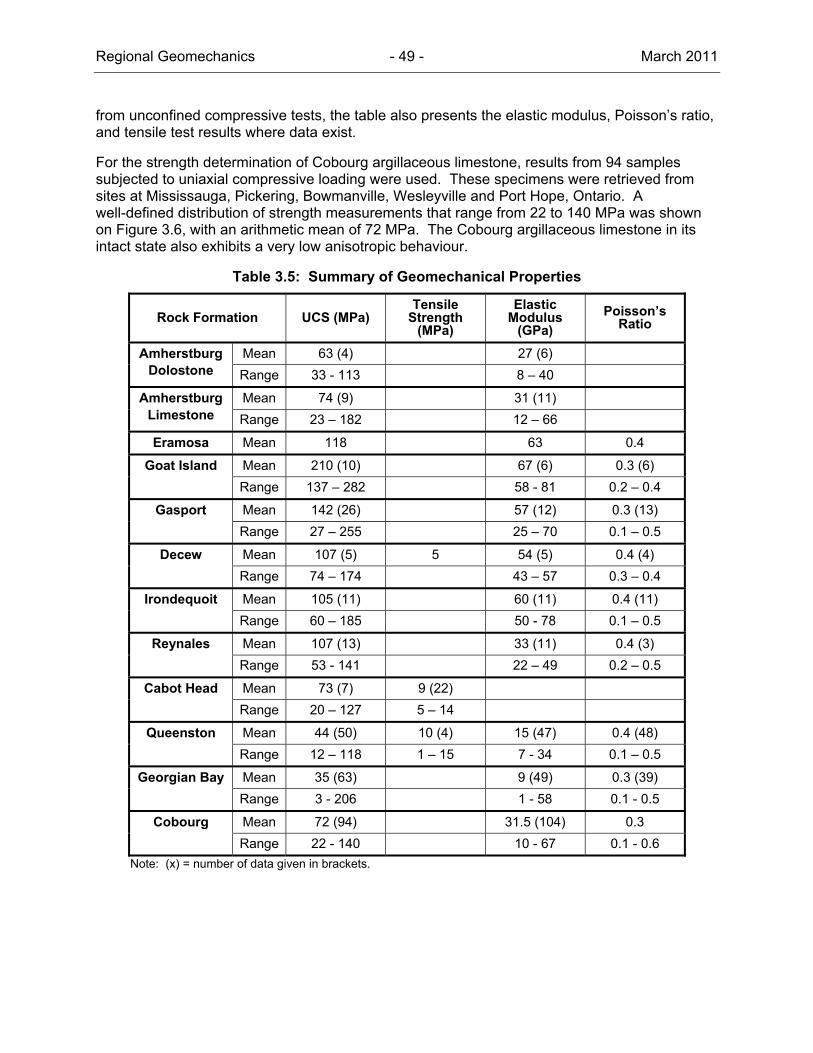
Regional Geomechanics - 49 - March 2011
from unconfined compressive tests, the table also presents the elastic modulus, Poisson’s ratio, and tensile test results where data exist.
For the strength determination of Cobourg argillaceous limestone, results from 94 samples subjected to uniaxial compressive loading were used. These specimens were retrieved from sites at Mississauga, Pickering, Bowmanville, Wesleyville and Port Hope, Ontario. A well-defined distribution of strength measurements that range from 22 to 140 MPa was shown on Figure 3.6, with an arithmetic mean of 72 MPa. The Cobourg argillaceous limestone in its intact state also exhibits a very low anisotropic behaviour.
Table 3.5: Summary of Geomechanical Properties
Rock Formation UCS (MPa) Tensile
Strength (MPa)
Elastic Modulus
(GPa)
Poisson’s Ratio
Amherstburg Dolostone
Mean 63 (4) 27 (6)
Range 33 - 113 8 – 40
Amherstburg Limestone
Mean 74 (9) 31 (11)
Range 23 – 182 12 – 66
Eramosa Mean 118 63 0.4
Goat Island Mean 210 (10) 67 (6) 0.3 (6)
Range 137 – 282 58 - 81 0.2 – 0.4
Gasport Mean 142 (26) 57 (12) 0.3 (13)
Range 27 – 255 25 – 70 0.1 – 0.5
Decew Mean 107 (5) 5 54 (5) 0.4 (4)
Range 74 – 174 43 – 57 0.3 – 0.4
Irondequoit Mean 105 (11) 60 (11) 0.4 (11)
Range 60 – 185 50 - 78 0.1 – 0.5
Reynales Mean 107 (13) 33 (11) 0.4 (3)
Range 53 - 141 22 – 49 0.2 – 0.5
Cabot Head Mean 73 (7) 9 (22)
Range 20 – 127 5 – 14
Queenston Mean 44 (50) 10 (4) 15 (47) 0.4 (48)
Range 12 – 118 1 – 15 7 - 34 0.1 – 0.5
Georgian Bay Mean 35 (63) 9 (49) 0.3 (39)
Range 3 - 206 1 - 58 0.1 - 0.5
Cobourg Mean 72 (94) 31.5 (104) 0.3
Range 22 - 140 10 - 67 0.1 - 0.6
Note: (x) = number of data given in brackets.

Regional Geomechanics - 50 - March 2011
4. ROCK MASS PROPERTIES AT FIELD SCALE
4.1 Rock Mass Condition
In this section the condition of rock mass will be examined through previous tunnelling case histories in Ontario and in Ohio, as insight into the type of rock conditions that may be encountered beneath the Bruce nuclear site.
In practice, the strength of a rock mass cannot be solely assessed based on the strength of the rock matrix as generally derived from unconfined compressive strength described in Section 3.3.1. It also depends on: the degree of interlocking within the system; the state of stress, and; the hydraulic condition. Rock mass classification systems, such as Bieniawski’s (1976) Rock Mass Rating (RMR76); Barton’s (1974) NGI Tunnelling Quality Index (Q) have been created to systematically classify the rock mass quality. In this way it allows previous design experience to be extrapolated from one engineering project to another.
These types of empirical standardized rating schemes have become an integral part of geomechanical design for underground openings. The most widely used classification systems are: Bieniawski’s (1976) Rock Mass Rating (RMR76); Barton’s (1974) NGI Tunnelling Quality Index (Q); and more recently, Hoek et al.’s (1995) Geological Strength Index (GSI). Various factors are used in each scheme to quantitatively assess the relative strength of the rock mass and hence tunnel stability. For example, the RMR utilizes rock core quality (RQD), discontinuity spacing and orientation, surface conditions, intact rock strength (UCS), and groundwater conditions (Bieniawski 1976). Barton (1974) characterizes rock mass in his Q system based on RQD, number of joint sets, surface characteristics and condition of controlling discontinuities as well as estimates of the in situ stress state and groundwater influences. GSI is by far the most user-friendly classification system to apply. The rating is a reflection of the lithology, structure and condition of discontinuities.
Golder Associates Ltd. (2003) compiled existing rock mass information from shallow tunnelling projects in similar rock as the host and cap rock at Bruce. Based on the measurements from the site investigation work at the Darlington GS, overall rock quality for the Cobourg limestone was classified to be good with RMR76 = 72 and a corresponding NGI-Q rate of 32. The integrity of the rock mass was demonstrated by two precedent 8 m and 10.4 m span tunnel excavations in this formation: the 925 m long Darlington cooling water intake tunnel; and the 470 m long oil storage cavern access tunnel at Wesleyville GS. The Darlington tunnel is completely located in the Upper Cobourg Formation, whereas, the Wesleyville tunnel intersects both the Upper Cobourg and Sherman Fall formations. Drill and blast techniques were used to construct both tunnels. No significant construction problems related to rock stability were encountered in either project. Further, there was no sign of seepage inflow from the rock units and the tunnels were completely dry, demonstrating the low hydraulic conductivity of the formation.
The rock mass classification for the Queenston Shale revealed good quality rock with ratings of 66 and 10.8 for RMR and Q values, respectively. The information used for the rating was of a preliminary nature, obtained from the investigation for the Niagara Hydroelectric Development. A good example of tunnels constructed in rock of this quality is the 13.5 m diameter enlargement of the development’s test adit. Mechanical excavation was employed by means of a road header. There was no major instability of the rock following excavation except some slabbing at the crown and on the sidewalls. This surficial spalling only occurred at areas where primary bedding planes exist (Acres Bechtel Canada 1993). Also, it is known that the shale tends to be susceptible to swelling upon exposure. Rock reinforcement was required to control

Regional Geomechanics - 51 - March 2011
slabbing and slaking. Despite this condition, the rock encountered was of better quality than was anticipated. The tunnel was essentially dry except at local bedding planes where minor seepage was observed (Golder Associates Ltd. 2003).
The Georgian Bay Formation is shale with minor interbedded siltstone and limestone layers. The thickness of the shale beds is generally much thinner than that of the overlying Queenston Formation. Also the uniaxial compressive strengths of the rock from the southern Ontario database (Table 3.1) average only 35 MPa. However, a large variation in UCS results was observed due to the interbedded nature of shale and carbonate in the rock unit. Based on these rock characteristics, the shale is classified to have a fair quality with RMR76 to be about 54, which is less than the RMR76 of 66 determined for the Queenston. Despite a fair rock mass rating, numerous municipal service tunnels have been excavated in this formation without any stability problem. These tunnels have a relatively small diameter when compared to those mentioned in previous paragraphs (Golder Associates Ltd. 2003).
Rock mass property is primarily governed by the strength of the intact rock and by the presence of discontinuities in the rock mass. Because of the lack of discontinuities and an increase in confinement, which results in an overall strength increase, the quality of the rock mass at repository depth is anticipated to be stronger and in a less disturbed state with a much higher rock mass rating than that at shallow depths. Preliminary findings on the host and cap rock from the DGR-1 and DGR-2 investigation appear to confirm this trend. This observation is supported by the high RQD and massive beds, (except for the medium bedded Georgian Bay Formation, encountered in these drill holes). Also, the UCS of the Cobourg host rock determined on samples from DGR-2 revealed that the average strength value of 109 MPa is considerably higher than the average UCS of 72 MPa determined from the compilation of regional results in Chapter 3. This higher strength will improve the cavern stability conditions of the proposed DGR Facility.
4.2 Rock Mass Time Dependant Deformation: Historical Experience from Southern Ontario Tunnels
The observation of the effects of time dependent deformation in the rock mass in the Niagara region has had a history of more than 100 years. Table 4.1 summarizes some of the case histories of tunnels and structures in formations relevant to those of the Bruce nuclear site which may experience time dependent deformation.
The continuous inward convergence of the wheel pits at the Canadian Niagara Power Company plant (Rankine GS) was first noticed shortly after construction began in 1902. Since then, until 1905 when the plant was commissioned, an inward movement of about 3.7 cm occurred (Lee and Lo 1976). In 1905 survey pins were installed and since then a lengthy record has been kept. The greatest movement (about 6 cm in 70 years) has occurred along the turbine deck in the Decew dolostone (Menzies and Taylor 1998). A sister station, the Toronto Power GS, had to be decommissioned in 1973 because of damage and safety concerns created by the lateral rock pressure in the Silurian Gasport, Decew, and Rochester formations.
A portion of the concrete floor slab of the Sir Adam Beck No. 1 canal (formerly known as the Queenston-Chippawa Canal) buckled during construction in 1921 in one of the deepest cut areas south of Lundy’s Lane. Another area, about 915 m long, was found to have heaved in the Decew and or Gasport formations when part of the canal was dewatered in 1964. The buckling occurred in the DeCew and/or Gasport formations. Prior to the dewatering, a closure gate for the canal, the Montrose Road Gate Structure, became stuck due to rock squeeze (Lo 1978, Menzies and Taylor 1998).

Regional Geomechanics - 52 - March 2011
The Heart Lake Road Trunk Sewer Tunnel is located at the intersection of highways 401 and 403 in Mississauga. It has a length of 1.68 km and an internal diameter ranging from 2.74 to 3.05 m and was excavated in the Georgian Bay Formation. The tunnel was constructed in 1974-1975. Shortly after construction, the cast-in-place concrete lining began to deteriorate and crack due to distress (Kramer and Moore 2005). The condition of the lining gradually worsened over about 30 years, until it was recently rehabilitated.
The cool water intake tunnel at Darlington GS (8 m span), excavated in the Cobourg Formation in 1982, experienced high in situ stress with a maximum horizontal component ranging between 10 to 14 MPa. It was recognized that there was potential for time dependent deformation of the rock. As a result a field instrumentation program was carried out during tunnel excavation. The results of extensometer and convergence measurements showed an insignificant inward movement of up to 3 mm at the springline of the tunnel (Lo and Lukajic 1984). The performance of this tunnel in the Cobourg Formation provides insight into the limited time dependent deformation behaviour of that formation, which is expected to host the DGR.
Long-term time dependent deformation of the Queenston Formation shale could potentially induce distress of tunnel openings because of its’ high swelling potential. In the Niagara Fall test adit, an attempt was made to field investigate the swelling characteristics of that shale by monitoring the change in stress and deformation of both boreholes and an area flooded with fresh water, but results were inconclusive (Acres Becthel Canada 1993). On the other hand, multipoint convergence monitoring of the trial enlargement section of the adit indicated major rock deformation was confined to the first 2 m behind the excavation surface. This agrees with the surficial spalling mentioned in Section 5.1 Deformation beyond this 2 m zone, was insignificant being generally less than 6 mm in a period of 3 months. The creep rates were logarithmic varying with depth from the excavation surface. They range from 4.7 mm per log cycle time immediately behind the surface to 0.4 mm per log cycle time at 3.3 m into the rock mass (Beck Diversion Group 1998).
Rock mass time dependant deformation in Southern Ontario is known to occur in a variety of rock types and formations and is most apparent in shale. The resulting effects are similar for the structures located in each rock type. Based on the experience at Darlington GS and free swell testing of DGR-2 samples, time dependent behaviour does not appear to be an issue in the Cobourg Formation which will host the DGR.

Reg
iona
l Geo
mec
hani
cs –
Sou
ther
n O
ntar
io
- 53
-
Mar
ch 2
011
Tab
le 4
.1:
Syn
thes
is o
f T
ime-
Dep
end
ent
Def
orm
atio
n in
Nia
gar
a F
all R
egio
n
Cas
e L
oca
tio
n
Des
crip
tio
n
Dis
pla
cem
ent
Fo
rmat
ion
Ro
ck T
ype
R
efer
ence
R
emar
ks
To
tal
(mm
)R
ate
(mm
/yr)
1 C
anad
ian
Nia
gar
a P
ow
er C
o./R
anki
n
Pla
nt:
Wh
eel P
it
(@N
60°E
)
Inw
ard
mov
emen
t of r
ock
wal
ls
at tu
rbin
e de
ck
76
1.25
D
ecew
/ R
oche
ster
Dol
osto
ne/
Sha
le
Lee
and
Lo (
1976
)
Lo (
1978
)
Ont
ario
Hyd
ro e
t al.
(198
6)
+/-
0.1
3 cm
mov
emen
t flu
ctua
tes
on s
easo
nal
basi
s
Inw
ard
mov
emen
t of r
ock
wal
l at
upp
er g
uide
dec
k an
d th
rust
de
ck
10,1
50.
25,
0.38
Lo
ckpo
rt
Dol
osto
ne
Lo (
1978
) +
/- 0
.13
cm m
ovem
ent
fluct
uate
s on
sea
sona
l ba
sis
Inw
ard
mov
emen
t of r
ock
wal
l at
rac
k de
ck
25
2 R
oche
ster
Sha
le
Lo (
1978
)
+/-
0.1
3 cm
mov
emen
t flu
ctua
tes
on s
easo
nal
basi
s
2 T
oro
nto
Po
wer
G
S:
Wh
eel P
it
Inw
ard
mov
emen
t of w
alls
du
ring
cons
truc
tion,
50
year
af
ter
cons
truc
tion,
rei
nfor
ced
arch
cru
shed
>65
Lock
port
D
olos
tone
/ Li
mes
tone
G
orm
an (
1976
)
3 S
AB
1 G
S
Com
pres
sion
cra
ckin
g an
d bu
lgin
g al
ong
cana
l flo
or d
urin
g co
nstr
uctio
n.
Ext
ensi
ve m
ovem
ent o
ver
a le
ngth
of 9
00 m
dur
ing
1964
ca
nal d
ewat
erin
g
+/-
900
Lo
ckpo
rt
Dol
osto
ne/
Lim
esto
ne
Gor
man
(19
76)
4 S
AB
2 G
S C
anal
In
war
d m
ovem
ent o
f roc
k w
alls
du
ring
exca
vatio
n 25
Lock
port
D
olos
tone
and
Li
mes
tone
H
ogg
(195
9)
Mov
emen
t afte
r 2
year
op
erat
ion
1.
5
Inw
ard
mov
emen
t of r
ock
wal
ls
durin
g ex
cava
tion
2.5
1.7
Lock
port
Inte
rco
nn
ecti
ng
C
anal
(In
take
) D
efor
mat
ion
afte
r ex
cava
tion
of
top
half
of tu
nnel
13
D
olos
tone
and
Li
mes
tone
H
ogg
(195
9)

Reg
iona
l Geo
mec
hani
cs –
Sou
ther
n O
ntar
io
- 54
-
Mar
ch 2
011
Cas
e L
oca
tio
n
Des
crip
tio
n
Dis
pla
cem
ent
Fo
rmat
ion
Ro
ck T
ype
R
efer
ence
R
emar
ks
To
tal
(mm
)R
ate
(mm
/yr)
T
un
nel
1
Def
orm
atio
n af
ter
100
days
in
clud
ing
cree
p m
ovem
ent
25
91
Hog
g (1
959)
Def
orm
atio
n af
ter
low
er b
ench
ex
cava
ted
45
Rey
nale
s/
Nea
gha/
T
horo
ld
Dol
osto
ne/
Lim
esto
ne
Ver
tical
def
orm
atio
n af
ter
benc
h ex
cava
tion
13
H
ogg
(195
9)
Tu
nn
el 2
(T
win
)
Rey
nale
s D
olos
tone
5 S
teel
Arc
h B
rid
ge
Ab
utm
ents
C
losu
re in
NW
-SE
dire
ctio
n 23
0
Lock
port
/ R
oche
ster
Dol
osto
ne/
Lim
esto
ne/
Sha
le
Ont
ario
Hyd
ro (
1983
) H
alf o
r th
e ab
utm
ent i
n Lo
ckpo
rt F
m. a
nd h
alf
in R
oche
ster
Fm
. D
efor
mat
ion
in N
W-S
E
dire
ctio
n
6 B
arg
e C
anal
(h
ead
ing
@
N48
°E)
Hea
ving
at c
entr
e of
can
al fl
oor
610
Lo
ckpo
rt/
Roc
hest
erD
olom
ite/
Sha
le
Ont
ario
Hyd
ro (
1983
)
Lo (
1978
)
7 L
ock
34
and
35
(bea
rin
g @
N31
°E)
Tot
al m
ovem
ent
280
R
oche
ster
Sha
le
Ont
ario
Hyd
ro (
1983
) A
lmos
t ent
irely
in
shal
e
8 B
roo
ks A
ven
ue
Bri
dg
e C
losu
re
180
O
ntar
io H
ydro
(19
83)
9 B
uff
alo
Ro
ad
Bri
dg
e C
losu
re
+20
0
Ont
ario
Hyd
ro (
1983
) C
utou
t 200
mm
in w
all
to a
llow
mov
emen
t
10
Lye
ll R
oad
Bri
dg
e C
losu
re
+10
0
Ont
ario
Hyd
ro (
1983
) C
utou
t of 1
00 –
15
0 m
m in
wal
l to
allo
w m
ovem
ent
11
Ad
am G
S:
Wh
eel
Pit
(N43
°E)
Inw
ard
mov
emen
t sm
all
O
ntar
io H
ydro
(19
83)

Reg
iona
l Geo
mec
hani
cs –
Sou
ther
n O
ntar
io
- 55
-
Mar
ch 2
011
Cas
e L
oca
tio
n
Des
crip
tio
n
Dis
pla
cem
ent
Fo
rmat
ion
Ro
ck T
ype
R
efer
ence
R
emar
ks
To
tal
(mm
)R
ate
(mm
/yr)
12
On
tari
o P
ow
er G
S:
Acc
ess
tun
nel
to
E
leva
tor
shaf
t
Flo
or b
uckl
ing
6 –
19
Roc
hest
erS
hale
O
ntar
io H
ydro
(19
83)
Fo
reb
ay C
anal
M
ovem
ent d
urin
g ex
cava
tion
25
O
ntar
io H
ydro
(19
83)
Inta
ke C
on
du
its
In
war
d m
ovem
ent o
f roc
k w
all
durin
g ex
cava
tion:
25
Ont
ario
Hyd
ro (
1983
) M
ovem
ent w
ith c
reep
at
dec
reas
ing
rate
Flo
or h
eavi
ng
51
O
ntar
io H
ydro
(19
83)
13
Th
oro
ld T
un
nel
In
war
d m
ovem
ent o
f roc
k w
all
afte
r co
nstr
uctio
n 14
0.
77
Lock
port
D
olos
tone
/ S
hale
y Li
mes
tone
Ont
ario
Hyd
ro (
1983
)
Bow
en e
t al.
(197
6)
No
notic
eabl
e m
ovem
ent d
urin
g ex
cava
tion
exce
pt
seep
age
Not
e:
Info
rmat
ion
is a
fter
Bec
k D
iver
sio
n G
roup
(1
998)
.
Regional Geomechanics - 56 - March 2011
5. IN SITU STRESSES
5.1 Introduction
In situ stresses exist throughout the bedrock in the Earth’s crust and can be due to a number of different causes. The most important and widespread cause is derived from a regional force field due to tectonic activity. In eastern North America this is due to the spreading apart of continents along the Atlantic Ocean. While these stresses are naturally occurring through geological processes in all rocks, their magnitudes and directions differ according to the location, geology and tectonic setting.
Before describing different in situ stress measurement techniques and regional data, it would be advantageous to establish the basic nomenclature of the in situ stresses as they are a three-dimensional subject. In this report, in situ stresses are described either based on their reference axis or in terms of principal axes where all shear stress components along the principal plane are zero. The three principal stresses (1, 2, and 3) are orthogonal to each other and represent the stress state of a ground element. Where the state of stress is expressed in terms of reference axes: H is the maximum horizontal stress; h is the minimum horizontal stress; and v is the vertical stress. (These stresses are also orthogonal.) The principal stress directions assumed in this study are vertical and horizontal due to the near horizontally layered Paleozoic rocks (Section 2.3).
5.1.1 In situ Stress Measurement Techniques
There are a number of direct and indirect techniques available to constrain the magnitude and directions of in situ stresses in rock mass. The most commonly used are hydraulic fracturing and overcoring. Other methods that may provide some insights are borehole breakouts and core disking observations, laboratory core straining methods, and excavation back analysis, etc. Additional information related to in situ stress measurements and techniques is described in a special issue publication on in situ rock stress determination (IJRMMS 2003). While all these methods provide information on in situ stresses there are limitations in determining the stress magnitude in deep boreholes. The hydraulic fracturing and overcoring methods are discussed below.
The hydraulic fracturing technique is commonly conducted in deep vertical boreholes and is used to measure the minimum horizontal stress usually below a depth 30 m or more below the ground surface (Haimson and Cornet 2003). The maximum horizontal stress is calculated based on the theory of elasticity. Several researchers have expressed doubt in this calculated value because of reliability issues (Rutqvist et al. 2000, Ito et al. 1999). A short segment of the hole is sealed off using a straddle packer. This is followed by the pressurization of the fracture-free segment of the hole by pumping in fluid, generally water. The pressure is raised until the rock surrounding the hole fails in tension at a critical pressure. Following breakdown, the shut-in pressure, and the lowest test-interval pressure at which the tensile fracture closes completely under the action of the stress acting normal to it are determined. This fracture is expected to be perpendicular to the minimum principal stress (3) of the in situ stress field. As demonstrated by Evans and Engelder (1989), when the magnitude of the horizontal stresses exceed the vertical stress, hydraulic fracturing in vertical boreholes could be difficult to interpret particularly when the state of stress of the ground is a thrust regime. Under such a stress environment, the vertical stress becomes the minimum principal stress. The testing process can produce subhorizontal to horizontal fractures. Despite the traces of vertical fracture impressions observed along the length of a test section, fracture rotation to a horizontal position

Regional Geomechanics - 57 - March 2011
perpendicular to the 3 direction could occur beyond the borehole wall surface, yielding stress measurements that are in fact vertical.
The overcoring technique is another widely used method (Sjöberg et al. 2003) of in situ stress measurement in which the bottom/end of a small diameter drill hole is instrumented with sets of displacement strain gauges followed by overcoring the instrumented section with a larger diameter drill bit. The induced strains due to the stress relief of the overcored section are then related to the rock stress by means of material properties of the rock determined from core testing. There are three main types of overcoring measurement systems: the doorstopper gauge, the USBM4 gauge, and the CSIRO3 gauge. A comprehensive description of each system and its application is presented in Thompson et al. (2002). In general, the doorstopper and the USBM gauges measure the stresses in the two dimensional plane orthogonal to the drill hole axis, whereas the CSIRO unit allows the determination of the complete stress tensor. Normal overcoring methods are generally applicable to drill holes with depths up to 50 m (Sjöberg et al. 2003). However, special modified versions of the doorstopper (DDGS3), USBM (IST3) and CSIRO (SSPB3 Borre probe) gauges can be used for measurements at greater depths. The limits of application reportedly range from 528 to 750 m (INTERA 2006). In general, the deeper the borehole, the greater the difficulty in obtaining successful measurements. In addition to the depth issue, overcoring methods that require gluing of strain gauges onto a polished borehole wall or bottom that are frequently problematic (Martin and Lanyon 2003).
Laboratory core strain and excavation back-analysis methods will not be described here as the regional in situ stress database does not contain measurements obtained from such methods. Borehole breakouts, core disking and other geological and seismological information can also be used to estimate the in situ stress direction but generally not the in situ stress magnitude. A compilation of these borehole observations and other common geological evidence in southern Ontario and northern New York state (Adams 1995) contributes to the estimation of major principal stress orientation in this study.
In general, in situ stress measurements produce a significant amount of data scatter, particularly when multiple site data are used for analysis. Martin (2007) described uncertainties that can be introduced due to error associated with both testing techniques and spatial variability of measurements generated during in situ stress measurement. Uncertainties generated due to errors from in situ stress testing vary from method to method. However, even in the same rock formations, it is difficult to avoid spatial variability of measurement data due to the nature of the material.
The following sections contain a compilation of in situ stress information on the Palaeozoic rock formations5 in the Appalachian and Michigan Basins collected from the published literature. The stress information not only depends on the regional tectonic history but also the topography and litho-mechanical variability of the area under study. Despite these limitations, the information gathered could be utilized for simple predictions of in situ stress magnitude during preliminary design stages.
4 USBM = United State Bureau of Mine; CSIRO = Commonwealth Scientific and Industrial Research Organisation; DDGS = Deep Doorstopper Gauge System; IST = In situ Stress Tool; SSPB = Swedish State Power Board.
5 Except information from the late Precambrian red shale in Gratiot County in Michigan.

Regional Geomechanics - 58 - March 2011
5.1.2 Regional Stress and Plate Tectonics
The World Stress Map published by the University of Karlsruhe (www-wsm.physik.uni-karlsruhe.de/pub/maps/wsm2005_large.jpg) indicates that the orientation of the maximum in situ stress worldwide can vary depending on the region and its plate tectonic setting. The magnitude and orientation of the maximum horizontal in situ stresses is regional in scale and persistent with depth. Although the orientation can vary considerably, even within a given tectonic plate, in eastern North America the current stress orientation is approximately ENE (Heidbach et al. 2008). This orientation may have been ESE to SE during much of the Paleozoic when eastern North America was in a state of compression. When the Atlantic Ocean first began to form and spread at the beginning of the Jurassic period, some 200 Ma, the east coast of North America switched from an active to a passive margin. As the North American plate drifted farther from the spreading centre, the stresses appear to have shifted to the current ENE position.
Based on current tectonic plate motions, derived from a variety of space geodetic technologies (Larson et al. 1997), the North American plate is moving in a WSW direction and is expected to continue in that general direction for millions of years, well beyond the life of the DGR. The east side of the North American plate is expected to continue being a passive margin for at least another 100 million years as the plate drifts to the WSW. The current in situ stress regime is not expected to change significantly for the foreseeable life of the DGR.
“Hot spots” are relatively stationary deep volcanic sources in the earth. As a plate moves over a hot spot it leaves behind a track of extinct volcanoes oriented along the direction of plate movement, the Hawaiian Islands providing the most well known example. On the North American continent, the best example is the Yellowstone hot spot track in Idaho which is oriented at ENE (WSW) and represents an interval of time from about 16 million years ago to the present. Another much older hot spot track is found along the Monteregian Hills near Montreal in Quebec. These were formed 120 to 130 million years ago, after the opening of the Atlantic, and have a general E-W to ESE trend.
5.1.3 Geology and Stress
In addition to the effects of tectonic action, the magnitude of in situ stresses is related to the rock mass quality and stiffness. Stresses will tend to accumulate and build up in stiff rigid rock units (such as granite, dolostone limestone, or basalt), that are massive. However they will tend to be built up only to a point in weaker and softer rocks (such as soft shale, fractured limestone, or salt) after which they are redistributed to adjacent stronger and stiffer members and/or slow gradual deformation occurs in the weaker rock. An example of this was described in Evans et al. (1989) on three deep boreholes in Devonian formations in the Appalachian Basin. Cartwright (1997) developed a relationship for estimating the magnitude of the maximum in situ stresses in interbedded rock formations with variable elastic properties in order to design appropriate underground support for coal mining in the United Kingdom. While measuring in situ stresses in coal mines, he confirmed the presence of a strong relationship between the maximum horizontal stress (H) and the elastic modulus of the rock. Cartwright (1997) concluded that in sedimentary strata the magnitude of the horizontal stress should always be quoted with the elastic properties of the test horizon and the method of elastic property determination.
Because the rock mass may also include structural weaknesses, such as fracture zones or faults filled with gouge, these features may initiate failure of the rock mass when the state of stress exceeds their strength. Although much of the rock mass may be brittle and posses a much higher strength, failure of the rock mass may occur along such weak features. Failure will be either sudden
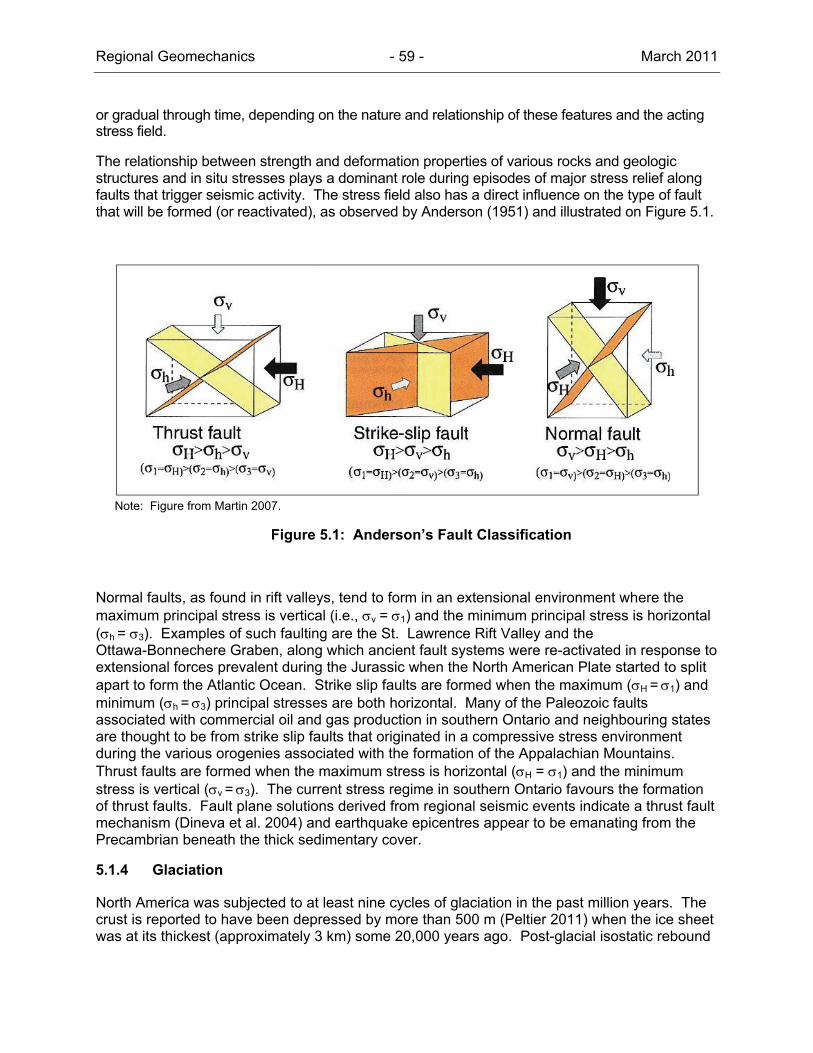
Regional Geomechanics - 59 - March 2011
or gradual through time, depending on the nature and relationship of these features and the acting stress field.
The relationship between strength and deformation properties of various rocks and geologic structures and in situ stresses plays a dominant role during episodes of major stress relief along faults that trigger seismic activity. The stress field also has a direct influence on the type of fault that will be formed (or reactivated), as observed by Anderson (1951) and illustrated on Figure 5.1.
Note: Figure from Martin 2007.
Figure 5.1: Anderson’s Fault Classification
Normal faults, as found in rift valleys, tend to form in an extensional environment where the maximum principal stress is vertical (i.e., v=1) and the minimum principal stress is horizontal (h = 3). Examples of such faulting are the St. Lawrence Rift Valley and the Ottawa-Bonnechere Graben, along which ancient fault systems were re-activated in response to extensional forces prevalent during the Jurassic when the North American Plate started to split apart to form the Atlantic Ocean. Strike slip faults are formed when the maximum (H = 1) and minimum (h = 3) principal stresses are both horizontal. Many of the Paleozoic faults associated with commercial oil and gas production in southern Ontario and neighbouring states are thought to be from strike slip faults that originated in a compressive stress environment during the various orogenies associated with the formation of the Appalachian Mountains. Thrust faults are formed when the maximum stress is horizontal (H = 1) and the minimum stress is vertical (v = 3). The current stress regime in southern Ontario favours the formation of thrust faults. Fault plane solutions derived from regional seismic events indicate a thrust fault mechanism (Dineva et al. 2004) and earthquake epicentres appear to be emanating from the Precambrian beneath the thick sedimentary cover.
5.1.4 Glaciation
North America was subjected to at least nine cycles of glaciation in the past million years. The crust is reported to have been depressed by more than 500 m (Peltier 2011) when the ice sheet was at its thickest (approximately 3 km) some 20,000 years ago. Post-glacial isostatic rebound

Regional Geomechanics - 60 - March 2011
is still occurring and varies by a few millimetres per year across southern Ontario and is well documented in the literature. Based on the Global Positioning System data on vertical velocity motion, the hinge line separating uplift and subsidence is located approximately at the US/Canada border. Areas to the north are still rebounding. Fast rebound of approximately 12 mm/yr was recorded in Hudson Bay region (Stella et al. 2007). The areas to the south of the Great Lakes are now subsiding at a rate of 1 to 2 mm/yr. Although postglacial recovery has been in the order of several hundred metres, the rebound process is still active and may take many thousands of years to complete.
The stress field produced by glacial loading and unloading is certainly transient (Adams 1989) but the decay occurs over thousands of years. Higher compressive stresses, normal to the ice margin would be created by the differential loading of the ice sheets, which is superimposed on the background tectonic stress field. However the large weight of the ice sheets is able to suppress fault motions and earthquakes (Johnston 1987), so thrust faults striking tangential to the ice margin are generated only at the end of deglaciation. Some evidence of late-glacial or postglacial faulting in eastern Canada have been found (Adams 1989, Shilts et.al. 1992, Adams 1995) to support the idea of glacial induced earthquakes, however the very small displacements (<0.1 m) of glacial striations indicate very little movement. The orientation of the stress field depends on the differential horizontal stresses due to postglacial rebound and tectonics (e.g., spreading at the Mid-Atlantic Ridge). Before the end of deglaciation, rebound stress dominates the stress orientations. However, the glacial induced stresses decay after the end of deglaciation, and now the orientation of the total stress becomes dominated by the background tectonic stress. Thus, the orientation of the contemporary stress field does not show any influence from the effect of the last glaciations.
Fault interpretation based on earthquake focal mechanisms supports that all the postglacial faults in eastern Canada, north of the lower Great Lakes are thrust faults, with relative magnitudes of the in situ stresses of H > h > v. However, focal mechanisms reveal a combination of thrust and strike-slip (H > v > h) faulting in areas south of the Great Lakes and in the northern Appalachians. Dineva et al. (2004) suggested that the change in stress environment could be related to the trade-off between glacial rebound stress and tectonic stress because the boundary is coincident with the southern terminus of the ice sheet
5.2 Data Sources
Ontario is located in the mid-plate stress province, the largest stress province in North America and is characterized by high horizontal compressive stress (Adams and Bell 1991). The existence of high horizontal stresses in sedimentary and shield rocks has been well documented (Lo 1978, Lee 1981). Section 5.3 summarizes the available rock stress measurements in southern Ontario and northern US within the Great Lake region.
More than 180 in situ stress entries from 26 sites within the Appalachian and Michigan basins are selected from the database for this study. In situ stress measurement data obtained using various methods, both magnitude and/or direction, were compiled from published works (e.g., Bauer et al. 2005, Haimson, 1978a, 1980, and 1982, Ontario Hydro 1978b and 1988, Palmer and Lo 1976). The locations of the sites are shown on Figure 5.2 and the numbered references are found in Section 8.3. The depth of investigation varies from 4 m to 5100 m in Paleozoic limestone, shale and Precambrian gneissic bedrock. The techniques mostly employed to obtain stress measurements at these sites were hydraulic fracturing, overcoring, or a combination of both. Stress components measured from both methods include bi-axial or tri-axial in situ stresses. If only the maximum and minimum horizontal stresses (H, h) were

Regional Geomechanics - 61 - March 2011
measured, vertical stress (v) was computed based on average stratigraphic density of 2.65 g/cm3. The orientations of the corresponding maximum horizontal stresses in most cases were also documented.
Notes: The green dots refer to: (1)=Haimson (1982); (2)=Ontario Hydro (1978b); (3)=OPG (1991); (4)=Palmer and Lo (1976); (5)=Haimson and Lee (1980); (6)=Bauer et al. (2005); (7)=Haimson (1978b); (8)=Haimson (1978a); (9)=Obert (1962); (10)=Haimson and Stahl (1969); (11)=GSC (1995); (12)=Hoek and Brown (1980); (13)=Lindner (1985); (14)= Dames & Moore (1978); (15)= Ontario Hydro (1979); (16)=Ontario Hydro (1981); (17)=Trow and Lo (1989); (18)=Franklin Trow Associates (1979); (19)= Ontario Hydro (19); (20)=Evans et al. (1989)
Figure 5.2: Locations of In Situ Stress Measurements within the Appalachian and Michigan Basin
Additional data sources on the orientation of maximum horizontal in situ stress were obtained from the World Stress Map (Reinecker et al. 2004) and from Geological Survey of Canada’s in situ stress database (Adams 1995). The latter is a modified database which includes over
Regional Geomechanics - 62 - March 2011
300 entries from sites in both basins derived from in situ stress measurements, interpretation of oil well breakout information, focal mechanism and geological observation.
5.3 Results
5.3.1 Magnitudes
In Figure 5.3, the maximum and minimum horizontal stresses (H & h) are plotted as a function of depth. Only the stress measurement results within upper 1,000 m depth are of interest because of the repository design depth of approximately 680 mBGS. The diamond symbol indicates the magnitude of the maximum stress at a given horizon and the square symbol corresponds to minimum horizontal stress. The coloured symbols represent measurements from hydraulic fracturing tests, whereas the open symbol represent results obtained from overcoring tests.
Figure 5.3 shows that stress data for shallow bedrock were made up primary of overcoring measurements while virtually all of the deeper measurements were conducted using the hydrofracture technique. Overcoring tests were conducted only to depths of about 100 m except at the Norton Mine where tests were performed at the 700 m mining level (Bauer et al. 2005). There is a large scatter in both hydraulic fracture and overcoring measurements particularly in the shallow zone above 200 m and in the deeper zone below 700 m (Figure 5.3). According to (Hoek and Brown 1980), the scattering in the shallow zone could be associated with the measurement accuracy and the stress field influence due to unusual geological and topographic features. Haimson (1980, 1982) and Evans et al. (1989) conducted several studies with deep in situ stress measurement at various sites in the Appalachian and Michigan basins using the hydraulic fracturing technique. These measurements constitute most of the data below 300 m in Figure 5.3. The bulk of the measurements were from Ordovician and Silurian bedrock except the ones from South Canisteo, New York (Evans et al. 1989) where tests were conducted in Devonian bedrock to a depth of approximately 1000 m. Another study by Haimson (1978a) was conducted in a deep borehole (> 5100 m) in Gratiot County, the deepest sedimentary rock formations located in Michigan Basin. The high magnitude stress values from hydraulic fracturing tests (represented by green-diamond symbols on Figure 5.3) are determined from minimum horizontal crack opening pressure measured using elastic theory. Based on in situ stress data available at this time, a majority of measurements show both horizontal stress components exceed or are equal to the calculated stress from the weight of overburden in a zone above 700 m depth (Figure 5.3). A significant change in minimum horizontal stress magnitude to values less than overburden stresses appear at depth below this level. Based on Evans et al. (1989), this change may be an indication of the shift in stress state from a thrust regime to a strike slip regime at depth. This infers that the upper hydraulic fracturing data fails to measure the minimum horizontal stress; however, the measurements can still be inferred as lower bound values of the horizontal stress. As demonstrated in Section 5.3.2, which discusses in situ stress ratios, the minimum horizontal stress found in the field should not significantly exceed the measurements in hydraulic fracturing tests within the study area
As described above, there are only a few deep boreholes with in situ stress measurements drilled within a few hundred kilometres of the Bruce nuclear site. One of the sites is at the Darlington GS in Bowmansville, Ontario, on the north shore of Lake Ontario. There, a deep vertical borehole (UN-1) was drilled into the Precambrian basement in the 1980’s (Ontario Hydro 1978). A total of ten measurements were conducted to determine the state of in situ stress using hydraulic fracturing method (Haimson 1978a and 1978b, Ontario Hydro, 1978b). Six of these were completed in the Ordovician limestone between 45 and 208 m depth and four others in the Precambrian gneissic bedrock between 228 and 300 m depth. Based on these

Regional Geomechanics - 63 - March 2011
measurements, the minimum horizontal stresses, h, vary between 8.3 and 9.5 MPa (h /v: 1.7 to 4.2) within the Ordovician formations (75 – 208 m). In the Precambrian basement, the stress increases by about 20% and stays within a narrow range of 10.5 to 11.3 MPa (h /v: 1.4 to 1.7). The maximum horizontal stress, H, for the two rock types was found to vary between 10.6 and 15.4 MPa (H /v: 1.7 to 6.1) in the Ordovician rock, and between 17.2 and 19.6 MPa (H /v: 2.5 to 2.9) in Precambrian rock (Haimson and Lee 1980).
Figures 5.4A and 5.4B shows the stress profiles and the orientation of maximum horizontal stresses in these two major rock groups. There are no clear trends observed within the sedimentary rock formations. The variation in both maximum and minimum horizontal in situ stress magnitudes and directions suggest the decoupling of the stress regimes along the Paleozoic and Precambrian contact (Haimson and Lee 1980), with the greatest horizontal stress being carried by the Precambrian rock. A more detailed discussion of the stress orientation is presented in Section 5.3.3.
Evans et al. (1989) have conducted a total of 75 hydraulic fracturing stress measurements in three boreholes to depths of over 1,000 m at South Canisteo in western New York State to measure the in situ stresses in a Devonian age shale, sandstone and limestone sequence. This data set contributes the majority of in situ stress data from 300 m to just over 1,000 m depth shown on Figure 5.3. The minimum horizontal stresses were measured from hydraulic fracturing tests with known induced fracture trace geometries and range between 5 and 31 MPa. The maximum horizontal stress computed based on elastic theory range between 7 and 45 MPa. The results reveal general trends in the two horizontal stress magnitudes with depth despite being rather scattered below 700 m depth. The orientation of the maximum horizontal stress appears to be in an ENE direction, which was also seen at Bowmanville in the Ordovician rocks (Figure 5.4B).
Another site of interest is the Norton Mine, slightly west of Akron in Ohio, because of its similar depth and lithology to the Bruce DGR at about 680 m. In situ stress measurements were conducted recently by means of the overcoring method as part of a proposed compressed air energy storage study (Bauer et al. 2005). This study yielded average maximum and minimum horizontal stresses of 36.7 MPa and 28 MPa, respectively. Historically, a higher maximum horizontal stress was measured using the same method (H = 44.7 MPa and h = 23.4 MPa) at the southern portion of the mine in a 1960’s study (Obert 1962). The stress value is consistent with later Acres’ study (Bauer et al. 2005), where an average H of 44.6 MPa and average h of 23.2 MPa were determined using the hydraulic fracturing method, also at the southern portion of the mine. The differences are attributed to spatial variation, and the effect of the mine development. Despite the differences, the measurements in the Norton Mine provide insight into the in situ stress magnitude that one could anticipate at the repository depth. The average stress ratios based on the two overcoring measurements are 1.7 for H /v and 1.1 for h /v. It is also of interest that the measured vertical stress is about 26% larger than that calculated based on overburden weight (Bauer et al. 2005).
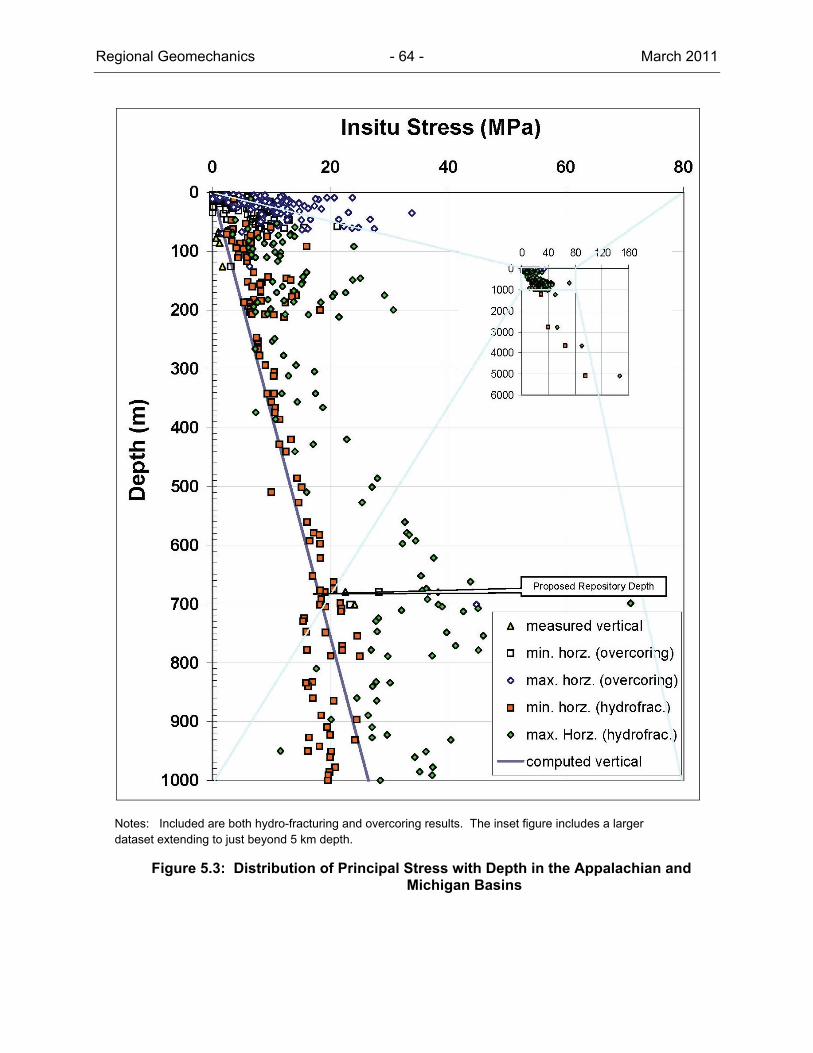
Regional Geomechanics - 64 - March 2011
Notes: Included are both hydro-fracturing and overcoring results. The inset figure includes a larger dataset extending to just beyond 5 km depth.
Figure 5.3: Distribution of Principal Stress with Depth in the Appalachian and Michigan Basins
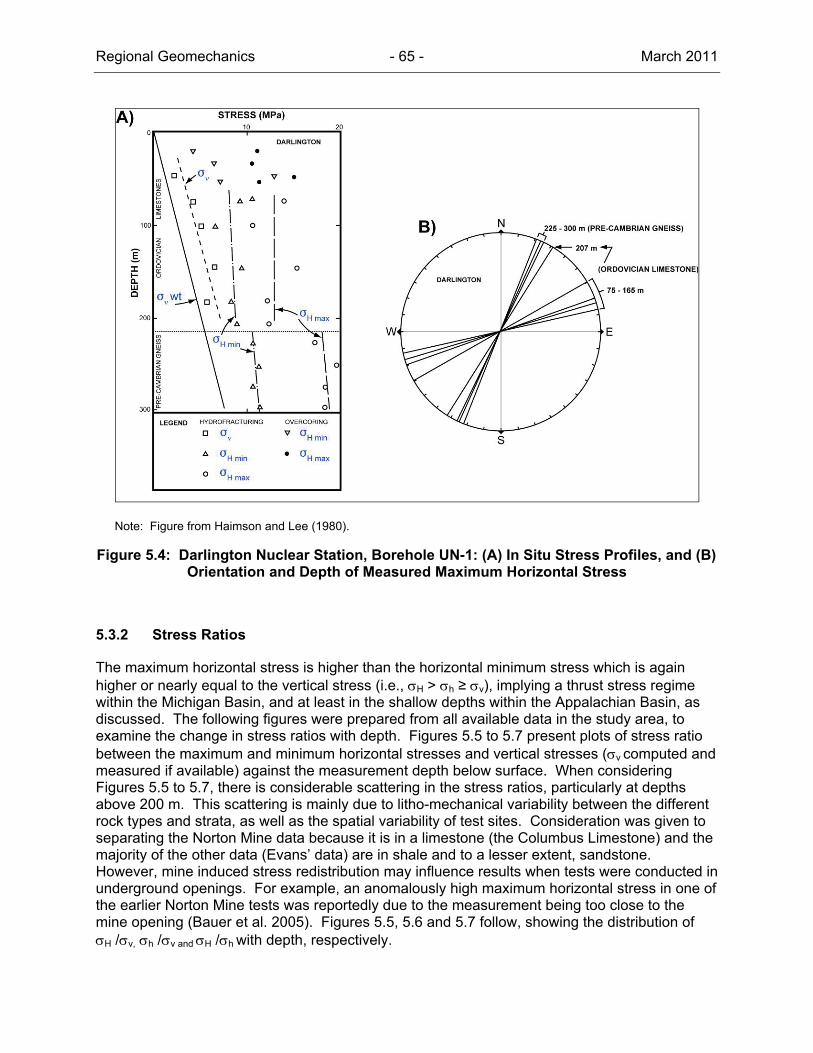
Regional Geomechanics - 65 - March 2011
Note: Figure from Haimson and Lee (1980).
Figure 5.4: Darlington Nuclear Station, Borehole UN-1: (A) In Situ Stress Profiles, and (B) Orientation and Depth of Measured Maximum Horizontal Stress
5.3.2 Stress Ratios
The maximum horizontal stress is higher than the horizontal minimum stress which is again higher or nearly equal to the vertical stress (i.e., H > h ≥ v), implying a thrust stress regime within the Michigan Basin, and at least in the shallow depths within the Appalachian Basin, as discussed. The following figures were prepared from all available data in the study area, to examine the change in stress ratios with depth. Figures 5.5 to 5.7 present plots of stress ratio between the maximum and minimum horizontal stresses and vertical stresses (v computed and measured if available) against the measurement depth below surface. When considering Figures 5.5 to 5.7, there is considerable scattering in the stress ratios, particularly at depths above 200 m. This scattering is mainly due to litho-mechanical variability between the different rock types and strata, as well as the spatial variability of test sites. Consideration was given to separating the Norton Mine data because it is in a limestone (the Columbus Limestone) and the majority of the other data (Evans’ data) are in shale and to a lesser extent, sandstone. However, mine induced stress redistribution may influence results when tests were conducted in underground openings. For example, an anomalously high maximum horizontal stress in one of the earlier Norton Mine tests was reportedly due to the measurement being too close to the mine opening (Bauer et al. 2005). Figures 5.5, 5.6 and 5.7 follow, showing the distribution of H /v, h /v and H /h with depth, respectively.

Regional Geomechanics - 66 - March 2011
The observed phenomenon of upward increase of each stress ratio at shallow depths is consistent with the observations from stress measurements in other continents (Brown and Hoek 1978). Nadan and Engelder (2009) suggest this phenomenon manifests as a result of exhumation relating to remnant stress. This thermoelastic relaxation process creates the interchange of the orientation of the two minor principal stresses between horizontal and vertical, that is, from h/v < 1 to h/v > 1. As the depth increases, the stress ratios appear more consistent and have much less variation with depth. This phenomenon was also observed by a number of researchers (Harrison et al. 2007 and Lee et al. 2006).
Analysis of the supporting data and calculated stress ratios allows an estimation of the approximate range in stress ratios at repository depth (Table 5.1). This has been done over two intervals, the first being a narrow interval of 665 to 700 m, bracketed evenly around the 680 m repository depth. The second interval is broader, from 650 to 715 m in depth, done to examine the variability of results from these depths. These results are taken from sites from across the study area and in different lithological strata, and are meant to establish an approximate range that one might expect to find at the Bruce nuclear site.
Figure 5.5: Variation of H/v Ratio with Depth Showing also the Moving Median of the Stress Ratio
0
1
2
3
4
5
6
0 200 400 600 800 1000
Depth, m
H
v
Hydrofrac. data
Overcore. Data
7 Point Moving Median

Regional Geomechanics - 67 - March 2011
Figure 5.6: Variation of h/v Ratio with Depth Showing also the Moving Median of the Stress Ratio
Figure 5.7: Variation of H/h Ratio with Depth Showing also the Moving Median of the Stress Ratio
0
1
2
3
4
5
6
0 200 400 600 800 1000
Depth, m
h
v
hydrofrac. data
overcore. Data
7 Point Moving Median
0
1
2
3
4
5
6
0 200 400 600 800 1000
Depth, m
H/
h
hydrofract. data
overcore. Data
7 Point Moving Median

Regional Geomechanics - 68 - March 2011
Table 5.1: Calculated Stress Ratios (Subdivided by Measurement Method) at Near Repository Depths
Depth Range 665 to 700 m 650 to 715 m
Type Hydrofracturing Overcoring* Hydrofracturing Overcoring
H/v 2.0 to 2.2 1.6 1.7 to 2.5 1.6 to 1.9
h/v 1.0 to 1.2 1.3 1.0 to 1.2 1.0 to 1.3
H/h 1.8 to 2.0 1.3 1.5 to 2.1 1.3 to 1.9
Note: * Only one measurement in interval.
These estimated stress ratios reveal that the hydrofracturing technique appears to predict higher stress ratios than those calculated from overcoring results. It should, however, be recognized that there are few overcoring results at this depth to fully confirm this observation.
Based on the stress ratio plots, for an assumed overburden stress of 18 MPa (= gh) at the proposed repository level, the maximum horizontal stress magnitude at 680 m is estimated to be approximately 38 MPa and the minimum horizontal stress 18 MPa. Examination of the measured data on Figure 5.3 for this horizon shows these to be reasonable estimates.
5.3.3 Orientation
The in situ measurements from the stress profile in Figure 5.3 provide a mean orientation of N74°E (~ENE) with a standard deviation of 44°. This direction is consistent with the neotectonic joint orientations (compare with Figure 3.2) within the Michigan Basin (Holst 1982). Haimson ( 1982) and Ontario Hydro (1978b) compiled regional stress orientation data for the Michigan Basin. It overwhelmingly shows that the maximum horizontal stress, in both sedimentary and shield rocks, is in a NE to ENE direction.
Examination of the stress orientation with depth in the deep borehole at the Darlington GS (Figure 5.4B) reveals that the direction of H is closely clustered around N70°E (± 7°) within the Ordovician limestone between 75 m and 185 m. However, in the Precambrian basement at that site, the stress orientation is again consistent at N23°E ± 2° (228 m – 300 m). The shift in direction of about 47° between the two rock groups, shown on Figure 5.4b, suggested a definite change in the stress field in the region (Haimson and Lee 1980). However, the direction of H measured at shallow depth near the Thorold Tunnel in Niagara Falls and other areas within the basin revealed consistency with the upper Darlington measurements at approximately N70°E (Palmer and Lo 1976). Recent measurements at 670 m depth in the Norton Mine at the northwest edge of Appalachian Basin (Bauer et al. 2005) indicated the H is also consistently oriented at N75°E.
In general, the current in situ stress regime in the Appalachian and Michigan Basins is oriented in an ENE direction and is similar to that in the North American continent as defined in the world Stress Map (Figure 5.8).
5.4 Indirect Observations – Regional
Beyond direct measurements there are many indirect observations that can be made that demonstrate the presence of in situ stresses. Pop-ups and quarry buckles are commonly seen where stress release has caused compressive failure of surficial bedrock layers. Borehole
Regional Geomechanics - 69 - March 2011
breakout occurs when the drilling of a borehole releases local in situ stresses and the borehole wall collapses in a consistent pattern. Core disking results from a relief of downhole confining pressure once core is extracted and the core breaks apart creating small discs, usually in more shaley rocks. The following section describes these to provide observational evidence of the presence of these stresses.
5.4.1 Pop-ups and Quarry Buckles
Pop-ups are low elongated anticlinal ridges formed in response to high horizontal compressive stresses, in the first few metres of the bedrock surface. They usually occur in horizontally bedded sedimentary rocks where surficial layers decouple along planes of weakness and bulge upwards leaving the rock beneath unaffected. Rutty (1993) and Jacobi et al. (2007) observed that they can occur as linear en-echelon ridges. Saul and Williams (1974) refer to them as elongated domes. White et al. (1973) refer to pop-ups as deformation structures. Wallach et al. (1993) refer to pop-ups as pressure ridges and stream anticlines. Engelder and Sbar (1977) refer to pop-ups as post glacial folds. Pop-ups are similar in appearance to today’s quarry floor buckles and are thought to form in a similar manner. Quarry floor buckles are considered to be modern features, caused by the relief of confining pressure by the removal of overlying layers of ock/overburden. Pop-ups, on the other hand, are generally considered to be older features, related to the removal of glacial ice loads at the close of the last glacial epoch some 12,000 years ago (White and Russell 1982).
In Southern Ontario pop-ups and quarry floor buckles occur on relatively flat terrain in nearly flat lying sedimentary rocks mostly of Ordovician to Middle Silurian age. White and Russell (1982) mention that there are no known occurrences of pop-ups in Devonian sedimentary rocks. However, a pop-up was recently observed in rocks of the Onondaga Formation near Lake Erie and divers working off shore in Lake Erie reported the presence of pop-ups in an area of Devonian rock (Jacobi et al. 2007). A “swarm of pop-ups” or a “pop-up field” is reported to occur on the lake bottom at the western end of Lake Ontario south of Toronto (Wallach 1989; Thomas et al. 1993; Armstrong et al. 1996; Jacobi et al. 2007). Wallach et al. (1993) show an extensive northeast trending belt of pop-up occurrence ranging from Quebec City down to northern Kentucky in a variety of rock types of various ages.
Figure 5.9 (pop-ups) and Figure 5.10 (quarry floor buckles) have been compiled from the available literature and provide lists of known pop-ups and quarry floor buckles that occur in Ontario.
Pop-ups vary in length from a few metres to a few kilometres, and are generally up to 10 m wide. Rutty (1993), shows the Cawker-Williams pop-ups to be 20 to 25 m wide. Jacobi et al. (2007), note that subsurface lake floor buckles can be up to 100 m wide. Pop-ups have a height generally ranging from 0.5 m to 4 m. Quarry floor buckles can be considered as generally smaller features than pop-ups, ranging in length from 1.5 m to 180 m, with heights of 0.1 to 1.5 m. This can be explained by the fact that they are limited in size by the boundaries of the quarry or excavation in which they occur. Once they propagate, they are not known to extend beyond the area of the quarry walls where the confining pressures persist (Adams 1982). White and Russell (1982) have observed that the orientation of floor buckles may also be constrained by the configuration of the quarry walls. A good example of such a constraint is the buckling of the invert of the Sir Adam Beck No. 1 Canal in the 1920’s, which was oriented parallel to the canal walls in a deep, narrow and linear rock excavation.

Regional Geomechanics - 70 - March 2011
Notes: Figure based on Heidbach et al. 2009. NF = normal-fault regime, SS = strike-slip regime, TF = thrust fault regime, and U= regime unknown.
Figure 5.8: Stress Map of Greater Study Area
While mapping the Paleozoic geology of the central Bruce Peninsula, Armstrong (1989, 1993) observed three pop-ups. The most southerly of these is the closest known pop-up to the DGR and occurs 1.4 km east of Lake Charles (about 67 km northeast of the Bruce nuclear site). It has a length of 600 m, a height of 1 m and an orientation of 140° and occurs in the dolostone of the Lions Head Formation of Middle Silurian age (Armstrong 1989). The other two pop-ups (Armstrong, 1993) occur just north of the above: one in the Queenston Shale (154°); and the other in the dolostone of the Fossil Hill Formation (160°).
A total of 124 measurements of the orientation (strike) of the pop-ups are presented on Figure 5.9. Fifty-nine (59) orientation measurements for the quarry buckles are similarly presented on Figure 5.10.
Figure 5.9 indicates that almost half of the pop-ups are oriented between 90° to 130°, with an average in this group of 115.7° (or ESE). Figure 5.10 for the buckles differs somewhat, indicating that a majority of the buckles are oriented between 120° to 170°, with an average in this group of 139.8° (or SE). As can be seen, the correlation between the main concentrations of pop-up and buckle orientations exhibits a noticeable difference of 24.1° (Figure 5.11). Combined orientation data for both pop-ups and buckles, available from the literature and various sources from a much larger area, was plotted by Wallach et al. (1993) and agrees with the data in Figure 5.11. Jacobi et al. (2007) have identified six pop-up orientations from 228 pop-ups observed along the bottom of western Lake Ontario. These pop-up orientations are as follows: NNE, NE, ENE, WNW, NW and NNW. Comparing these orientations to those on

Regional Geomechanics - 71 - March 2011
Figure 5.9 shows good correlation, with four key orientations being identifiable [WNW (major), NNW (minor), NNE (minor), and ENE (minor)].
Figure 5.9: Pop-ups in Southern Ontario (circular standard deviation = 79.6⁰
Adams (1989) speculated that the oldest pop-ups tended to form parallel to the margin of the retreating ice sheets after glaciation, while the youngest features were more commonly oriented in the dominant ESE-trending buckle orientation. The prominent peaks on Figures 5.9 and 5.10 may represent these two dominant orientations, while the rest of the data described as ‘minor’ orientations above, may simply be noise in the datasets.
Comparing the lake floor pop-ups of Jacobi et al. (2007) to the recent quarry floor buckles in Ontario on Figure 5.10, however, shows that there is good correlation with only three of the Jacobi pop-up orientations (NNW, NW and NE). Significantly, the most prominent WNW pop-up set (110o) is almost absent in the observed quarry floor buckle data set, which is discussed further, below.
The idea that pop-ups have formed at or after the close of the last glacial period about 12,000 years ago is prevalent (White and Russell 1982; Wallach 1989; Rutty 1993; Jacobi et al. 2007) although no one has yet been able to determine the specific date of occurrence. Wallach et al. (1993) indicate that some pop-ups may, in fact, be of modern origin. Jacobi et al. (2007) estimate the earliest set of pop-ups (trending WNW) to have formed more than 9500 years ago, based on abutting and sediment onlap relationships. In contrast, quarry floor buckles are all modern day features formed at the base of existing excavations, and as described above, are in the NW quadrant (Figure 5.10) in response to NE horizontal stress.

Regional Geomechanics - 72 - March 2011
Note: Circular standard deviation = 72.8⁰
Figure 5.10: Quarries Floor Buckles in Southern Ontario
Pop-ups and quarry floor buckles are both thought to originate by the same mechanism, by the release of high near surface horizontal compressive stresses, in the absence of a confining overburden pressure. The presence of high horizontal stresses in eastern North America has been well documented and is discussed in detail above. White and Russell (1982) present a review of the possible causes of high horizontal stresses, which include thermally induced stresses, glacial drag (glacial tectonics), the presence of swelling minerals, residual stresses due to glacial loading/unloading and post glacial rebound, and deep seated tectonic stresses.
The mechanics of pop-up formation is discussed by Roorda (1995). Rutty (1993) indicated that ice removal has a similar effect to overburden removal in promoting pop-up formation. Jacobi et al. (2007) postulate that glacio-isostatic rebound during the last glacial maximum left a stress field that generated pop-ups aligned along the rebound isobases, the direction of which differs from today’s in situ stress regime. In the millennia following the last glacial maximum, the horizontal strain produced by glacial rebound is thought to have shifted in direction as evidenced by the tilting of the western part of the Lake Ontario basin. This resulted in pop-ups of differing orientations, and as time progressed tectonic stresses gained influence (over post glacial rebound) on pop-up orientations to become the dominant force today (Jacobi et al. 2007). This view is supported by the data presented in Figures 5.9 and 5.10, where the orientations of quarry floor buckles in Figure 5.10 represent the current in situ tectonic stress regime and noticeably differ from that of the majority of pop-up orientations shown in Figure 5.9, which represent surficial stresses dominated by the effects of post glacial rebound. Based on the above postulation, the large majority of pop-ups formed during or after the last glacial maximum, are therefore largely a result of stresses induced by glacial unloading and postglacial rebound.

Regional Geomechanics - 73 - March 2011
Figure 5.11: A Combination of Quarries Floor Buckles and Pop-ups in Southern Ontario
Pop-ups in the Balsam Lake area display a central vertical fracture along their crests and are parallel to a systematic joint set in the bedrock, which led Rutty (1993) to conclude that the pop-ups appear to have nucleated on pre-existing favourably oriented joints normal to the maximum horizontal stress. Jacobi et al. (2007) also arrived at the same conclusion, noting several correlations with existing joints. No such correlation is known to have been made for quarry floor buckles, although Adams (1982) attempts to relate minor faulting along the walls of the McFarland quarry near Ottawa as having a possible influence on the location and direction of some pop-ups.
5.4.2 Borehole Breakouts
In addition to the quarry floor buckles and pop-ups, breakouts in boreholes can also be a useful tool to extract information related to the in situ stress state of the region. Borehole breakouts are diametrical elongations of axial borehole geometry as a result of compressive stress failure of borehole wall in a high stress field. This phenomenon is commonly detected by studying televiewer or caliper logs from routine downhole geophysical surveys. From the breakout data, the orientation of in situ stress trajectories and a possible bounding constraint on the stress magnitude can be obtained. Lithology and rock strength strongly influence the formation of a breakout in drill holes.

Regional Geomechanics - 74 - March 2011
Note: Figure modified from Yassir and Dusseault (1992).
Figure 5.12: Maximum In Situ Stress Orientation from Borehole Breakout Data
In the early 1990s, OPG conducted a review on the breakouts of wellbores in southwestern Ontario and Lake Erie observed between 1969 and 1987 (Figure 5.12; Yassir and Dusseault 1992). Seventeen wells revealed breakout in the Cambrian to the Lower Devonian age formations. The majority of the breakout occurred in the Middle Silurian to Lower Devonian carbonates and shales. A total of 92 observations were made, and there appeared to be no correlation between the length of breakout and lithology.
5.4.3 Core Disking
The presence of high in situ stresses can be gauged from observation of core disking6. Core recovered from great depth tends to break under relief from a high in situ stress environment. The thinner the discs, the higher the in situ stress magnitude. This phenomenon is closely associated with the borehole breakouts previously mentioned. The formation of discs can be strongly influenced by the material property of the media and drilling technique
6 There are two types of core disking. Mechanical core disking is a stress induced tensile failure phenomenon resulting in the spontaneous creation of disks as the rock core is being drilled, usually from great depth. Geologic core disking is the relatively slower formation of core disks parallel to bedding caused by physio-chemical changes initiated by moisture/temperature changes in the core after extraction.
0
2
4
6
8
10
0 ‐ 9
10‐19
20‐29
30‐39
40‐49
50‐59
60‐69
70‐79
80‐89
90‐99
100‐109
110‐119
120‐129
130‐139
140‐149
150‐159
160‐169
170‐179
Orientation of Horizontal Stress (Az)
Number of Observations

Regional Geomechanics - 75 - March 2011
(Stacey and Wesseloo 2002). The fissility of shale can sometimes be mistaken for mechanical disking.
Figure 5.13 is a photograph showing typical disking of shale core retrieved near the Collingwood/Cobourg contact (899.5 m) in Well T006045 near Chatham, north of Lake Erie. The observations are also in shale above the Cobourg Formation at about 849.1 m (Ontario Geological Survey 2006). These observations confirm that core disking tends to occur in drill core recovered from deep mines and wells, Engelder (1993). Because of the symmetry of the rock discs in these cores, one could infer that the wells were probably drilled vertically along the direction of the minimum principal stress of the stress field in both locations.
5.5 Summary
Most of the available in situ stress data in the Paleozoic Rocks have been obtained from over 20 sites in the lower Great Lakes Region. Measurements have primarily been made by the overcoring method generally at depths of less than 70 m (plus several in the Norton Mine at about 700 m), or by hydraulic fracturing to depths of 5100 m in Michigan. They were made in various rock types such as shale, carbonate and sandstone. At Darlington GS measurements were made in the Ordovician and Precambrian rocks. Within each rock group, the stress gradients for the major and minor horizontal stresses appear very consistent.
Based on the foregoing discussion and with reference to Figure 5.3, the maximum and minimum horizontal stresses increase with depth. At 228 to 300 m depth at Darlington these stresses vary between 17.2 and 19.6 MPa, and 10.5 to 11.3 MPa, respectively. In the Norton Mine (where the lithology is similar to the Bruce nuclear site) at a depth of about 670 m, the average maximum horizontal stress was 36.7 MPa and the average minimum horizontal stress was 28 MPa, both measured by overcoring. The measurements made earlier at that site by hydrofracturing exhibited a wider spread: 44.7 MPa and 23 MPa, respectively. The differences are likely attributed to different stress paths of the test and the effect of mine development, however the stresses clearly increase with depth.
The maximum stress is higher than the horizontal minimum stress which is again higher or nearly equal to the vertical stress, implying an overthrust stress regime within the Appalachian and Michigan basins. These results also provide insight into the in situ stress magnitude that might be anticipated at the Bruce nuclear site at 680 m below ground surface. The maximum horizontal stress would be 38 MPa and the minimum horizontal stress would be 18 MPa. The observed scatter of data (Figure 5.3) may mean values greater than these might be found. Certainly the uncertainty with the hydrofracturing method, which typically has been used at greater depths, for the reasons described in Section 5.1.1, will contribute to much variability around these estimates. For the same reasons there is variability in stress ratios calculated from the regional data. At the repository depth H/v will vary from 1.7 to 2.5; h/v from 1.0 to 1.2 and H/h from 1.5 to 2.1. The orientation of the current in situ stress regime in the Appalachian and Michigan basins is in the ENE direction (Figure 5.8). There are several observations that corroborate these results. Figure 5.11 illustrates a summary of the distribution of orientation data for a combination of Quarry Floor Buckles and Pop-ups. The majority of these data show an orientation in the SE quadrant, which is consistent with a maximum horizontal stress being oriented in the NE quadrant.

Regional Geomechanics - 76 - March 2011
Notes: Photo from OGS (2006). Section showing is contact between Collingwood and Cobourg formations at from 895 to 908 mBGS
Figure 5.13: Core Disking from Oil/Gas Well in Chatham, Ontario

Regional Geomechanics - 77 - March 2011
6. CONCLUSIONS
This study on the regional geomechanical framework has compiled and evaluated available regional information related to:
The presence and orientation of joints in the bedrock; Geomechanical rock properties; Geomechanical rock mass properties, including sub-surface excavation experience in
similar rock formations, and; Existing in situ stress in the bedrock.
The study area encompassed southern Ontario, and the adjacent Great Lake States of New York, Ohio, Pennsylvania and Michigan. Information contained in the study provides an insight on the regional system and the long-term performance of the DGR. The following is a summary of the findings of this study:
1. The region is characterized by predictable horizontally layered and undeformed sedimentary bedrock of the Paleozoic Era, comprised predominantly of dolostone, limestone and shale.
2. Regional jointing data identify the presence of systematic joint sets that are locally consistent. These joint sets likely occur at depth but are expected to be closed and/or sealed. This finding is consistent with the measurement of low rock mass permeabilities and elevated brine (300 g/L) concentrations observed within the Ordovician sequence.
3. Jointing orientation at depth will influence DGR design for cavern stability, and may vary from that found at surface.
4. The strength and geomechanical properties determined on a regional basis are favourable in the limestone of the Cobourg Formation. Comparison of reported regional and - Bruce nuclear site uniaxial compressive strength (UCS) data indicate that beneath Bruce the Cobourg formation is significantly stronger than the regional mean.
5. Existing underground structures at Darlington, Wesleyville, Niagara Falls and other locations in southern Ontario have been successfully excavated, albeit at shallower depths, in the Ordovician bedrock relevant to the DGR concept. These cases demonstrate that stable and dry openings can be created in Ordovician argillaceous limestone and shale.
6. The magnitude of compressive in situ stresses is generally predictable with depth using regional information. The current maximum horizontal in situ stress in the region is oriented in an ENE direction.
7. The analysis of the regional in situ stress data allows an estimate of the approximate range of stress ratios at repository depth beneath the Bruce nuclear site. At the repository horizon H /v will apparently vary from 1.7 to 2.5; h /v from 1.0 to 1.2; and H/h from 1.5 to 2.1.

Regional Geomechanics - 78 - March 2011
7. REFERENCES
Acres Bechtel Canada. 1993. Definition Engineering Phase 2, Geotechnical Investigations and Evaluation, Volume 1 – Investigation Report. Acres Bechtel Canada report for Ontario Hydro NAW130-P40-10120-0005-00. Niagara Falls, Canada.
Adams, J. and J.B. Bell. 1991. Crustal stress in Canada. In: Slemmons, D.B., E.R. Engdahl, M.D. Zoback and D.D Backwell (Eds.). Neotectonics of North America, Decade map volume to accompany the neotectonic maps, part of the Continent-scale maps of North America, Geological Society of America, 367–386.
Adams, J. 1982. Stress-relief buckles in the McFarland quarry, Ottawa. Canadian Journal of Earth Sciences 19, 1883-1887. Ottawa, Canada.
Adams, J. 1989. Postglacial faulting in eastern Canada: nature, origin and seismic hazard implications. Tectonophysics 163, 323-331.
Adams, J. 1995. Canadian Crustal Stress Data – A Compilation to 1994. Geological Survey of Canada. Open File Report 3122.
AECOM and ITASCA CANADA. 2011. Regional Geology – Southern Ontario. AECOM Canada Ltd. and Itasca Consulting Canada, Inc. Report for the Nuclear Waste Management Organization NWMO DGR-TR-2011-15 R000. Toronto, Canada.
Anderson, E.M. 1951. The Dynamics of Faulting. Oliver and Boyd, Edinburgh.
Andjelkovic, D. and A.R. Cruden. 1999. Relationships between fractures in Paleozoic cover rocks and structures in the Pre-Cambrian basement, south-central Ontario: in Summary of Field Work and Other Activities 1998. Ontario Geological Survey Miscellaneous Paper 169, 274-280.
Andjelkovic, D., A.R. Cruden and D.K. Armstrong. 1997. Joint orientation trajectories in south-central Ontario, Summary of Field Work and Other Activities 1997. Ontario Geological Survey, Miscellaneous Paper 168, 127-133.
Andjelkovic, D., A.R. Cruden, and D.K. Armstrong. 1996. Structural geology of south-central Ontario: Preliminary results of joint mapping studies. Ontario Geologic Survey Miscellaneous Paper 166, 103-107.
Armstrong, D.K. and T.R. Carter. 2006. An Updated Guide to the Subsurface Paleozoic Stratigraphy of Southern Ontario. Ontario Geological Survey, Open File Report 6191.
Armstrong, D.K. 1989. Project Unit 88-2. Paleozoic geology of the southern Bruce Peninsula, Summary of Field Work and Other Activities. Ontario Geological Survey Miscellaneous Paper 146, 222- 227.
Armstrong, D.K. 1993. Paleozoic geology of the central Bruce Peninsula. Ontario Geological Survey Open File Report 5856.

Regional Geomechanics - 79 - March 2011
Armstrong, D.K., C.F.M. Lewis, J.R. Bowlby, R.D. Jacobi and A.A. Mohajer. 1996. Submersible Investigation of Linear Bedrock Features on the Floor of Western Lake Ontario: A Progress Report; in Summary of Field Work and Other Activities 1996. Ontario Geological Survey Miscellaneous Paper 166, 108-109.
Barton, N.R., R. Lien, and J. Lunde. 1974. Engineering classification of rock masses for the design of tunnel support. Rock Mechanics 6(4), 189-239.
Bauer, S.J., D.E. Munson, M.P. Hardy, J. Barrix and B. McGunegle. 2005. In situ stress measurements and their implications in a deep Ohio mine. Proceedings of the 40th US Symosium on Rock Mechanics for Energy, Mineral, Infrastructure Development for Northern Regions, ARMA, Anchorage, Alaska, USA.
Beck Diversion Group. 1998. Sir Adam Beck Additional Diversion Project, Tender Documents, Volume 3 – Geotechnical Baseline Report. Addendum 1. OPG NAW130-T4D-29230-0001-00.
Bieniawski, Z.T. 1976. Rock mass classification in rock engineering. In: Exploration for Rock Engineering, Proceedings of the Symposium 1, 97-106. Cape Town, South Africa.
Bowen, C.F.P., F.I. Hewson, D.H. MacDonald and R.G. Tanner. 1976. Rock squeeze at Thorold Tunnel. Canadian Geotechnical Journal 13, 111-126.
Brown, E.T. and E. Hoek, 1978. Trends in relationships between measured in situ stresses and depth. International Journal of Rock Mechanics and Mineral Science 15, No.4, 211-215.
Carter, T.R. 1993. Oil and gas accumulations and basement structures in southern Ontario, Canada. Ontario Petroleum Institute, Annual Conference Proceedings, v.32.
Carter, T.R., R.A. Trevail and R.M. Easton. 1996. Basement controls on some hydrocarbon traps in southern Ontario, Canada. In: Pluijm, B.A. and P.A. Catacosinos (Eds.). Basement and Basins of North America. Geologic Society of America, Special Paper 308, 95-107.
Cartwright, P.B. 1997. A review of recent in situ stress measurements in United Kingdom coal measures strata. In: K. Sugawara, K. and Y. Obara (Eds.). Proceedings International Symposium on Rock Stress, Kumanoto 469-474. A.A. Balkema, Rotterdam.
Cliffs Minerals, Inc. 1982. Analysis of the Devonian Shales in the Appalachian Basin, U.S. Department of Energy Contract DE-AS21-80MC14693, Final Report, Springfield Clearing House, Washington, D.C.
Dames & Moore. 1978. Nine Mile Point, Nuclear Station Unit 2, Geologic Investigation, Vol. III Rock Stress.
Damjanac, B., M. Board, M. Lin, D. Kicker and J. Leem. 2007. Mechanical degradation of emplacement drifts at Yucca Mountain – A modelling case study. International Journal of Rock Mechanics & Mining Sciences 33, 368-399.

Regional Geomechanics - 80 - March 2011
Dellapenna, T.M. 1991. Sedimentalogical, structural, and organic geochemical controls on natural gas occurrences in the Antrim Formation in Otseho County Michigan. M.Sc. Thesis - Western Michigan University, USA.
Dineva, S., D. Eaton, and R. Mereu. 2004. Seismicity of the southern Great Lakes: Revised earthquake hypocentres and possible tectonic controls. Bulletin of the Seismological Society of America 94, 1902-1918.
Easton, R.M. and T.R. Carter. 1995. Geology of the Precambrian basement beneath the Paleozoic of southwestern Ontario. Basement Tectonics 10, 221-264.
Engelder, T. and M.L. Sbar. 1977. The relationship between in situ strain relaxation and outcrop fractures in the Potsdam sandstone, Alexander Bay, New York. Pure and Applied Geophysics 115, 41-55.
Engelder, T. and P. Geiser. 1980. On the use of regional joint sets as trajectories of paleostress fields during the development of the Appalachian plateau, New York. Journal of Geophysical Research 85(B11), 6319-6341.
Engelder, T. 1982. Is there a genetic relationship between selected regional joints and contemporary stress within the lithosphere of North America? Tectonics 1(2), 161-177.
Engelder, T. 1993. Stress Regimes on the Lithosphere, Princeton University Press.
Evans, K. and T. Engelder. 1989. Some problems in estimating horizontal stress magnitudes in “thrust” regimes. Int. Journal of Rock Mechanics and Mining Science 26(6), 647-660.
Evans, K.F., T. Engelder and R.A. Plumb. 1989. Appalachian stress study. 1. A detailed description of in situ stress variations in Devonian shales of the Appalachian plateau. Journal of Geophysical Research 94(B6), 7129-7154.
Evans, M.A. 1994. Joints and decollement zones in Middle Devonian shales; evidence for multiple deformation events in the central Appalachian Plateau. Geological Society of America Bulletin 106(4), 447-460.
Eyles, N. and A.E. Scheidegger. 1999. Neotectonic jointing control on Lake Ontario shoreline orientation at Scarborough, Ontario. Geoscience Canada 26(1), 27-31.
Eyles, N., E. Arnaud, A.E. Scheidegger and C.H. Eyles. 1997. Bedrock jointing and geomorphology in southwestern Ontario, Canada: an example of tectonic predesign. Geomorphology 19(1-2), 17-34.
Franklin Trow Associates. 1979. Wesleyville GS, Underground Oil Storage Access Tunnel Testing and Monitoring First Progress Report. Franklin Trow Associates Report F240/1. Toronto, Canada.
Franklin, J.A. and M.B. Dusseault. 1989. Rock Engineering, McGraw-Hill Publishing Co.
Franklin, J.A. and R. Chandra. 1972. The slake-durability test. Internal Journal of Rock Mechanics and Mining Sciences 9, 325-341.

Regional Geomechanics - 81 - March 2011
Franklin, J.A. 1983. Evaluation of Shales on Construction Projects: An Ontario Shale Rating System, Research Report RR229, Ontario Ministry of Transportation and Communication.
Gartner Lee Limited. 1996. Regional Geologic Model: Smithville Phase IV. Prepared for: Smithville Phase IV Bedrock Remediation Program. GLL 95-160.
GOLDER. 2003. LLW Geotechnical Feasibility Study, Western Waste Management Facility, Bruce Site, Tiverton, Ontario. Golder Associates Ltd. report to Municipality of Kincardine and Ontario Power Generation. Toronto, Canada.
Gorman, J. 1976. Geotechnical problems associated with hydraulic stations in North America, Acres Geotechnical Seminar, May 7-8, 1976. Niagara Falls, Canada.
Gratten-Bellew, P.E. and W.J. Eden. 1975. Concrete deterioration and floor heave due to biogeochemical weathering of underlying shale. Canadian Geotechnical Journal 12, 323-378.
Gross, M., T. Engelder and S. Poulson. 1991. Veins in the Lockport Dolomite: Evidence for an Acadian fluid circulation system. Geology 20, 971-974.
Gross, M.R. and T. Engelder. 1991. A case for neotectonic joints along the Niagara escarpment. Tectonics 10(3), 631-641.
GSC. 1995. The Canadian Crustal Stress Database - A Compilation to 1994. Geological Survey of Canada Open File 3122. Ottawa, Canada.
Haimson, B.C. and C.F. Lee. 1980. Hydrofracturing stress determinations at Darlington, Ontario. 13th Canadian Rock Mechanics Symposium, CIM Special Vol. 32, p.42-50.
Haimson, B.C. and F.H. Cornet. 2003. ISRM Suggested Methods for Rock Stress Estimation, Part 3: Hydraulic Fracturing (HF) and/or Hydraulic Testing of Pre-existing Fractures (HTPF). Rock Stress Estimation Special Issue. International Journal of Rock Mechanics and Mineral Science and Geomechanics 40, 1011-1020.
Haimson, B.C. 1978a. Michigan basin deep borehole. Journal of Geophysical Research, 5857-5863.
Haimson, B.C. 1978b. The hydrofracturing stress measuring method and recent field results. International Journal of Rock Mechanics and Mineral Science and Geomechanics Abstracts 15, 167-178.
Haimson, B.C. 1980. Near surface and deep hydrofracturing stress measurements in the Waterloo Quartzite. International Journal of Rock Mechanics and Mineral Science and Geomechanics 17, 81-88.
Haimson, B.C. 1982. Comparing hydrofracturing deep measurement with overcoring near-surface tests in three quarries in western Ohio. Proceedings 23rd US Symposium on Rock Mechanics, Mining Engineer, N.Y. 190-202.

Regional Geomechanics - 82 - March 2011
Haimson, B.C. and E.J. Stahl. 1969. Hydraulic fracturing and the extraction of minerals through wells. Proceedings of the 3rd Symposium on Salt, The Northern Ohio Geological Society, Cleveland, Ohio, USA.
Hamblin, W.K. 1958. The Cambrian Sandstones of Northern Michigan. State of Michigan Department of Conservation – Geological Survey Division. Ph.D. Thesis, University of Michigan, USA.
Hanks, T. and H. Kanamori. 1979. A moment magnitude scale. Journal of Geophysical Research 84, 2348-2350.
Harrison J.P, J.A. Hudson and J.N. Carter. 2007. Is there a relation between the in situ principal stress magnitudes in rock masses? Proceedings 1st Canada-U.S. Rock Mechanics Symposium, Vancouver, 675-682.
Heidbach, O., M. Tingay, A. Barth, J. Reinecker, D. Kurfess and B. Müller. 2008. The World Stress Map Based on the Database Release 2008, Equatorial Scale 1:46,000,000. Commission for the Geological Map of the World. Paris, France.
Hill, D.G., T.E. Lombardi and J.P. Martin. 2002. Fractured shale gas potential in New York. Annual Conference - Ontario Petroleum Institute, Volume 41. Niagara Falls, Canada.
Hoek, E., and E.T. Brown. 1980. Underground Excavation in Rock. The Institution of Mining and Metallurgy, London.
Hoek, E., P.K. Kaiser and W.F. Bawden. 1995. Rock Support for Underground Excavations in Hard Rock. A.A. Balkema, Rotterdam.
Hogg, A. 1959. Some engineering studies of rock movement in Niagara area. Engineering Geology Case Histories, No. 3, Geological Society of America.
Holst, T.B. and G.R. Foote. 1981. Joint Orientation in Devonian Rocks in the Northern Portion of the Lower Peninsula of Michigan. Geological Society of America Bulletin part 1, Volume 92, 85-93.
Holst, T.B. 1982. Regional jointing in the northern Michigan basin. Geology 10, 273-277.
Howell, P.D. and B.A. van der Pluijm. 1999. Structural Sequence and Styles of Subsidence in the Michigan Basin. GSA Bulletin 111(7), 974-991.
Hudson J.A. and F.H Cornet. 2003. Special Issue on Rock Stress Estimation, International Journal of Rock Mechanics and Mining Sciences 36, 957-1276.
INTERA. 2006. OPG’s Deep Geologic Repository for Low and Intermediate Level Waste, Geoscientific Characterization Plan. Intera Engineering Ltd. report for Ontario Power Generation OPG 00216-REP-03902-00002-R00. Ottawa, Canada.
IJRMMS 2003. International Journal of Rock Mechanics and Mining Science, Volume 40.
Regional Geomechanics - 83 - March 2011
Ito, T., K. Evans, K. Kawai and K. Hayashi. 1999. Hydraulic fracture reopening pressure and the estimation of maximum horizontal stress. International Journal of Rock Mechanics and Mining Sciences 36, 811-826.
Jacobi, R.D., C.F.M. Lewis, D.K. Armstrong and S.M. Blasco. 2007. Popup fields in Lake Ontario south of Toronto, Canada: Indicators of late glacial and post glacial strain. The Geological Society of America, Special Paper 425, 129-147.
Johnston, A. and L. Kanter. 1990. Earthquakes in stable continental crust. Scientific American, March 1990, 68-75.
Johnston, A. 1987. Suppression of earthquakes by large continental ice sheets. Nature 330, 467-469.
Johnston, A., K. Coppersmith, L. Kanter and C. Cornell. 1994. The Earthquakes of Stable Continental Regions. Volume 1. Electric Power Research Institute Report TR-102261-V1. Palo Alto, California, USA.
Kramer, G.J.E. and I.D. Moore. 2005. Finite element modelling of tunnels in swelling rock. K.Y. Lo Symposium, University of Western Ontario, London, Canada, July 7-8, 2005.
Lam, T.M., C.D. Martin and D. McCreath. 2007. Characterizing the geomechanics properties of the sedimentary rocks for DGR excavations. Canadian Geotechnical Conference, Ottawa, Canada.
Larson, K., J. Freymueller and S. Philipsen. 1997. Global plate velocities from the Global Positioning System. Journal of Geophysical Research 102(B5), 9961-9981.
Lee, M.F., L.J. Mollison, P. Mikula and M. Pascoe. 2006. In situ rock stress measurements in western Australia’s Yilgarn Craton. In: Lu, M., C.C. Li, H. Kjorholt and H. Dahle (Eds.), Proceedings of International Symposium on In Situ Rock Stress, p.35–42. A.A. Balkema, Rotterdam.
Lee, C.F. and K.Y. Lo. 1976. Rock squeeze study of the deep excavations at Niagara Falls. Proceedings of the ASCE Specialty Conference, Rock Engineering for Foundations and Slopes, University of Colorado, Boulder, Colorado, USA p. 116-140.
Lee, C.F. 1981. In situ stress measurements in southern Ontario. Proc. 22nd US Symposium. on Rock Mechanics. Rock Mechanics from Research to Application. Massachusetts. 465-472.
Leighton, M.W. 1996. Interior cratonic basins: a record of regional tectonic influences. In: van der Pluijm, B.A. and P.A Catacosinos (Eds.), Basement and Basins of North America, Geological Society of America Special Paper 308, 77-93.
Lindner, E.N. 1985. In situ stress indications around Lake Ontario, 26th US Symposium on Rock Mechanics, 575-590.
Lo, K.Y. and B. Lukajic. 1984. Predicted and measured stresses and displacements around the Darlington Intake Tunnel. Canadian Geotechnical Journal 21, 147-165.
Regional Geomechanics - 84 - March 2011
Lo, K.Y. and C.M.K. Yuen. 1981. Design of tunnel lining in rock for long-term time effects. Canadian Geotechnical Journal 18(1), 24-39.
Lo, K.Y. 1978. Regional distribution of in situ horizontal stresses in rocks of southern Ontario. Canadian Geotechnical Journal 15, 371-381.
Lo, K.Y. 1989. Recent advances in design and evaluation of performance of underground structures in rocks. Tunneling and Underground Space Technology 4(2), 171-183.
Lo, K.Y. and M. Hori. 1979. Deformation and strength properties of some rocks in Southern Ontario. Canadian Geotechnical Journal 16(1), 108-120.
Lo, K.Y., C.F. Lee, J.H.L. Palmer and R.M. Quigley. 1975. Stress Relief and Time-Dependent Deformations of Rocks in Southern Ontario. Final Report to National Research Council of Canada, Special Project S-7307.
Lo, K.Y., R.S.C. Wai, J.H.L. Palmer and R.M. Quigley. 1978. Time-dependent deformation of shaly rocks in Southern Ontario. Canadian Geotechnical Journal 15, 537-547.
Martin, C.D. and G.W. Lanyon. 2003. Measurement of in situ stress in weak rocks at Mont Terri Rock Laboratory, Switzerland. International Journal of Rock Mechanics and Mining Sciences 40, 1077–1088.
Martin, C.D. 2007. Quantifying in situ stress magnitudes and orientations for Forsmark stage 2.2, SKB R-07-26.
Martin, R.J., J.S. Noel, P.J. Boyd and R.H. Price. 1997. Creep and static fatigue of welded tuff from Yucca Mountain, Nevada. International Journal of Rock Mechanics and Mining Sciences 34(3/4), 382.
Mazurek, M. 2004. Long-Term Used Nuclear Fuel Waste Management – Geoscientific Review of the Sedimentary Sequence in Southern Ontario. In: NWMO Background Papers. Prepared for: Ontario Power Generation. Technical Report 04-01.
Menzies, J. and E.M. Taylor. 1998. Urban Geology of St. Catharines-Niagara Falls, Region Niagara; Urban Geology of Canadian Cities, Geologic Association of Canada Special Paper 42, 287-321.
Miller, J.F. 1996. Structural Geology of the Ohio Shale. M.Sc. Thesis, Ohio State University, USA.
Mitchell, F. 2007. Structural Analysis of Brittle Deformation Features along Grenvillian Shear Zones in Southeastern Ontario. M.Sc. Thesis, Queens University, Canada.
Mitchell, F.M., L. Godin and G.R. Olivo. 2006. Multiple brittle deformation events recorded along Grenvillian shear zones: Implications for seismic risk. Annual Continental Tectonics Group Workshop, Orillia, Ontario.
Nadan B.J. and T. Engelder. 2009. Microcracks in New England granitoids: A record of thermoelastic relaxation during exhumation of intracontinental crust. Geological Society of America Bulletin 121(1-2), 80-99.
Regional Geomechanics - 85 - March 2011
Obert, L. 1962. In Situ Determination of Stress in Rock. Mining Engineering, 51-58.
Ontario Geological Survey. 1991. Bedrock geology of Ontario, southern sheet. Ontario Geological Survey, map 2544, scale 1:1,000,000.
Ontario Hydro. 1975. Wesleyville Generating Station - Underground Oil Storage Rock Testing Program, Ontario Hydro Research Division Report 75-521-H. Toronto, Canada.
Ontario Hydro. 1978a. Underground Nuclear Power Station Study. Borehole UN-1. Geotechnical Investigation. Ontario Hydro Report 78230. Toronto, Canada.
Ontario Hydro. 1978b . Underground Nuclear Power Station Study, Hydrofracturing Stress Measurements, Hole UN-1, Darlington GS, Ontario Hydro Report 78250. Toronto, Canada.
Ontario Hydro. 1979. Darlington GS - St Mary's Cement Site Rock Core Testing Program Results. Ontario Hydro Report 78-420-H. Toronto, Canada.
Ontario Hydro . 1981. Ontario Hydro, Darlington GS ‘A’, Rock Stress Measurements: Report 3, Evaluation of Regional Stress Condition. Ontario Hydro Report 81282. Toronto, Canada.
Ontario Hydro. 1983. In Situ Stress Measurements at the Dufferin Quarry. Ontario Hydro Report 83-376-K. Toronto, Canada.
Ontario Hydro. 1985. Darlington GS “A” Borehole UN-2 Geological Investigation. Ontario Hydro Report 85174, OPG NK38-REP-D1279031. Toronto, Canada.
Ontario Hydro. 1988. Roblindale Quarry In Situ Stress Measurements - Phase 2. Ontario Hydro Report 88-113-P. Toronto, Canada.
Ontario Hydro. 1989a. Frankford Generating Station, Condition Survey (1989), QC5-02115-0001-rep. Toronto, Canada.
Ontario Hydro. 1989b. Seymour Generating Station, Condition Survey (1989), QC2-20001-0002-rep. Toronto, Canada.
Ontario Hydro. 1991. Niagara River Hydroelectric Development. Definition Phase Geotechnical Investigations and Evaluation. Ontario Hydro Report 91150. Volume 1 to 5. Toronto, Canada.
Ontario Hydro. 1993. Lakefield GS - Otonabee River, Evaluation of Strength Parameters. Ontario Hydro Internal Memorandum DSP 08410.1-71.0305.
OPG. 2000. Long-Term Loading Tests on Saturated Granite and Granodiorite. Ontario Power Generation Report 06819-REP-01300-10061-R00. Toronto, Canada.
OPG. 2007a. Technical Memorandum on Bruce Peninsula Joint Measurements provided by Derek Armstrong of Ontario Geological Survey. Ontario Power Generation Memo No. 00261(LI)-03921-P. Toronto, Canada.

Regional Geomechanics - 86 - March 2011
OPG. 2007b. Technical Memorandum on Inverhuron Park Joint Measurement by B. P. Ontario Hydro. Ontario Power Generation Memo No. 00261(LI)-03921-P. Toronto, Canada.
Palmer, J.H.L. and K.Y. Lo. 1976. In situ stress measurements in some near-surface rock formations - Thorold, Ontario. Canadian Geotechnical Journal 13(1), 1-7.
Peltier, W.R. 2011. Long-Term Climate Change. Report for Nuclear Waste Management Organization Report NWMO DGR-TR-2011-14 R000. Toronto, Canada.
Prouty, C.E. 1976. Michigan Basin – A wrenching deformation model?; Abstracts with Programs. Geological Society of America Vol.8 No.4, p.505.
Prouty, C. E. 1983. The tectonic development of the Michigan Basin infrastructures. In: Kimmel, R.E. (Ed.), Tectonics, Structure, and Karst in Northern Lower Michigan: Michigan Basin Geological Society, 193 Field Conference, 36-81.
Reinecker, J., B. Sperner, B. Tingay and F. Wenzel. 2004. Stress maps in a minute: The 2004 World Stress Map. Release. Eos Transactions 85(49), 521-529.
Roorda, J. 1995. The mechanics of a pop-up: a stress relief phenomenon. Canadian Geotechnical Journal 32, 368-373.
Rutqvist, J., O. Stephansson and C.F. Tsang. 2000. Uncertainty in estimate of maximum principal stress from hydraulic fracturing due to the presence of the induced fractures. International Journal of Rock Mechanics and Mining Science 37, 107-120.
Rutty, A.L. 1993. The Basement Fracture Pattern of Southern Ontario: A Tectonic Interpretation Based on Landsat TM Imagery, Air Photos and Field Data. M.Sc. Thesis, University of Toronto, Canada.
Sanford, B.V., F. J. Thompson and G.H. McFall. 1984. Phanerozoic and recent tectonic movements in the Canadian Shield and their significance to the Nuclear Fuel Waste Management Program. AECL Report 7822, 73-96.
Sanford, B.V., F.J. Thompson and G.H. McFall. 1985. Plate tectonics -- a possible controlling mechanism in the development of hydrocarbon traps in southwestern Ontario. Bulletin of Canadian Petroleum Geology 33, 52-71.
Saul, V.A. and D.A. Williams. 1974. Evidence for recent deformation in the Montreal area. Canadian Journal of Earth Sciences 11(12), 1621-1624.
Schmidtke, R.H. and E.Z. Lajtai. 1985. The long-term strength of Lac du Bonnet Granite. International Journal of Rock Mechanics and Mining Sciences 22(6), 461-465.
Shilts, W.W., M. Rappol and A. Blais. 1992. Evidence of late and postglacial seismic activity in the Temiscouata-Madawaska Valley, Québec-New Brunswick, Canada. Canadian Journal of Earth Sciences 29, 1043–1069.

Regional Geomechanics - 87 - March 2011
Sjöberg, J., R. Christiansson and J.A. Hudson. 2003. ISRM Suggested Methods for Rock Stress Estimation Part 2: Overcoring Methods. Rock Stress Estimation Special Issue. International Journal of Rock Mechanics and Mining Science and Geomechanics 40, 999-1011.
Stacey, T.R. and J. Wesseloo. 2002. Application of Indirect Stress Measurement Techniques (non strain gauge based technology) to Quantify Stress Environments in Mines, Safety in Mine Research Advisory Committee, GAP 858.
Stella, G.F., S. Stein, T.H. Dixon, M. Craymer, T.S. James, S. Mazzotti and R.K. Dokka. 2007. Observation of glacial isostatic adjustment in ‘‘stable’’ North America with GPS. Geophysical Research Letters, 34, L02306.
Sterling, S. 2010. Drilling Logging and Sampling of DGR-1 and DGR-2. Intera Engineering Ltd. Report TR 07-06 Rev. 1. Ottawa, Canada.
Thomas, R.L., J.L. Wallach, R.K. McMillan, J.R. Bowlby, S. Frape, D. Keys and A.A. Mohajer. 1993. Recent deformation in the bottom sediments of western and southeastern Lake Ontario and its association with major structures and seismicity. In: Wallach, J.L. and J. Heginbottom (Eds.), Neotectonics of the Great Lakes Area. Géographie physique et Quaternaire, 47:325-336.
Thompson, P.M., N.A. Chandler and J.B. Martino. 2002. An Assessment of Methods for the In Situ Determination of Rock Stress During Siting and Characterization of a Geologic Repository. AECL report prepared for Ontario Power Generation 06819 REP-01200-10094-R00. Toronto, Canada.
Trow, W.A. and K.Y. Lo. 1989. Horizontal displacements induced by rock excavations: Scotia Plaza, Toronto, Ontario. Canadian Geotechnical Journal 26,114-121.
Wallach, J.L. 1990. Newly Discovered Geological Features and their potential impact on Darlington and Pickering. Atomic Energy Control Board of Canada, INFO-0342.
Wallach, J.L., A.A. Mohajer, G.H. McFall, J.R. Bowlby, M. Pearce and D.A. McKay. 1993. Pop-ups as geological indicators of earthquake-prone areas in intraplate eastern North America. In: Owen, L.A., I. Stewart and C. Vita-Finzi, Neotectonics: Recent Advances. Quaternary Proceedings 3, 63-79.
White, O.L. and D.J. Russell. 1982. High horizontal stresses in southern Ontario – their orientation and their origin. Proceedings, IV Congress, International Association of Engineering Geology, New Delhi, V39-V.54.
White, O.L., P.F. Karrow and J.R. Macdonald. 1973. Residual stress relief phenomena in Southern Ontario. 9th Canadian Rock Mechanics Symposium, Montreal, 323-348.
Winder, C.G. and B.V. Sanford. 1972. Stratigraphy and paleontology of the Paleozoic rocks of southern Ontario. 24th International Geological Congress, Excursion A45-C45, Montreal, Quebec, Canada.

Regional Geomechanics - 88 - March 2011
Yassir, N.A. and M.B. Dusseault. 1992. Street trajectory determinations in southwestern Ontario from borehole logs. In: Geological Applications of Wireline Logs II. Geological Society Special Publication 65, 169-177.
Zanbak, C. and R.C. Arthur. 1984. Rock mechanics aspects of volume changes in calcium sulphate bearing rocks due to geochemical phase transitions. Proceedings 25th US Symposium of Rock Mechanics, Evanston, 328-337.

Regional Geomechanics - 89 - March 2011
8. ABBREVIATIONS, ACRONYMS AND UNITS
CGB Central Gneiss Belt
CMB Central Metasedimentary Belt
CSIRO Commonwealth Scientific and Industrial Research Organisation
DDGS Deep Doorstopper Gauge System
DGR Deep Geologic Repository
E Elastic Modulus
GS Generating Station
GSI Geological Strength Index
GPa gigapascal
IST In situ Stress Tool
L&ILW Low and Intermediate Level Waste
m metre
mm millimetre
mBGS metres below ground surface
MPa megapascal
OPG Ontario Power Generation Inc.
Q Tunnelling Quality Index
RLmz Robertson Lake Mylonite Zone
RMR Rock Mass Rating
RQD Rock Quality Designation
RSA Regional Study Area
σ Compressive stress
SSPB Swedish State Power Board
UCS Uniaxial Compressive Strength
USBM United State Bureau of Mine
yr year