REGIONAL FREIGHT CONSOLIDATION CENTER BREAK-EVEN · PDF fileREGIONAL FREIGHT CONSOLIDATION...
42
SEL.ECrF;:-- JUN 1719 9 AD-A265 949 0 l 1111 li'll ! i!l DLA-93-P30030 REGIONAL FREIGHT CONSOLIDATION CENTER BREAK-EVEN MODEL Mark Kleinhenz OPERATIONS RESEARCH OFFICE 1993 C.9 i DEPARTMENT OF DEFENSE DEFENSE LOGISTICS AGENCY 93-736833 :• t//// / // jl/ !/sI, I
-
Upload
trinhxuyen -
Category
Documents
-
view
218 -
download
3
Transcript of REGIONAL FREIGHT CONSOLIDATION CENTER BREAK-EVEN · PDF fileREGIONAL FREIGHT CONSOLIDATION...

SEL.ECrF;:--JUN 1719 9 AD-A265 949
0 l 1111 li'll ! i!l
DLA-93-P30030
REGIONAL FREIGHTCONSOLIDATION CENTER
BREAK-EVEN MODEL
Mark Kleinhenz
OPERATIONS RESEARCH OFFICE
1993
C.9 i
DEPARTMENT OF DEFENSEDEFENSE LOGISTICS AGENCY
93-736833
:• t//// / // jl/ !/sI,
I

DLA-93-P30030
REGIONAL FREIGHTCONSOLIDATION CENTER
BREAK-EVEN MODEL
Prepared by
Mark Klelnhenz
DLA OPERATIONS RESEARCH OFFICE
c/o Defense General Supply Center
Richmond, VA 23297-5000
May 1993
Prepared for
DEPARTMENT OF DEFENSE At.cFo 7 fo-r--
DEFENSE LOGISTICS AGENCY NTIS CRAMIDTIC TAB3
Executive Director (Plans & Policy Integration)i U.,annoo,,:.d U
Corporate Research Team oCameron Station By
Alexandria, VA 22304-6100 SDstbutlot
A D a-f bffty Codes
J)'],C q.L•-:,.i-:V •,: -•- . ... • O'' '•,•<dI ra-iit D "

DEFENSE LOGISTICS AGENCYHEADQUARTERS
CAMERON STATIONALEXANDRIA, VIRGINIA 22304-6 100
FOREWORD
Because of the ongoing military drawdown there has been a declinein vendor freight moving through the Regional Freight Consolida-tion Centers (RFCCs). Since further reductions in shipmentvolume are expected, the Defense Logistics Agency MaterielManagement/Transportation Services Team (MMATT) requiresinformation on the minimum level of freight required for a givenRFCC to remain cost effective. Also, some traffic lanes may notbe as cost effective as others. Management needs insight intothe impact of increasing transit times on reducing transportationcost for these lanes. The RFCC Break-Even Model is an analysisto support such decision making in managing the RFCC Program. Wethank MMATT for their support in providing the most currenttransportation rates in effect at the RFCCs.
CHRISTINE L. GALLOExecutive Director(Policy & Plans Integration)
iii

bI
EXECUTIVE SUMMARY
As the drawdown of military forces proceeds, the volume of vendorfreight flowing through the Regional Freight ConsolidationCenters (RFCCs) has been steadily declining. In Fiscal Year (FY)90, the volume was 54 million pounds, but in FY 92 the volumewas 37 million pounds. Because of this decline, the DefenseLogistics Agency (DLA) Materiel Management/Transportation SServices Team required information on the minimum freightlevel required for an RFCC to remain cost effective. Also,information was needed to gain insight on the effect of changingtransit time policy on an RFCC's cost effectiveness.
The objectives of the study were to determine the approximatetonnage at which an RFCC's transportation cost equals thetransportation cost of direct shipment and to quantify the impacton RFCC transportation savings of changing transit time policyfor traffic lanes.
The study is based on one ycar's data (FY 92) from tiie ^iCCs'history files. The scope of the study was limited to vendorfreight consolidation operations at the five commercial RFCCs.Traffic lanes were restricted to those routes between the RFCCsand the six traditional DLA depots.
The methodology of the study included developing a cost model tocalculate both the cost of direct shipment and the transportationcost of the RFCCs for different reduced freight levels. Theeffect of changing transit time policy on RFCC transportationsavings was based on a simulation model.
Principal conclusions of the break-even analysis follow. Thetransportation cost break-even occurs when an RFCC's annualfreight total falls in the following respective range: 2.6 to 4.1million pounds (lbs) for Chicago, IL, .8 to .9 million lbs forDallas, TX, 1.8 to 2.3 million lbs for Jacksonville, FL, and 6.0to 7.5 million lbs for New York, NY. The Los Angeles, CA, RFCCappears to be beyond its break-even range and to be losing asmall amount of transportation dollars annually. This result isattributed to the relatively high outbound cost of the LosAngeles site in comparison to the outbound cost of other RFCCs.
Conclusions of the transit time policy analysis were thatchanging hold time policies would only lead to a small increasein transportation savings at the following RFCCs: Chicago, IL,Dallas, TX, Jacksonville, FL, and New York, NY. Several lanesassociated with these RFCCs were estimated to be losing moneyeven after consolidation time had been increased to 10 days.Increasing hold time to 8 days for the Los Angeles RFCC was foundto produce a savings on lanes that otherwise were estimated to belosing transportation dollars.
V

Recommendations include using the results of the break-evenanalysis as a management indicator to estimate when operation ofan RFCC may no longer be cost effective. It is recommended notto change transit time policy at the following RFCCs: Chicago,IL, Dallas, TX, Jacksonville, FL, and New York, NY. Anotherrecommendation is to negotiate for lower rates for those lanesthat did not show a transportation savings after 10 days ofconsolidation. Finally, it is recommended to increase hold timeat Los Angeles to 8 days and/or to negotiate with the site 0operator for lower outbound rates across-the-board.
V
I
I
I
!• l l | :l I I I | • " - ... "-I

I
BACKGROUND
* Vendor freight declining as drawdownproceeds
* RFCC manager seeks information onminimum freight level required foran RFCC to remain cost effective
* Information is needed to determinethe impact on RFCC transportationsavings of changing transit timepolicy
Since the end of the cold war, vendor freight through theRegional Freight Consolidation Centers (RFCCs) has beendeclining. Total vendor freight throughput in FY 90 was 54million pounds while in FY 92 this number had fallen to 37million pounds. Information is needed on the minimum freightlevel required for an RFCC to remain cost effective. To increasethe cost effectiveness of a RFCC, additional information isneeded on the impact that changing transit time policy would haveon transportation savings on a lane by lane basis, e.g., ChicagoRFCC to Defense Depot Richmond, VA, or Chicago RFCC to DefenseDepot Columbus, OH.
S... ... .. . .... . • .,i............. , .......... .. i~i .. . ... ii Iii . ... -- llllrllnl i. . . . ......,T, .... . ..

OBJECTIVES
To determine the approximate tonnageat which RFCC transportation costequals direct shipment transportationcost
* To determine the impact on RFCCtransportation savings of changingtransit time policy for traffic lanes
The objectives of the study were established with the goal of
assisting the RFCC managers in making decisions to make theRFCC program more cost effective. By determining the
approximate tonnage at which an RFCC's transportation cost
equals direct shipment cost, management has an indicator to use
to estimate when an RFCC is no longer cost effective. BY
investigating the effect of changing transit time policy on an
RFCC's transportation savings, insight can be gained on how tomake that RFCC's transportation savings increase.
i
2

SCOPE
* FY 92 data from RFCC historytapes
* Five commercial RFCCs
* Vendor consolidation operationsat the RFCCs
* Traffic lanes are limited toroutes between the RFCCs and6 traditional DLA depots
This work is based on 1 year's worth of data contained in theRFCC history tapes. The analysis is limited to studying thevendor freight consolidation operations at the five commercialRFCCs. Traffic lanes are defined as routes between thecommercial RFCCs and the six traditional DLA depots: DefenseDepot Columbus, OH, Defense Depot San Joaquin, CA, Defense DepotMemphis, TN, Defense Depot Richmond, VA, Defense Depot Ogden, UT,and Defense Depot Susquehanna, PA.
3

METHODOLOGYDirect Shipment Transportation Cost
* Direct shipments modeled by aggregatingdata by contract number, receipt date andcustomer (DODAAC)
0 Direct small parcel modeled by single-lining '
all records < 71 lbs with a SCAC of UPS,USPS or RPS
0 Direct freight shipments rated using 1993commercial class 50 rates with 10% off
* Direct small parcel rated using UPS rates
Direct shipment cost, i.e. from the vendor to the customer, wasmodeled in the following way. Freight shipments were built byaggregating RFCC historical data by: contract number, receiptdate and customer. In the history tapes the customer isidentified by Department of Defense Address Activity Code(DODAAC). We modeled as a direct small parcel shipment any datarecord with a weight less than 71 pounds and a Standard CarrierAlpha Code (SCAC) of United Parcel Service (UPS), United StatesPostal Service (USPS) or Roadway Parcel Service (RPS).
Freight shipments were costed by applying the 1993 commercialclass 50 rates with a 10 percent discount. The cost of smallparcel shipments was computed using UPS rates.
4
S. .. . . . . . IIIIII . .. . . . i ll 1| ... . .. . .. .

METHODOLOGYRFCC Transportation Cost,
0 Inbound shipments to RFOC modeled byaggregating on: contract number andreceipt date
* Small parcel shipments modeled in samemanner as direct shipment
Inbound shipments rated using same ratefiles as used to cost direct shipments
* Outbound shipments built by aggregating onoutbound GBL number
0 Outbound shipments rated using most current
rates for RFCCs + 3.2% rate hike adjustment
The methodology for calculating the RFCC transportation cost is
as follows. Inbound shipments to the RFCC, i.e. from the vendorto the RFCC, were built by aggregating FY 92 RFCC historical data
by: contract number and receipt date. Inbound small parcel
shipments were built in the same manner as described for directshipment.
Inbound freight shipments were rated using the commercial class50 rates with a 10 percent discount; inbound small parcels were
costed using UPS rates.
Outbound shipments were built by rolling up data by the outbound
Government Bill of Lading (GBL) number, which is recorded in the
history file.
The cost of outbound shipments was computed by using the most
current rates negotiated for the RFCCs plus the recently awarded
3.2 percent rate hike adjustment.
5

METHODOLOGYReducing Freight Levels
• Reduce tonnage by systematicallyeliminating data records to achievean 80%, 60% etc.. freight level
* For example: to reduce tonnage to80% of current level, 20% of totalnumber of records was eliminatedby traffic lane
To gain insight into the question of where the break-even pointmight be for an RFCC, the annual freight level had to be reduced.This was accomplished by employing a heuristic approach thatsystematically eliminated data records. The database wassorted by RFCC and customer, i.e. traffic lane, and divided intoblocks of 100. Records in each block were systematicallyeliminated to achieve the lower freight level. So, for example,to reduce tonnage to 80 percent of the current level, the last20 percent of the records in each block was discarded.
6

RESULTS OF
BREAK-EVEN MODEL
RUNS

Ip
CýHICAGOiC RFCCDBreacak-Eve~n Anal-%ysis
Estimated Savings (Thousands)
$200 174.079
$150
$115-829
$64. 726
$50 $44.051
$1 7.085
$0 --$7.024
-S50$01 0 /0V 804% 60%/. 504/1.6 40946 259G
Freight Level p
This bar chart shows the effect on transportation savings at theChicago RFCC when the annual freight level decreases. Thevertical axis shows the estimated savings in thousands of Pdollars. The horizontal axis shows the freight throughput as apercentage of the current freight level. The annual freighttotal during FY 92 was 10,333,688 lbs. At the current freightlevel the estimated annual savings is $174,079. If the annualfreight dropped to 40 percent of 10 million lbs, then savings isestimated to decrease to $17,085. When the freight throughput pdecreases to 25 percent, RFCC operations are projected to belosing money.
Results are expressed as a range. We selected the range formatbecause of limitations in the database, e.g., missingbill-of-lading data, and the necessity to estimate direct andinbound transportation costs using Class 50 rates with a 10percent discount. In summary the break-even point for theChicago RFCC is estimated to be between 25 percent and 40 percentor between 2.6 and 4.1 million lbs.
8

DA.1LLAS RFCDC1Breaak-Eve=n Analysis!
Estimated Sav'ings (Thoiusanrds)$120
$1106.453
$100
80 ... $76.997
$60 .."••• :••!!$45.91 8
$30.2
$20 1 $16.532$0 . ......... •-•-; I $ .443..
-$20
1 00S/, 80/o 60 No 50S/c, 40 9/6 250,/o 20'%/o
Freight Level
p
Vendor consolidation operations at the Dallas RFCC are estimatedto be saving $106,453 annually at the current freight total of3,760,662 lbs. It is estimated the RFCC transportation cost willbreak-even with the direct transportation cost at some point inthe range of 20 percent to 25 percent or between .8 and .9million lbs.
9

Breaxk-Evean 4\nalysis1
Esti$ated Savings (Thousands)$15
$1 1 .529
f•:':; •.2.=-4:4: :$0.745$10
-$151 o oI/.= a 0 10/c o./
Fr~eight L4_\eve
The break-even analysis for Jacksonville RFCC indicates this RFCCis nearing its break-even point. At the current annual freightthroughput of 2,922,848 ibs, vendor consolidation operations areshowing an estimated modest savings over direct shipment. Whenfreight level decreases to 80 percent then the savings is lessthan $1000. At the 60 percent freight level operations areestimated to result in a yearly loss in transportation dollarsof $5, 187. The break-even point for the Jacksonville RFCC isestimated to be somewhere in the range of 60 percent to 80percent or between 1.8 and 2.3 million ibs.
1 0-=
LI

New Ycrk RFCCBreak-Even Analysis
Estimated Savings (Tho.usands)$800
669.161
$600
$400 $368.831
$200 $118.277
$34.796
$0-$25.79
-$200
100 10 80%Y/ 60 */. 50/% 40'c/,
Freight Level
Vendor freight consolidation operations at the New York RFCC areestimated to be saving over $669,000 in transportation dollarsannually. But, if the current freight level of 14,944,965 lbswas to decrease by half then the savings at 50 percent iscalculated to be $34,796. Continued decline in the amount ofvendor freight through the RFCC would result in the loss oftransportation dollars at the 40 percent freight level. Thebreak-even for transportation cost at the New York RFCC isestimated to be somewhere between 40 percent and 50 percent orbetween 6.0 and 7.5 million lbs.
I
ii

Lcs Angeles RFCCBreak-Even Analysis
Estimr-iated Savings (Thousands)
$0 -_-
-$40"
-$43.091-$50
-$20
-$0-$58.454
-$ 7 0 - 0 1_11 00%./ 80Vo/ 60%./
Freight Level e!
At the current freight level of 3,138,314 lbs, the Los AngelesRFCC appears to be beyond its break-even range and to be losingtransportation dollars. Why are the Los Angeles RFCC's vendorfreight consolidation operations believed to be producing no
savings? To answer this question, the following pie chart was
prepared so that transportation costs at Los Angeles could becompared with those at the other RFCCs.
12

RFCC Transportation Cost SummaryBased on FY 92 Data
S
CI DT JF
67% 52% 49%
33% 48% 51% V.
35% 62% -
65% 38%
LA NY
This pie chart presents a comparison of the inbound and outboundcost distribution of the RFCCs. The pies represent the totalRFCC transportation cost for FY 92. The line shading representsthe inbound transportation cost and the dark shading of the pierepresents the outbound transportation cost. As an example,Chicago's transportation cost is estimated to be made up of 67percent inbound transportation cost and 33 percent outboundtransportation cost. Dallas and Jacksonville show the inboundcost and outbound cost to be nearly equal. New York'stransportation cost distribution is similar to Chicago's. But,the Los Angeles RFCC's cost distribution is very differentfrom that of other RFCCs. Outbound transportation costaccounts for 65 percent of the RFCC's total cost. The table tothe right of the pie chart shows the average outbound rates ofthe five RFCCs. Again, Los Angeles shows an average outboundcost well above that of the other RFCCs. 5
13 0

CONCLUSIONSBREAK-EVEN ANALYSIS
* TRANSPORTATION COST BREAK-EVENPROBABLY OCCURS WHEN AN RFCC'SANNUAL FREIGHT TOTAL FALLS IN THEFOLLOWING RESPECTIVE RANGE:
CI - 2.6 TO 4.1 MILLION LBSDT- .8 TO .9 MILLION LBSJF 1.8 TO 2.3 MILLION LBSNY- 6.0 TO 7.5 MILLION LBS
* AT 3.1 MILLION LBS LA RFCC APPEARSTO BE BEYOND ITS BREAK-EVEN RANGE
* RFCC LA'S OUTBOUND COSTS ARE HIGHIN COMPARISON WITH THOSE OF THEOTHER RFCCS
As the bar chart for Chicago showed, at 25 percent of the currentfreight level the RFCC is estimated to be operating at a smallloss but at the 40 percent level it is estimated to be operatingat a small savings. The percentages bracketing the break-evenpoint for Chicago and for all the RFCCs were converted intopounds in order to report the break-even range. Thebreak-even for the Chicago RFCC is believed to occur in the rangeof 2.6 million to 4.1 million lbs. Similarly, Dallas RFCC isestimated to be breaking even between .8 and .9 million lbs; SJacksonville RFCC is believed to be breaking even between 1.8 and2.3 million ibs; and the New York RFCC is thought to be breakingeven between 6.0 and 7.5 million lbs. As the bar chart for LosAngeles showed, this RFCC appears to be currently operatingbeyond its break-even range. This result is attributed in largepart to the comparably high cost of outbound freight at LosAngeles RFCC.
14

RECOMMENDATIONSBREAK-EVEN ANALYSIS
* USE RESULTS OF BREAK-EVEN ANALYSISAS A MANAGEMENT INDICATOR TO ESTIMATEWHEN OPERATION OF AN RFCC MAYNO LONGER BE COST EFFECTIVE
* NEGOTIATE WITH LOS ANGELES RFCCSITE OPERATOR TO OBTAIN OUTBOUNDRATES MORE COMPARABLE WITH THOSEIN EFFECT AT OTHER RFCCS
Recommendations are as follows. We suggest using the results ofthe break-even analysis as a management indicator. It would beused in conjunction with projected freight levels to estimatewhether throughput has decreased to the point when the operationof an RFCC may no longer be cost effective. Also, we recommendnegotiation with the Los Angeles site operator to obtain outboundrates more comparable with those at the other RFCCs.
15isi
S.. .. . . . .. .. . . . . ... . .. .. I~ i .. . .. i~ l il ll l l • im m lf. . ... . . .. . . . • . .. . . .. . . . ' . . . . . ..

THE EFFECT OF VARYING
HOLD TIME POLICY ON RFCC
TRANSPORTATION SAVINGS
16
S...................... .. ..... =........... ........ . i, ..... . . ... • -

METHODOLOGYSavings As a Function of Hold Time
0 Prorate inbound transportation cost bylane (DODAAC)
* Model new hold time policy byaggregating RFCC outbound shipmentsfor 4 days, 6 days, etc..
* Rate consolidated shipments with currentRFCC outbound rates + 3.2% rate hikeand add to prorated inbound cost
* Compare modeled RFCC cost to cost ofdirect shipment to determine changein savings
To study savings as a function of hold time, we began byprorating the inbound transportation cost according to weight bytraffic lane. We modeled the different hold time policies bysimulating the building of shipments outbound from the RFCC for:4 days, 6 days, 8 days and 10 days. The consolidated shipmentswere rated using the RFCCs' outbound rates plus the 3.2 percentrate hike adjustment.
For each scenario, the prorated cost was added to the modeledoutbound cost and the sum was compared to the cost of directshipment. The cost difference showed the incremental improvementof changing hold time policy.
17

RESULTS OF VARYING
HOLD TIME POLICY
ON RFCC SAVINGS
I1
18I!

Chicago RFOCSaivings As a. Function cof Hold Time
Estimated Savings (Thousands) -------
$25 -
$ .
$ 2 0 - ...............................
$ 1 5 . ..........................
$ 10 .................
Hold Time
E2 10 DaysSi • 8 Days
SS: 8..ay.
DDRV DDCO DDSP DDOU DDMT [Di6 Days
Lanes 14 DaysM current
This series of stacked bar charts for Chicago and the other RFCCs
will show the lanes estimated to be saving the most
transportation dollars, any lanes estimated to be not saving
money and the effect on lane savings of increasing the
consolidation time. Please note that transit time is not
included in hold time; hold time refers only to the period of
shipment consolidation.
This first stacked bar chart shows estimated savings along the
vertical axis and the traffic lanes along the horizontal axis.
The stacked bars show the incremental effect on savings when
shipments are consolidated for longer periods. For example,
let's examine the data for shipping from Chicago to DDRV (for
abbreviations please refer to Appendix A). The stacked bar shows
that under current hold time policy this lane is estimated to be
saving approximately $18,000 in transportation dollars annually.
If the consolidation time was increased to 8 days, then total
savings would increase by about $2,000 to give a total savings
1
19

along that lane of just over $20,000. But when hold time isincreased to 10 days the total annual transportation savingswould be boosted to about $22,000 for the lane.
All lanes out of the Chicago RFCC are estimated to be savingtransportation dollars. The lane believed to be saving the mostis Chicago-to-DDJC. Because of scale differences, this lane isshown separately as a subchart. The transportation savings iscalculated to be about $130,000 annually on this lane alone.The results for DDJC indicate that if 4 days hold time is usedthen savings should be about $150,000 annually. However, currentperformance indicates that the average hold time for the Chicago- DDJC lane is 5.1 days. (Appendix B contains bar charts andtables describing the current consolidation performance at eachof the RFCCs during FY 1992.) Therefore, it is believed thatthe increase in savings is not due to increasing hold time but tomore efficiently consolidating freight over the current hold timeperiod of 5.1 days.
The DDCO lane shows no improvement in savings even after 10 daysof consolidation. This can be understood by referring to theaverage hold time for this lane, 10.4 days, as shown in AppendixB. The remaining lanes show a marginal increase in savings inreturn for increasing hold times up to 10 days.
20

DALLAS RFCCSaxvings As a Function of Hold Timei
Estimated Savings (Thousands)$25
$ 2 0 --------- -- ----- ... .. .. ... .. ...-
$ 10 .....................
$ 1 5- -- -- -- --
$ 5 .... ... ........... ,
$0
Es 10 Days j
DDRV DDSP DDOU DDMT [8 Days
Lanes lZ6 Daysn Current
This next stacked bar chart displays the results of varyingconsolidation time by lane for the Dallas RFCC. The subchart tothe right was created, because of scale differences, to show theresults for the DDCO and DDJC lanes. These two lanes arecalculated to be saving the most transportation dollars.Increasing hold times to 8 and 10 days only marginally increasethe annual savings along these routes. Of the remaining lanesonly traffic to DDMT was shown to be losing transportationdollars - an estimated $3,000 annually. After increasing theconsolidation time to 10 days, results showed that this lane wasstill losing money.
2
21 S

JACKSONVILLE RFCCI
Savings As a Functio~n o:f Ho~ld Timei,
Estimated Savings (Thousands)
$15
$ 1 0 .................. .... ...
Ix
$5
$0
-$ 5 . . . . . . .. . . . . . .. _
-$10 --......... .-------------.-- i.Hold Times21 0 Days
-$5 8 Days-$15 _ _ _ _ _ _ _ _ _ _ _ _ 8Dy
DDRV DDCO DDSP DDOU DDMT f16 Days
Lanes 4 DaysCurrent
These stacked bar charts summarize the effect of increased holdtime on savings at the Jacksonville RFCC. The DDJC lane (seesubchart) is shown to be saving the most transportation dollars.Besides this lane, the DDOU and DDCO lanes are estimated to besaving transportation money. A relatively small transportationsavings can be realized by increasing the hold times on theselanes, however the gains are not estimated to be large. Incontrast, the DDRV, DDSP and DDMT lanes are shown to be losingtransportation dollars. Increasing consolidation time alongthese lanes did not produce a savings even after simulating aconsolidation period of 10 days. Again, statistics on currentconsolidation performance can be found in Appendix B.
22

NEW YORK RFCC,Savings As a Function of Hold Time
Estimated Savings (Thousands)$250
WE---.
$120 ----------------.....
$50- " " Hold Time
r1z0 Days
S8 Days$0--
DDRV DDOU DDMT r-Gl6 Days
Lanes 4 DaysCurrent
This bar chart and the one on the following page summarize theresults of calculating transportation savings as a function ofhold time at the New York RFCC. The subchart to the rightshows the DDJC lane is estimated to be responsible for much ofthe estimated transportation savings at the RFCC. The featuredbar chart shows that DDOU, DDMT and DDRV are also saving moneyunder current operations. Simulating an increase of hold time to4 days or 6 days resulted in boosting savings on all these fourlanes. However, referring to Appendix B, current consolidationtimes for these lanes already exceed 4 days; this indicates that
the increases in savings due to the simulations are not due tochanging hold time policy; more likely the savings increases aredue to more efficient consolidation of freight under current holdtime policy.
23

NEW YORK RFCCSavings As a Function of Hold Timel
Estimated Savings (Thousands)$10
$ 5 -- -- -- -- -
-$1 0 - -. . . . . . . . .....
-$15 ... Hold Time
SD ays
-$20 __ DaysDDCO DDSP m6 Days
Lanes ED 4 DaysCurrent
S
Some lanes are estimated to be currently losing transportationdollars for the New York RFCC: DDCO is estimated to be costingabout $18,000 more annually than direct shipment while DDSP isfigured to be losing about $6,000 in transportation dollars.Simulating different hold time policies for these lanes yieldedthe following results. DDSP could be showing a small savings ifhold time was increased to 6 days; current average hold time is4.8 days (see Appendix B). DDCO did not show a savings after 10days simulated hold time. This result is partially attributedto the fact that outbound truckload rates for the New York - DDCOlane are higher (more than $2.00 per hundredweight) than therates to either DDRV or DDSP. Also, there is very littleless-than-truckload weight to consolidate on this lane togenerate an increase in savings.
24
LOS ANGELES RFCCSavings As a Funotion cf Hold Time
Estimated Savings (Thousands)
$30
$20 --- ------------------------- --------
S•S$ 1 0 ................-
$0
- $ 1 0 --------- --- ----- - ---
DOCO
- $ 2 0 -------- . . -----------------. . .
Hold Times
$____10 Days •
DDRV DDSP DDJC DDOU DDMT EDr8 Days
Lanes { 6 Days
Current
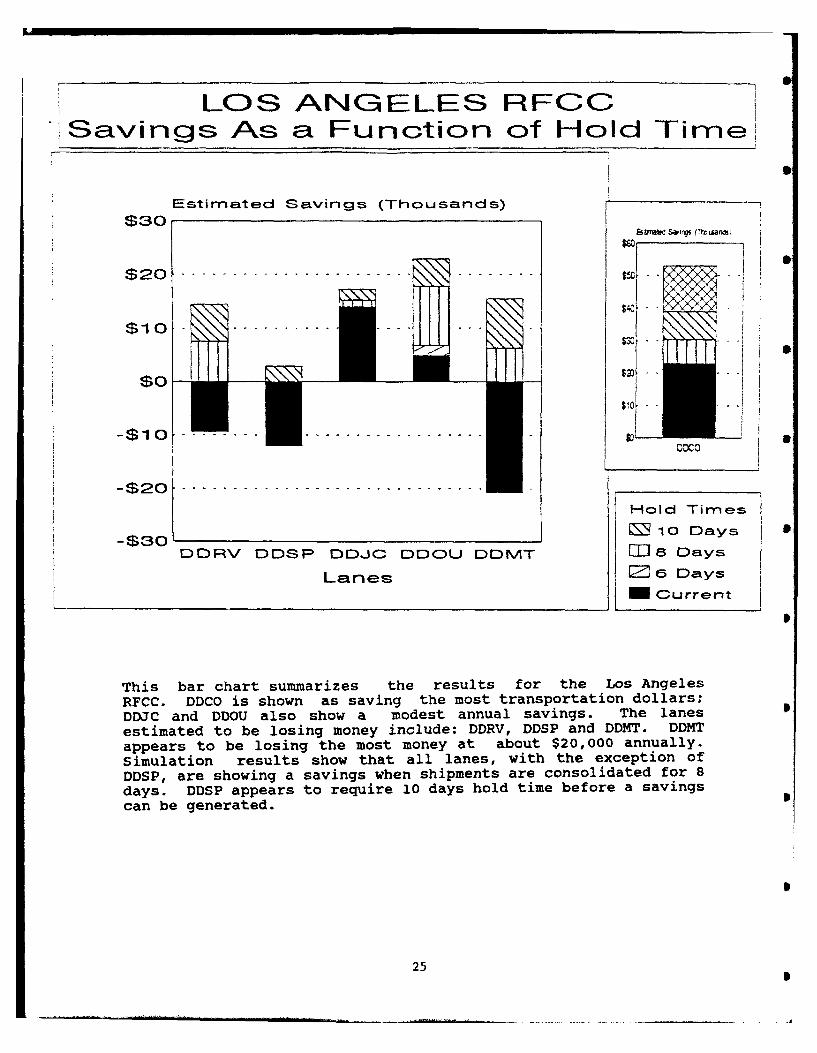
This bar chart summarizes the results for the Los AngelesRFCC. DDCO is shown as saving the most transportation dollars;DDJC and DDOU also show a modest annual savings. The lanesestimated to be losing money include: DDRV, DDSP and DDMT. DDMTappears to be losing the most money at about $20,000 annually.Simulation results show that all lanes, with the exception ofDDSP, are showing a savings when shipments are consolidated for 8days. DDSP appears to require 10 days hold time before a savingscan be generated.
25

CONCLUSIONSHOLD TIME ANALYSIS
* INCREASING HOLD TIME FOR CI, DT,JF, AND NY LANES YIELDS SMALL
INCREASES IN SAVINGS
* THE FOLLOWING LANES DID NOT PRODUCE
A SAVINGS AFTER 10 DAYS HOLD TIME:DT-DDMT, JF-DDRV, JF-DDSP, JF-DDMTAND NY-DDCO
* INCREASING CONSOLIDATION TIME TO 8DAYS FOR LA-DDRV AND LA-DDMT SHOULDPRODUCE A SAVINGS ON THESE LANES
* LA-DDSP LANE REQUIRES 10 DAYS HOLDTIME TO PRODUCE A SAVINGS
Conclusions from the hold time analysis are as follows.
Increasing the hold times for the Chicago, Dallas, Jacksonville,
and New York lanes produced small increases in savings. Often
the increase in savings was not due to a change in hold time
policy but to the more efficient consolidation of freight by
computer simulation. Several lanes did not show a savings even
after consolidating for 10 days. However, changing hold time
policy at the Los Angeles RFCC is one way to make vendor
consolidation operations there save transportation money. If
freight from Los Angeles to DDRV and to DDMT is consolidated for
8 days then these lanes should produce a savings. But the Los
Angeles-DDSP lane would require an increase in hold time to 10
days before a small savings could be realized.
26

II
RECOMMENDATIONSHOLD TIME ANALYSIS
I DO NOT CHANGE TRANSIT TIMEPOLICY AT CI, DT, JF OR NY
* NEGOTIATE FOR LOWER RATESFOR THE FOLLOWING LANES:DT-DDMTJF-DDRVJF-DDSPJF-DDMTNY-DDCO
* INCREASE HOLD TIME POLICYAT LA TO 8 DAYS AND/ORNEGOTIATE FOR LOWER OUTBOUNDRATES ACROSS THE BOARD
Based on the results of the hold time analysis we recommend thetransit time policy not be changed at the following RFCCs:Chicago, Dallas, Jacksonville, and New York. Savings on somelanes could not be produced when up to 10 days consolidation timewas simulated; for these lanes we suggest negotiating loweroutbound rates. Finally, transportation savings at the LosAngeles RFCC can be increased by either increasing hold timepolicy to 8 days or obtaining lower outbound ratesacross-the-board.
27

APPENDIX A
ACRONYMS /ABBREVIAT IONS
A-i

Acronyms/Abbreviations
CI Chicago, IL, RFCC
DDCO Defense Depot Columbus,OH.
DDJC Defense Depot San Joaquin, CA.
DDMT Defense Depot Memphis, TN.
DDOU Defense Depot Ogden, OU.
DDRV Defense Depot Richmond, VA.
DDSP Defense Depot Susquehanna, PA.
DODAAC Department of Defense Address Activity Code
DT Dallas, TX, RFCC
GBL Government Bill of Lading
JF Jacksonville, FL, RFCC
LA Los Angeles, CA, RFCC
lbs Pounds
LTL Less-Than-Truckload
NY New York, NY, RFCC
RFCC Regional Freight Consolidation Center
RPS Roadway Parcel Service
SCAC Standard Carrier Alpha Code
TL Truckload
UPS United Parcel Service
USPS United States Postal Service
A-3

APPENDIX B
CURRENT CONSOLIDATION PERFORMANCE
STATISTICS
B-I

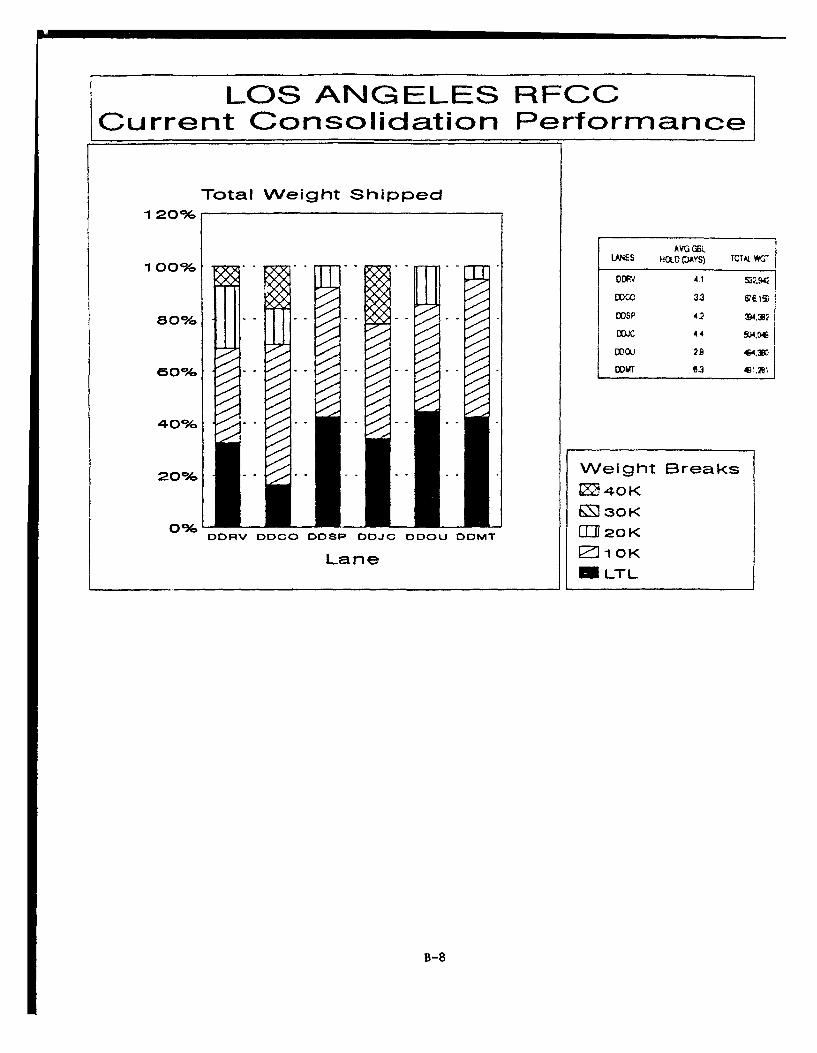
The following five stacked bar charts were prepared to show thecurrent level of consolidation performance at the five commercialRFCCs. For each RFCC, the vertical axis of the bar chart showsthe weight shipped in a weight break as a percentage of the totalweight shipped on that lane. The horizontal axis shows thedifferent traffic lanes, e.g., Chicago to DDRV. As an example,the Chicago RFCC bar chart shows that for the Chicago-to-DDRVlane 20 percent of the total weight moved was shipped in the20,000 pound weight break, 40 percent of the total weight movedin the 30,000 pound weight break, and the remaining 40 percentmoved as 40,000 pounds or more.
The table to the right of the bar chart displays the currentaverage consolidation time and the total annual weight shipped bylane. Consolidation times and total weight shipped are developedfrom the history tapes received monthly from each RFCC. Theaverage consolidation time is calculated by subtracting theearliest vendor receipt date on a GBL from the GBL's ship date.This gives the consolidation time for that one GBL. By repeatingthis calculation for all GBLs shipped on the lane for a year andtaking the arithmetic average of all the GBLs an average GBLhold time was calculated. Again, as an example, the table showsan average of 8.7 days consolidation time for freight moving fromChicago to DDRV; a total of 1,913,637 pounds was shipped duringthe year on this lane.
B-3

CHICAGOC RECOlCurreant Co~nsol idatic~n Perfo~rmamce
Total WNeight Shipped120%~
f ME HOLfl(0yS TOTAL YVG
DDOO 10A4 1271AG
DDSP 7.5 1Z727
D=J 5.1 2.7U51i9
DDEU 92 1=114i
0DMT 7.4 is
20% Weight BreaksS40 K
~30 K0%DDRV 0000 DDSP DOJC DDOU DDMT 111120K
Lane [2 10K
mLTL
B-4

DALLAS RFCCCurrent Consclidation Performance
Total Weight Shipped1 20V 0
AVG GEL1 00 %/ .. LAN;- OL AYS Tc ,A . w
DOV 30 5,3"J
DOOC 32 R60i&"DOS; 3 0 C5.41S
60%/ J DC N- 41 T/ S
DOW;6~4
400/ - .
2oo/ .. . .. .. .. .W eight Breaks20%•
40K
S30K0% I .... . 2OIK;
DDRV D0CO DDSP DOJO DDOU DDMT
Ln E2 1 OKLane 1,
i LTL
B-5

JACKSO)NVILLE RECOCurrent Co~nsolidac-tion Pe~rfo~rmance
Total Weight Shipped120%/
AVG GEL
10 %LA&E scoL pkyS) 1Trk WGT
DDRV 3.3 398=
ODS? 31 42.713
DILC 2,2 971,12 S
DM1.7 2q4XT
20%Weight Breaks1S40K
00/a 30K
DDRV DDCO DOSP L)oJc DDOU DDMT ~ 120K
Lane 10KmLTL
B-6

NEW YO)RK REOClCurrent Conso~lidation Perfoarmance
Total W~eight Shipped1 20%o
AVG GL
100% - LANE$ HtOL (DAYS) TOTAL WGT
mc~ 4.9 2,296.765D O6.9 1.617.416
ID3JC 5.6 4MM~TtVDJ 6,3 ?.6SGB4
60%c - -- - - T 61 2.446SI
40%. - .-
20% - Weight Breaks
E2 40 K
SS 30K
ODDV £)DOO DDSP DOJO DC)OU DOMT 01U)20KLane E210K
mLTL
B- 7
LOS ANGiELES RFCCCurrent Consolidation Performance
Total Weight Shipped1 20%
AVG GL
1 00% LANES HOLD (DAYS) TOTAL WGT
DOFN 4.1 $3Z94j
DDCO 33 v"as I
80% D - " " D-SP 4.2
0DJc 4A4 934,
S~~ DO0 2.a44,B
60% " "" OOMT 63 4,2e'
40% - . .
20% . Weight Breaks
M 40K
R-I 30K0% DDRV DDCO DDSP DDJC DDOU DDMT [=20K
Lane 1 OK
m LTL
B-8

IL
REPORT DOCUMENTATION PAGE I W8 No ' '0 1,88
1. AGENCY USE ONLY (Leave Wiank) 2. REPORT OATE 3 REPORT TYPE AND DATES COVEREDMay 1993 Final
4. TITLE AND SUBTITLE 5 FUNDING NUMBERS
Regional Freight Consolidation CenterBreak-even Model
6. AUThOR(S)
Mark Kleinhenz
7- PERFORMING ORGANIZATION NAME(S) AND AODRESS(ES) 8 PERFORMING ORGANIZATIONREPORT NUMBER
DLA Operations Research Officec/o Defense General Supply Center DLA-93-P30030Richmond, VA 23297-5000
9, SPONSORING MONITORING AGENCY NAME(S) AND ADDRESS(ES) 10 SPONSORING MONITORING
AGENCY REPORT NUMBERHQ Defense Logistics AgencyExecutive Director (Plans & Policy Integration)Corporate Research TeamCameron Station, Alexandria, VA 22304-61U0
11. SUPPLEMENTARY NOTES
12a. DISTRIBUTION; AVAILABILITY STATEMENT 12b DISTRIBUTION CODE
Public Release; Unlimited Distribution
13. ABSTRACT(Maximum200words) The ongoing military drawdown has caused a declinein vendor freight moving through the Regional FreightConsolidation Centers (RFCCs). Since further reductions infreight volume are anticipated, the Transportation Services Team(MMATT) requested information on the minimum annual freightvolume required for a given RFCC to remain cost effective.Because some traffic lanes may not be as cost effective asothers, management needs insight on the impact of changingtransit time policy on RFCC transportation savings. To addressthese concerns, the objectives of the study were to determine theapproximate tonnage for the RFCC transportation cost to equaldirect shipment cost and to determine the impact on RFCCtransportation savings of changing transit time policy fortraffic lanes. The study is based on I year's data (FY 92) fromthe RFCC history tapes. The scope of the work is limited toexamining vendor consolidation operations at the five commercialRFCCs; only traffic lanes between the commercial RFCCs and thesix traditional DLA depots were analyzed.
14. SUBJECT TERMS 15. NUMBER OF PAGES47
Regional Freight Consolidation Center) consolidation, freight 16. PRICE CODE
17. SECURITY CLASSIFICATION 't SECURITY CLASSIFICATION 19. SECURITY CLASSIFICATION 20. LIMITATION OF ABSTRACTOF REPORT OF THIS PAGE OF ABSTRACT
UNCLASSIFIED UNCLASSIFIED UNCLASSIFIED
NSN 7540-01 280-5500 StIanard Fofm 298 (Rev 2-89)
~~~~~~~~~~~~D w d . . . . . ... . . .. . 11 1 IId 1 00III 111 . . . . .