Presentation courtesy of International Council on Active Aging.
Upload
trinhthuanCategory
view
216download
1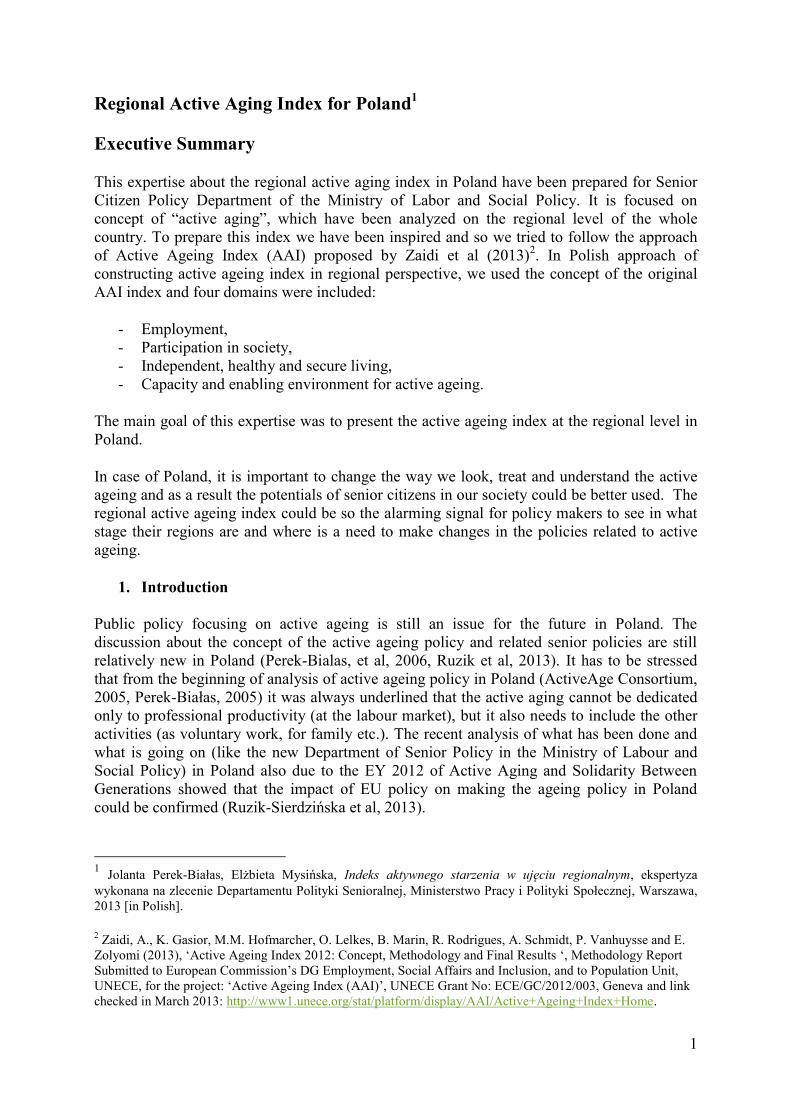
1
Regional Active Aging Index for Poland1
Executive Summary
This expertise about the regional active aging index in Poland have been prepared for Senior
Citizen Policy Department of the Ministry of Labor and Social Policy. It is focused on
concept of “active aging”, which have been analyzed on the regional level of the whole
country. To prepare this index we have been inspired and so we tried to follow the approach
of Active Ageing Index (AAI) proposed by Zaidi et al (2013)2. In Polish approach of
constructing active ageing index in regional perspective, we used the concept of the original
AAI index and four domains were included:
- Employment,
- Participation in society,
- Independent, healthy and secure living,
- Capacity and enabling environment for active ageing.
The main goal of this expertise was to present the active ageing index at the regional level in
Poland.
In case of Poland, it is important to change the way we look, treat and understand the active
ageing and as a result the potentials of senior citizens in our society could be better used. The
regional active ageing index could be so the alarming signal for policy makers to see in what
stage their regions are and where is a need to make changes in the policies related to active
ageing.
1. Introduction
Public policy focusing on active ageing is still an issue for the future in Poland. The
discussion about the concept of the active ageing policy and related senior policies are still
relatively new in Poland (Perek-Bialas, et al, 2006, Ruzik et al, 2013). It has to be stressed
that from the beginning of analysis of active ageing policy in Poland (ActiveAge Consortium,
2005, Perek-Białas, 2005) it was always underlined that the active aging cannot be dedicated
only to professional productivity (at the labour market), but it also needs to include the other
activities (as voluntary work, for family etc.). The recent analysis of what has been done and
what is going on (like the new Department of Senior Policy in the Ministry of Labour and
Social Policy) in Poland also due to the EY 2012 of Active Aging and Solidarity Between
Generations showed that the impact of EU policy on making the ageing policy in Poland
could be confirmed (Ruzik-Sierdzińska et al, 2013).
1 Jolanta Perek-Białas, Elżbieta Mysińska, Indeks aktywnego starzenia w ujęciu regionalnym, ekspertyza
wykonana na zlecenie Departamentu Polityki Senioralnej, Ministerstwo Pracy i Polityki Społecznej, Warszawa,
2013 [in Polish].
2 Zaidi, A., K. Gasior, M.M. Hofmarcher, O. Lelkes, B. Marin, R. Rodrigues, A. Schmidt, P. Vanhuysse and E.
Zolyomi (2013), ‘Active Ageing Index 2012: Concept, Methodology and Final Results ‘, Methodology Report
Submitted to European Commission’s DG Employment, Social Affairs and Inclusion, and to Population Unit,
UNECE, for the project: ‘Active Ageing Index (AAI)’, UNECE Grant No: ECE/GC/2012/003, Geneva and link
checked in March 2013: http://www1.unece.org/stat/platform/display/AAI/Active+Ageing+Index+Home.

2
And thanks to actions of European Commission, the subject of senior citizen policy have
started to be very important issue for EU member countries (see EY 2012), including Poland.
One of important action of the Directorate General for Employment, Social Affairs and
Inclusion, with the Population Unit of the United Nations Economic Commission for Europe
and the European Centre for Social Welfare Policy and Research in Vienna was a preparation
of the overall active ageing index for European countries.
According to authors (Zaidi et al, 2013) the before-mentioned index supposes to be a “tool to
measure the untapped potential of older people for active and healthy ageing across
countries. It measures the level to which older people live independent lives, participate in
paid employment and social activities as well as their capacity to actively age”3. It gives a
possibility to check, which countries are the best in realization of the active ageing policy. In
other words, the index was invented to show on what level the citizens are able to be
professionally active and to live independent, healthy and secure life and also to find new
possibilities for active ageing and so the senior policy in European countries.
The afore-mentioned actions resulted in building of the specific country index, which
indicates leader countries in making of active aging policy. The Eurostat data from years 2010
and 2011 were used to create before-mentioned index and in most of examples they were
prepared for people over age 55 and 65+.
The Active Ageing Index covers four domains as follows:
1. Employment.
2. Participation in Society.
3. Independent, healthy and secure living.
4. Capacity and enabling environment for active ageing
Unfortunately, according to AAI Poland is on the last 27th position in the ranking - on the list
of the EU-countries, which were included in this project.
That’s why the main goal of the regional expertise of active ageing index in Poland was to
check and show how large differences in these domains there are between regions of the
country and to check if there are available data which allow to easily monitor not only the
current situation in areas important for active ageing policy and senior policy but also to see
changes in these policies over time. It also should help to identify in which region of Poland
there is a need to support seniors, and to make an intervention to change the position of region
and as well to change the overall position of country in European ranking.
The Active Ageing Index for Regions of Poland was prepared as much as possible (due to
availability of data and access to them) as original AAI for Europe. The same like in the
European AAI, the Polish Regional index also covers four main domains mentioned above.
And mostly we based on secondary and available data from the Central Statistical Office or
from the selected national representative sampling surveys for which the analysis were
performed if it was needed. The data used is mostly from 2010 and 2011 as in original index
also to make a kind of reference year before EY 2012 to see if and what can change over time
if the analysis is repeated. The detailed description of used indicators (source of data,
description of indicators, examples of exact questions and answers used in our approach) is
available in Perek-Białas, Mysińska, 2013.
3 See relevant mentioned above web page with the description of the AAI.

3
Unfortunately, there was no possibility to use exact the same indicators as in original AAI,
mostly due to lack of data at regional level of country. In such situation, there was provided a
checking what information/indicator could be replaced here. And if only a substitution for
other/similar information exists and if it was available, such approach was applied. Just in one
or two cases the indicators had to be removed from the overall active ageing index (like
employment rate of people over 70+).
2. Detailed description of domains of regional active ageing index.
Employment
First domain describes the employment rates of people in age 55+, with more specific age
breaks up to 69. The employment rate over 70+ in Poland is very low, so only these three
rates were used in analysis as shown below in Table 1. According to the definition of Central
Statistical Office, as employed person is consider such one who had carried out a job, even for
an hour per week, which brought them any income or who have helped for free in the regular
home works in the farm or in any other household economic activity as well as who had a job
but he/she was not able to do it because of sickness, holidays or any other reasons [the same
definition as in the official documents and in the statistical system of the Central Statistical
Office/Eurostat based on European Union-Labour Force Survey]. An important fact is that the
afore-mentioned break in the work period, could not be longer than 3 months, unless they
were paid employees and in the period longer than 3 months a person gots at least 50 % of
their regular salary.
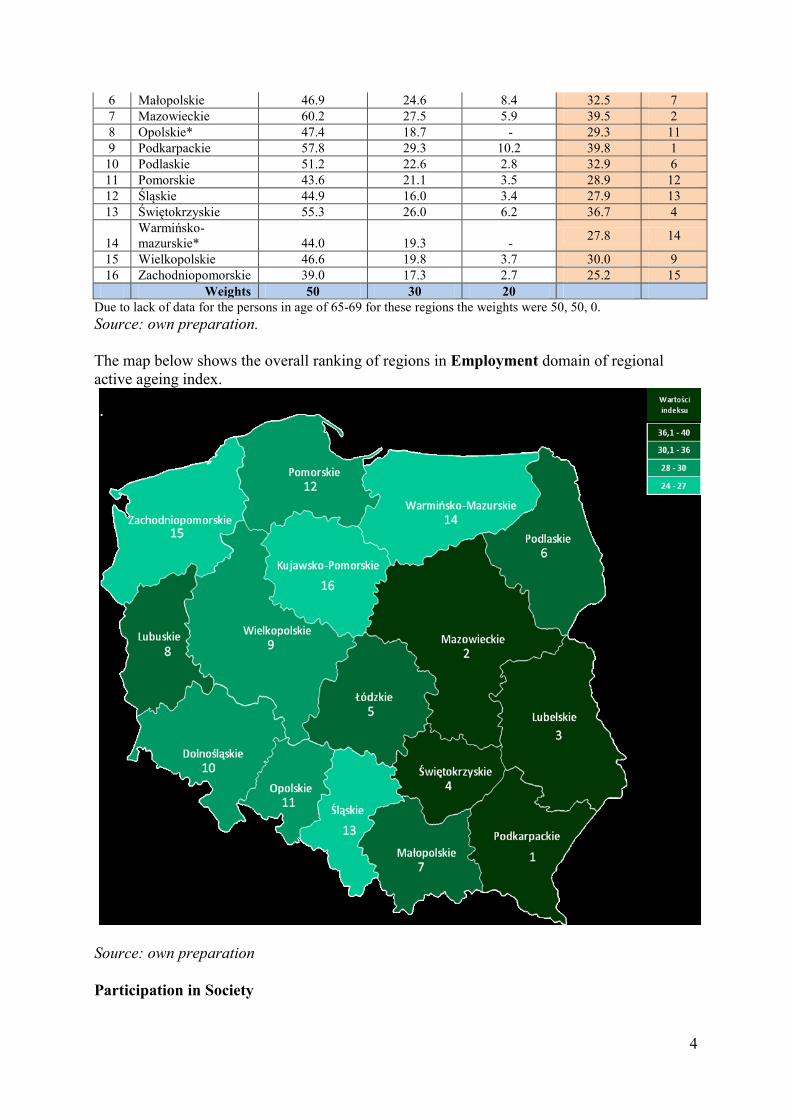
According to analysis of calculated at regional level, employment rates, the Podkarpackie
region is a leader in Poland, where the rates of employment of older workers and senior
citizens are the highest in the country. At the second place is Mazowieckie region and at the
third place Lubelskie region.
The worst results in Poland are achieved in the north part of the country, with the following
regions: Kujawsko-Pomorskie, Zachodniopomorskie and Warmińsko-Mazurskie.
Tabel 1. Employment
Employment 1.1 Employment
rate 55-59
1.2.
Employment
rate 60-64
1.3
Employment
rate 65-69
Index Ranking
No. Regions CSO 2011 CSO 2011 CSO 2011 Value Ranking
1 Dolnośląskie 47.0 18.6 3.0 29.7 10
2
Kujawsko-
pomorskie 39.0 13.8 3.3 24.3 16
3 Lubelskie 56.9 27.9 7.3 38.3 3
4 Lubuskie 46.2 21.5 4.0 30.3 8
5 Łódzkie 57.5 21.7 4.6 36.2 5
4
6 Małopolskie 46.9 24.6 8.4 32.5 7
7 Mazowieckie 60.2 27.5 5.9 39.5 2
8 Opolskie* 47.4 18.7 - 29.3 11
9 Podkarpackie 57.8 29.3 10.2 39.8 1
10 Podlaskie 51.2 22.6 2.8 32.9 6
11 Pomorskie 43.6 21.1 3.5 28.9 12
12 Śląskie 44.9 16.0 3.4 27.9 13
13 Świętokrzyskie 55.3 26.0 6.2 36.7 4
14
Warmińsko-
mazurskie* 44.0 19.3 - 27.8 14
15 Wielkopolskie 46.6 19.8 3.7 30.0 9
16 Zachodniopomorskie 39.0 17.3 2.7 25.2 15
Weights 50 30 20
Due to lack of data for the persons in age of 65-69 for these regions the weights were 50, 50, 0.
Source: own preparation.
The map below shows the overall ranking of regions in Employment domain of regional
active ageing index.
Source: own preparation
Participation in Society

5
In this area, the leader is Lubelskie region but the regions Lubuskie and Małopolskie are very
close to the leader region.
The worst results were gained by regions: Warmińsko-Mazurskie, Kujawsko-Pomorskie and
Podlaskie.
Tabel 2. Participation in Society
Participation in Society
2.1
Voluntar
y work
(55+)
2.2 Care for
children and
grandchidlren
(55+)
2.3 Care
for other
dependent
and older
people
(55+)
2.4
Participation
in public
meetings
(55+)
Index Ranking
No. Regions DS 2011 PNZ 2011 PNZ 2011 DS 2011 Value Position
1 Dolnośląskie 16.3 12.0 1.0 23.9 13.3 6
2 Kujawsko-pomorskie 11.9 11.0 2.0 19.0 11.0 15
3 Lubelskie 15.8 22.0 4.0 27.4 17.3 1
4 Lubuskie 22.1 17.0 3.0 23.9 16.5 2
5 Łódzkie 12.9 10.0 1.0 21.0 11.2 13
6 Małopolskie 16.9 15.0 1.0 22.6 13.9 3
7 Mazowieckie 17.6 11.0 3.0 22.4 13.5 5
8 Opolskie 16.7 9.0 3.0 20.6 12.3 9
9 Podkarpackie 18.0 9.0 2.0 24.1 13.3 7
10 Podlaskie 11.7 14.0 3.0 15.4 11.0 14
11 Pomorskie 13.5 9.0 4.0 21.8 12.1 10
12 Śląskie 13.4 11.0 7.0 16.5 12.0 11
13 Świętokrzyskie 15.8 8.0 3.0 19.4 11.6 12
14
Warmińsko-
mazurskie 7.7 14.0 3.0 13.8 9.6 16
15 Wielkopolskie 17.2 10.0 2.0 22.9 13.0 8
16 Zachodniopomorskie 14.3 14.0 1.0 25.6 13.7 4
Weights 25 25 25 25
Source: own preparation.
The map below shows the overall ranking of regions in this domain of Participation in
Society.

6
Source: own preparation
Independent, healthy and secure living
To prepare the overall index in this domain, various indicators were used: sport/physical
activity, lack of problems with accessibility to health care (dental equipment) and satisfaction
from financial and material situation, use of computer and other IT technologies as well
information about feeling safe in their own neighborhood.
Here, the leaders are: Śląskie, Wielkopolskie and Mazowieckie regions. The worst values were
found in: Świętokrzyskie, Warmińsko-Mazurskie and Podkarpackie regions.
Tabel 3. Independent, healthy and secure living.
Independent, healthy
and secure living
3.1
Physi
cal
activi
ty
(55+)
3.2 No
need to
refuse
buying
the
dental
equipm
ent due
to lack
of
3.3
Indepen
dent
living
alone
(75+)
3.4 Ratio of
average
monthly
pension/aav
erage
monthly
salary
3.6
Satisfac
tion
from
material
situatio
n (65+)
3.7
Physi
cal
safety
(55+)
3.8.
Use of
compu
ter
(55+)
Index Ranki
ng

7
money
N
o. Regions
DS
2011
DS
2011
GUS
2011 GUS 2011 DS 2011
DS
2011
DS.
2011
Wart
ość
Pozyc
ja
1 Dolnośląskie 24.7 73.3 2.0 56.8 54.5 82.2 29.2 49.7 7
2 Kujawsko-
pomorskie 21.5 80.3 1.6 51.6 56.5 86.3 21.2 49.3 8
3 Lubelskie 17.3 70.1 2.1 49.6 59.6 87.4 20.1 47.3 12
4 Lubuskie 25.1 69.8 1.7 51.0 55.2 87.8 20.2 48.1 9
5 Łódzkie 17.7 74.6 2.3 52.2 48.5 83.1 25.0 46.8 13
6 Małopolskie 18.1 81.5 1.5 54.6 60.5 87.4 20.7 50.3 5
7 Mazowieckie 23.7 76.3 2.2 57.8 61.3 85.3 28.9 51.7 3
8 Opolskie 24.2 74.6 1.7 55.2 57.8 90.4 16.6 49.9 6
9 Podkarpackie 16.9 72.5 1.4 47.9 53.9 92.1 15.0 46.5 14
1
0 Podlaskie 13.6 73.9 2.1 50.8 57.7 89.9 19.1 47.5 10
1
1 Pomorskie 24.8 68.6 1.6 55.8 64.9 86.2 27.6 50.7 4
1
2 Śląskie 23.4 75.4 2.0 69.8 69.3 79.3 26.4 53.9 1
1
3 Świętokrzyskie 10.5 66.5 2.0 50.3 61.0 80.6 13.9 44.4 16
1
4
Warmińsko-
mazurskie 13.1 62.1 1.7 50.5 57.7 89.8 18.9 45.6 15
1
5 Wielkopolskie 24.7 79.7 1.4 53.5 66.7 91.1 26.7 52.8 2
1
6
Zachodniopomo
rskie 21.2 66.4 1.8 54.3 50.6 89.0 23.2 47.5 11
Weights 15 15 10 20 15 15 10
Source: own calculation.
The map below shows the overall ranking of all regions in domain of Independent, healthy
and secure living.
8
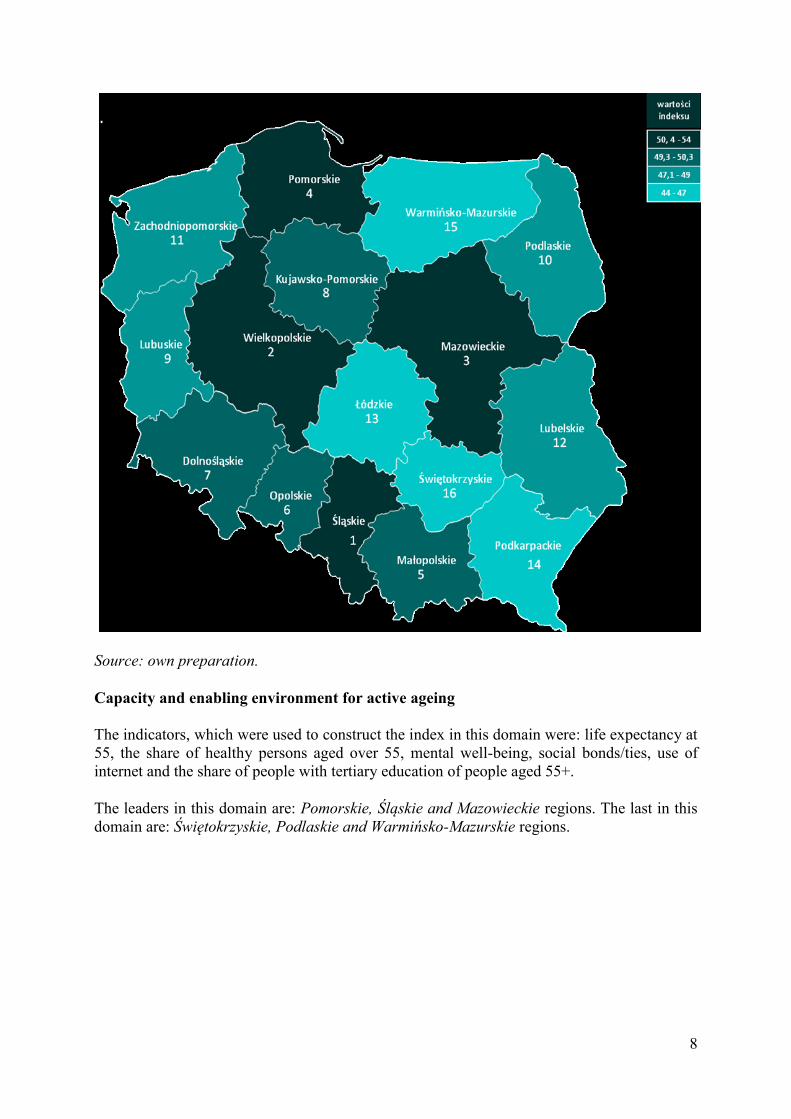
Source: own preparation.
Capacity and enabling environment for active ageing
The indicators, which were used to construct the index in this domain were: life expectancy at
55, the share of healthy persons aged over 55, mental well-being, social bonds/ties, use of
internet and the share of people with tertiary education of people aged 55+.
The leaders in this domain are: Pomorskie, Śląskie and Mazowieckie regions. The last in this
domain are: Świętokrzyskie, Podlaskie and Warmińsko-Mazurskie regions.
9
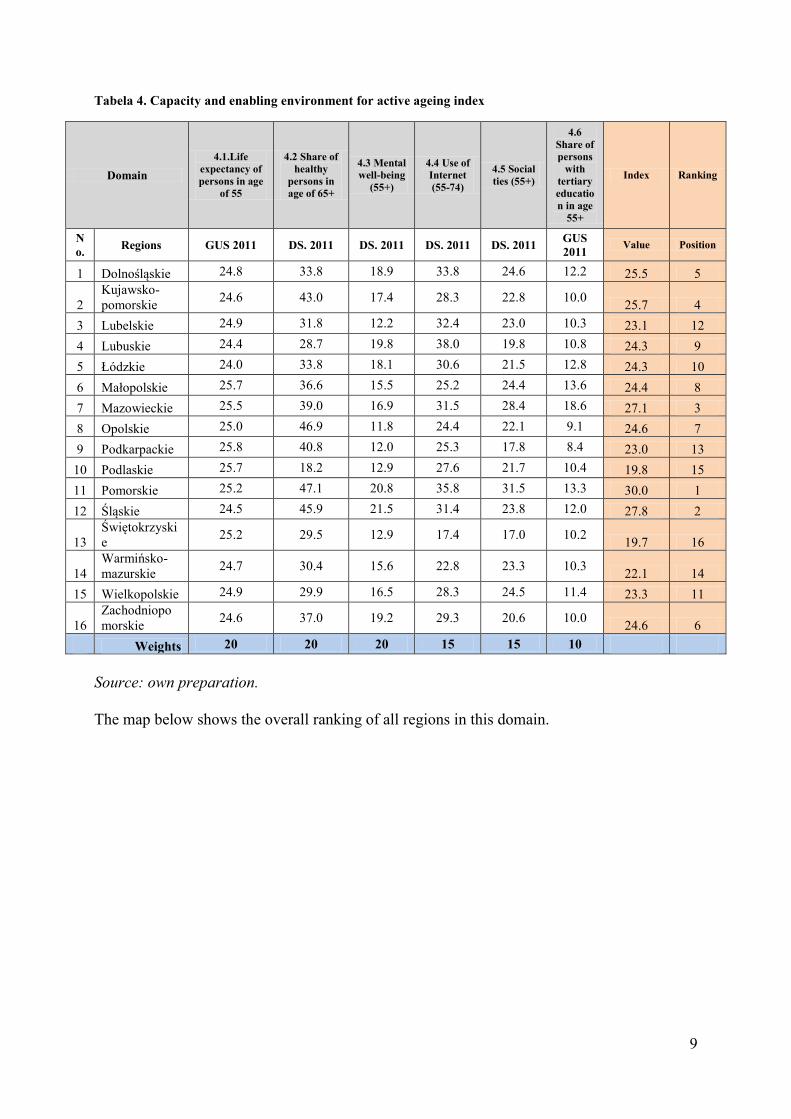
Tabela 4. Capacity and enabling environment for active ageing index
Domain
4.1.Life
expectancy of
persons in age
of 55
4.2 Share of
healthy
persons in
age of 65+
4.3 Mental
well-being
(55+)
4.4 Use of
Internet
(55-74)
4.5 Social
ties (55+)
4.6
Share of
persons
with
tertiary
educatio
n in age
55+
Index Ranking
N
o. Regions GUS 2011 DS. 2011 DS. 2011 DS. 2011 DS. 2011
GUS
2011 Value Position
1 Dolnośląskie 24.8 33.8 18.9 33.8 24.6 12.2 25.5 5
2
Kujawsko-
pomorskie 24.6 43.0 17.4 28.3 22.8 10.0
25.7 4
3 Lubelskie 24.9 31.8 12.2 32.4 23.0 10.3 23.1 12
4 Lubuskie 24.4 28.7 19.8 38.0 19.8 10.8 24.3 9
5 Łódzkie 24.0 33.8 18.1 30.6 21.5 12.8 24.3 10
6 Małopolskie 25.7 36.6 15.5 25.2 24.4 13.6 24.4 8
7 Mazowieckie 25.5 39.0 16.9 31.5 28.4 18.6 27.1 3
8 Opolskie 25.0 46.9 11.8 24.4 22.1 9.1 24.6 7
9 Podkarpackie 25.8 40.8 12.0 25.3 17.8 8.4 23.0 13
10 Podlaskie 25.7 18.2 12.9 27.6 21.7 10.4 19.8 15
11 Pomorskie 25.2 47.1 20.8 35.8 31.5 13.3 30.0 1
12 Śląskie 24.5 45.9 21.5 31.4 23.8 12.0 27.8 2
13
Świętokrzyski
e 25.2 29.5 12.9 17.4 17.0 10.2
19.7 16
14
Warmińsko-
mazurskie 24.7 30.4 15.6 22.8 23.3 10.3
22.1 14
15 Wielkopolskie 24.9 29.9 16.5 28.3 24.5 11.4 23.3 11
16
Zachodniopo
morskie 24.6 37.0 19.2 29.3 20.6 10.0
24.6 6
Weights 20 20 20 15 15 10
Source: own preparation.
The map below shows the overall ranking of all regions in this domain.
10
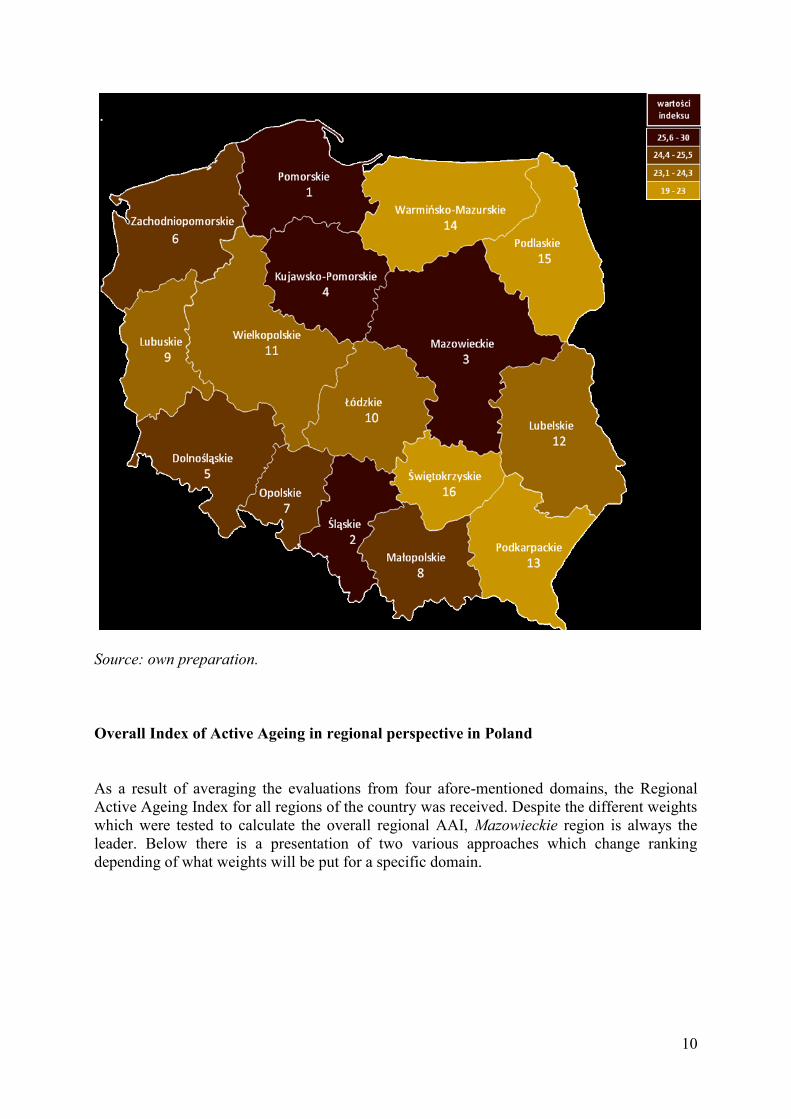
Source: own preparation.
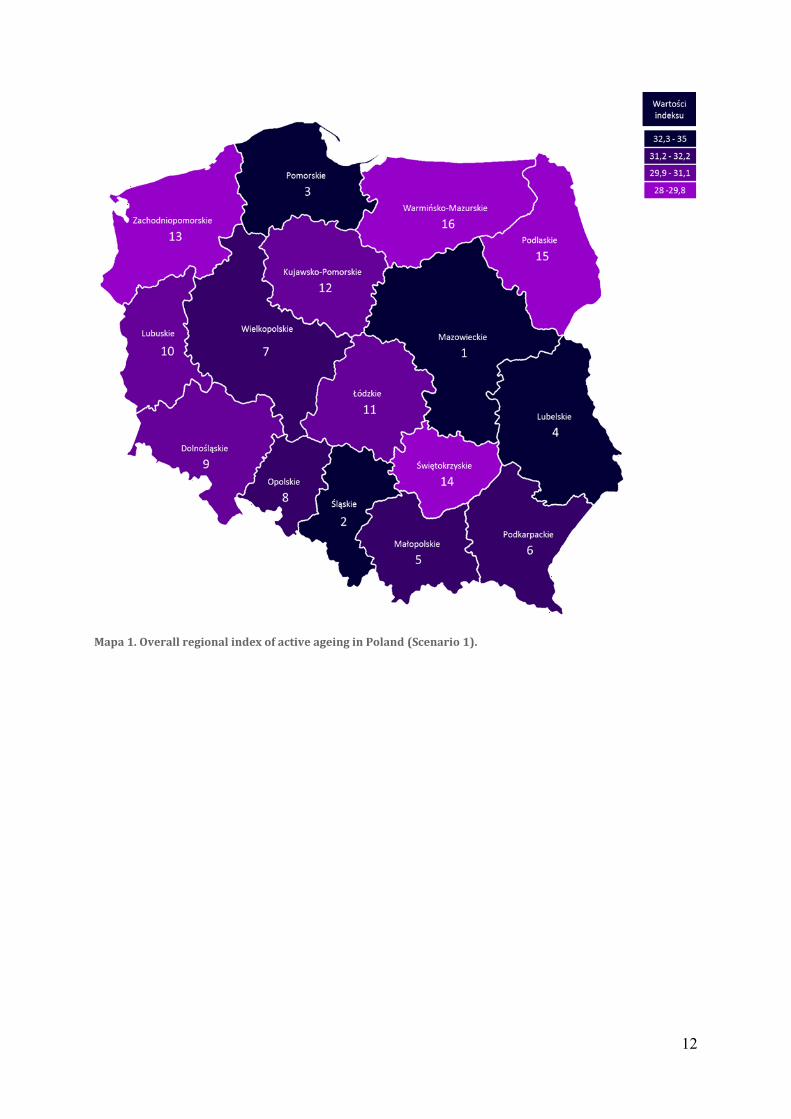
Overall Index of Active Ageing in regional perspective in Poland
As a result of averaging the evaluations from four afore-mentioned domains, the Regional
Active Ageing Index for all regions of the country was received. Despite the different weights
which were tested to calculate the overall regional AAI, Mazowieckie region is always the
leader. Below there is a presentation of two various approaches which change ranking
depending of what weights will be put for a specific domain.
11
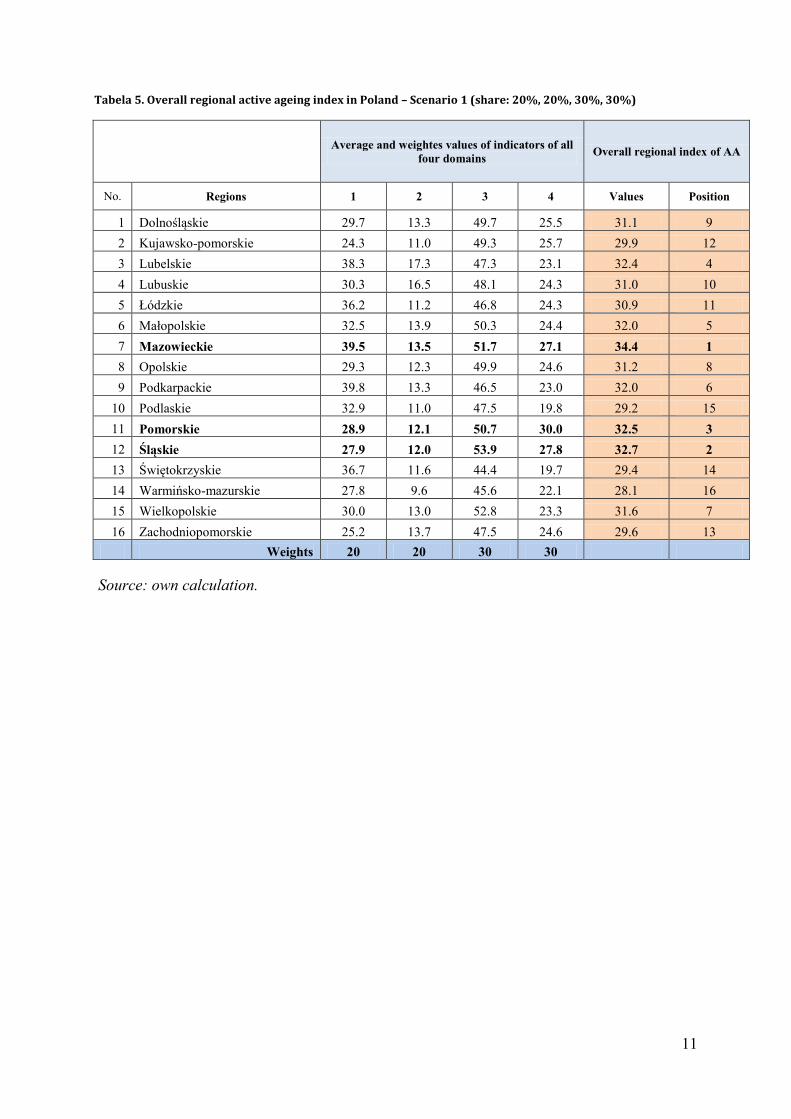
Tabela 5. Overall regional active ageing index in Poland – Scenario 1 (share: 20%, 20%, 30%, 30%)
Average and weightes values of indicators of all
four domains Overall regional index of AA
No. Regions 1 2 3 4 Values Position
1 Dolnośląskie 29.7 13.3 49.7 25.5 31.1 9
2 Kujawsko-pomorskie 24.3 11.0 49.3 25.7 29.9 12
3 Lubelskie 38.3 17.3 47.3 23.1 32.4 4
4 Lubuskie 30.3 16.5 48.1 24.3 31.0 10
5 Łódzkie 36.2 11.2 46.8 24.3 30.9 11
6 Małopolskie 32.5 13.9 50.3 24.4 32.0 5
7 Mazowieckie 39.5 13.5 51.7 27.1 34.4 1
8 Opolskie 29.3 12.3 49.9 24.6 31.2 8
9 Podkarpackie 39.8 13.3 46.5 23.0 32.0 6
10 Podlaskie 32.9 11.0 47.5 19.8 29.2 15
11 Pomorskie 28.9 12.1 50.7 30.0 32.5 3
12 Śląskie 27.9 12.0 53.9 27.8 32.7 2
13 Świętokrzyskie 36.7 11.6 44.4 19.7 29.4 14
14 Warmińsko-mazurskie 27.8 9.6 45.6 22.1 28.1 16
15 Wielkopolskie 30.0 13.0 52.8 23.3 31.6 7
16 Zachodniopomorskie 25.2 13.7 47.5 24.6 29.6 13
Weights 20 20 30 30
Source: own calculation.
12
Mapa 1. Overall regional index of active ageing in Poland (Scenario 1).

13
Tabel 6. Overall regional index of active ageing as the original weighting system as in the Active Ageing
Index – Scenario 2 - (Zaidi et al., 2013)
Regions
Average and weightes values of indicators
of all four domains
Overall regional index of
AA
1 2 3 4 Value Ranking
1 Dolnośląskie 29.7 13.3 49.7 25.6 25.1 9
2 Kujawsko-pomorskie 24.3 11.0 49.3 26.7 22.6 15
3 Lubelskie 38.3 17.3 47.3 23.7 28.9 2
4 Lubuskie 30.3 16.5 48.1 24.1 26.0 6
5 Łódzkie 36.2 11.2 46.8 24.7 26.2 5
6 Małopolskie 32.5 13.9 50.3 25.5 26.4 4
7 Mazowieckie 39.5 13.5 51.7 27.5 29.2 1
8 Opolskie 29.3 12.3 49.9 26.4 24.8 12
9 Podkarpackie 39.8 13.3 46.5 24.8 28.2 3
10 Podlaskie 32.9 11.0 47.5 20.5 24.2 13
11 Pomorskie 28.9 12.1 50.7 30.2 25.5 8
12 Śląskie 27.9 12.0 53.9 28.4 25.0 11
13 Świętokrzyskie 36.7 11.6 44.4 21.5 25.6 7
14 Warmińsko-mazurskie 27.8 9.6 45.6 23.2 22.3 16
15 Wielkopolskie 30.0 13.0 52.8 24.0 25.1 10
16 Zachodniopomorskie 25.2 13.7 47.5 25.4 23.5 14
Weights 35 35 10 20
Source: own preparation.
Reference
ActivAge Consortium, (2008),Overcoming the barriers and seizing the opportunities for
active ageing policies in Europe, International Social Science Journal, 58 (190 December
2006), 617-31.
Ervik R., Linden T., (2013), The Making of Aging Policy: Theory and Practice in Europe,
Edward Elgar Press.
Perek-Białas, J., (2005), Aktywne starzenie. Aktywna starość”, Wyd. AUREUS, Kraków, 2005.
Perek-Białas J., Ruzik A., Vidovicova L., (2006), Active ageing policies in the Czech
Republic and Poland, International Social Science Journal, Special Issue about Active
Ageing, December 2006, No 190, pp. 559-570.
Ruzik A., Perek-Białas J., Turek K., (2013), Did the transition to a market economy and the
EU membership have an impact on active ageing policy in Poland? in ‘The Making of Aging
Policy: Theory and Practice in Europe’, editors R. Ervik, T. Linden, Edward Elgar Press.
14
Walker, A. C., (2002), A strategy for active ageing, International Social Security Review, 55
(1), 121-38.
Walker, A., C., Maltby T., (2012), Active ageing: a strategic policy solution to demographic
ageing in the European Union, International Journal of Social Welfare, 21(S1), 117-30.
WHO, (2002), Active Ageing, A Policy Framework, II UN World Assembly on Ageing.
Zaidi, A., K. Gasior, M.M. Hofmarcher, O. Lelkes, B. Marin, R. Rodrigues, A. Schmidt, P.
Vanhuysse and E. Zolyomi, (2013), ‘Active Ageing Index 2012: Concept, Methodology and
Final Results ‘, Methodology Report Submitted to European Commission’s DG Employment,
Social Affairs and Inclusion, and to Population Unit, UNECE, for the project: ‘Active Ageing
Index (AAI)’, UNECE Grant No: ECE/GC/2012/003, Geneva.