Refranchising Melbourne’s metropolitan ... - World Bank
24
Refranchising Melbourne’s metropolitan train and tram networks
Transcript of Refranchising Melbourne’s metropolitan ... - World Bank

Refranchising Melbourne’s metropolitan train and tram networks

Deloitte Touche Tohmatsu ABN 74 490 121 060 180 Lonsdale Street Melbourne VIC 3000 GPO Box 78 Melbourne VIC 3001 Australia DX 111 Tel: +61 (0) 3 9208 7000 Fax: +61 (0) 3 9208 7001 www.deloitte.com.au
Review of the Department of Infrastructure value for money assessment of private involvement in the Melbourne metropolitan train and tram networks Deloitte Touche Tohmatsu were engaged to review the Department of Infrastructure’s (“DOI”) value for money assessment of the private involvement in the Melbourne metropolitan train and tram networks (the “DOI Assessment”), including the accuracy of information and the assumptions and data underlying the conclusions presented. Scope and work performed The work performed by Deloitte was a high-level, exceptions-based review conducted in accordance with Australian Auditing Standard AUS 110, comprising primarily of inquiries of relevant personnel, and inspection, on a sample basis, of evidence and supporting documentation and analysis. Deloitte did not provide comment or opinion on the DOI Assessment or its conclusions, but rather performed certain procedures to identify whether the interviews conducted and sample data that Deloitte reviewed revealed any inconsistencies with the DOI Assessment, its assumptions or conclusions. Conclusion In July 2007, Deloitte stated in our report that “based on the work which we have performed, nothing has come to our attention that would cause us to believe that, in all material respects, the key assumptions and statements underpinning the conclusions reached in the DOI Assessment report are inconsistent with the source data referred to in the report.” Qualifications and limitations Deloitte’s work was performed solely for the benefit of the DOI and may not be relied upon by any other person. The qualifications and limitations of the review performed by Deloitte are explained more fully in our report.
Deloitte Touche Tohmatsu
Liability limited by a scheme approved under Professional Standards Legislation.

Contents
Section 1: Introduction 5
Section 2: Cost to the State 7
Section 3: Risk Allocation 11
Section 4: Franchisees’ performance since contract commencement 12
Section 5: Overall Summary 23
This report has been produced by the Department of Infrastructure.

Melbourne Public Transport Overview Metropolitan Rail Franchising 20074

5
The train and tram network has now been operated by the private sector for more than seven years. The Franchise Agreements with Connex (operating Melbourne’s train system under contract to the Government) and with Yarra Trams (for the tram system) expire in November 2008. The Government therefore needs to decide whether and in what form to retain private sector involvement in the operation of train and tram services. In particular, it must decide whether private sector involvement in service delivery provides a value for money outcome to the State.
This document:
• setsoutaframeworkbywhichtodefine value for money;
• laysoutadefinitionbywhichtoquantify value since contract commencement in 2004;
• assessesperformanceofthe incumbent since contract commencement against that framework and definition; and
• drawsaconclusionaboutwhethervalue for money has been achieved.
Framework for assessing value for money within the current arrangements
The framework for this review will use the same parameters used by the Auditor General in the 2005 review of the re-franchising process – cost to the State, risk allocation and performance. The Auditor General reviewed the payments the government negotiated with the train and tram franchisees and assessed the allocation of risks within the franchise agreements. This review will also focus on the way the franchisees have managed risks through their performance in operating the network since 2004.
To determine value for money the following components have been assessed:
• CosttotheState– Outline of the approach taken by the State in the re-franchising process to establish the operator subsidy level Review of the Auditor General’s conclusions with regard to the 2003 process
Assessment of the actual outcome of costs to operate the franchises
• RiskAllocation- Review of the 2004 re-franchising process and the Auditor General’s conclusions about that process
Assessment of the success of the risk transfer in the arrangements
• Performanceofincumbentoperators – Review of the performance of the incumbent operators since 2004 againstBusinessPlanKPIs.
In summary:
• theAuditor-Generalconfirmedin 2005 that the costs, risk allocation and the performance levels negotiated in the franchise agreements in 2003/04 provided ‘reasonable value for money’ for the State;
• thecostofoperatingthemetropolitan train and tram network remains relatively constant when costs are normalised to reflect constant investment in rolling stock;
• theriskstransferredtotheprivate sector have held since contract commencement; and
• theperformanceoftheincumbentoperators has been sound when assessed against the 2004 tenderevaluationcriteriaandKPIsineachfranchiseBusinessPlan.
• theperformanceoftheincumbentoperators has been sound when assessed against the 2004 tenderevaluationcriteriaandKPIsineachfranchiseBusinessPlan;and
Section One: Introduction


7
Re-franchising process 2003/04PublicSectorBenchmarks(PSBs)were developed as part of the re-franchising process to predict the future revenues and costs of operating the two franchises, thereby:
• informingtheGovernmentaboutwhat it would cost an efficient public sector organisation to operate the franchises, in the event that negotiations with incumbents was unsuccessful; and
• allowingtheevaluationofthereasonableness of the offers submitted by Connex and Yarra Trams.
ThePSBsreflectedtheDepartment’s assessment of the most efficient possible means of public sector operation, based on a publicly owned enterprise providing the same scope of services as that demanded of Connex and Yarra Trams.
The model provided for:
• aGovernmentBusinessEnterprise (GBE) governance structure to oversee the development, monitoring and achievement of objectives and provide an accountability framework;
• establishmentofaFranchiseAgreementwithPTD,tomonitorservice delivery and customer service to standards specified; and
• outsourcingofmaintenancetospecialist providers who have a greater level of competency to undertake works and bear operational risk.
Within these parameters the project team developed “raw “ (ie, non-risk-adjusted)PSBsbasedonforecastrevenues and cash costs for the businesses over a seven year period to 2010.
ThePSBscomprised:
• baseestimatesofthemostimportant revenue and cost inputs - including driver costs, infrastructure renewals and maintenance costs, rolling stock costs, and fare revenue;
• competitiveneutralityadjustments - to adjust for advantages or disadvantages accruing to a public operator because of their state ownership (such as the absence of any obligation to pay taxes); and
• transferablerisks–whichwereidentified and valued through a standard “Monte Carlo” risk analysis.
Therisk-adjustedPSBsweredeveloped in accordance with PartnershipsVictoriaGuidelines,with significant risks identified, valued and allocated. Risk parameters and values were then determined and validated in a series of risk workshops, involving Departmental staff and external advisors.
Offers submitted by Connex and Yarra Trams during the course of the negotiations were assessed against a range of pre-defined evaluation criteria. Financial aspects of these bids were assessed in the light ofthePSBs.Comprehensivebidevaluation reports were presented to Cabinet and decisions taken by Ministers, in the light of these reports, on the value-for-money provided in the offers submitted by Connex and Yarra Trams. The analysis in the bid evaluation reports confirmed that, on the basis of the PSBs,areturntopublicoperationwould not offer value-for-money to the State when compared to the arrangements negotiated with the two incumbent franchisees.
Section Two: Cost to the State

Melbourne Public Transport Overview Metropolitan Rail Franchising 20078
Auditor-General’s Report – Franchising Melbourne’s train and tram system 2005
The objective of the – Franchising Melbourne’s train and tram system audit was to determine if the renegotiated franchise agreements for the metropolitan train and tram system represented value for money. In particular, the audit sought to determine whether:
• theresponsibleagencieseffectively managed the process of developing the current franchise agreements, so as to ensure value for money, and
• the2004franchiseagreementsadequately took account of the lessons learnt from the 1999 franchiseagreements.[Page4]
The review’s overall conclusion was:
Our overall conclusion is that the current train and tram franchise agreements represent reasonable value for money (assuming that franchisee performance meets contracted levels). [Page 4]
In coming to this conclusion, the Auditor-General assessed value for money by examining the risk transfer in the agreements, the PSBsdevelopedbyDOIandthenegotiating strategy adopted by the Department to complement thePSBs.
The review examined whether DOI’s PSBswereeffectivebydeterminingwhether DOI:
• developedrobustPSBs;and
• usedthePSBseffectivelyduring the offer evaluation and negotiationprocess.[Page67]
To assess this, the Auditor-General developed a “good practice” model basedonareviewofPartnershipsVictoriaguidelinesandpracticesintheUKandotheroverseasjurisdictions. The Auditor-General’s good practice model required that:
• thePSBswereclear,comprehensive and transparent;
• thePSBsmaininputswererobust, accurately applied, validated and endorsed; and
• changesmadetothePSBs,oncethe offer and evaluation and negotiation process commenced, were made in a robust manner. [Page68]
Specifically, the Auditor-General’s review found:
The PSBs were an effective tool in helping the government become an informed purchaser during the renegotiation of the rail franchises. The PSBs were developed in a robust manner, according to good practice, and were effectively used to negotiate the franchisee’s offer. The franchisees’ forecasts were reasonable and consistent with past trends, and their overall offers were financially sustainable. [Page 87].
The report concluded:
Using the benchmarks, DOI effectively negotiated Connex and Yarra Trams offers to within about 3 percent of the relevant public sector benchmark (for trains $1 548 million and for trams - $598 million). [Page 7]
The other component of the Auditor-General’s value for money assessment was whether DOI effectively used other negotiation strategies to achieve a desirable outcome. The Auditor-General identified eight other strategies in additiontothePSBs.Thereviewdetermined that all were either effective or partially so, in delivering the overall objective:
On the whole, DOI had adequate strategies (other than the PSBs) to influence the environment within which negotiations were taking place, and to assess franchisees offers… Throughout the renegotiation process, DOI simulated, as best it could, the competitive pressures of an open book tender process. DOI also used the renegotiation process to establish arrangements whereby the government shares excessive profits made by the franchisees.
By focusing in detail on the Department’s public sector benchmarking process, the Auditor-General took the option of public sector operation fully into account in reaching his conclusion that “the franchise renegotiations resulted in a good outcome for the state”.
PagenumberreferencesrelatetotheAuditorGeneral’sReport

9
Costs of operating the metropolitan train and tram system
The forecast subsidy lines developed as part of the re-franchising process were deemed to be value for money by the Auditor General despite the increase in recurrent funding that occurred as part of the process.
The increase in recurrent funding to franchisees of $1.1 billion over 5 years as part of the re-franchising process was a result of the unsustainable nature of the initial 1999 Agreements, where patronage growth and cost reductions were expected to reap savings of $1.8 billion over the franchise term (12 years of tram, 15 years for train).
The following is DOI’s analysis comparing the costs from 1998/99 with the forecast franchisee subsidyfor2005/06andthe actual payments for that year.
1998/99 Subsidy vs Forecast Subsidy 2005/06 (AG's Report) & 2005/06 Actual
$17.8m difference }
$600.00
$500.00
$400.00
$300.00
$200.00
$100.00
$M
$0
1998/99 Forecast 05/06 AG Report Actual
$m
The1998/99basetotalof$317.8millionincludes:
Base subsidy $280.0 m
Concession fare top-up $30.6m
Revised farebox arrangements $7.1m
State funding 1998/99 $317.8 m
Tocomparethistothe2005/06coststhefollowingitemshavebeenincluded:
Inflation adjustment $74.9m
New rolling stock lease costs – Connex $92.3 m
New rolling stock lease costs – Yarra $39.6m
350 additional staff funded since 1998/99 $26.3m
Revised 1998/99 State Funding $550.9 m
The colours used in these tables relate to the colours used in the bar chart.

Melbourne Public Transport Overview Metropolitan Rail Franchising 200710
The revised total of $550.9 million is approximately $18 million lower than the forecast amount from the Auditor General’s Report for 2005/06andtheactualcostsforthe same year. This difference can be attributed to additional train and tram service kilometres (which have increasedfromapproximately37.21millionperannumto39.79millionper annum since 19991) , expanded role of Metlink, an improved infrastructure maintenance regime, greater expenditure on capital
works and additional initiatives purchased by the State under the New Franchising Arrangements.
The constant nature of costs to operate the train and tram network was borne out in the Auditor General’s review. The chart below shows the cost of operating the networks has remained (and is expected to remain) relatively constant over time, with the exception of the costs of introducing the new rolling stock.
Conclusion
While the cost of operating the metropolitan train and tram network did not reduce in the manner that was originally anticipated by privatisation, both Yarra Trams and Connex have managed costs well under the agreements.
Total metro rail costs - before normalisation adjustment
Total cost of operating Melbourne’s trains and trams ($million per year)
Normalisation total metro rail costs
100
1998-99 1999-00 2000-01 2001-02 2002-03 2003-04 2004-05 2005-06 2006-07 2007-08 2008-09
200
300
400
500
600
700
800
900
The normalisation adjustments are mainly to include constant investment in rolling stock which is consistent with DOI’s analysis.
1 1998/99 figure for tram was based on an estimate using previous years data.

11
Re-franchising process 2003/04
The original 1999 franchising arrangements were characterised by an unsustainable transfer of risk to the franchisees. In the new contracts the Government aimed to provide a more balanced sharing of risk and reward.
In the case of public transport, neither the State nor the franchisees were uniquely able to manage revenue risk and a sharing of risk was deemed to present the most cost-effective solution for both parties.
With this in mind, the Government designed a farebox revenue risk-sharing mechanism, where it would make up some of the shortfall in the event that farebox revenue fell below a threshold level, thereby providing a level of “downside” revenue protection to the franchisees. Conversely, the Government believed that it would be unacceptable for franchisees to earn excessive returns from the operation of publicly owned public transport assets, particularly in the circumstances of single-source negotiations where the State was sharing a significant part of revenue downside risk. It was therefore decided to include a profit-sharing mechanism in the PartnershipAgreementstoenablethe State to share in the benefits if
a franchisee’s financial performance turned out to be much better than expected.
The risks on the cost side of the franchise businesses were more readily manageable by franchisees than those on the revenue side. The key costs in the franchise businesses were labour, maintenance (which itself included a strong element of labour), rolling stock lease payments, capital investment delivery, traction power and corporate overheads. There was no obvious reason why the State would be better placed to control these risks than franchisees, or why it would wish to take them on. It was therefore decided that franchisees should continue to manage most cost-side risks.
Other risks that were transferred to the franchisees included:
• Performancerisk–franchiseeexposure to performance incentive regime and compensation mechanism for particularly poor performance;
• Safety–accreditationandcompliance with regulations;
• Externalparties–industrialrelations risk, supplier and sub-contractor risk;
• Maintenancecondition–infrastructure and rolling stock operability and safety.
Auditor-General’s Report – Franchising Melbourne’s train and tram system 2005
The review noted that risk transfer is central to achieving value for money in public private partnerships, with the aim to transfer significant risks to the private sector, provided it is better placed to manage those risks. The Auditor-General assessed the risk allocation in the context of the experience with the original franchise agreements and national and international experience.
The review noted that risks returned to the State as part of the process due to the unsustainable nature of the original agreements and that this had increased the financial exposure to the State. The Auditor-General concluded:
We consider the allocation of risks in the current franchise agreements to be appropriate. However, DOI should review this allocation to ensure it is appropriate for future metropolitan train and tram arrangements. [Page 62]
Conclusion
The Auditor General concluded that the risk transfer to the private sector was appropriate given the circumstances of the time. Given that no risk has been transferred back to the State since commencement of the existing agreements, both franchisees have met expectations.
Section Three: Risk Allocation

Melbourne Public Transport Overview Metropolitan Rail Franchising 200712
Section Four: Franchisees’ performance since contract commencement April 2005
As noted, the Auditor-General’s review determined that the processes and mechanisms put in place by DOI during the re-franchising process were sufficiently robust to provide for a value for money outcome. Three years since contract commencement, the State is now in a position to review the franchisees’ performance to gain a practical insight of the actual outcomes of the franchising arrangements to determine if they have in fact delivered value for money. DOI has assessed the performance of the incumbents against the key 2004 tender requirements and against specificKeyPerformanceIndicators(KPIs)thatwereincludedinthefranchisees’ business plans.
Yarra Trams - Overview Yarra Trams has maintained accreditation under the Rail Safety Act and demonstrated the competence and capacity to manage the safety risks associated with tram operations.
Yarra Trams have improved the safety of passengers onboard trams by implementing several programs that have reduced collisions and falls on trams, including:
• alldriversundergoanannualrefresher course involving safety theory and practical application,
• allnewdriversundertakedefensive driver training;
• theimplementationofafacilityto record drivers in operation has also provided for visual and objective feedback.
The safety of passengers whilst boarding and alighting is being targeted through several initiatives, the effectiveness of which is still under review. These initiatives have included road markings to increase the visibility of stops, additional lighting on trams (and illuminated signage) and amendment to road rules when driving with trams. Yarra Trams has been working in partnershipwithVicRoadsandtheDepartment of Infrastructure to implement these initiatives. The safety brochure ‘Your Safety is OurPriority’hasbeendevelopedto advise passengers and the elderly of best practices to ensure personal safety. Personalsafetyofpassengersis being addressed by the ‘Love Your Trams’ campaign launched inJanuary2007.ThispartnershipwiththeVictorianpoliceprovidesfor plain clothed police to ride on trams, and encouraged passengers to report instances of graffiti and vandalism.
Safety - Yarra Trams
Evaluation Criteria
KPI Planned KPI Movement at end 2006/07 (compared to 2004/05^ target)
Actual KPI Movement for 2006/07 (YTD to end of March)
Safety Collisions Reduce 18% Reduced 24%
Falls on Trams Reduce 12% Reduced26%
Lost Time Injuries Reduce 45% Reduced 45%
Yarra Trams’ target for 2004/05 in all cases was improved from the existing network conditions.
13
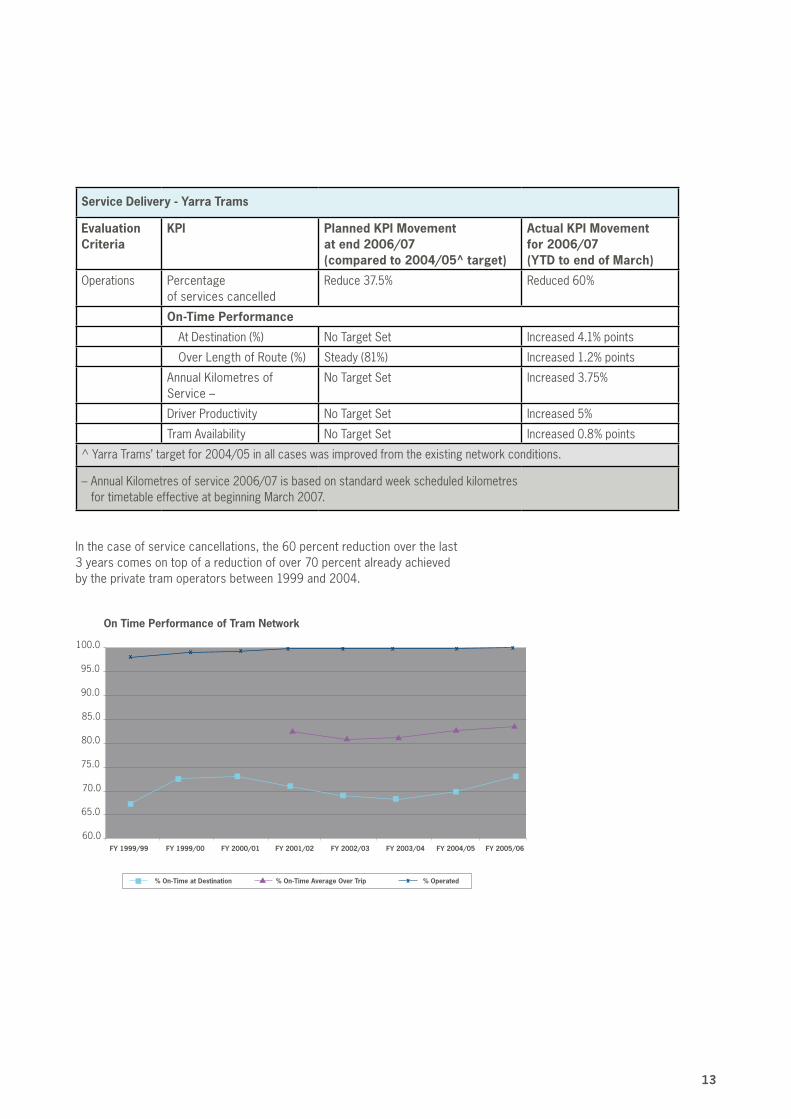
Service Delivery - Yarra Trams
Evaluation Criteria
KPI Planned KPI Movement at end 2006/07 (compared to 2004/05^ target)
Actual KPI Movement for 2006/07 (YTD to end of March)
Operations Percentage of services cancelled
Reduce37.5% Reduced60%
On-Time Performance
At Destination (%) No Target Set Increased 4.1% points
Over Length of Route (%) Steady (81%) Increased 1.2% points
AnnualKilometresofService –
No Target Set Increased3.75%
DriverProductivity No Target Set Increased 5%
Tram Availability No Target Set Increased 0.8% points
^ Yarra Trams’ target for 2004/05 in all cases was improved from the existing network conditions.
– AnnualKilometresofservice2006/07isbasedonstandardweekscheduledkilometres fortimetableeffectiveatbeginningMarch2007.
On Time Performance of Tram Network
60.0
65.0
70.0
75.0
80.0
85.0
90.0
95.0
100.0
FY 1999/99 FY 1999/00 FY 2000/01 FY 2001/02 FY 2002/03 FY 2003/04 FY 2004/05 FY 2005/06
% On-Time at Destination % On-Time Average Over Trip % Operated
xx
x
x x x x x x
Inthecaseofservicecancellations,the60percentreductionoverthelast 3yearscomesontopofareductionofover70percentalreadyachieved by the private tram operators between 1999 and 2004.

Melbourne Public Transport Overview Metropolitan Rail Franchising 200714
It should also be noted that comparisons of service performance with data prior to 1999 are problematic due to changed reporting mechanisms. The specific performance since re-franchising is illustrated below.
1.8
1.6
1.4
1.2
1.0
0.8
0.6
0.4
0.2
Apr May Jun Jul Aug
1998/99
2004/05
2005/06
2006/07
Sep Oct Nov Dec Jan Feb Mar
1st Year Franchise (2004) 2nd Year Franchise (2005) 3rd Year Franchise (2006) Average % Services Cancelled 1998/99
Service Delivery on Tram Network (% of services cancelled)
% S
ched
uled
Ser
vice
s C
ance
lled
Service Delivery was adversely affected on 2, 3, and 4 February 2005 by a severe storm. Excluding these dates the overall cancellation rate was 0.9% for February 2005.
95.0
93.0
91.0
89.0
87.0
85.0
83.0
81.0
79.0
77.0
75.0Apr May Jun Jul Aug Sep Oct Nov Dec Jan Feb Mar
On-time Performance of Tram Network
% O
n-tim
e
1st Year (2004/05) 3rd Year (2006/07)2nd Year (2005/06)
TrampunctualityinMarch2007wasaffectedbytheflow-onimpacts oftheBurnleyTunnelaccidentintheperiod23-27March2007.
Some extra tram services were operated in this period to ease commuter pressure.

15
There has been a small improvement in the punctuality of the tram network since contract commencement. This improvement has been largely constrained due to shared road conditions of the network with approximately 80% of the network operating in mixed traffic environment.
Keyinputsforreliableandpunctualservices are driver productivity and availability and fleet availability. Improvements in driver outcomes have included:
• improvedefficiencyofdriverrostering of 3% since Yarra took over the M>Tram network.
• theintroductionof‘AbsenteeismCommittees’ for sick leave and work cover incidents at all eight tram depots have resulted in improvements of 32% on pre-privatisation levels.
• asubstantialdeclineintheLostTime Injury Frequency Rate from 39.4 per month at privatisation toanaverageof5.6permonthin2006/07(toendMarch2007).
Yarra Trams has presided over a substantial reduction in infrastructure related delays with these incidents reducing 53% in 2005/06comparedwith2004/05.
Facilities upgrades have included:
• thedevelopmentoftheSouthMelbourne operations centre which provides live picture feeds from the network enabling management to respond more readily to incidents, diverting trams where necessary to avoid tram bunching;
• YarraTrams’controlcentrehasalsobeenconnectedtoVicRoadstraffic control centre and cameras to help Yarra manage traffic incidents, with tram priority protocols agreed
• theintroductionofCAMS–acomputerised asset management system for rolling stock and infrastructure;
• togetherwiththeDepartmentofinfrastructure, build a strategy fortheredevelopmentofPrestonDepot (as part of a greater depot strategy in conjunction with the tram procurement program) to enable enhanced maintenance capabilities and efficiencies.
Tram availability while improving slightly has remained below Yarra’s target over the past 12 months. A number of tram upgrade/refurbishment programs have been completed including refurbishment of A, B and Z3 Classtrams(316trams),andmini-refurbishment of Z1/Z2 Class (31 trams). Collision repairs are being undertaken in-house by Yarra Trams to reduce the down-time of vehicles out of service from these incidents.
The need for greater control over fleet deployment is becoming more critical as the tram fleet size is a fixed resource until new trams are introduced in 2010/11. This is being addressed at depot level by ensuring larger capacity vehicles are specifically targeted to individual trips during peak periods to cater for loading patterns.
Asset management - Yarra Trams
Evaluation Criteria
KPI Planned KPI Movement at end 2006/07 (compared to 2004/05^ target)
Actual KPI Movement for 2006/07 (YTD to end of March)
Asset Management Autopoint Faults No Target Set Reduced62%
Derailments (Mainline+Depot)
No Target Set Reduced56%
AVMSystemFaults No Target Set Reduced27%**
ActualKPImovementcalculationisdifferenttoperiodspecifiedintableheadingforderailmentsandAVMSystemfaults.
**AVMSystemfaults–July–March2005/06toJuly-March2006/07
Melbourne Public Transport Overview Metropolitan Rail Franchising 200716
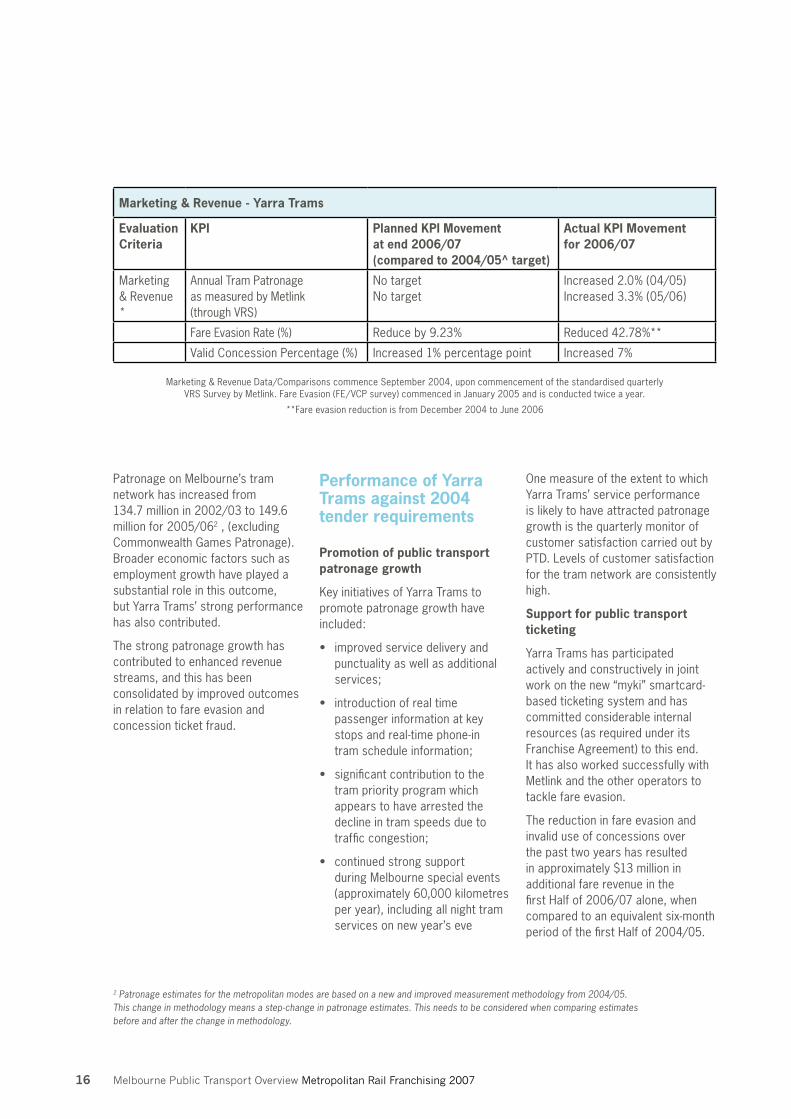
Marketing & Revenue Data/Comparisons commence September 2004, upon commencement of the standardised quarterly VRSSurveybyMetlink.FareEvasion(FE/VCPsurvey)commencedinJanuary2005andisconductedtwiceayear.
**FareevasionreductionisfromDecember2004toJune2006
PatronageonMelbourne’stramnetwork has increased from 134.7millionin2002/03to149.6millionfor2005/062 , (excluding CommonwealthGamesPatronage).Broader economic factors such as employment growth have played a substantial role in this outcome, but Yarra Trams’ strong performance has also contributed.
The strong patronage growth has contributed to enhanced revenue streams, and this has been consolidated by improved outcomes in relation to fare evasion and concession ticket fraud.
Performance of Yarra Trams against 2004 tender requirements
Promotion of public transport patronage growth
KeyinitiativesofYarraTramstopromote patronage growth have included:
• improvedservicedeliveryandpunctuality as well as additional services;
• introductionofrealtimepassenger information at key stops and real-time phone-in tram schedule information;
• significantcontributiontothetram priority program which appears to have arrested the decline in tram speeds due to traffic congestion;
• continuedstrongsupportduring Melbourne special events (approximately60,000kilometresper year), including all night tram services on new year’s eve
One measure of the extent to which Yarra Trams’ service performance is likely to have attracted patronage growth is the quarterly monitor of customer satisfaction carried out by PTD.Levelsofcustomersatisfactionfor the tram network are consistently high.
Support for public transport ticketing
Yarra Trams has participated actively and constructively in joint work on the new “myki” smartcard-based ticketing system and has committed considerable internal resources (as required under its Franchise Agreement) to this end. It has also worked successfully with Metlink and the other operators to tackle fare evasion.
The reduction in fare evasion and invalid use of concessions over the past two years has resulted in approximately $13 million in additional fare revenue in the firstHalfof2006/07alone,whencompared to an equivalent six-month period of the first Half of 2004/05.
Marketing & Revenue - Yarra Trams
Evaluation Criteria
KPI Planned KPI Movement at end 2006/07 (compared to 2004/05^ target)
Actual KPI Movement for 2006/07
Marketing & Revenue *
AnnualTramPatronage as measured by Metlink (throughVRS)
No target No target
Increased 2.0% (04/05) Increased3.3%(05/06)
Fare Evasion Rate (%) Reduce by 9.23% Reduced42.78%**
ValidConcessionPercentage(%) Increased 1% percentage point Increased7%
2 Patronage estimates for the metropolitan modes are based on a new and improved measurement methodology from 2004/05. This change in methodology means a step-change in patronage estimates. This needs to be considered when comparing estimates before and after the change in methodology.

17
Quality of asset management
Yarra Trams obligations to maintain the infrastructure are set out in the Infrastructure Lease. Under this Lease Yarra Trams has committed to undertake a minimum amount of maintenance renewal as well as to carry out day-to-day maintenance in line with a rolling three year asset maintenance plan and annual works plan.
Yarra Trams has undertaken more renewals than required under the Lease although not every item is ahead of schedule. In particular, it has renewed considerably more track than was anticipated in 2004 withsome3.64morekilometresof track and 12 more crossings and turnouts completed than contractually required.
As noted earlier, Yarra Trams have also implemented a number of facility upgrades to better manage assets.
Supporting the State’s vision for public transport
Commencing in 2004, Government funding under the Think Tram program was provided for works over two years to deliver improved travel times, punctuality and safety along some of the busiest corridors on the tram network. Whilst managedbyVicRoadsitisoverseenby a TaskForce comprising the DirectorofPublicTransportandtheCEOsofVicRoadsandYarraTrams.The fundamentals of the Think Tram program is to provide greater priority to trams on roads through physical separation, traffic signal priority, changes in road rules, or a combination of these.
Yarra Trams have also been instrumental in the development of aStKildaRoadstrategy,includingthe possibility of a 3rd track to improve operations along the busiest tram corridor (over 1500 scheduled services per day) and improving tram punctuality and travel times. A specialist from Transdev has been seconded to assist in a review of StKildaRoadtramroutes(2nd/3rdquarter2007/08)toimproveoperational efficiencies and levels of service.
In addition to these the State also requires partnership in relation to the impending implementation of the Meeting Our Transport Challenges (MOTC) program. The first of the MOTC programs was implementedinSeptember2006with the commencement of late night tram services. Yarra Trams has also seconded a specialist resource from Transdev to assist with the tram procurement program (MOTC) and associated depot strategy, which is scheduled to bring new vehicles into service from 2010/11.

Melbourne Public Transport Overview Metropolitan Rail Franchising 200718
Safety - Connex
KPI Planned KPI Movement at end 2006/07 (compared to 2004/05 target)
Actual KPI Movement (YTD)
•NumberofSignalIncidents(SPADs)*
Decrease6.7% Decrease 32%
•Overallcustomersatisfaction with personal safety
Increase 2% points Decrease 1.4%
•Losttimeinjuries No target set Decrease by 33%
*SPADsisSignalsPassedatDanger–July2006–February2007
Connex has maintained accreditation under the Rail Safety Act and demonstrated the competence and capacity to manage the safety risks associated with rail operations.
Connex initiatives to improve safety have included:
• areviewofsignalsightingandreliability and commenced a program of signalling and infrastructure improvements
• refreshercoursesfordriverswhich include issues of signal sighting and response.
Patronage & Revenue - Connex
KPI Planned KPI Movement at end 2006/07 (compared to 2004/05 target)
Actual KPI Movement (YTD)
•Annualpatronagegrowth(%)–retaining current customers and gaining recruits
Increase 5.3% Increase24.6%
•Fareboxgrowth(%) Increase16.4% Increase 30.4%
•Fareevasion No target set Decreased by 29%
The percentage growth between 2003/04and2005/06wasupto20%, rising from around 134 million to162millionpassengersperannum.In2006alone,patronagegrowthwas estimated at 11%, which is about three times the annual growth of the past decade.
Significant rises in petrol prices in mid-2005 fuelled some of this growth, although continued growth more recently when petrol prices have fallen, suggests that other factors, including good operational performance during the Commonwealth Games may have had an impact.
Connex - Overview

19
*July–Feb2006/07comparedtoJuly–Feb2004/05
A train considered on time when arriving between 59 seconds early and 5 minutes 59 seconds late.
The chart below illustrates punctuality and reliability of the metropolitan train system since 1991/92 and is included to highlight the broad trends in service delivery. It is also important to note that
the Department has reviewed data andconsultedseniorPTCandMTA executives from this period to confirm that the parameters for punctuality have remained unchanged over this period.
Service Delivery - Connex
KPI Planned KPI Movement end 2006/07 (compared to 2004/05 target)
Actual KPI Movement (YTD)
•Punctuality(%ofscheduledservices on-time)
Increase 0.5% points Decrease1.46%points*
•Cancellations(%ofscheduledservices that did not run)
Decrease 0.35% points Increase0.34%points**
•Trainavailability No target set Increasedby7.06%
86.0%
88.0%
90.0%
92.0%
94.0%
96.0%
98.0%
100.0%
91/92 92/93 93/94 94/95 95/96 96/97 97/98 98/99 99/00 00/01 01/02 02/03 03/04 04/05 05/06 Feb-07
Year
Punctuality Reliability
PTC Corporatisatio
20% increase in patronage
Punctuality & reliability of the metropolitan train system - 1991/92 to Feb 2007

Melbourne Public Transport Overview Metropolitan Rail Franchising 200720
Reliability of train services has remained relatively stable between 98% and 100%. Improvements to train punctuality that began in the mid 1990’s continued in the initial period of privatisation with on-time performance improving from around 94%to97%.
Since the Re-franchising process in 2004, reliability has remained stable, with the exception of some incidents such as the difficulties with the Siemens rolling stock. While reliability has fluctuated between 98% and 100%, there has been a declining trend in punctuality performance over the period.
Train Cancellations (%)
0.0%
0.5%
1.0%
1.5%
2.0%
2.5%
3.0%
3.5%
Apr-04 Jun-04 Aug-04 Oct-04 Dec-04 Feb-05 Apr-05 Jun-05 Aug-05 Oct-05 Dec-05 Feb-06 Apr-06 Jun-06 Aug-06 Oct-06 Dec-06 Feb-07
Month
Percent
Cancellations (%) Cancellations (Business Plan)
Cancellations (passenger compensation)
Train Punctuality (%)
90.0%
91.0%
92.0%
93.0%
94.0%
95.0%
96.0%
97.0%
98.0%
99.0%
100.0%
Apr-04 Jun-04 Aug-04 Oct-04 Dec-04 Feb-05 Apr-05 Jun-05 Aug-05 Oct-05 Dec-05 Feb-06 Apr-06 Jun-06 Aug-06 Oct-06 Dec-06 Feb-07
Month
Percent
Punctuality (%) Punctuality (Business Plan) Punctuality (passenger compensation)
21
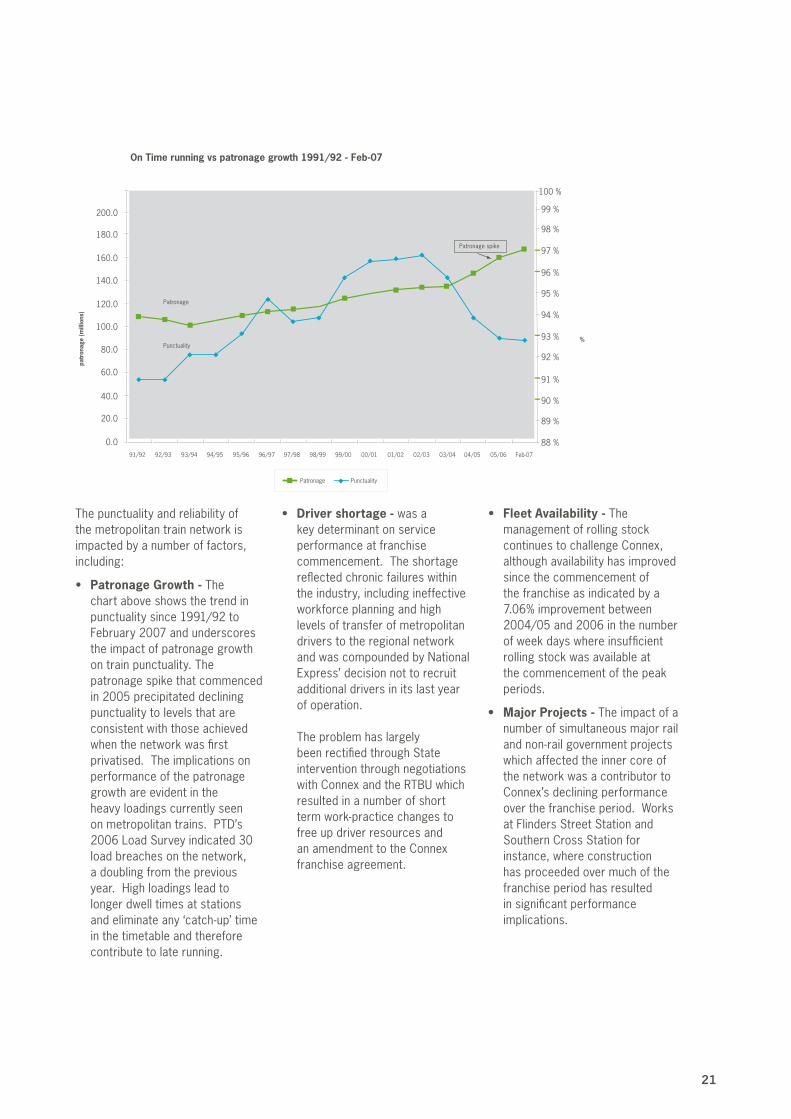
The punctuality and reliability of the metropolitan train network is impacted by a number of factors, including:
• Patronage Growth - The chart above shows the trend in punctuality since 1991/92 to February2007andunderscoresthe impact of patronage growth on train punctuality. The patronage spike that commenced in 2005 precipitated declining punctuality to levels that are consistent with those achieved when the network was first privatised. The implications on performance of the patronage growth are evident in the heavy loadings currently seen onmetropolitantrains.PTD’s2006LoadSurveyindicated30load breaches on the network, a doubling from the previous year. High loadings lead to longer dwell times at stations and eliminate any ‘catch-up’ time in the timetable and therefore contribute to late running.
• Driver shortage - was a key determinant on service performance at franchise commencement. The shortage reflected chronic failures within the industry, including ineffective workforce planning and high levels of transfer of metropolitan drivers to the regional network and was compounded by National Express’ decision not to recruit additional drivers in its last year of operation. The problem has largely been rectified through State intervention through negotiations with Connex and the RTBU which resulted in a number of short term work-practice changes to free up driver resources and an amendment to the Connex franchise agreement.
• Fleet Availability - The management of rolling stock continues to challenge Connex, although availability has improved since the commencement of the franchise as indicated by a 7.06%improvementbetween2004/05and2006inthenumberof week days where insufficient rolling stock was available at the commencement of the peak periods.
• MajorProjects- The impact of a number of simultaneous major rail and non-rail government projects which affected the inner core of the network was a contributor to Connex’s declining performance over the franchise period. Works at Flinders Street Station and Southern Cross Station for instance, where construction has proceeded over much of the franchise period has resulted in significant performance implications.
180.0
200.0
98 %
99 %
100 %
97 %
96 %
95 %
94 %
93 % %
92 %
91 %
90 %
89 %
88 %
160.0
140.0
120.0
100.0
80.0
60.0
40.0
20.0
0.091/92 92/93 93/94 94/95 95/96 96/97 97/98 98/99 99/00 00/01 01/02 02/03 03/04 04/05 05/06 Feb-07
On Time running vs patronage growth 1991/92 - Feb-07
patr
onag
e (m
illio
ns)
PunctualityPatronage
Patronage
Punctuality
Patronage spike

Melbourne Public Transport Overview Metropolitan Rail Franchising 200722
Performance of Connex against 2004 tender requirements
Promotion of public transport growth
While external factors have clearly been a key component of the patronage growth that has occurred on the train network, the company has implemented initiatives to assist with this goal.
One of the most successful and innovative of these has been the SMS update which is a phone based service which advises subscribers when train services have been disrupted cancelled or delayed by more than 15 minutes.
Support for public transport ticketing
Connex has co-operated fully with the Government in the development of myki. It has been actively engaged in planning for the civil works at stations, in the development of myki training and in determining the changes which may be required to revenue protection policy under the new system.
At the same time Connex has worked successfully with Metlink and the other operators to tackle fare evasion. The reduction in fare evasion and invalid use of concessions over the past two years has resulted in approximately $3.2 million in additional fare revenue.
Quality of asset management
Connex’s obligations to maintain the infrastructure are set out in the Infrastructure Lease. Under this Lease, Connex is required to undertake a specified level of asset renewals as well as to carry out day to day maintenance in line with a rolling three year asset maintenance plan and annual works plan.
Connex has had a mixed performance in relation to their maintenance and renewal obligations proscribed in the Infrastructure Lease, although in several areas they have undertaken more renewals than required under the Lease. Examples of enhanced performance include renewal of eight more train stations, re-asphalting of five more station platforms and the installation of 931 more overhead structure anti-climbing devices than were originally planned in the Lease.
Supporting the State’s vision for public transport
When Connex took over the operation of the whole train system in 2004 the State’s key strategic needs were:
•asmoothtransitionoftheformerNational Express operations;
•thesuccessfuloperationoftrainservices during the Commonwealth Games;
•theneedtodeveloparevisedActionPlantomeettherequirementsof disability access legislation, and
•thesuccessfulimplementation of myki.
In addition to these the State also requires partnership in relation to the impending implementation of MOTC.
The integration of Connex and the former M>Train business was managed well by Connex in difficult circumstances. Challenges were faced in integrating the Comeng train fleet as well as driver shortages, a problem due, at least in part, to a failure by National Express to recruit drivers in its final year of operation.
Connex also delivered excellent performance during the Commonwealth Games delivering an additional 3,800 services with 99.8% reliability.

23
In summary:
• theAuditor-Generalconfirmedin 2005 that the costs, risk allocation and the performance levels negotiated in the franchise agreements in 2003/04 provided ‘reasonable value for money’ for the State;
• thecostofoperatingthemetropolitan train and tram network remains relatively constant when costs are normalised to reflect constant investment in rolling stock;
• theriskstransferredtotheprivate sector have held since contract commencement; and
• theperformanceoftheincumbentoperators has been sound when assessed against the 2004 tenderevaluationcriteriaandKPIsineachfranchiseBusinessPlan.
Section Five: Overall Summary

For further information please contact the Department of Infrastructure on 9655 6000 or visit www.doi.vic.gov.au
Published and authorised by the Department of Infrastructure, 80 Collins Street, Melbourne, Victoria. July 2007 © State of Victoria.
Printed by Impact Digital, 32 Syme Street, Brunswick, Victoria, 3056
If you would like to receive this publication in an accessible format, please telephone Public Affairs Branch on 9655 6000.
DO
I312
9/07