Reframing GMs Strategy 1909 -1940: A Financialized Account
28
1 Reframing GM’s Strategy 1909-1940: A Financialized Account Colin Haslam Giuliano Maielli Queen Mary, School of Business and Management University of London This paper is a work in progress. It may not be reproduced, cited, or quoted without the explicit written permission of the author(s). All copyright rights are asserted by the author(s). Abstract This article focuses on resource management at General Motors’ during the period 1909- 1940. It argues that the Chandlerian understanding of the management of physical and financial resources within a decentralised and co-ordinated divisional structure was also infused with significant elements of a financialized business model. This alternative framing reveals how a range of interventions, sponsored by senior GM executives, financialized the management of resources across time and space. A broader understanding of resource management at GM frustrates the use of clear-cut organising stereotypes and it also reveals how ambiguities and contradictions are often in play limiting financial transformation. Key words: General Motors; Strategy and Structure; Financialization.
Transcript of Reframing GMs Strategy 1909 -1940: A Financialized Account

1
Reframing GM’s Strategy 1909-1940: A Financialized Account
Colin Haslam
Giuliano Maielli Queen Mary, School of Business and Management
University of London This paper is a work in progress. It may not be reproduced, cited, or quoted without the explicit written permission of the author(s). All copyright rights are asserted by the author(s). Abstract This article focuses on resource management at General Motors’ during the period 1909-1940. It argues that the Chandlerian understanding of the management of physical and financial resources within a decentralised and co-ordinated divisional structure was also infused with significant elements of a financialized business model. This alternative framing reveals how a range of interventions, sponsored by senior GM executives, financialized the management of resources across time and space. A broader understanding of resource management at GM frustrates the use of clear-cut organising stereotypes and it also reveals how ambiguities and contradictions are often in play limiting financial transformation. Key words: General Motors; Strategy and Structure; Financialization.

2
Introduction
The paper aims to reframe our understanding of General Motors (henceforth GM) during its
formative years from 1909 to 1940. GM holds an iconic place in international business
history as it is one of the American industrial groups at the centre of Chandler's analysis of
the dynamics of managerial capitalism. Significantly, Chandler's work led to a lasting legacy
in contemporary business history, namely the conceptualization and implementation of a
general interpretative paradigm to analyse the emergence and development of modern
industrial capitalism. This revolved around the relation between strategy and structure and
how these elements interconnect in a way that underwrites long-term competitive
industrial groups. Accordingly, it was possible to identify common trajectories and
dynamics. These centred on the implementation of ‘investments’ in productive capacity and
its coordination (multi-divisional structure) and how in combination these would minimize
transaction costs, maximize throughput, and inflate returns on capital. Thus, investments in
minimum efficient size and a separation between ownership and control associated with M-
form organization provide a 'template' upon which to judge the presence of national and
regional trends towards modern economic development (or the lack thereof).
Over the years, empirical research exposed various limitations in Chandler’s work. For
example, the author did not entirely grasp how national differences in institutional
frameworks of corporate governance affect managerial accountability and variations in
scale and scope economies.1 Furthermore, Chandler’s narrative tends to depict the
emergence of multi-divisionalization as the outcome of a “discovery” that suddenly changed
the US economy from the 1910s onwards.2 Nonetheless, empirical research suggests that in
most cases multi-divisionalization was actually the outcome of a path-dependent process of
incremental transformation.3 Finally, Chandler identifies the separation between ownership
1 Steven Toms & John Wilson, “Scale, Scope and Accountability: Towards a new Paradigm of British Business
History,” Business History 45:4 (2010): 1-23. 2 Alfred J. Chandler, Strategy and Structures. Chapters in the History of Industrial Enterprises, (Cambridge
Mass., 1962). 3 John Quail, “Becoming Fully Functional: The Conceptual Struggle for a new Structure for the Giant
Corporation in the US and UK in the First Half of the Twentieth Century,” Business History 50:2 (March 2008): 127–146.

3
and control as the “historical” phenomenon that defines “modern” American industrial
capitalism. Yet, it has been noted that ownership was more separated from control in the
largest stock market of 1911 (London) than in the largest stock market in 1995 (New York).4
Nonetheless, by addressing organizations as evolving institutional forms, Chandler changed
the way corporations were perceived. His analysis implied a business model based on the
coordinated and efficient expansion of physical assets that could achieve efficiency
combined with growth.5 Thus, in spite of its limitation, Chandler’s interpretative framework
still holds substantial currency in business history and business economics. For example,
Lazonick employs a specific interpretation of the ‘Chandlerian’ corporation to construct a
dichotomy between ‘old economy’ business models which are committed to product and
process renewal, employment and reinvestment, and a ‘new economy’ business models
characterized as being ‘financialized’.6 Lazonick argues that the US financialized ‘new
economy’ business model has undermined corporate commitment to product and process
renewal for competitiveness because senior executives are motivated to deliver shareholder
value, distribute excessive amounts of profit and downsize.
In this paper we question whether such a sharp distinction can be established between the
old and new economy financialized business model. Our argument is that many of the
elements of the so-called ‘financialized’ corporate enterprise are present at an early stage in
GM and also within the US corporate sector more generally. To develop our argument we
focus on the early history of GM from 1909 to 1940 and consider to what extent ‘elements’
of financialization and the financialized organization are present or absent during this
period. To develop this investigative position we employ four organizing elements that are
drawn from the financialization literature. Krippner’s observation that financialization is
about the shift from investment and financial accumulation of tangible towards more liquid
and tradable financial assets;7 Lazonick’s observation about how financialized firms
4 James Foreman-Peck & Leslie Hannah, “Some Consequences of the Early Twentieth-Century British Divorce of
Ownership from Control,” Business History 55:4 (2013): 543-564. 5 Quail, “Becoming Fully Functional,” 127.
6 William Lazonick, “Innovative Business Models and Varieties of Capitalism: Financialization
of the U.S. Corporation,” Business History Review 84 (Winter 2010): 675–702. 7 Greta R. Krippner, “The Financialization of the American Economy,” Socio-Economic Review 3 (2005): 2.

4
distribute more profit and sacrifice reinvestment because the financial motivations of senior
executives, driven by their excessive remuneration, closes the agency gap;8 and Froud et al.
who argue that the financialization is about narratives that promise transformation for
shareholder value but bottom line financial results are often disappointing.9
Our findings suggest that many of these ‘financialized’ elements are discernible in GM’s
corporate strategy in terms of the management and deployment of resources and
performativity during the period 1909 to 1940. We note that Chandler frames his analysis of
GM as structure following strategy and the importance therein of the decentralized but co-
ordinated organization for managing expansion and complexity.10 Sloan, in his text My Years
with General Motors, also reinforces the importance of policy formation (strategy) and the
co-ordination of GM’s resource management through ‘co-ordination by committee’ and its
associated use of ‘financial controls’.11 However, Sloan also devotes a chapter to the
General Motors Acceptance Corporation (henceforth GMAC) and the importance of
providing credit finance to customers and another chapter on the creation of, and
investment by, GM into a holding company to underwrite dealership financing and risk
management.12 Both GMAC and the Holding Company were established to facilitate the
conversion of mass-produced outputs into costs recovered and profits realized.
Furthermore, Sloan devotes yet another chapter to ‘incentive compensation’ where the
purpose of a variety of bonus schemes was to ensure senior executives and employees were
‘partners’ sharing in profits and capital gains from stock price increases on the basis of their
contribution to GM’s performance.13 The purpose of these incentive plans was not only to
hold on to or limit senior staff turnover but also align commitment(s) to the financial
interests of stockholders. In the chapter ‘Financial Growth’ Sloan observes that stockholders
were not only beneficiaries of substantial and generous dividends out of income but they
needed to be called upon to provide on-going refinancing.
8 Lazonick, “Innovative Business Models,” 680-685.
9 Julie Froud, Sukhdev Johal, Karel Williams and Adam Leaver, Financialization and Strategy (London, 2006).
10 Chandler, Strategy and Structures.
11 Alfred P. Sloan, John McDonald (ed.), My Years with General Motors (New York, 1964).
12 Ibid.
13 Ibid.

5
Our argument is that the Chandlerian framing of analysis as ‘strategy and structure’ limits
the field of the visible and it is important to look for undisclosed differences and
multiplicities. This would facilitate the development of alternative framing devices that
capture the complexity and often contradictory aspects of business activity as history. In
addition structuring our understanding of corporate affairs within typologies such as ‘old’ or
‘new’, ‘Chandlerian or Financialized’ is not so helpful when accounting for corporate policy
and outcomes. Especially when elements of the either/or are simultaneously present over
time and space. Moreover, the key ingredients of GMs financialized strategy are not
elements that straightforwardly translate into higher returns on investment because
contradictory forces are in play. In the following section we review the framing of Chandler’s
organizing concept of ‘structure and strategy’ before turning to the literature on
financialization and its key organizing elements.
General Motors: Strategy, Structure and Financialization
Chandler’s classic text Strategy and Structures’ and Sloan’s My Years with General Motors
provide a reflective account of the development of GM during its early history.14 These
accounts of GM’s industrial development also provide a more general template upon which
to analyse the emergence and development of modern industrial capitalism. In Chandler’s
work on the modern American corporation the thesis is that carrying out policies to secure
growth in output can be considered as ‘strategy’ and that the ‘organization devised to
administer these enlarged activities and resources, a ‘structure’.15 Thus as the demand for
industrial output expands this, in turn, generates the need for an appropriate structure
which ‘can be defined as the design of the organization through which the enterprise is
administered’.16 An organization’s structure is a response to the need to manage increasing
complexity as volumes increase and geographic dispersion is brought about by the need to
produce and sell into a larger market.
14
Chandler, Strategy and Structures; Sloan, My Years. 15
Chandler, Strategy and Structures, 13. 16
Ibid., 14.

6
Chandler observes that, in the case of GM, the expansion of business volume, mix of
products and geographic span of operations led to problems of organization. ‘The relations
between operating divisions and between the divisions and the general office became more
haphazard, less coordinated, and less supervised than they had been under Storrow and
Nash.’17 This interpretation of events conjoins issues of organization with personality and
leadership. Chandler observed: ‘Although the lack of any effective over-all administrative
structure failed to disturb Durant… it did trouble the du Ponts’.18 The du Ponts made their
move to install changes after their first major investment in GM requesting capital
appropriations be managed in a similar way to that at du Pont. Sloan recalls this change in
approach at the Finance Committee meeting in November of 1919 during which GM
executives had agreed to raise $50 million in debenture stock and a possible additional $50
million. The failure to generate this external funding (only $11 million was raised)
illuminated, according to Sloan, a conflict of realities whereby appropriations of capital
needed to be competed for rather than allocated on the basis of a vote.
The failure to generate external funding and the subsequent collapse in revenues forced GM
into a series of organizational adjustments focused upon the central co-ordination and
management of capital allocations into the divisions, cash control, inventory management
and production control. In each case the responsibility for financial control becomes located
within the Executive and Finance Committee. In turn this committee needed to be furnished
with information about sales, production inventory and cash management and competitive
bids for financial capital working back from a forecast of how many cars GM could be
expected to sell. In terms of facilitating the decentralized responsibilities with co-ordinated
divisional control within GM Sloan observes that the critical element is the financial side of
things.
“It was on the financial side that the last necessary key to decentralization with co-ordinated control was found. That key, in principle, was the concept that, if we had the means to review and judge the effectiveness of operations, we could safely leave the prosecution of these operations to the men in charge of them. The means as it turned out was a method of financial control which converted the broad principle of return on investment into one of the important working instruments for measuring
17
Ibid., 125. 18
Ibid.

7
the operations of the divisions. The basic elements of financial control in General Motors are cost, price, volume and rate of return on investment”19
The central contribution of both Chandler and Sloan is that they draw our attention to
business strategy as being decided and formulated by boards of senior executives in
responses to changes in market demand, new product technologies and opportunities to
generate a return on investment for shareholders. This process of strategy formulation is
supplemented with another supportive narrative that describes how divisional managers
are free to manage their own divisions subject to policies established by the executive
committee, for example, volume of production, type of product and price bracket, and
within certain cost limits.
“The co-ordination of the activities of all these division must be such that there will be no undue conflict, competitively, between the product of one division and that of another. General policies must be determined from the standpoint of the corporation as a whole, rather than from that of any one division. Each of these divisions is conducted as a business in itself. The responsible head operates the business with no other limitation than at which has been established by the policy of the corporation, expressed through its executive committee”.20
Chandler develops and extends his thesis about the nature and operation of business
strategy and structure in The Visible Hand (1977)21 in terms of the nature of hierarchy and
the internalization of transactions within organizations rather than markets. This is again
further reinforced in ‘economies of scope’. The object of these texts is to provide an
explanation for the development of industrial capitalism and its dynamics within a
‘productionist’ framework. Chandler’s organizing elements focus on production, distribution
and management where marketing and market sensing provide information to plan physical
production schedules, product mix, revenues, expenses and return on capital within
organization structures that facilitate professional management.
19
Sloan, My Years, 140. 20
John J. Raskob. “Management: the Major Factor in All Industry,” Industrial Management: the Engineering Magazine LXXIV (July-Dec 1927): 131-132. 21
Alfred J. Chandler, The Visible Hand (Cambridge, Mass. 1977).

8
In contrast the term financialization is a relatively new organizing concept and it is often
employed to describe the behaviour of contemporary business enterprise and trajectory of
economic development. At a macro-economy level Krippner describes economic
development as a compositional shift in national balance sheets from productive tangible
assets to financial assets that can be more easily traded or used to lever additional profit.
“I define financialization as a pattern of accumulation in which profits accrue primarily through financial channels rather than through trade and commodity production....’Financial’ here refers to activities relating to the provision (or transfer) of liquid capital in expectation of future interest, dividends and capital gains”.22
Lazonick and O’Sullivan and Lazonick23 argue that financialization is about changes in
corporate priorities away from productive investment in innovation for economic
development towards the interests of shareholders. This is evidenced as a shift in the use of
profits from productive reinvestment towards dividends distribution and share buybacks. In
a recent Guardian article Lazonick observes that ‘for the period 2001-2010, 86 of Britain's
largest companies that are included in the S&P Europe 350 index made €882bn in net profits
of which 63% was paid out in dividends.24
“By financialization, I mean the evaluation of the performance of a company by a financial measure such as earnings per share. The manifestation of the financialization of the US economy is the obsession of corporate executives with distributing ‘value’ to shareholders in the form of stock repurchases, even if it is at the expense of investment in innovation and the creation of US employment opportunities”.25
Froud et al. point to the alignment of managerial and investor interests (a closure of the
agency gap) because shareholder value metrics are embedded with executive remuneration
packages which take the form of considerable cash bonuses and stock options.26 However,
in a financialized world narratives and numbers tend to exaggerate corporate
transformation in order to help inflate share prices and market value.
22
Krippner, “Financialization,” 175. 23
William Lazonick and Mary O’Sullivan,“Maximising Shareholder Value,” Economy and Society 29 (2000): 13-25; Lazonick, “Innovative Business Models.” 24
William Lazonick, “Big payouts to shareholders are holding back prosperity”, Guardian, August 27, 2012. 25
Lazonick, “Innovative Business Models,” 6. 26
Froud et al., Financialization.
9
As mentioned earlier, Sloan himself emphasises the relevance of the financial side of the
business in explaining multi-divisionalization.27 This raises two interconnected questions: to
what extent did GM’s management of resources embody elements of the ‘financialized’ firm
in its early history from 1909 to 1940, and how did these elements contribute to the
physical, financial and managerial development of this company? We first argue that GM
distributed a significant share of its profits as dividends during the period from 1909 to 1940
and that this represented the need to manage stockholder expectations and confidence so
that GM would obtain on-going refinancing. Second, we observe that GMs balance sheet
capital structure shifts from tangible assets (plant and equipment land and buildings)
towards financial assets (loans). This is the deliberate outcome of activities carried out by
the General Motors Acceptance Corporation (GMACs) of issuing loan finance to underwrite
consumer credit purchases of GM vehicles. This changes the composition of the balance
sheet and inflates balance sheet capitalization ahead of corporate earnings. Third, GM
operated a substantial stock option bonus scheme for senior executives and also for other
less senior employees. This may have helped to reduce employee turnover but would
certainly help to close the agency gap between the interests and calculations of senior
executives and their stockholders.
Strategy Financialized at GM, 1909-1940
We have noted how Lazonick bemoans the way in which corporations have in recent
decades distributed over 60 per cent of their profits as dividends. Lazonick argues that the
old corporate ‘productionist’ objectives of US corporations of reinvesting for innovation and
competitiveness have been replaced with a policy of ‘downsize and distribute’. In chart 1 we
show GM’s dividends paid out of cash earnings. At the start of the period a relatively low
share of cash is distributed but this builds up quickly such that in a majority of years over
half of cash earnings are distributed and on average during the whole period covered the
share dividends distributed out of cash stands at 70 per cent (and relative to net earnings
before dividends are paid 86 per cent). The share of dividends paid out of net income by GM
27
Sloan, My Years, 140.

10
is above is that for US manufacturers during a similar period 1914- 1940 which we estimate
to be averaging approximately 70 per cent (see table 1).
Source: Source: For dividends GMI Alumi Foundations Collection of Industrial History, Flint Michigan, also http://www.library.upenn.edu/collections/lippincott/corprpts/gm/gm1932.pdf Note: Cash earnings are net income plus depreciation.
Table 1: US manufacturing dividends in net Income, 1914-1940
Total net Income
Total Dividends
Dividends in net Income
$bn $bn %
1914-1940 21.8 15.2 69.9
US Department of Commerce Bureau of Census (1975) Historical Statistics of the US Colonial Times to 1970, part 2. Washington DC, US. Table series V 285-305: Assets, Liabilities and Selected Income items for two samples of large manufacturing corporations.
The value of dividends distributed to stockholders accumulates relative to the funding that
they put in as equity and preference share capital. By the end of our period of analysis
accumulated dividends paid out to stockholders relative to their paid in investment stood at
4:1. That is, for every $1 of capital invested stock holders were paid dividends equivalent to
$4 (Chart 2).
0
50
100
150
200
250
300
19
09
19
11
19
13
19
15
19
17
19
19
19
21
19
23
19
25
19
27
19
29
19
31
19
33
19
35
19
37
19
39
Chart 1: GM dividends (ordinary and preference) in cash earnings (%)1909 to 1940

11
“Our shareholders have derived a substantial monetary benefit from the success of the business through the distribution of about two thirds28 of the income realised since inception a proportion which is larger than that distributed by most businesses. In order to secure these benefits, the shareholders have underwritten the growth of the enterprise by their willingness to reinvest substantial sums required to meet the needs of the business as it grew”.29
Source: Source: GMI Alumi Foundations Collection of Industrial History, Flint Michigan, also
http://www.library.upenn.edu/collections/lippincott/corprpts/gm/gm1932.pdf.
Notes: Ordinary and preference dividends as a per cent of shareholder capital (preference and ordinary common stock investment made over the period 1909 to 1940)
The challenge facing GM during this period was to secure shareholder confidence through
the distribution of profits as dividends because, as Chart 9 reveals, stock market capital
gains were much less certain. The index of GM common stock prices starting from 1912
(when first listed on the New York Stock Exchange) runs until 193830 and we compare this
growth in stock prices with an aggregate industry index for the same period. In the period
1912 to 1925 GM stock underperforms the aggregate index of US industry stocks but the
price per share trajectory is stronger after 1926. In the latter period GM stock outperforms
the US industry average although it is clear from chart 9 that market value becomes
28
Note Sloan’s period covers 1917 -1962 in My Years with GM. 29
Sloan, My Years. 191. 30
http://som.yale.edu/faculty-research/our-centers-initiatives/international-center-finance/data/historical-cowles
0.0
0.5
1.0
1.5
2.0
2.5
3.0
3.5
4.0
4.5
19
09
19
11
19
13
19
15
19
17
19
19
19
21
19
23
19
25
19
27
19
29
19
31
19
33
19
35
19
37
19
39
Chart 2: Ratio of accumulated preference and ordinary stock dividends to shareholder funds invested in GM 1909 to 1940

12
increasingly cyclical and GM’s stock prices are no higher in 1938 that they were in 1928. In
contrast investor returns during this period are driven by accumulated dividends. The
dividends index has a steady upwards trajectory and moves progressively ahead of the stock
return index during the early to late 1930s (see Chart 3).
Source: For dividends GMI Alumi Foundations Collection of Industrial History, Flint Michigan, also http://www.library.upenn.edu/collections/lippincott/corprpts/gm/gm1932.pdf For US and GM stock prices and all US industry sectors http://som.yale.edu/faculty-research/our-centers-initiatives/international-center-finance/data/historical-cowles
In the next section of this analysis we consider the extent to which GM’s balance sheet
shifts from assets located in physical and tangible assets to that which are financial and
more liquid assets.
GM’s financialized balance Sheet 1909 to 1940
During the period 1909 to 1940 GMs assets structure changes from a tangible assets to a
blend of both tangible and financial and assets. Our measure of tangible assets is that for
real estate plant and equipment and our measure of liquid and financial assets include: cash
balances, marketable investments and loan notes outstanding (when GMAC31 starts its
operations). Loan notes outstanding are those issued by GMAC to customers to finance
credit purchases of GM autos and commercial vehicles. This financing also extended to the
purchase of the second hand car when it was traded in ‘two or three times on the way to
31
GMAC = General Motors Acceptance Corporation
0
100
200
300
400
500
600
19
12
19
14
19
16
19
18
19
20
19
22
19
24
19
26
19
28
19
30
19
32
19
34
19
36
19
38
Chart 3: GM index of stock price and accumulated dividends 1912 to 1938 (base year 1926=100)
Index of Accumulated Dividends All Stocks Index of GM Stock

13
the scrap heap’.32 Sloan observed that the banks failed to provide consumer credit ‘they
thought of the automobile as a sport and a pleasure....they had a moral objection to
financing a luxury, believing apparently that whatever fostered consumption must
discourage thrift. Consequently, automobiles were sold to customers mainly for cash.’33 Not
only were customers deprived of credit but also dealers wishing to finance stock within their
retail sites for distribution.
“General Motors Acceptance Corporation was organized in 1919 under the banking law of the State of New York for the purpose of assisting General Motors distributors, dealers and customers in financing cars purchased on credit. It was stated in the last annual report that this activity was assuming an increasing importance in the operations of General Motors to a degree that could hardly be overestimated”.34
“We have built up a banking institution, the reputation of which is unquestioned. Its securities are considered of the highest rank by most conservative bankers and investors. Its record from the operating standpoint bears the closest inspection. As a matter of fact, I feel that its operations have had an important influence in establishing consumer credit as a sound and important principle in our business life”.35
Sources: GMI Alumi Foundations Collection of Industrial History, Flint Michigan, also http://www.library.upenn.edu/collections/lippincott/corprpts/gm/gm1932.pdf Notes: During the periods 1910-11, 1915-20 and 1919-34 cash balances are depleted and loans notes also lower due to the downturn in car sales in these recessionary periods.
32
Sloan, My Years, 152. 33
Ibid., 304. 34
GM Annual Report, 1926, 9. 35
Sloan, A. P., 28 Sept, 1927 GMI Institute Sloan A.P Biography Box C.2.
0.0
0.2
0.4
0.6
0.8
1.0
1.2
1.4
19
09
19
11
19
13
19
15
19
17
19
19
19
21
19
23
19
25
19
27
19
29
19
31
19
33
19
35
19
37
19
39
Chart 4: GM liquid financial assets to tangible assets ratio 1909 to 1940

14
“So far as GMAC is concerned, I would say in brief that it offers a service related to the product and in the interest of the consumer. The advantages to the customer, the dealer, and the corporation seem obvious to me”.36
In chart 4 we calculate the ratio of financial liquid assets (cash, marketable securities and
notes receivable in the GM accounts) to tangible assets (real estate plant and equipment)
and we find that a simple trend reveals a progressive increase in the financialization of GM’s
balance sheet as the share of financial and liquid assets reaches and eventually exceeds the
value of tangible assets. In 1920 financial and liquid assets to total tangible assets stood at
27 per cent and by 1940 this ratio had shifted to 129 per cent
In 1927 GM established the Motors Accounting Company which provided an accounting
service for dealerships and this subsidiary later became the Motor Holdings Division which
was financed with $2.5 million of GM funds whereby dealers would put in a minimum of 25
per cent of the capital and GM would make up the rest. The holding company would pay the
dealership a share of the profit as additional bonus, that is, until the dealer was able to pay
off the full capital to buy out from the Holdings Company.
Closing the agency gap: GM stock options and bonus system(s)
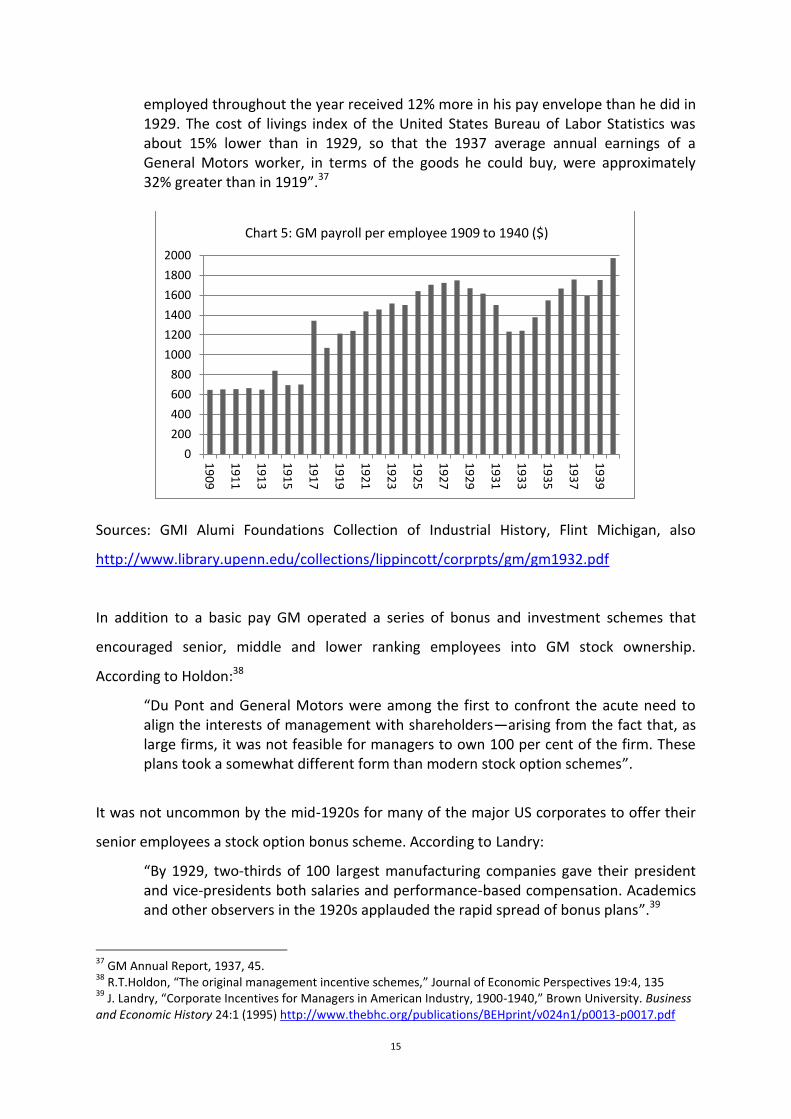
In GM the average employee earned roughly $600 per annum in 1909 and earnings had
risen to a peak of $1800 in 1928 only to recover back to and then surpass this level some ten
years later in 1940 at roughly $2,000 per annum (see Chart 5). The GM annual report
published in 1937 adjusts the average payroll per employee by the cost of living index to
make the case that, in real terms, employees were, on average, better off that they were in
1929.
In the Economic Review provided in the 1937 annual report we are told that:
“In 1929 the average annual earnings were approximately $1,440. In 1937, as has already been stated, they were $1,618. Thus a General Motors worker regularly
36
Sloan, My Years, 312.
15
employed throughout the year received 12% more in his pay envelope than he did in 1929. The cost of livings index of the United States Bureau of Labor Statistics was about 15% lower than in 1929, so that the 1937 average annual earnings of a General Motors worker, in terms of the goods he could buy, were approximately 32% greater than in 1919”.37
Sources: GMI Alumi Foundations Collection of Industrial History, Flint Michigan, also
http://www.library.upenn.edu/collections/lippincott/corprpts/gm/gm1932.pdf
In addition to a basic pay GM operated a series of bonus and investment schemes that
encouraged senior, middle and lower ranking employees into GM stock ownership.
According to Holdon:38
“Du Pont and General Motors were among the first to confront the acute need to align the interests of management with shareholders—arising from the fact that, as large firms, it was not feasible for managers to own 100 per cent of the firm. These plans took a somewhat different form than modern stock option schemes”.
It was not uncommon by the mid-1920s for many of the major US corporates to offer their
senior employees a stock option bonus scheme. According to Landry:
“By 1929, two-thirds of 100 largest manufacturing companies gave their president and vice-presidents both salaries and performance-based compensation. Academics and other observers in the 1920s applauded the rapid spread of bonus plans”.39
37
GM Annual Report, 1937, 45. 38
R.T.Holdon, “The original management incentive schemes,” Journal of Economic Perspectives 19:4, 135 39
J. Landry, “Corporate Incentives for Managers in American Industry, 1900-1940,” Brown University. Business and Economic History 24:1 (1995) http://www.thebhc.org/publications/BEHprint/v024n1/p0013-p0017.pdf
0
200
400
600
800
1000
1200
1400
1600
1800
2000
19
09
19
11
19
13
19
15
19
17
19
19
19
21
19
23
19
25
19
27
19
29
19
31
19
33
19
35
19
37
19
39
Chart 5: GM payroll per employee 1909 to 1940 ($)

16
In GM four bonus schemes were introduced: the managers’ securities company, the bonus
plan for salaries employees, and two opportunities for other employees: a savings and
investment plan and as these savings matured they could be invested in GM preferred stock
at a 7 per cent return per annum. It is significant that Sloan commits a full chapter to
‘incentive compensation’ (Chapter 22: 22 pages) compared with the chapter on co-
ordination by committee and divisionalization (chapter 7: 17 pages). But, according to Sloan
the policy of decentralization and the bonus plans ‘are related’:
“decentralization gives executives the opportunity for accomplishment, and the Bonus Plan, makes it possible for each executive to earn a reward commensurate with his own performance, and so gives him an incentive to put forth his best effort at all times”40
At a senior level GM established the so-called managers Securities Company (1923) and this
was established with an authorized capital stock of $33.8 million split into $28.8 million of 7
per cent preferred stock; $4 million of class A stock (par value $100) and $1 million of class B
stock par value $25. On formation this company purchased 2.25 million GM common stock.
GM undertook to pay the equivalent of 5 per cent of net earnings minus a 7 per cent cost of
using capital into this fund. And, if this amount was less than $2 million, then GM was to
make up the difference. Senior managers in the scheme would be evaluated each year to
determine if ‘participation was out of line compared to other executives’. Over a period of
seven years the investment of $1,000 into this scheme generated a return to senior
managers of $9,800.41 Raskob, GM’s Chairman of its Finance Committee observed that
these senior executives, by virtue of their extensive responsibility and authority, ‘have a
definite financial share in the business, the equivalent of the rewards of private
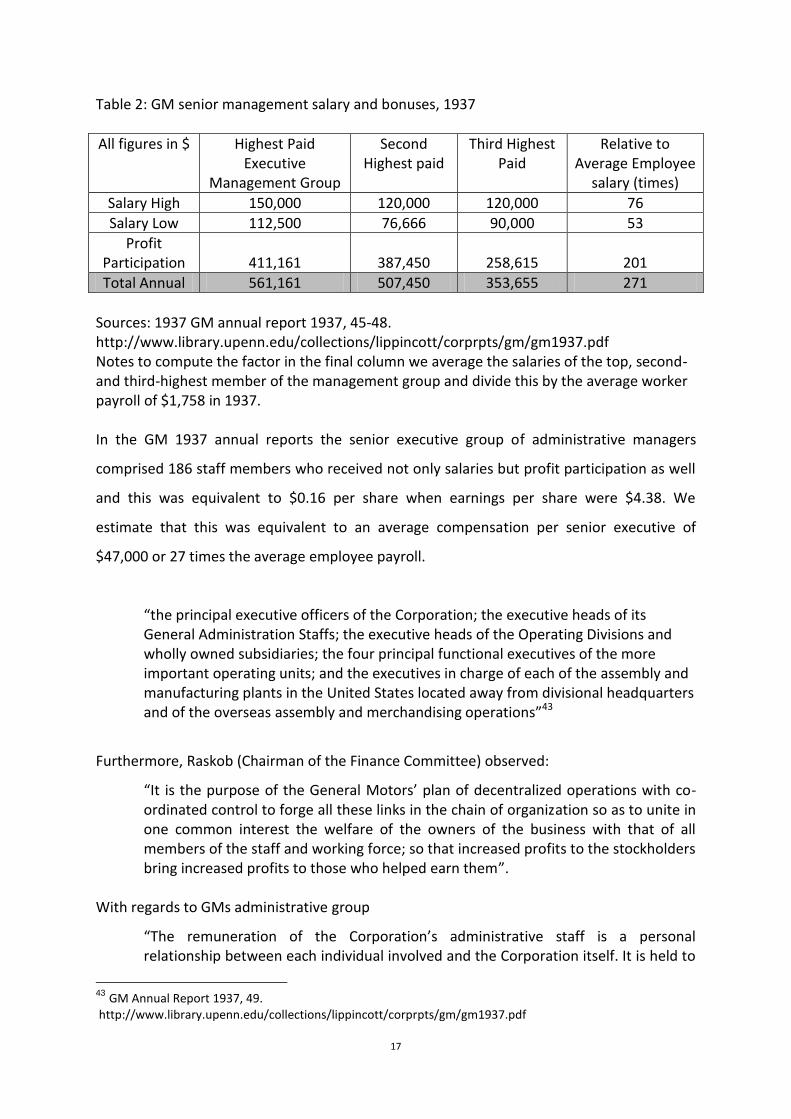
enterprise’.42 In 1937 the total remuneration package of the highest-paid executives was
271 times that of the average employee costs at GM in the same year (see table2).
40
Sloan, My Years, 407. 41
We need a reference for the data above. 42
Raskob, “Management,” 132.
17
Table 2: GM senior management salary and bonuses, 1937
All figures in $ Highest Paid Executive
Management Group
Second Highest paid
Third Highest Paid
Relative to Average Employee
salary (times)
Salary High 150,000 120,000 120,000 76
Salary Low 112,500 76,666 90,000 53
Profit Participation
411,161
387,450
258,615
201
Total Annual 561,161 507,450 353,655 271
Sources: 1937 GM annual report 1937, 45-48. http://www.library.upenn.edu/collections/lippincott/corprpts/gm/gm1937.pdf Notes to compute the factor in the final column we average the salaries of the top, second- and third-highest member of the management group and divide this by the average worker payroll of $1,758 in 1937. In the GM 1937 annual reports the senior executive group of administrative managers
comprised 186 staff members who received not only salaries but profit participation as well
and this was equivalent to $0.16 per share when earnings per share were $4.38. We
estimate that this was equivalent to an average compensation per senior executive of
$47,000 or 27 times the average employee payroll.
“the principal executive officers of the Corporation; the executive heads of its General Administration Staffs; the executive heads of the Operating Divisions and wholly owned subsidiaries; the four principal functional executives of the more important operating units; and the executives in charge of each of the assembly and manufacturing plants in the United States located away from divisional headquarters and of the overseas assembly and merchandising operations”43
Furthermore, Raskob (Chairman of the Finance Committee) observed:
“It is the purpose of the General Motors’ plan of decentralized operations with co-ordinated control to forge all these links in the chain of organization so as to unite in one common interest the welfare of the owners of the business with that of all members of the staff and working force; so that increased profits to the stockholders bring increased profits to those who helped earn them”.
With regards to GMs administrative group
“The remuneration of the Corporation’s administrative staff is a personal relationship between each individual involved and the Corporation itself. It is held to
43
GM Annual Report 1937, 49. http://www.library.upenn.edu/collections/lippincott/corprpts/gm/gm1937.pdf

18
be highly undesirable and contrary to the interest of the stockholders to approach the question from any other standpoint. On the other hand, it is recognised that the stockholders should be concerned, and have a right to be concerned, as to the cost of administering the business”.44
In 1937 all members of the organisation receiving more than $4,200 were eligible to
participate in the bonus fund. We estimate that the average benefit per executive employee
would have been around $100 per annum over the period 1918 to 1940 while the bonus
plan operated.
Investment plans for all employees included the savings and investment plan introduced in
1919. An employee with three months or more of employment could deposit a maximum of
$300 per annum and GM would match this with $0.50 for every dollar deposited. An
employee depositing this maximum over the period 1919 to 1927 would have accumulated
a market value in excess of $6,000. At the end of the investment term as they matured they
could be invested in GM preferred stock with GM adding an extra $2 per share and a
dividend of 7 per cent per annum. Thus while the impact of the bonus plan could not be
mathematically proven Sloan was assured that it contributed to the extraordinary successful
performance of GM and the ‘retention of outstanding men’.45
In the following section we turn to consider the extent to which these policies which
collectively informed strategy at GM during the period 1909 to 1940 also align with a
transformation of physical and financial productivity and financial results.
GM: Sales and productivity 1909 to 1940
Our analysis starts with the growth and trajectory of GM in terms of its physical output of
cars and commercial vehicles over the period 1909 to 1940. This reveals two distinct
periods: 1909 to 1929 and then a period of collapse and recovery from 1930 to 1940. GM
shared a similar problem to its competitors namely market volatility and cyclicality. The
years 1920-21 saw output drop 45 per cent and then in 1923-24 sales dropped by 27 per
44
GM Annual Report, 1937, 46. 45
Sloan, My Years, 428.

19
cent while the period from 1929 to 1932 saw a reduction in output of 70 per cent and these
downturns had a significant negative impact on revenues and profit (Chart 6).
Source: GMI Alumi Foundation Collection of Industrial History, Flint Michigan, also http://www.library.upenn.edu/collections/lippincott/corprpts/gm/gm1932.pdf
Source: GMI Alumi Foundation Collection of Industrial History, Flint Michigan, also http://www.library.upenn.edu/collections/lippincott/corprpts/gm/gm1932.pdf Note: This calculation is total vehicles per employee
0
500
1000
1500
2000
2500
19
09
19
11
19
13
19
15
19
17
19
19
19
21
19
23
19
25
19
27
19
29
19
31
19
33
19
35
19
37
19
39
Chart 6: GM Vehicles Sold (000 units) 1909 to 1940
0
2
4
6
8
10
12
19
09
19
11
19
13
19
15
19
17
19
19
19
21
19
23
19
25
19
27
19
29
19
31
19
33
19
35
19
37
19
39
Chart 7 GM Vehicles per Employee 1909 to 1940

20
Chart 7 reveals that physical productivity as vehicles per employee moves up from 2-4
vehicles per employee from 1909 to 1913 to 10 vehicles per employee by 1925 but
thereafter drops back to 5 vehicles per employee by 1932 before again recovering to 8
vehicles per employee by 1940. This pattern of physical productivity is also mimicked by the
value added per employee, a financial measure of productivity. Value added is that share of
the value chain captured by GM within its own financial reporting boundary after deducting
all external expenses.46 For the period from 1909 to 1913 value added is about $1,000 per
employee and reaches roughly $2,000 before the cyclical downturn 1919-21 but then again
recovers moving up to a peak in 1926 when the value added per employee reached $3,300.
The period after the 1929 collapse in market demand sees value added per employee drop
back to $1,500 before again recovering to roughly $3,000 but no higher than the peak levels
achieved in the mid-1920s (Chart 8).
Source: GMI Alumi Foundation Collection of Industrial History, Flint Michigan, also http://www.library.upenn.edu/collections/lippincott/corprpts/gm/gm1932.pdf Note: Value added is calculated as net income plus depreciation expenses plus total employee payroll expenses
In terms of physical and financial productivity the period 1909-1940 can be broadly split into
two halves. The first, from 1909 to 1929, is one of growth in physical and financial
productivity with some cyclical interference, while the period from 1930 to 1940 is marked
46
Value added is employee costs plus depreciation plus earnings before interest and tax.
0
500
1000
1500
2000
2500
3000
3500
19
09
19
11
19
13
19
15
19
17
19
19
19
21
19
23
19
25
19
27
19
29
19
31
19
33
19
35
19
37
19
39
Chart 8: GM Value Added per Employee 1909 to 1940 ($)

21
by a substantial collapse in physical and financial productivity associated with the 1929
crash. But thereafter recovery takes GM back to levels achieved in the mid-1920s.
GM Cost Structure, Margins and Return on Capital Employed, 1909-1940
In this section we consider the evolution of GM’s consolidated financial cost structure over
the period 1909-1940 as shown in chart 9. This chart contains three significant ratios used to
describe changes in GM’s operating cost structure. The first of these is the value added to
sales ratio. This describes GM’s share of its financial value chain after deducting all external
costs and expenses for materials and other services supplied. During the period 1911-1924
this remains relatively stable (apart from the initial start-up year) at roughly 30 per cent
before then gently rising towards 50 per cent and then levelling off in the range 40-50 per
cent. This change in the value added to sales ratio is driven upwards by an increase in
‘internal’ labour costs from 20 to 30 per cent of sales and this has the effect of dampening
the cash margin which remains in the 10-20 per cent range with bouts of cyclicality.
Although the cash margin remains relatively untransformed this might not be the case for
the return on capital which is found as: [Cash/ Sales] / [Capital / Sales]. There is the
possibility that capital intensity, that is, capital employed (debt and equity) required to
generate a dollar of sales revenue could have been reduced.
Source: GM Annual Reports and Financial Statements 1909 to 1940 GMI Alumi Foundation Collection of Industrial History, Flint Michigan, also http://www.library.upenn.edu/collections/lippincott/corprpts/gm/gm1932.pdf Note: Value added, labour costs and cash margin as a per cent of sales income
-20
-10
0
10
20
30
40
50
60
70
19
09
19
11
19
13
19
15
19
17
19
19
19
21
19
23
19
25
19
27
19
29
19
31
19
33
19
35
19
37
19
39
Chart 9: GM Cost Structure 1909 to 1940 % Sales
Value added in sales % Labour Cost in Sales % Cash to Sales %

22
Source: GM Annual Reports and Financial Statements 1909 to 1940 GMI Alumi Foundation Collection of Industrial History, Flint Michigan, also http://www.library.upenn.edu/collections/lippincott/corprpts/gm/gm1932.pdf Note: CII GMAC= capital intensity as sales divided by capital employed where capital employed is long term debt plus equity. From 1923 we also include notes receivable recorded in the GMAC accounts.
What we find is that GM’s capital intensity47 (including GMAC loan notes), increases from
around 50 per cent of sales revenue during the 1910s to a level that was equivalent, and at
times, above sales revenue during the 1930s48. Thus, the combination of a relatively
untransformed cash margin combines with a generally higher level of capital intensity
(capital to sales ratio) and this frustrates a structural transformation of GM’s return on
capital (Chart 10). It is interesting to note how Donaldson Brown understood and analysed
return on investment.49 In this respect, Sloan observed that: ‘Brown defined the return on
investment as a function of the profit margin and the rate of turnover of invested capital.’50
“If this seems obscure, pass over it and note only that you can get an increase in return on investment by increasing the rate of turnover of capital in relation to sales as well as by increasing profit margins. Each of these two elements –profit margin and rate of turnover of capital –Mr Brown broke into its detailed components, a case you might say of aggregating and disaggregating figures to bring about a recognition
47
Capital intensity is debt plus equity in GM plus GMAV loan notes outstanding 48
Using a simple trend line in chart 10 49
Donaldson Brown arrived at GM in 1922 and was elected to the Executive Committee. He was experienced in financial operations. 50
Sloan, My Years, 141.
-50
0
50
100
150
200
250
19
09
19
11
19
13
19
15
19
17
19
19
19
21
19
23
19
25
19
27
19
29
19
31
19
33
19
35
19
37
19
39
Chart 10: GM (including GMAC) capital intensity and cash margin 1909 to 1940
Cash Margin CII GM plus GMAC

23
of the structure of the profit and loss in operations. Essentially it was a matter of making things visible”.51
Source: GM Annual Reports and Financial Statements 1909 to 1940 GMI Alumi Foundation Collection of Industrial History, Flint Michigan, also http://www.library.upenn.edu/collections/lippincott/corprpts/gm/gm1932.pdf Note: Cash ROCE is net earnings before depreciation divided into capital employed. The Cash ROCE (GMAC) includes notes receivable at GMAC in the capital employed figure for illustration.
In chart 11 we combine capital turnover (sales / capital employed) and cash margin (cash /
sales) to obtain the cash return on capital employed. We find that over the period 1909-
1940 there is a cyclical pattern to the return on investment and that a simple trend line
registers a relatively flat overall picture of roughly a 20 per cent cash return on capital.
Splitting this into two sub-periods before Sloan’s chairmanship of GM the average cash
ROCE was 16 per cent and the period of his chairmanship (1923 to 1940) the average stood
at 17 per cent. We should also note that GM distributed over 80 per cent of its net income
under Sloan’s chairmanship and this would have mechanically slowed down the
accumulation of shareholder funds (because lower retained profits are carried forward) and
this, in turn , would inflate capital turnover and thereby uplift the reported return on capital
(see chart 7).
51
Ibid.142
-10
0
10
20
30
40
50
60
19
09
19
11
19
13
19
15
19
17
19
19
19
21
19
23
19
25
19
27
19
29
19
31
19
33
19
35
19
37
19
39
Chart 11: GM cash ROCE 1909 to 1940
GM Cash ROCE % Cash ROCE (GMAC)
24
Our analysis of financial and physical productivity reveals progress until the 1929 crash and
although the ratios recover they do not exceed the peak achieved before the crisis. In terms
of financial transformation we find that the value retained in sales moves up from 30 to
nearly 40 per cent by 1940 but this gain is lost because labour costs track upwards to leave
the cash margin relatively untransformed (albeit cyclical). The second component in the
return on investment, namely capital turnover, deteriorates and this acts to put a brake on
the profit ROCE with an average under Sloan’s management not so different from that of his
predecessors.
The bottom line return on capital reported by GM was, as Donaldson Brown would have
appreciated, the product of a complex series of inter-related disaggregated components.
That is, increases physical productivity did not simply translate into improved return on
capital. After a period of improvements to productivity in terms of vehicles per employee
and its financial correlate, value added per employee, this transformation reaches a peak in
1929 and then moves on to a cyclical pattern. GM’s operating ratios do, on the one hand,
change quite significantly because GM progressively captures more of the financial value
chain up from 30 to 40 per cent of total revenues generated. However, internal labour costs
also increase and this limits the transformation in cash margin which remains in the range
10-20 per cent with bouts of cyclicality. This cash margin does not straightforwardly
translate into a higher return on capital because the capital turnover ratio also deteriorates
as GM was inflating its capital employed relative to income and profit. Significantly GM
through GMAC was raising debt finance to cover the issuance of loan notes to customers to
secure demand for its output. Thus the connection between strategic interventions and
financial outcomes is often contradictory and not straightforward.
Summary/ Discussion
The relevance of our findings is threefold. Firstly, they cast a new light on General Motors as
an iconic example of a Chandlerian firm. Secondly, they help to refine our views on the
construction of stereo-types between “Chandlerian old industrial capitalism” and
‘financialized new economy business models’. Finally, our findings encourage a broader
reflection upon the notion of performativity (as formulated by firms as point values in time

25
and space) and the importance of deconstructing point values to reveal contradictions and
ambiguities.
The traditional notion of Chandlerian firms implies a “productionist” business model driven
by a high level of commitment into fixed assets and profits reinvested into research and
development and innovation-driven competition. On the other hand, our paper shows that,
since the early stages of its growth, General Motors featured clear elements of a highly
financialized business model.
First, there was a progressive shift in the balance sheet towards liquid financial (as opposed
to tangible productive) assets. This asset liquidity reflects the use of financial instruments
within GMAC to underwrite the provision of consumer credit facilities which helped to also
inflate GM’s consolidated income and profits. This is consistent with the current
understanding of financialized business models.52 Second, a significant share of profit was
distributed as dividends to GM stockholders and we estimate that the distribution ratio out
of profits averaged over 80 per cent. These dividends provided stockholders with a
substantial return on their equity capital but, as Sloan observes, these stockholders were
needed for critical refinancing events. Third GM operated a stock options bonus and profits
scheme for senior executives, administrators and employees, and this was not uncommon
practice at this time. For Sloan the retention of senior executives and key employees was a
driving force in addition to also aligning the values and motivations of executives and
employees with the interests of stockholders especially when bonuses were in the form of
stock options. This is also consistent with financialized business models.53 Finally, return on
capital deployed, productivity and profits were all cyclical (and, after 1925 cyclically
disappointing). This is consistent with a common characteristic of financialized business
models, namely an asymmetry between strategic narratives revolving around physical
operating efficiency and disappointing financial indicators that combine earnings with
balance sheet capitalisation.54
52
Krippner, “Financialization.” 53
Lazonick and O’Sullivan, “Maximising.” 54
Froud et al., Financialization.

26
Our argument is that elements of both the Financialized and Chandlerian notions of
resource management and deployment are present in GM during the period 1909 to 1904.
The traditional view of Chandlerian firms is that of the oligopolistic organization committed
to innovation and innovation-based competition and this is the pivot of Baumol’s model of
innovation-driven growth. That is, the combination of Chandlerian firms and the free market
creates a virtuous economic circle sustained by continuous competitive product and process
innovation and renewal. This model of the ‘old economy’ has been pitted against a ‘new
economic’ model based on the financialization55 of corporate strategy. Where the process of
financialization progressively undermined US corporate commitment to innovation, product
and process renewal and instead forced firms to downsize and distribute as managerial and
shareholder interests became aligned.
Our paper shows that since the early days of its history GM’s business model encompassed
both the elements of the productionist “virtuous” business model envisaged by Chandler,
Baumol56 and Lazonick but also key elements of a financialized business model. Our
argument is that it is not possible to construct a clear dichotomy between the old and the
new and then to use this as an organising stereotype. In the development of the modern
corporation at GM there is an infusion of both productive and financialized interventions for
the management and deployment of resources. Lazonick’s distinction between an old
economic paradigm and a new economic paradigm based on a financialized business model
is problematic especially when elements of both organising concepts are present in time
and space.
This leads to a further argument within our paper which relates to how a Chandlerian
framing of business history implicitly employs performativity to describe temporal economic
progress. Chandler identified throughput as the performance measure underpinning
strategic investments in infrastructures for production and distribution, as well as
managerial hierarchies.57 Within competitive markets, throughput optimization required
technical investments towards improving cycle time and lead times, which have an assumed
55
Lazonick, “Innovative Business Models.” 56
William J. Baumol, The Free-Market Innovation Machine: Analyzing the Growth Miracle of Capitalism (Princeton, 2002). 57
Alfred J. Chandler, Scale and Scope (Cambridge, Mass., 1990).

27
direct impact on total factor productivity, operating costs and profits. A separation between
ownership and control enabled professional managers to use capital to optimize
throughput. Thus, throughput as a measure of efficiency became the underpinning notion of
modernity, in which modern industrial capitalism was characterized by the separation
between management and control,58throughput optimization and transformation of
investments into sustainable competition.59
Our argument is that physical ratios such as that relating to productivity do not easily or
straightforwardly translate into improved financial performance. Our inspiration for this
argument arises out of Sloan’s remarks about how Donaldson Brown deconstructed returns
on investment.60 Point values and ratios are often utilised by analysts and business
historians to construct narratives and interpretations about performance. Donaldson Brown
reminds us that these point values need to be deconstructed in order to capture
interpretive inflexions and reveal contradictions between one aspect and another. Brown
describes the return on capital invested as a function of profit margins and the rate of
capital turnover. Profit margins can be affected by contradictory forces that need to be
deconstructed to make these visible. So that whilst GM captures more of the financial value
chain it is also increased expenditure on employment costs which constrain margin
transformation. Whilst the return on capital is also affected by capital intensity or as
Donaldson Brown considered it: capital turnover (sales revenues divided by capital
employed). Thus the inflation of capital employed, arising out of the issuance of loan credit
to customers, helped GM to recover additional revenue and profits but it came at the
expense of a reduced rate of capital turnover. Thus a combination of factors limit the scope
for a financial transformation of the bottom line return on capital employed. Yet Sloan and
Brown seemed to be aware of the contradictory nature of performativity measures and
strategized accordingly.
In our view, all this suggests that business history should depart not only from paradigmatic
notions of what makes firms competitive, sustainable in the long term and, therefore,
58
Chandler, Strategy and Structure; Alfred J. Chandler, Managerial Hierarchies (Cambridge, Mass., 1980). 59
Chandler, Scale and Scope. 60
Sloan, My Years, 141.

28
historically relevant to the notion of modern economic growth,61 but also and more
importantly it should depart from the idea implicit in Chandlerian business history that we
can measure performance in a way that is consistent across time and space. On the
contrary, different and contradictory notions of performativity can coexist and interact in
various ways across time and space.
61
Chandler, Scale and Scope; Baumol, Free-Market Innovation Machine.