Reform serves the people: Rationale for regulation -...
24
Reform serves the people: Rationale for regulation Rohan Samarajiva [email protected] Regulatory Training Course, Taungoo, 28 September 2013 This work was carried out with the aid of a grant from the International Development Research Centre, Canada and UKaid from the Department for International Development, UK.
Transcript of Reform serves the people: Rationale for regulation -...
Reform serves the people: Rationale for regulation
Rohan Samarajiva [email protected]
Regulatory Training Course, Taungoo, 28 September 2013
This work was carried out with the aid of a grant from the International Development Research Centre, Canada and UKaid from the Department for International Development, UK.
Why reform?
• Telecom is an increasingly important element in all value chains – Tourism, banking, apparel, etc. depend on availability of high-quality
and low-cost telecom – Exports, jobs, wealth will increasingly depend on performance of
telecom sector
• Telecom is a major driver of economic growth in countries where reforms have occurred – Also a major contributor of tax revenues
• People need to keep in touch: communication is a basic need – Everywhere telecom has been reformed, pent-up demand has
exceeded expectations
• Ability to assume electronic connectivity makes many innovations possible
Gates Foundation 2011 Innovation Awardee: Bangladesh’s Dr Asm Amjad Hossain
• Raised immunization rates in 2 districts from 67% and 60% in 2009 to 85% and 79% in 2010
• How did he do it?
– Registered pregnant women (date of delivery, location, and phone number) so vaccinators knew when children were born, where they were, and could contact their mothers
– Established annual schedules for vaccinations
– Had vaccinators put phone numbers on immunization cards, so parents with young children could get in touch with a health worker
SMEs that use ICTs outperform those that do not
• A survey-based study of 951 SMEs in various industrial and geographical clusters across India , released in July 2013, found that – Of SMEs that use the Internet, 64 percent have seen an increase in sales, 65 percent an
increase in profits, 69 percent an increase in customers, and 63 percent an increase in geographic reach.
– Controlling for factors such as investment in plant and machinery, the age, sex and education of personnel, and ownership type, using the Internet in business operations increased revenue by 51 percent and profits by 49 percent.
– On average, an SME that uses the Internet is able to expand its customer base by 7 percent.
– An SME that adopts the Internet sees employment grow by 4 percent.
– SMEs that use the Internet intensively enjoy more financial growth than those who use it less. An SME that uses on average 10 GB of Internet data per month has 7 to 32 percent higher revenue and 8 to 43 percent higher profit, 13 percent higher employment, 22 percent higher employment growth, and 18 percent more customers than an SME using only 5 GB.
http://www.nathaninc.com/news/unleashing-potential-internet-and-small-firms-india

We can infer what the Myanmar Government values
Telenor
• 83% voice coverage & 78% data coverage by five years
• 70,000 SIM sales points
• 95,000 sales points for prepaid top-ups
• Peak prepaid voice < 25 MMK/mt
• SIM < 1500 MMK
• 200 community centers with Internet
• Free central government SMS channel
Ooredoo
• 84% voice & data coverage by five year
• 240,000 SIM sales points
• 720,000 sales points for prepaid top-ups
• Peak prepaid voice < 35 MMK/mt (on-net) & 45 MMK (off-net)
• SIM < 1500 MMK
• 10,000 telecenters + schools & hospitals
• 99.9% employees Myanmarese by five years
http://www.mcit.gov.mm/sites/default/files/press_conference_with_successful_applicants_20130710.pdf
What can regulation contribute to achieving these objectives?
• Ensure that needed investment occurs by minimizing regulatory risk
• Implement fair procedures to ensure that commitments given at time of licensing are kept
• Establish effective mechanisms to safeguard consumers in an imperfectly competitive market
• Facilitate productive harnessing of dynamism of global technological and market forces
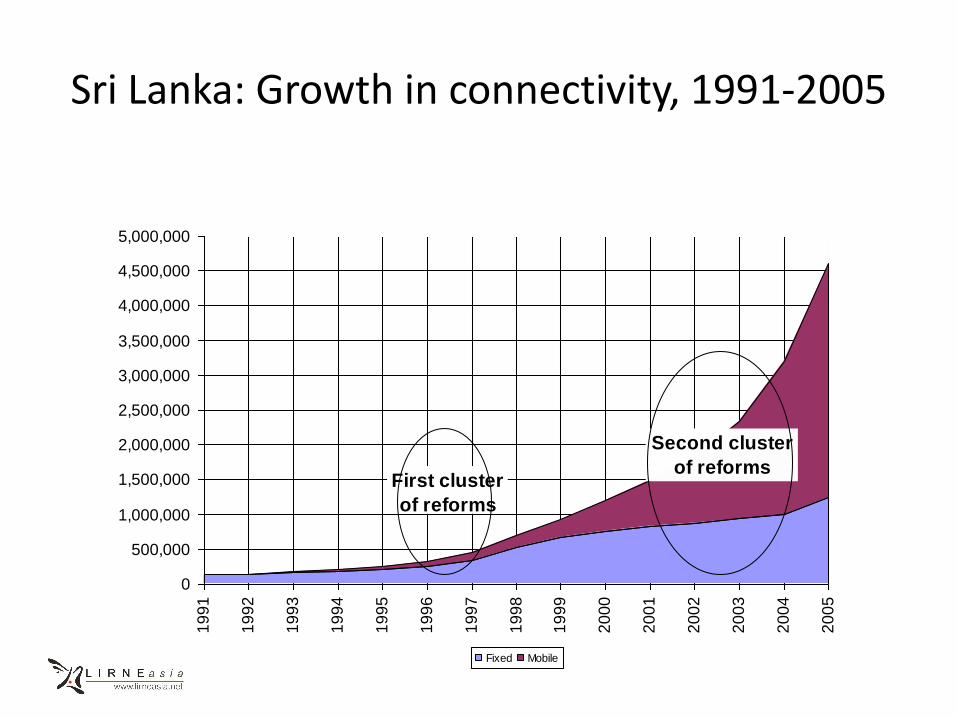
Sri Lanka: Growth in connectivity, 1991-2005
0
500,000
1,000,000
1,500,000
2,000,000
2,500,000
3,000,000
3,500,000
4,000,000
4,500,000
5,000,000
19
91
19
92
19
93
19
94
19
95
19
96
19
97
19
98
19
99
20
00
20
01
20
02
20
03
20
04
20
05
Fixed Mobile
First cluster
of reforms
Second cluster
of reforms
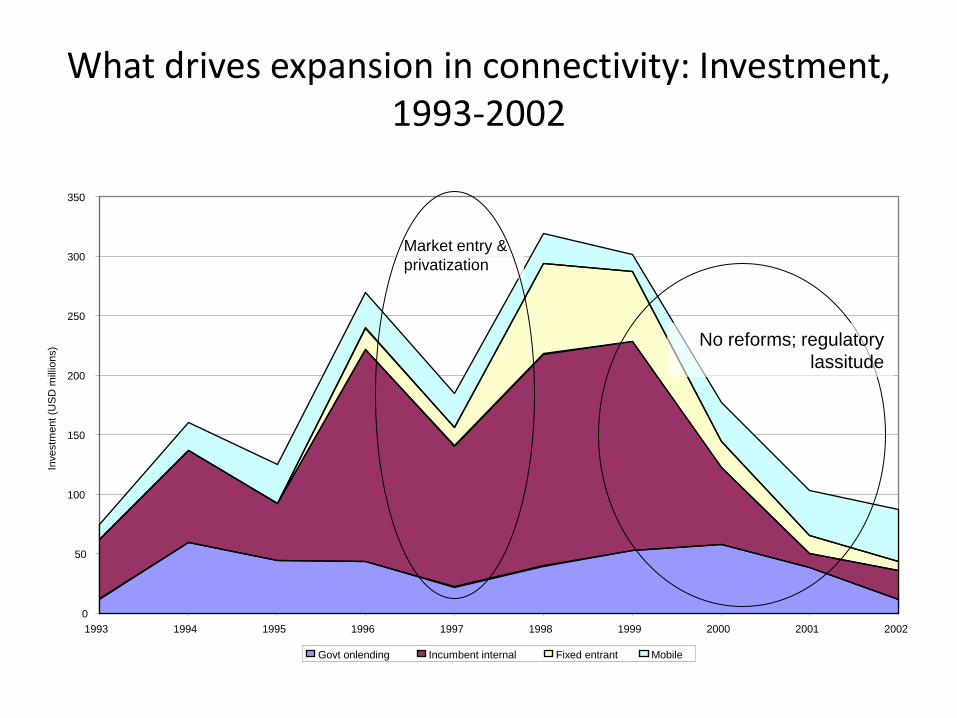
What drives expansion in connectivity: Investment, 1993-2002
0
50
100
150
200
250
300
350
1993 1994 1995 1996 1997 1998 1999 2000 2001 2002
Investm
ent (U
SD
mill
ions)
Govt onlending Incumbent internal Fixed entrant Mobile
No reforms; regulatory
lassitude
Market entry &
privatization
Other benefits of market reforms
• In 2003, Sri Lanka ended its international exclusivity by issuing authorizations for External Gateway Operators
– Implemented in March 2003
– Announced prior to the Initial Public Offering of incumbent (62% owned by government) in December 2002
• IPO succeeded (previous two attempts failed)
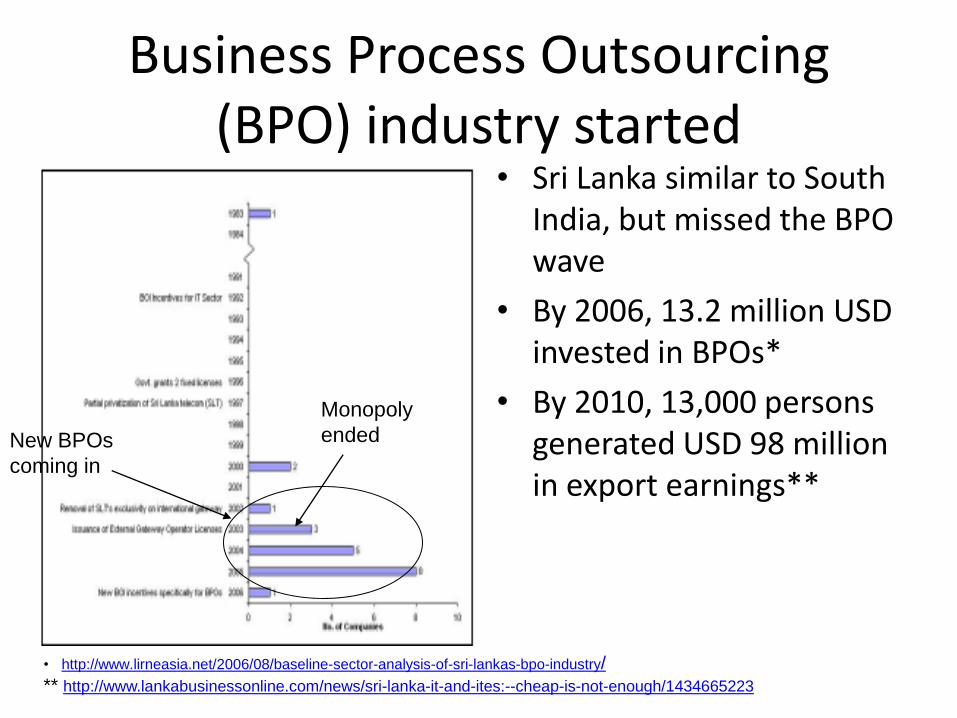
Business Process Outsourcing (BPO) industry started
• Sri Lanka similar to South
India, but missed the BPO wave
• By 2006, 13.2 million USD invested in BPOs*
• By 2010, 13,000 persons generated USD 98 million in export earnings**
Monopoly
ended New BPOs
coming in
• http://www.lirneasia.net/2006/08/baseline-sector-analysis-of-sri-lankas-bpo-industry/
** http://www.lankabusinessonline.com/news/sri-lanka-it-and-ites:--cheap-is-not-enough/1434665223

RATIONALE FOR REGULATION
Government actions and investment
• Government cannot eliminate market risk
– Duopolies, monopolies, exclusivities are examples • Cause long-term bad effects
• Government must reduce regulatory risk
– Term of art that is not limited to actions by regulatory agency • Actions to make market-entry rules rational and transparent
(policy-regulation)
• Actions to improve regulatory environment (regulator)
• Also, actions to make taxation and other general rules more coherent and transparent (government)
What is regulatory risk?
• Likelihood of administrative expropriation
• What is administrative expropriation?
– Expropriation other than nationalization
– May take forms such as
• Setting prices < long-run average costs
• Mandates re investment/equipment purchases
• Conditions in labor contracts
Why are regulatory risks high in infrastructure industries?
• High proportion of costs are sunk costs
– Willing to operate as long as operating costs covered, even if investment not recovered
• Broad distribution of consumers makes pricing/access inherently political
• Small number of suppliers monopoly/oligopoly; leading to vulnerability to public pressure
– Exacerbated by foreign investment

Black-letter law is necessary condition
• Experience during licensing showed the importance of having a legal framework
But implementation is what matters
• All the laws and regulations will mean little unless regulator performs
– Transparent, efficient, consultative action
– Communication of those actions to all stakeholders so that legitimacy is built up

ITU INDICATORS: WHAT TO THINK ABOUT
Value & weaknesses of ITU data
• Operators generate data; report to “national administrations”; who then report to ITU – Definitions are not always consistently applied – Sometimes estimates are used – Some lags due to multiple links in reporting chain
• But given easy availability & stature of ITU, very heavily used by international & national actors in decision making – Also feed into composite indices such as ICT Development Index (IDI); Network
Readiness Index (NRI); and E Readiness Index (ERI)
• Data (should) guide national-level actions; international perceptions affect investment and other actions that influence domestic outcomes – Therefore, important to pay attention to compilation of data, especially quality
and timeliness
• Focus here is on mobile SIMs/100; other indicators will become important for Myanmar over time
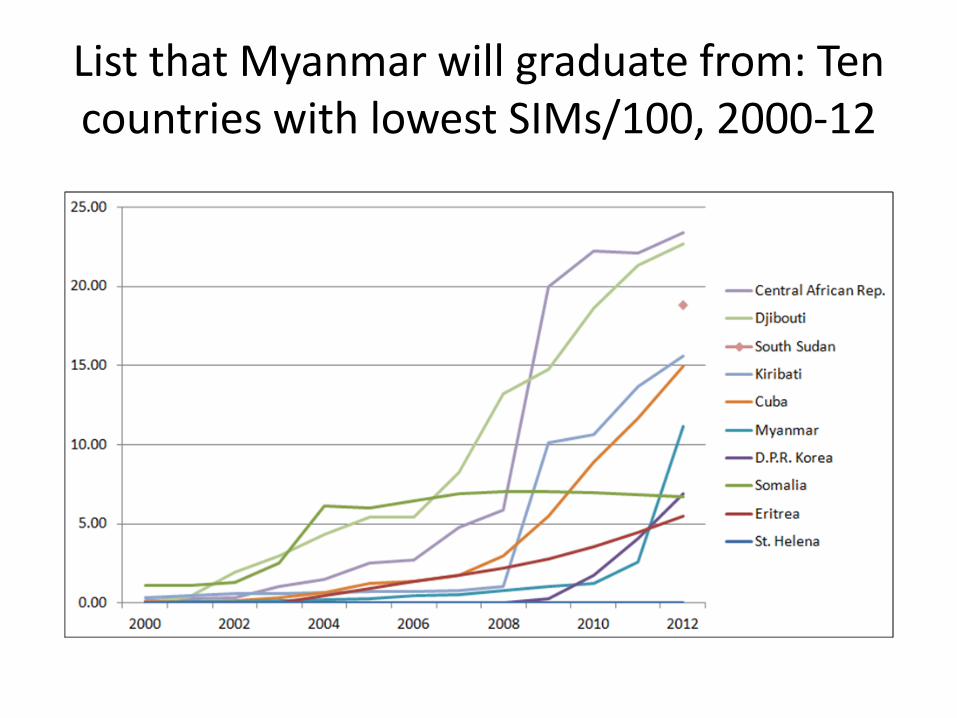
List that Myanmar will graduate from: Ten countries with lowest SIMs/100, 2000-12
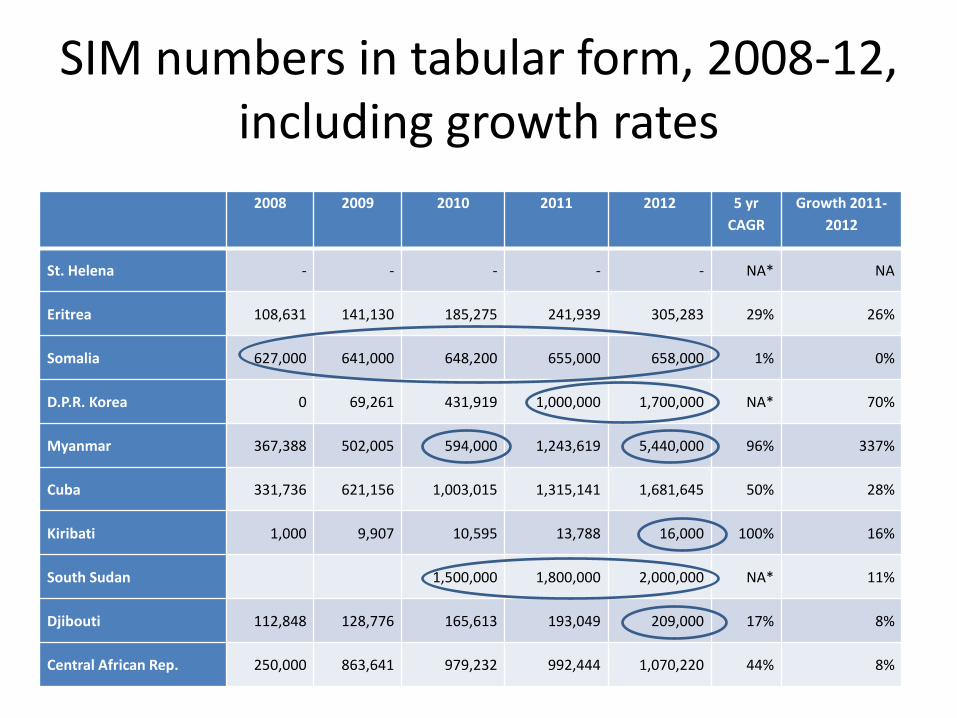
SIM numbers in tabular form, 2008-12, including growth rates
2008 2009 2010 2011 2012 5 yr
CAGR
Growth 2011-
2012
St. Helena - - - - - NA* NA
Eritrea 108,631 141,130 185,275 241,939 305,283 29% 26%
Somalia 627,000 641,000 648,200 655,000 658,000 1% 0%
D.P.R. Korea 0 69,261 431,919 1,000,000 1,700,000 NA* 70%
Myanmar 367,388 502,005 594,000 1,243,619 5,440,000 96% 337%
Cuba 331,736 621,156 1,003,015 1,315,141 1,681,645 50% 28%
Kiribati 1,000 9,907 10,595 13,788 16,000 100% 16%
South Sudan 1,500,000 1,800,000 2,000,000 NA* 11%
Djibouti 112,848 128,776 165,613 193,049 209,000 17% 8%
Central African Rep. 250,000 863,641 979,232 992,444 1,070,220 44% 8%
Discussion
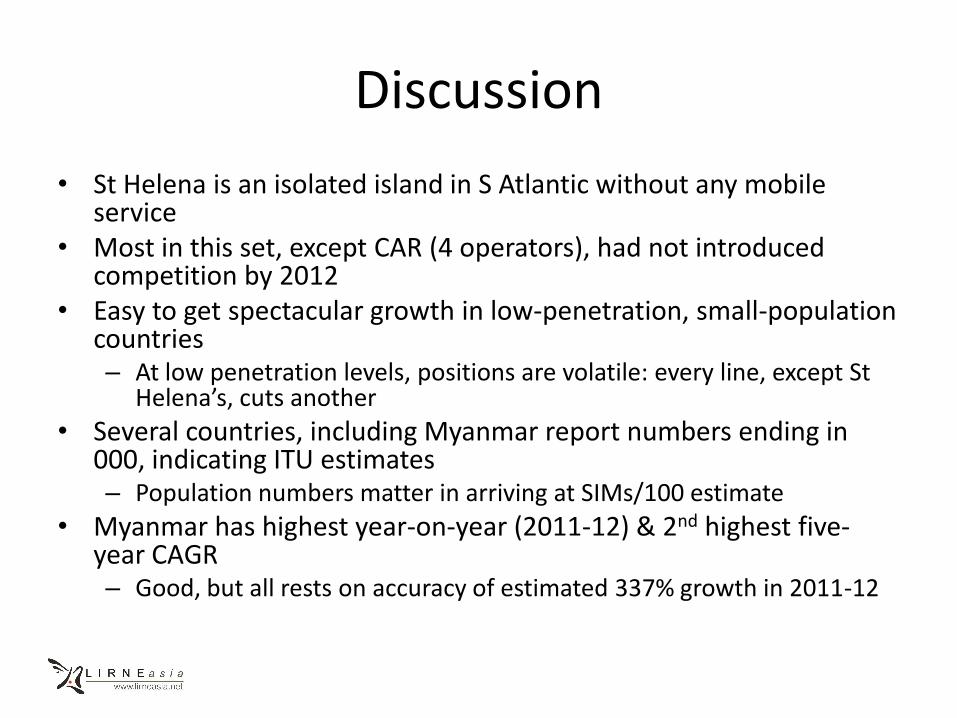
• St Helena is an isolated island in S Atlantic without any mobile service
• Most in this set, except CAR (4 operators), had not introduced competition by 2012
• Easy to get spectacular growth in low-penetration, small-population countries – At low penetration levels, positions are volatile: every line, except St
Helena’s, cuts another
• Several countries, including Myanmar report numbers ending in 000, indicating ITU estimates – Population numbers matter in arriving at SIMs/100 estimate
• Myanmar has highest year-on-year (2011-12) & 2nd highest five-year CAGR – Good, but all rests on accuracy of estimated 337% growth in 2011-12
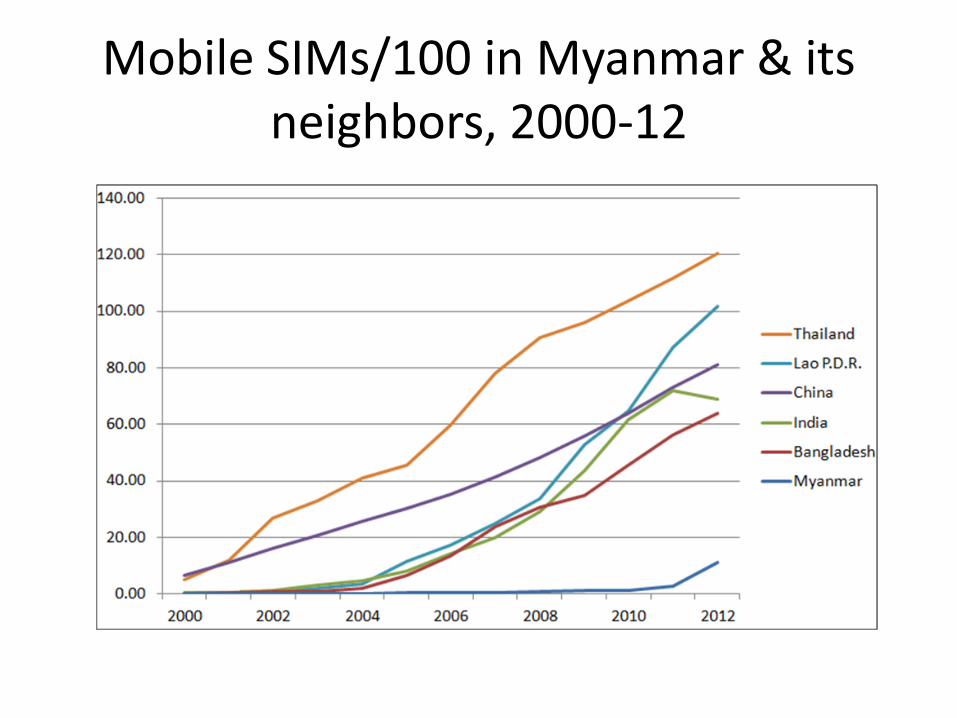
Mobile SIMs/100 in Myanmar & its neighbors, 2000-12
Discussion
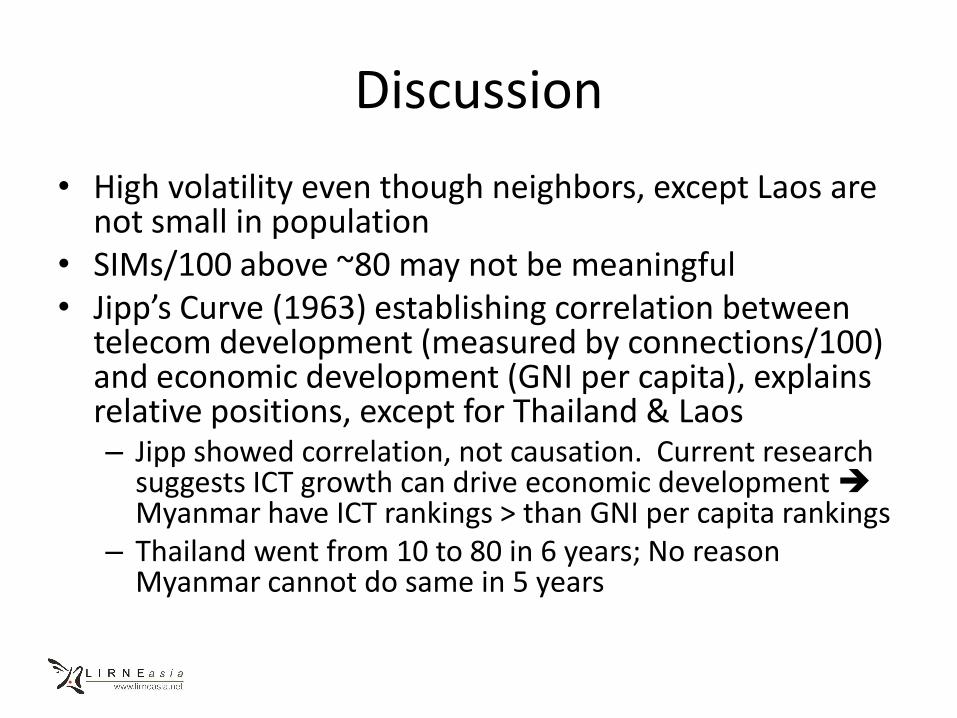
• High volatility even though neighbors, except Laos are not small in population
• SIMs/100 above ~80 may not be meaningful • Jipp’s Curve (1963) establishing correlation between
telecom development (measured by connections/100) and economic development (GNI per capita), explains relative positions, except for Thailand & Laos – Jipp showed correlation, not causation. Current research
suggests ICT growth can drive economic development Myanmar have ICT rankings > than GNI per capita rankings
– Thailand went from 10 to 80 in 6 years; No reason Myanmar cannot do same in 5 years
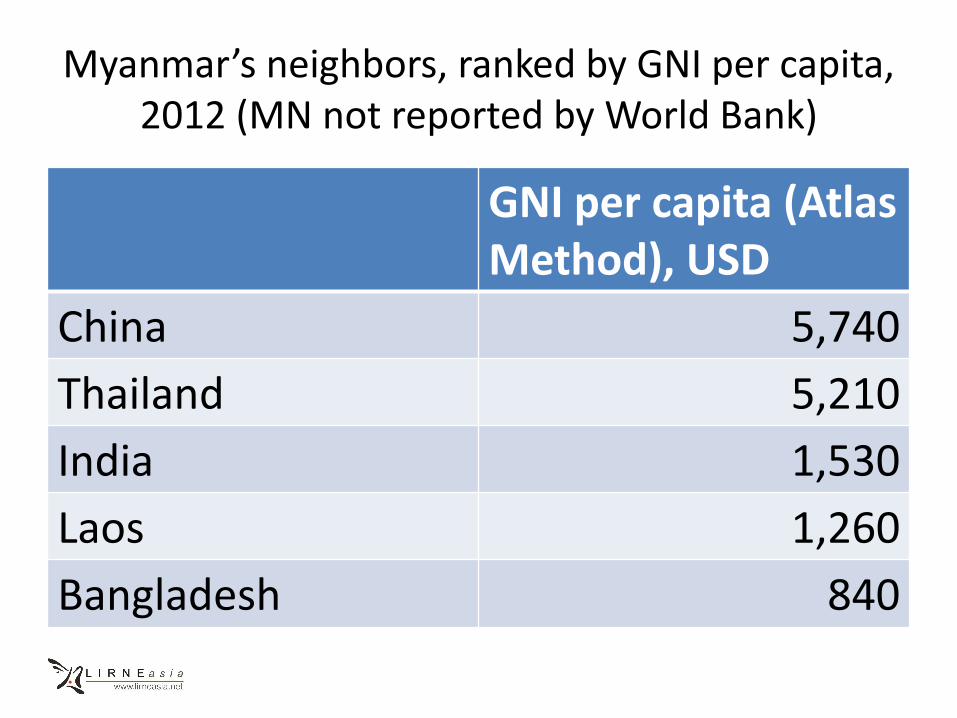
Myanmar’s neighbors, ranked by GNI per capita, 2012 (MN not reported by World Bank)
GNI per capita (Atlas Method), USD
China 5,740
Thailand 5,210
India 1,530
Laos 1,260
Bangladesh 840