Reflectance-mode interferometric near ... -...
4
Reflectance-mode interferometric near-infrared spectroscopy quantifies brain absorption, scattering, and blood flow index in vivo DAWID BORYCKI,OYBEK KHOLIQOV , AND VIVEK J. SRINIVASAN* Department of Biomedical Engineering, University of California Davis, Davis, California 95616, USA *Corresponding author: [email protected] Received 6 December 2016; accepted 16 December 2016; posted 3 January 2017 (Doc. ID 282266); published 30 January 2017 Interferometric near-infrared spectroscopy (iNIRS) is a new technique that measures time-of-flight- (TOF-) resolved autocorrelations in turbid media, enabling simultaneous estimation of optical and dynamical properties. Here, we demonstrate reflectance-mode iNIRS for noninvasive mon- itoring of a mouse brain in vivo. A method for more precise quantification with less static interference from superficial layers, based on separating static and dynamic components of the optical field autocorrelation, is presented. Absolute values of absorption, reduced scattering, and blood flow in- dex (BFI) are measured, and changes in BFI and absorption are monitored during a hypercapnic challenge. Absorption changes from TOF-resolved iNIRS agree with absorption changes from continuous wave NIRS analysis, based on TOF-integrated light intensity changes, an effective path length, and the modified Beer–Lambert Law. Thus, iNIRS is a promising approach for quantitative and non- invasive monitoring of perfusion and optical properties in vivo. © 2017 Optical Society of America OCIS codes: (030.6600) Statistical optics; (030.1640) Coherence; (160.4760) Optical properties; (170.6480) Spectroscopy, speckle. https://doi.org/10.1364/OL.42.000591 Quantifying optical properties to infer chromophore concentra- tions [1] and quantifying scattered light dynamics to infer scat- terer motion [2] are ongoing goals of near-infrared spectroscopy (NIRS) [3]. In biological tissue, the absorption coefficient, if measured at multiple wavelengths, yields oxy-hemoglobin con- centration, deoxy-hemoglobin concentration, and oxygen satu- ration. Coherent intensity fluctuations of multiply scattered light, if analyzed with a model informed by optical properties, yield scatterer motion due to blood flow [4]. The combination of oxygen saturation, hemoglobin content, and blood flow provides tissue oxygen consumption. Continuous wave (CW) NIRS measures reemitted light in- tensity and is the simplest and most widely used NIRS method [1,3]. However, accurate quantification of baseline optical properties using only light intensity requires additional assump- tions about scattered path length, instrumentation loss, and extracerebral confounds [3]. Hence, baseline oxygen saturation remains challenging to quantify robustly using CW NIRS. For baseline optical properties, time-domain (TD) and frequency- domain (FD) approaches [5,6] add an additional dimension to the measurement space to reduce the number of required assumptions. To determine blood flow, diffuse correlation spectroscopy (DCS) quantifies temporal intensity fluctuations of coherent light scattered from dynamic tissue [2,4]. DCS critically de- pends on optical properties in two ways. First, since DCS is a CW approach, the relevant field autocorrelation is an average of field autocorrelations over all photon path lengths, weighted by the optical property-dependent photon time-of-flight (TOF) distribution [7,8]. Second, the total photon momentum transfer, which depends on the reduced scattering coefficient (μ 0 s ) in the diffusion regime, is required to relate dynamics to an effective diffusion coefficient or blood flow index (BFI). In addition, conventional DCS requires ergodicity since it derives field autocorrelations from intensity fluctuations [9]. Recently, interferometric NIRS (iNIRS), based on the TOF-resolved measurement of coherent light reemitted from a turbid medium, was introduced [10]. This approach is based on interferometry using a tunable laser to achieve path length resolution [11,12]. A two-dimensional measurement of reemit- ted light provides TOF-resolved autocorrelations, from which optical and dynamical properties can be derived [10]. The iNIRS method recently was shown to also provide TOF- resolved field autocorrelations, more directly related to scatterer dynamics than TOF-integrated intensity autocorrelations pro- vided by DCS [13]. In this Letter, we validate iNIRS in reflec- tance mode using calibrated phantoms, and in the brain of a nude mouse, showing that iNIRS can simultaneously and noninvasively quantify optical properties and BFI in vivo. Here, we make use of the two-dimensional field autocorrela- tion, G iNIRS 1 τ s ; τ d hΓ rs τ s ;t d Γ rs τ s ;t d τ d i t d , measured as a function of TOF (τ s ) and lag time (τ d ). Γ rs τ s ;t d is the TOF-resolved mutual coherence function of the reference and sample fields (U r and U s , respectively): Γ rs τ s ;t d hU r t s ;t d U s t s τ s ;t d i t s . A light path can be envisioned as a series of scattering events, either from stationary tissue (static) or from blood (dynamic), Letter Vol. 42, No. 3 / February 1 2017 / Optics Letters 591 0146-9592/17/030591-04 Journal © 2017 Optical Society of America
Transcript of Reflectance-mode interferometric near ... -...

Reflectance-mode interferometric near-infraredspectroscopy quantifies brain absorption,scattering, and blood flow index in vivoDAWID BORYCKI, OYBEK KHOLIQOV, AND VIVEK J. SRINIVASAN*Department of Biomedical Engineering, University of California Davis, Davis, California 95616, USA*Corresponding author: [email protected]
Received 6 December 2016; accepted 16 December 2016; posted 3 January 2017 (Doc. ID 282266); published 30 January 2017
Interferometric near-infrared spectroscopy (iNIRS) is a newtechnique that measures time-of-flight- (TOF-) resolvedautocorrelations in turbid media, enabling simultaneousestimation of optical and dynamical properties. Here, wedemonstrate reflectance-mode iNIRS for noninvasive mon-itoring of a mouse brain in vivo. A method for more precisequantification with less static interference from superficiallayers, based on separating static and dynamic componentsof the optical field autocorrelation, is presented. Absolutevalues of absorption, reduced scattering, and blood flow in-dex (BFI) are measured, and changes in BFI and absorptionare monitored during a hypercapnic challenge. Absorptionchanges from TOF-resolved iNIRS agree with absorptionchanges from continuous wave NIRS analysis, based onTOF-integrated light intensity changes, an effective pathlength, and the modified Beer–Lambert Law. Thus,iNIRS is a promising approach for quantitative and non-invasive monitoring of perfusion and optical propertiesin vivo. © 2017 Optical Society of America
OCIS codes: (030.6600) Statistical optics; (030.1640) Coherence;
(160.4760) Optical properties; (170.6480) Spectroscopy, speckle.
https://doi.org/10.1364/OL.42.000591
Quantifying optical properties to infer chromophore concentra-tions [1] and quantifying scattered light dynamics to infer scat-terer motion [2] are ongoing goals of near-infrared spectroscopy(NIRS) [3]. In biological tissue, the absorption coefficient, ifmeasured at multiple wavelengths, yields oxy-hemoglobin con-centration, deoxy-hemoglobin concentration, and oxygen satu-ration. Coherent intensity fluctuations of multiply scatteredlight, if analyzed with a model informed by optical properties,yield scatterer motion due to blood flow [4]. The combination ofoxygen saturation, hemoglobin content, and blood flow providestissue oxygen consumption.
Continuous wave (CW) NIRS measures reemitted light in-tensity and is the simplest and most widely used NIRS method[1,3]. However, accurate quantification of baseline opticalproperties using only light intensity requires additional assump-tions about scattered path length, instrumentation loss, and
extracerebral confounds [3]. Hence, baseline oxygen saturationremains challenging to quantify robustly using CW NIRS. Forbaseline optical properties, time-domain (TD) and frequency-domain (FD) approaches [5,6] add an additional dimensionto the measurement space to reduce the number of requiredassumptions.
To determine blood flow, diffuse correlation spectroscopy(DCS) quantifies temporal intensity fluctuations of coherentlight scattered from dynamic tissue [2,4]. DCS critically de-pends on optical properties in two ways. First, since DCS isa CW approach, the relevant field autocorrelation is an averageof field autocorrelations over all photon path lengths, weightedby the optical property-dependent photon time-of-flight(TOF) distribution [7,8]. Second, the total photon momentumtransfer, which depends on the reduced scattering coefficient(μ 0
s ) in the diffusion regime, is required to relate dynamicsto an effective diffusion coefficient or blood flow index(BFI). In addition, conventional DCS requires ergodicity sinceit derives field autocorrelations from intensity fluctuations [9].
Recently, interferometric NIRS (iNIRS), based on theTOF-resolved measurement of coherent light reemitted froma turbid medium, was introduced [10]. This approach is basedon interferometry using a tunable laser to achieve path lengthresolution [11,12]. A two-dimensional measurement of reemit-ted light provides TOF-resolved autocorrelations, from whichoptical and dynamical properties can be derived [10]. TheiNIRS method recently was shown to also provide TOF-resolved field autocorrelations, more directly related to scattererdynamics than TOF-integrated intensity autocorrelations pro-vided by DCS [13]. In this Letter, we validate iNIRS in reflec-tance mode using calibrated phantoms, and in the brain of anude mouse, showing that iNIRS can simultaneously andnoninvasively quantify optical properties and BFI in vivo.
Here, we make use of the two-dimensional field autocorrela-tion, G�iNIRS�
1 �τs ;τd ��hΓ�rs�τs ;td �Γrs�τs ;td �τd �itd , measured
as a function of TOF (τs) and lag time (τd ). Γrs�τs ; td � is theTOF-resolved mutual coherence function of the referenceand sample fields (Ur and Us, respectively): Γrs�τs ; td � �hU �
r �t s; td �U s�t s � τs ; td �its .A light path can be envisioned as a series of scattering events,
either from stationary tissue (static) or from blood (dynamic),
Letter Vol. 42, No. 3 / February 1 2017 / Optics Letters 591
0146-9592/17/030591-04 Journal © 2017 Optical Society of America
where each scattering event has an associated momentumtransfer q and phase shift δr · q [14], where δr is scatterer dis-placement. Thus, the instantaneous TOF-resolved scatteredoptical field from the sample can be written as Us�τs ; td � �Uc�τs� � Uf �τs ; td �, where Uc is the static field contribution,arising from paths with static scattering events or dynamicscattering events with negligible phase shift, while Uf is thedynamic field contribution, arising from paths with dynamicscattering events with a phase shift. The static contributionis understood to be nonergodic over a certain time scale [9].Hence, the autocorrelation measured in iNIRS becomes [13]
G�iNIRS�1 �τs ; τd � � �I c�τs� � G1;f �τs ; τd �� � I 0�τs�; (1)
where I c�τs� � jUc�τs�j2 is the static distribution of time-of-flight (DTOF), G1;f �τs ; τd � � hU �
f �τs ; td �Uf �τs ; td � τd �itdis the dynamic autocorrelation, I0�τs� is the instrument re-sponse function (IRF), I f �τs� � G1;f �τs ; 0� is the dynamicDTOF, and “�” denotes convolution with respect to τs.
The static (I c , slowly decorrelating) and dynamic (G1;f ,rapidly decorrelating) components of the field autocorrelationfunction may be associated with different photon paths. Theratio of static to dynamic components should diminish forlarger TOFs, as momentum transfer from dynamic scatteringis more probable for long paths than short paths. By independ-ently assessing these two components, these paths may be inde-pendently probed. This new approach of correlation gating isused here to improve the accuracy of iNIRS analysis. In ourin vivo experiment, some photons may propagate through tis-sue without experiencing dynamic scattering events. Such staticphotons may not pass through blood, may not be diffuse,and thus should be excluded from an analysis that assumesdiffuse photons and an ergodic, uniformly absorbing medium.By using correlation gating to exclude I c and analyze I f orG1;f , it may be possible to better satisfy the assumptions of theMBLL and diffusion theory for an ergodic, uniformly absorbingmedium. By evaluating Eq. (1) at τd � 0, we obtain that
I �iNIRS�s �τs� � G�iNIRS�
1 �τs ; 0� � I s�τs� � I0�τs�, or the temporalpoint spread function (TPSF) is equal to the DTOF,I s�τs�� I c�τs��I f �τs�, convolved with the IRF. Alternatively,
I �iNIRS�s �τs� could have been obtained through conventional tem-poral speckle averaging. Since G1;f �τs ; τd � decorrelates with in-
creasing τd , the static TPSF can be determined by I �iNIRS�c �τs��
limτd→∞G�iNIRS�1 �τs ;τd �� I c�τs��I 0�τs�. Practically, the asymp-
totic limit is replaced by a time scale, τd � τd ;c , that experimen-tally defines the boundary between static and dynamic com-ponents. The TOF-dependent decay rate ξ�τs� of G1;f �τs ; τd �relates to the effective diffusion coefficient of light scatterers.Last, by subtracting I �iNIRS�
c �τs�,G�iNIRS�1;f �τs ;τd ��G1;f �τs ;τd ��
I 0�τs� yields the dynamic TPSF: I �iNIRS�f �τs� �G�iNIRS�
1;f �τs ;0� �I f �τs� � I 0�τs�.
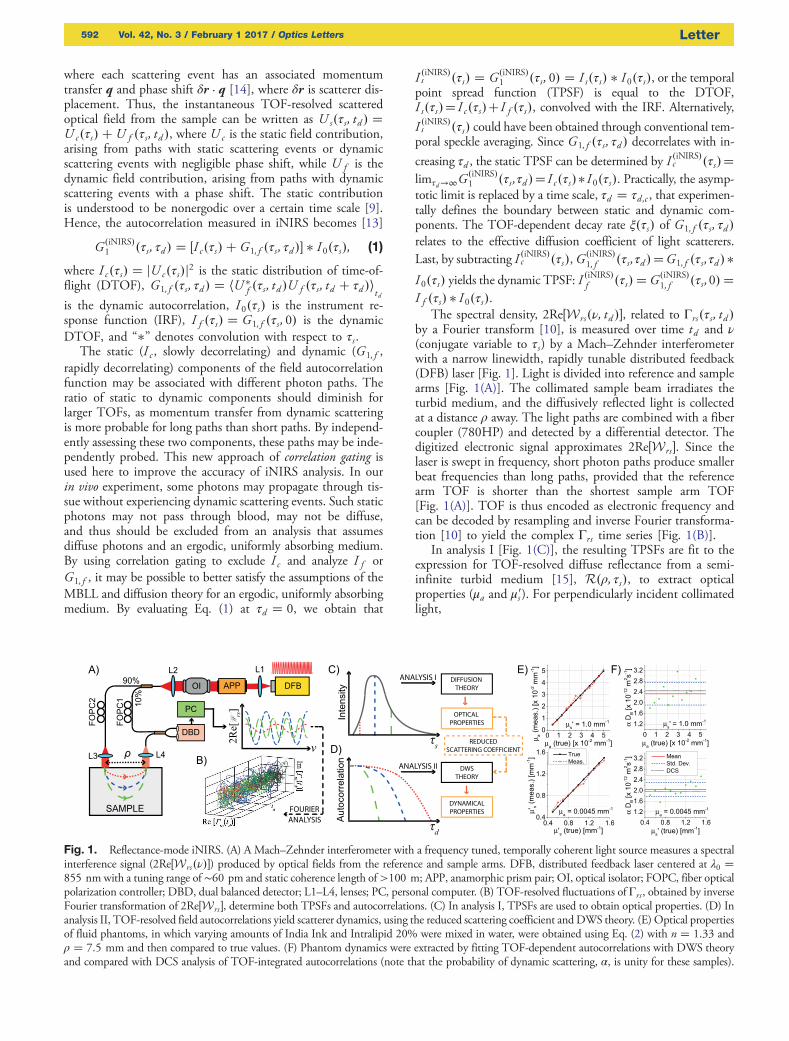
The spectral density, 2Re�Wrs�ν; td ��, related to Γrs�τs ; td �by a Fourier transform [10], is measured over time td and ν(conjugate variable to τs) by a Mach–Zehnder interferometerwith a narrow linewidth, rapidly tunable distributed feedback(DFB) laser [Fig. 1]. Light is divided into reference and samplearms [Fig. 1(A)]. The collimated sample beam irradiates theturbid medium, and the diffusively reflected light is collectedat a distance ρ away. The light paths are combined with a fibercoupler (780HP) and detected by a differential detector. Thedigitized electronic signal approximates 2Re�Wrs�. Since thelaser is swept in frequency, short photon paths produce smallerbeat frequencies than long paths, provided that the referencearm TOF is shorter than the shortest sample arm TOF[Fig. 1(A)]. TOF is thus encoded as electronic frequency andcan be decoded by resampling and inverse Fourier transforma-tion [10] to yield the complex Γrs time series [Fig. 1(B)].
In analysis I [Fig. 1(C)], the resulting TPSFs are fit to theexpression for TOF-resolved diffuse reflectance from a semi-infinite turbid medium [15], R�ρ; τs�, to extract opticalproperties (μa and μ 0
s ). For perpendicularly incident collimatedlight,
Fig. 1. Reflectance-mode iNIRS. (A) A Mach–Zehnder interferometer with a frequency tuned, temporally coherent light source measures a spectralinterference signal (2Re�Wrs�ν��) produced by optical fields from the reference and sample arms. DFB, distributed feedback laser centered at λ0 �855 nm with a tuning range of ∼60 pm and static coherence length of>100 m; APP, anamorphic prism pair; OI, optical isolator; FOPC, fiber opticalpolarization controller; DBD, dual balanced detector; L1–L4, lenses; PC, personal computer. (B) TOF-resolved fluctuations of Γrs, obtained by inverseFourier transformation of 2Re�Wrs �, determine both TPSFs and autocorrelations. (C) In analysis I, TPSFs are used to obtain optical properties. (D) Inanalysis II, TOF-resolved field autocorrelations yield scatterer dynamics, using the reduced scattering coefficient andDWS theory. (E) Optical propertiesof fluid phantoms, in which varying amounts of India Ink and Intralipid 20% were mixed in water, were obtained using Eq. (2) with n � 1.33 andρ � 7.5 mm and then compared to true values. (F) Phantom dynamics were extracted by fitting TOF-dependent autocorrelations with DWS theoryand compared with DCS analysis of TOF-integrated autocorrelations (note that the probability of dynamic scattering, α, is unity for these samples).
592 Vol. 42, No. 3 / February 1 2017 / Optics Letters Letter
R�ρ; τs� �exp�−μacτs∕n − ρ2∕2σ2t �4πσ2t τ
3∕2s
ffiffiffiffiffiffiffiffiffiffiffiffiffiffiffiffi4πDc∕n
p�z0 exp
�−
z20ϰ�τs�
�
� �z0 � 2zb� exp�−�z0 � 2zb�2
ϰ�τs�
��; (2)
where c denotes the speed of light, D � 13μ 0
sis the diffusion
coefficient, z0 � 3D denotes the depth of the positive imagesource, while zb � 2D�1� R�∕�1 − R� is the extrapolatedboundary corresponding to the negative image source locatedat z � −z0 − 2zb, and R � −1.4399n−2 � 0.7099n−1 �0.6681� 0.0636n denotes the reflection coefficient [16],which depends on the refractive index n, and ϰ�τs� �4Dcτs∕n, whereas σ2t � σ2s � σ2d � 2Dcτs∕n incorporatesthe extended source and detector collimated modes, describedby Gaussian intensity distributions with experimentally deter-mined variances of σ2s � 0.09 mm2 and σ2d � 0.04 mm2,respectively [10].
To incorporate finite TOF resolution, R�ρ; τs� is then con-volved with the IRF. The shape of the IRF is determined from afree-space transmission measurement. To obtain the reflectance-mode IRF, the transmission-mode IRF is then shifted along theTOF axis, so its peak coincides with τs � 0. This reference pointis obtained from the peak location of the TPSF acquired for ρ �0 and corrected based on Monte Carlo simulations. The fittingwindow starts at τs � 35 ps to exclude some nondiffuse, earlylight and continues into the tails as long as the peak-normalizedTPSF values are larger than 0.1. Fitting results (based on N �40; 000 iNIRS signals acquired with a laser sweep duration of∼10 μs at 50 kHz with∼25 mW incident power) in fluid phan-toms [Fig. 1(E)] support the capability to quantify optical prop-erties within the physiological range.
Given the optical properties, sample dynamics can be ob-tained from analysis II [Fig. 1(D)]. According to diffusing wavespectroscopy (DWS) theory, the TOF-resolved normalizedfield autocorrelation is [7] g �DWS�
1 �τs ; τd � � exp�−ξ�τs�τd �,where ξ�τs� � 2k2αDBμ
0s cτs∕n is the TOF-resolved decay rate,
where k is the medium wave number, αDB is the BFI, the prod-uct of the probability of dynamic scattering, α, and the effectivediffusion coefficient, DB [4]. Thus, the field fluctuation rateincreases with photon path length, l � cτs∕n, and μ 0
s . IniNIRS, both are known, so the sample dynamics, quantifiedby αDB, can be directly determined by fitting g �iNIRS�
1;f �τs ; τd � �G�iNIRS�
1;f �τs ; τd �∕G�iNIRS�1;f �τs ; 0� with DWS theory. This pro-
cedure neglects the possibility of multiple decay rates, weightedby the DTOF, within the IRF window (∼45 ps FWHM). Forfluid phantoms [Fig. 1(F)], we obtained αDB � �2.330.42� × 10−12 m2 s−1 and αDB � �2.04 0.26� × 10−12 m2 s−1
for samples with varying absorption and scattering, respectively,in agreement with prior results [10]. TOF-integrated autocor-relations were fit with correlation diffusion equation solutionsfor reflectance as in DCS [4]. The average DCS αDB value isshown in Fig. 1(F) as a dotted line.
Next, iNIRS was performed in a nude mouse (male, SKH-1E Charles River) brain during a hypercapnic challenge in vivo.Anesthesia was induced using a mixture of isoflurane, medicalair, and oxygen. The mouse was placed on a heating pad andimmobilized in a stereotactic frame. Isoflurane was maintainedat 1.2% v/v during data acquisition to maintain vasoreactivity.After recording the TPSF for ρ � 0, the source and detector
light beams were separated by a distance ρ � 7.5 mm betweenthe parietal cortices of the right and left hemispheres. The CO2
supply was changed from 0% (normocapnia) to 7.5% (hyper-capnia) and then back to 0%. During each stage, measurementscontaining N � 40; 000 iNIRS signals (0.8 s per measure-ment) were recorded at intervals of ∼17 s. Last, the referencearm signal alone was acquired. All experimental procedures andprotocols were reviewed and approved by the UC DavisInstitutional Animal Care and Use Committee.
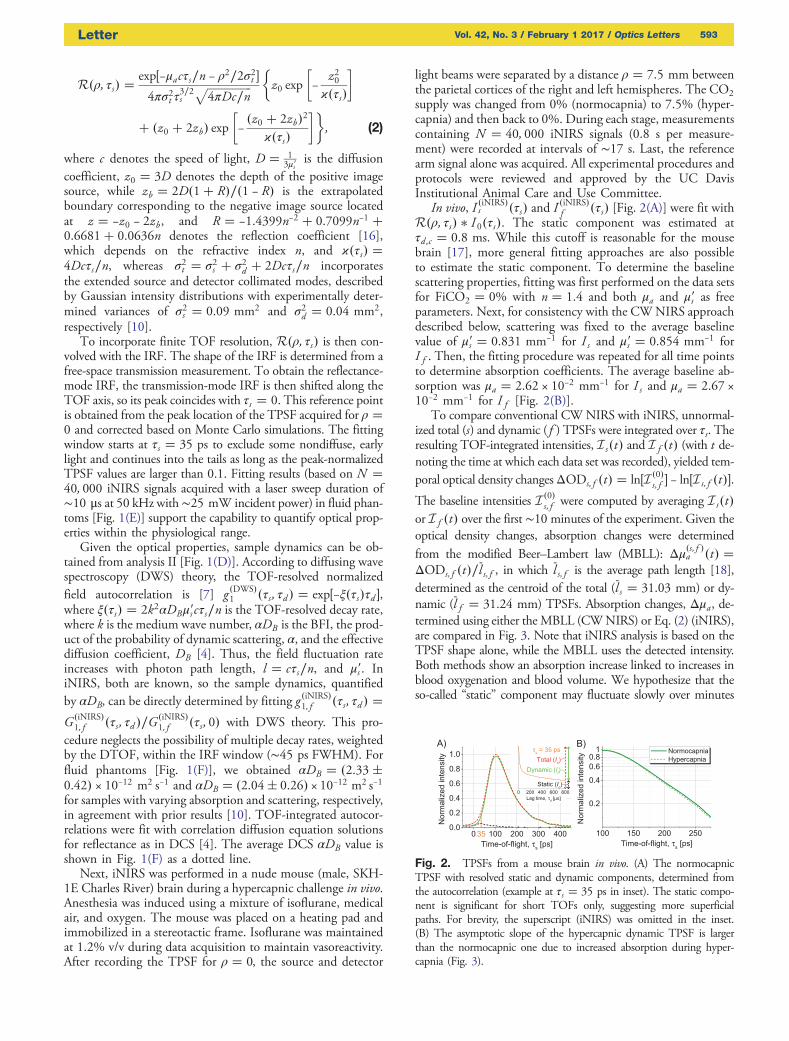
In vivo, I �iNIRS�s �τs� and I �iNIRS�
f �τs� [Fig. 2(A)] were fit withR�ρ; τs� � I 0�τs�. The static component was estimated atτd ;c � 0.8 ms. While this cutoff is reasonable for the mousebrain [17], more general fitting approaches are also possibleto estimate the static component. To determine the baselinescattering properties, fitting was first performed on the data setsfor FiCO2 � 0% with n � 1.4 and both μa and μ 0
s as freeparameters. Next, for consistency with the CWNIRS approachdescribed below, scattering was fixed to the average baselinevalue of μ 0
s � 0.831 mm−1 for I s and μ 0s � 0.854 mm−1 for
I f . Then, the fitting procedure was repeated for all time pointsto determine absorption coefficients. The average baseline ab-sorption was μa � 2.62 × 10⁻² mm−1 for I s and μa � 2.67 ×10⁻² mm−1 for I f [Fig. 2(B)].
To compare conventional CW NIRS with iNIRS, unnormal-ized total (s) and dynamic (f ) TPSFs were integrated over τs. Theresulting TOF-integrated intensities, I s�t� and I f �t� (with t de-noting the time at which each data set was recorded), yielded tem-poral optical density changesΔODs;f �t� � ln�I �0�
s;f � − ln�I s;f �t��.The baseline intensities I �0�
s;f were computed by averaging I s�t�or I f �t� over the first ∼10minutes of the experiment. Given theoptical density changes, absorption changes were determinedfrom the modified Beer–Lambert law (MBLL): Δμ�s;f �a �t� �ΔODs;f �t�∕l̄ s;f , in which l̄ s;f is the average path length [18],determined as the centroid of the total (l̄ s � 31.03 mm) or dy-namic (l̄ f � 31.24 mm) TPSFs. Absorption changes, Δμa, de-termined using either the MBLL (CWNIRS) or Eq. (2) (iNIRS),are compared in Fig. 3. Note that iNIRS analysis is based on theTPSF shape alone, while the MBLL uses the detected intensity.Both methods show an absorption increase linked to increases inblood oxygenation and blood volume. We hypothesize that theso-called “static” component may fluctuate slowly over minutes
Fig. 2. TPSFs from a mouse brain in vivo. (A) The normocapnicTPSF with resolved static and dynamic components, determined fromthe autocorrelation (example at τs � 35 ps in inset). The static compo-nent is significant for short TOFs only, suggesting more superficialpaths. For brevity, the superscript (iNIRS) was omitted in the inset.(B) The asymptotic slope of the hypercapnic dynamic TPSF is largerthan the normocapnic one due to increased absorption during hyper-capnia (Fig. 3).
Letter Vol. 42, No. 3 / February 1 2017 / Optics Letters 593
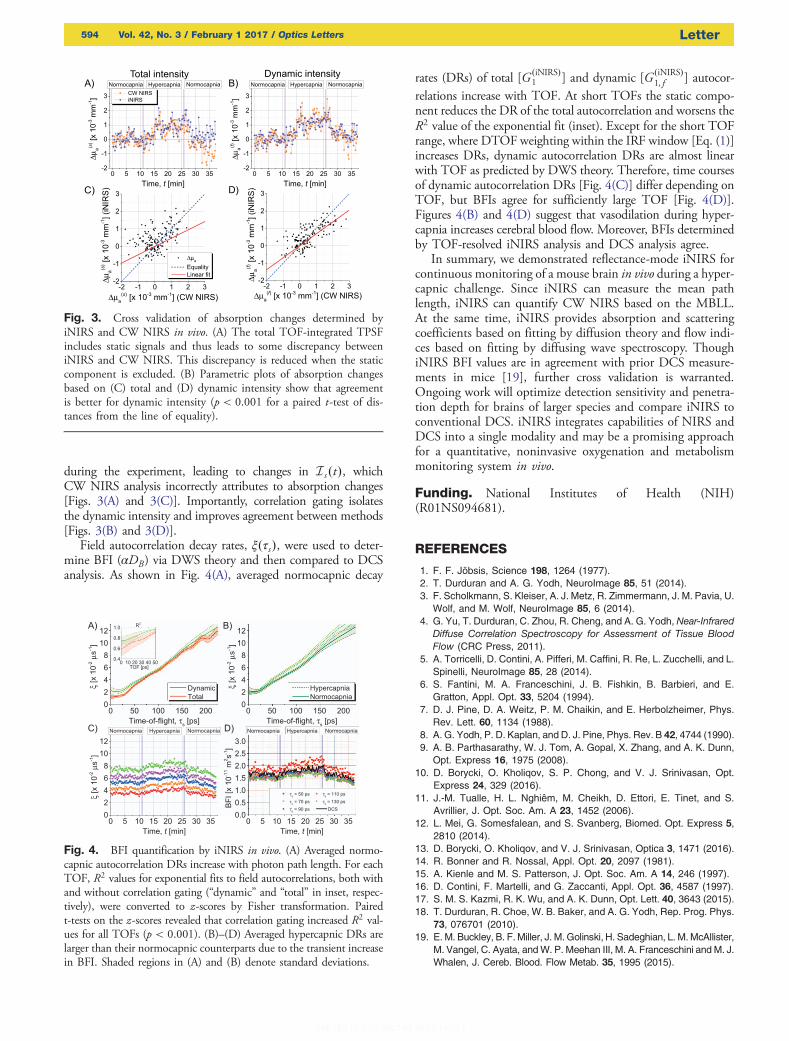
during the experiment, leading to changes in I s�t�, whichCW NIRS analysis incorrectly attributes to absorption changes[Figs. 3(A) and 3(C)]. Importantly, correlation gating isolatesthe dynamic intensity and improves agreement between methods[Figs. 3(B) and 3(D)].
Field autocorrelation decay rates, ξ�τs�, were used to deter-mine BFI (αDB) via DWS theory and then compared to DCSanalysis. As shown in Fig. 4(A), averaged normocapnic decay
rates (DRs) of total [G�iNIRS�1 ] and dynamic [G�iNIRS�
1;f ] autocor-relations increase with TOF. At short TOFs the static compo-nent reduces the DR of the total autocorrelation and worsens theR2 value of the exponential fit (inset). Except for the short TOFrange, where DTOF weighting within the IRF window [Eq. (1)]increases DRs, dynamic autocorrelation DRs are almost linearwith TOF as predicted by DWS theory. Therefore, time coursesof dynamic autocorrelation DRs [Fig. 4(C)] differ depending onTOF, but BFIs agree for sufficiently large TOF [Fig. 4(D)].Figures 4(B) and 4(D) suggest that vasodilation during hyper-capnia increases cerebral blood flow. Moreover, BFIs determinedby TOF-resolved iNIRS analysis and DCS analysis agree.
In summary, we demonstrated reflectance-mode iNIRS forcontinuous monitoring of a mouse brain in vivo during a hyper-capnic challenge. Since iNIRS can measure the mean pathlength, iNIRS can quantify CW NIRS based on the MBLL.At the same time, iNIRS provides absorption and scatteringcoefficients based on fitting by diffusion theory and flow indi-ces based on fitting by diffusing wave spectroscopy. ThoughiNIRS BFI values are in agreement with prior DCS measure-ments in mice [19], further cross validation is warranted.Ongoing work will optimize detection sensitivity and penetra-tion depth for brains of larger species and compare iNIRS toconventional DCS. iNIRS integrates capabilities of NIRS andDCS into a single modality and may be a promising approachfor a quantitative, noninvasive oxygenation and metabolismmonitoring system in vivo.
Funding. National Institutes of Health (NIH)(R01NS094681).
REFERENCES
1. F. F. Jöbsis, Science 198, 1264 (1977).2. T. Durduran and A. G. Yodh, NeuroImage 85, 51 (2014).3. F. Scholkmann, S. Kleiser, A. J. Metz, R. Zimmermann, J. M. Pavia, U.
Wolf, and M. Wolf, NeuroImage 85, 6 (2014).4. G. Yu, T. Durduran, C. Zhou, R. Cheng, and A. G. Yodh, Near-Infrared
Diffuse Correlation Spectroscopy for Assessment of Tissue BloodFlow (CRC Press, 2011).
5. A. Torricelli, D. Contini, A. Pifferi, M. Caffini, R. Re, L. Zucchelli, and L.Spinelli, NeuroImage 85, 28 (2014).
6. S. Fantini, M. A. Franceschini, J. B. Fishkin, B. Barbieri, and E.Gratton, Appl. Opt. 33, 5204 (1994).
7. D. J. Pine, D. A. Weitz, P. M. Chaikin, and E. Herbolzheimer, Phys.Rev. Lett. 60, 1134 (1988).
8. A. G. Yodh, P. D. Kaplan, and D. J. Pine, Phys. Rev. B 42, 4744 (1990).9. A. B. Parthasarathy, W. J. Tom, A. Gopal, X. Zhang, and A. K. Dunn,
Opt. Express 16, 1975 (2008).10. D. Borycki, O. Kholiqov, S. P. Chong, and V. J. Srinivasan, Opt.
Express 24, 329 (2016).11. J.-M. Tualle, H. L. Nghiêm, M. Cheikh, D. Ettori, E. Tinet, and S.
Avrillier, J. Opt. Soc. Am. A 23, 1452 (2006).12. L. Mei, G. Somesfalean, and S. Svanberg, Biomed. Opt. Express 5,
2810 (2014).13. D. Borycki, O. Kholiqov, and V. J. Srinivasan, Optica 3, 1471 (2016).14. R. Bonner and R. Nossal, Appl. Opt. 20, 2097 (1981).15. A. Kienle and M. S. Patterson, J. Opt. Soc. Am. A 14, 246 (1997).16. D. Contini, F. Martelli, and G. Zaccanti, Appl. Opt. 36, 4587 (1997).17. S. M. S. Kazmi, R. K. Wu, and A. K. Dunn, Opt. Lett. 40, 3643 (2015).18. T. Durduran, R. Choe, W. B. Baker, and A. G. Yodh, Rep. Prog. Phys.
73, 076701 (2010).19. E. M. Buckley, B. F.Miller, J. M. Golinski, H. Sadeghian, L. M.McAllister,
M. Vangel, C. Ayata, andW. P. Meehan III, M. A. Franceschini and M. J.Whalen, J. Cereb. Blood. Flow Metab. 35, 1995 (2015).
Fig. 3. Cross validation of absorption changes determined byiNIRS and CW NIRS in vivo. (A) The total TOF-integrated TPSFincludes static signals and thus leads to some discrepancy betweeniNIRS and CW NIRS. This discrepancy is reduced when the staticcomponent is excluded. (B) Parametric plots of absorption changesbased on (C) total and (D) dynamic intensity show that agreementis better for dynamic intensity (p < 0.001 for a paired t-test of dis-tances from the line of equality).
Fig. 4. BFI quantification by iNIRS in vivo. (A) Averaged normo-capnic autocorrelation DRs increase with photon path length. For eachTOF, R2 values for exponential fits to field autocorrelations, both withand without correlation gating (“dynamic” and “total” in inset, respec-tively), were converted to z-scores by Fisher transformation. Pairedt-tests on the z-scores revealed that correlation gating increased R2 val-ues for all TOFs (p < 0.001). (B)–(D) Averaged hypercapnic DRs arelarger than their normocapnic counterparts due to the transient increasein BFI. Shaded regions in (A) and (B) denote standard deviations.
594 Vol. 42, No. 3 / February 1 2017 / Optics Letters Letter