Refining Software Development Estimation Techniques for ... · Note 2: FDP, TTS, SDP, DS, CPT, WDP,...
46
Refining Software Development Estimation Techniques for the Federal Aviation Administration En Route Systems Acquisition Presenter: Jeffrey O’Leary En Route Software Acquisition and Development Manager Federal Aviation Administration (202) 366-5942 [email protected] January 28, 2003
Transcript of Refining Software Development Estimation Techniques for ... · Note 2: FDP, TTS, SDP, DS, CPT, WDP,...

Refining Software DevelopmentEstimation Techniques
for theFederal Aviation AdministrationEn Route Systems Acquisition
Presenter:Jeffrey O’Leary
En Route Software Acquisition and Development ManagerFederal Aviation Administration
(202) [email protected]
January 28, 2003

2
Refining Software Development EstimationTechniques
• Jeffrey O’Leary, Federal Aviation Administration
• A. Winsor Brown, USC Center for SoftwareEngineering
• Mike Liggan, MITRE CAASD
• Martin Merlo, Northrop Grumman
• Alok Srivastava, Northrop Grumman
• Robert Leonard, Northrop Grumman

3
Goals of Presentation
• Our approach to “Refining Software DevelopmentEstimation Techniques”
• Overview of FAA SIS, the “En Route” Air Traffic ControlDomain and En Route Automation Modernization (ERAM)program
• FAA software estimation problems and needs
• Function Point Methodology and our efforts to adopt andapply it
• Our experience developing an historical database andmetrics
• Current tailoring, application and plans for use ofCOCOMO II

4
Outline
• Overview
• Function Point Methodology
• Developing Historical Database
• Application of COCOMO II
• Concluding Remarks

5
• ~ 500 FAAManaged AirTraffic ControlTowers
• ~ 180 TerminalRadar ControlCenters
• 20 EnrouteCenters
• ~ 60 FlightService Stations
• ~ 40,000 Radars,NAVAIDs,Radios, etc.
Each day, manage 30,000 commercial flights to safely move 2,000,000 passengers
The FAA’s Job

6
Airlines, Pilots, GA, Military
Flight DataSpecialists
Traffic FlowManagement
Air TrafficControllers
Airspace &Procedures
SystemMaintainers
Weather Service Quality
Assurance
Stakeholders & UsersSystem
Operators
Domestic Air Traffic Control

7
En Route Automation Systems
• Consist of a number of software intensive systems
300
400
472
Mainframe / Jovial, BAL
Mainframe / Custom OS, BAL
Various Support / Jovial, Bal, REXX
NAS Host
500 +Various / C, C++, Jovial, AssyDARC, CPDLC, PAMRI
105
64
229
222
Client/Server (UNIX) / Ada95
Display X-Windows/ Ada83, C
Dist. RT (Unix/Posix)/ Ada95, C
Support Applications/ Ada, C, SQL
User Request EvaluationTool
440
350
Distributed (UNIX) / Ada83, C
Support Applications/ Ada, C, Fortran
Display System
Size (SLOC 000s)Type/Primary Language(s)System

8
What is the Problem with the CurrentInfrastructure Architecture?
• The HOST computer software is 30 years-old– Outmoded design for limited memory & processing– Rigid structure – closed architecture– Failure modes require operator intervention– Non-ATC software integrated with core capability– Existing code written in obscure languages – JOVIAL/BAL– Adaptation evolved to address shortcomings
• Hardware obsolescence is on the horizon– Most recent replacement was for Y2K– Maintenance on processors currently ends in 2008– Porting existing code to new machines does not resolve
design limitations

9
ERAM Infrastructure Acquisition
• Replaces:– Host computer system software/hardware– Direct Access Radar Channel (DARC) software/hardware– Other associated interfaces, communications and support infrastructure
• Provides:– New automation architecture allows future growth and capabilities– New capabilities to support flexible routing, new surveillance types and
sensors, full capability including safety alerts on back up system• Attributes:
– Leverages recent and ongoing SIS developments and deployments –product line evolution
– Initial Size Est. 1.1 to 1.3 MSLOC with 45 to 55% from NDI/Reuseopportunities (that estimate was derived largely by analogy with“comparable” FAA and non-FAA systems
Modernizes en route automation and infrastructure to provide an open-standardsbased system that will be the basis for future capabilities and enhancements

10
Pre 1998
Today
2008 &Beyond
ARTCCTrainingSystem
AcademyTrainingSystem
M&C forNon ATCSystems
Host (3083FDP/SDP/DYSIM)
PVD’s
(ControllerDisplays)
DisplayChannelsDisplay
Processing
PAMRIInterfaces
DAS RSD andAssortedMonitors
Transition
URET/CCLD
HOST (HOCSR)(HW Refresh
3083-63)
PeripheralsRefresh
Backup SDP(with safety
Alerts)
URETFully
RedundantFDP
FullyRedundant
SDP
IntegratedDisplay
Services
*DSR TechRefresh
ERAM
Monitor andControl
*URETNational
Deployment
*ECG
DSR
New CHI, M&C
DARC DPRefresh
Legacy
Non ERAMERAM
GeneralInformationProcessing
DARC Back upSDP (no safety
alerts)
* = Program dependency
En Route Domain Evolution

11
Software Estimation Challenge
Problem: Federal Agencies are not very good at softwareestimating!
Contributors:• We are primarily acquirers not developers
– Lack of resources and SIS estimating experience
• Estimation by analogy is hazardous– Language, technology and environment differences– Analogous systems, often legacy, are not good matches
• TOOLs: COCOMO, SLIM™, SEER™, etc. dependencies– Good independent size estimate– Valid historical data from comparable systems– Best for “Neat” systems not Systems of Systems with COTS,
Reuse, and system interdependencies
12
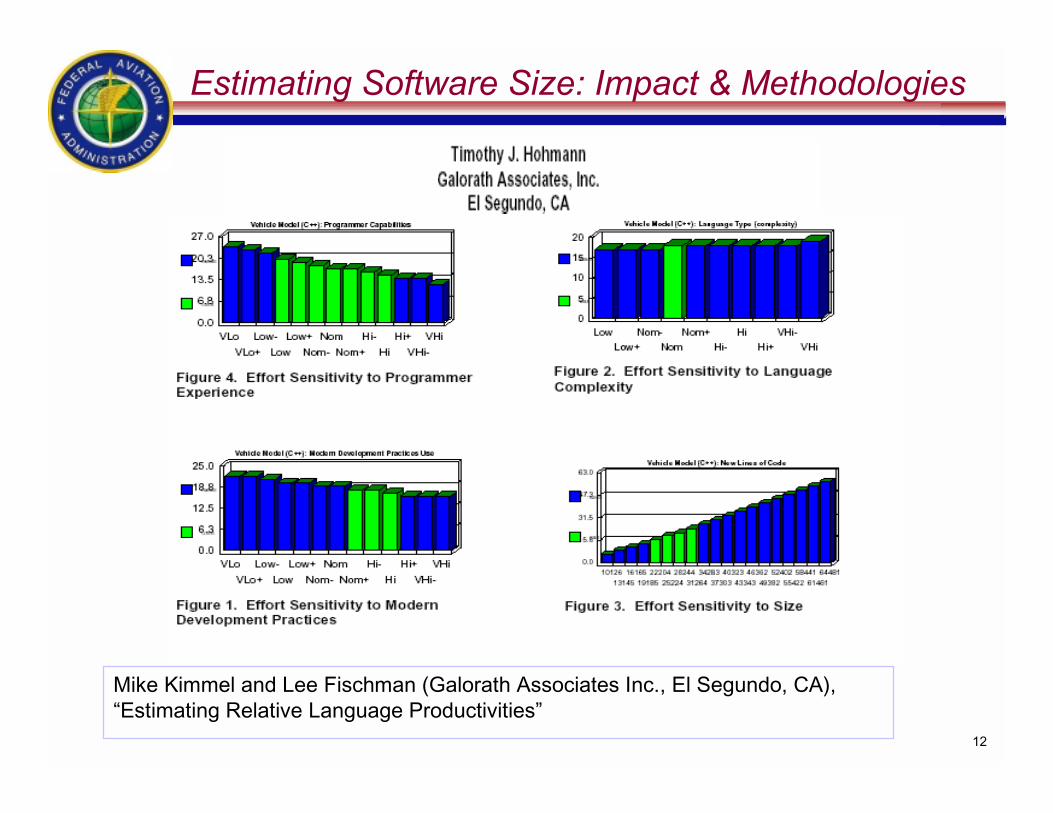
Mike Kimmel and Lee Fischman (Galorath Associates Inc., El Segundo, CA),“Estimating Relative Language Productivities”
Estimating Software Size: Impact & Methodologies

13
AT Controller
FlightData
Processing
Tracks,Flight Control Data,Altitude Data,SAA Definitions Status,Initiation, Updates,Coasting, Termination,Reasonable Climb/ Descent Rate
GeneralInformationProcessing
SurveillanceInterfaces
Controller PilotData Link
Communications
Approved AmendmentsTransfer of ControlTBD
Control DirectivesRelease Data
TimeComponent Status
SAR Data
DSSOP
User CommandsPref. Set DataPref. Set Data
AT Specialist
PP
Other ARTCCSystems
Non U.S. ATCFacilities
U.S. Govt.Agencies
User CommandsSurface Observations
RUC Gridded Wind/TempNEXRAD
Wx ReportsSIGMETs
Surface Observations
Wx Report RequestSurface ObservationsWx ReportsSIGMETs
SUPPORTENVIRONMENT
Target ReportsRadar Wx Reports
Test Target ReportsSensor Status Reports
Strobe Reports
CENRAP Reports
PressureObservations
User CommandsAT Controller Views
Print Data
SimulatedCommands
RUC Gridded WxNEXRAD Wx
Flight DataControl Data
Simulated – Surv. Data, Flight Data, RUC
User Commands CPDLC DataCPDLC Data
UplinksFMS Session MgmtDownlinksFMS Session Mgmt
NIMS
User CommandsApproved Correction Params
QC Alerts/Reports
ExternalTime
Status
U.S
. AT
CF
acilitiesF
MS
/Pilo
t
PressureTemperature
Winds
M&C Operator
Flight DataControl Data
Proposed Flight Data
AirspaceUsers
Active Flight Data CMS
DisplaySystem
Surveillance Data
Processing
WMSCR
Co
ded
Tim
eS
ou
rce
User CommandsTactical AlertsTargets, TracksStrobesRadar WxService Status External Time
Security Events
Control CommandsSystem/Component Status
External Communications Services
WARPInterface
SystemOperations
Weather DataProcessing
AlternateChannel(Note 1)
Channel Sync Data
Release DataRecording Data
Active Channel (Note 1)
DataStorage
User CommandsMetering Lists
User CommandsFlight ObjectsAirspace DefinitionsSector PlanService Status
Trial RequestsFlight Objects
Airspace DefinitionsSector Plan
MeteringMessages
Metering
Conflict Probe Tools User Commands
Strategic AlertsTrial Plan Results
Flight ObjectsAirport Configurations
Test and TrainingServices
Cert Cmds
ERAM Subsystem Note 1: FDP, SDP, DS, SOP, WDP, GIP, MET, CPDLC produce and receive channel synchronization dataNote 2: FDP, TTS, SDP, DS, CPT, WDP, GIP, MET produce and receive data from SOP
Channel Sync DataGI MessagesGI MessagesNOTAMs
User CommandsAT Specialist ViewsPrint Data
User CommandsGI MessagesNOTAMs
All(Note 2)
CertificationScenarios
User CommandsMRP Data
ARTCC En Route Automation System Operational Functional Architecture
Product of Lockheed Martin ATM

14
Software Estimation Challenge
Taking up the challenge – attacking the problem!
• Develop capability in Function Point (FP)Methodology to become proficient at “sizing” thesystem
• Develop historical database and metrics tocalibrate and validate the estimates
• Tailoring and application of COCOMO II andrelated estimating techniques to develop theestimate

15
Outline
• Overview
• Function Point Methodology
• Developing Historical Database
• Application of COCOMO II
• Concluding Remarks

16
Function Point Methodology
• Developed by Allan J. Albrecht of IBM in the late1970’s– Adopted by the International Standards Organization
(ISO) in 1999
– Researched, refined and managed as a Standard bythe International Function Point Users Group (IFPUG),current version 4.1

17
Function Point Methodology
• How does FPA Work?– Calculates the functional size of a system by assigning a
weight to each individual function – The sum of weights iscalled the Unadjusted Function Points (UFP)
– At the level of the complete system determines a ValueAdjustment Factor (VAF) from application characteristicssuch as processing complexity and transaction rate.
– The Adjusted Function Point metric (AFP) is the product ofthe UFP and VAF
– Can proceed with estimates of effort and schedule directlywith various FP tool algorithms or “back-fire” for estimationmodels using LOC metrics

18
Function Point Methodology
• Function point estimation is based on the data to bemanaged by an application and the processes thataccess and manipulate the data
Logical Inputs (EIs)
Logical Outputs (EOs)
Logical Queries (EQs)
External Logical Files (ELFs)
Internal LogicalFiles (ILFs)
Application Boundary

19
Function Point Methodology• FPA Function Types
– Internal Logical File (ILF) – Logically related data/control informationmaintained within application’s boundary (e.g., data tables, databasefiles).
– External Logical File (ELF) – Logically related data/control informationmaintained within the boundary of another application (e.g., shared datafiles, reference data, fixed messages)
– External Input (EI) – Process of data/control information from outsidethe application boundary (e.g., input screens, interactive inputs, batchinput streams, HW inputs)
– External Output (EO) – Sends data/control information outside theapplication boundary through processing logic other than/in addition todata retrieval (e.g., output screens, batch outputs, printed reports, HW &SW outputs)
– External Inquiry (EQ) -- Sends data/control information outside theapplication boundary strictly through data retrieval (e.g., menus, context-sensitive help, embedded inquiries)
20
Why Use Function Points?
• Function Points are a well-established method tomeasure the functionality of a system from auser’s perspective– Consistent with desire for user orientation
– Consistent with the level of abstraction in typicalsource requirements documentation
– Function points avoid design-specific perspectivesthat complicate sizing efforts in FAA’s heterogeneousenvironment

21
Why Use Function Points?
• Function Points are recognized to be the bestoverall sizing approach– Through 2005, function points will remain the most
appropriate measure of application size (0.8probability)*
*Gartner Research, Function Points Can Help Measure Application Size, Research Note SPA-18-0878, 19 November 2002

22
FPM Adoption Strategy
• Formed a 10-member Software Estimation andAnalysis Team (SEAT)– Five days dedicated training in FPM (David
Consulting Group)
– Selected and trained on a counting tool with potentialto meet SIS/System of Systems challenges(CHARISMATEK Function Point WORKBENCH)
– Defined and clarified project scope and definedsubsystem application boundaries to partition problem

23
The Hot-SEAT: Into the Fire
• Assign application count responsibilities
• Perform application counts with SystemSpecification Document, emerging SystemSegment Specification, other NDI/Reusedspecifications and documentation
• Review and adjust application counts
• Integrate application counts into a project count
• Iterate based on project evolution and performselected validation of estimate basis as SRSdocuments are developed

24
Example Component FP Report

25

26
Outline
• Overview
• Function Point Methodology
• Developing Historical Database
• Application of COCOMO II
• Concluding Remarks

27
Software Estimation Challenge
Problem: Federal Agencies are not very good at collectingdetailed software experience data to calibrate and validatenew software estimates
Contributors:• We are primarily organized around projects and do not consistently
collect, analyze and archive relevant data for corporate andorganizational benefit
• Data is often inaccessible, inconsistent, missing, rolled up or in otherhard to use form (e.g. labor cost not labor months, multiplelanguages map to one WBS, cannot distinguish new developmentfrom effort on reuse, modifications, COTs integration, etc.)
• Lack of repository to collect and organize detailed project data intouseful analytical information

28
Software Estimation Challenge
Why is this a problem?
• Studies with COCOMO II show significant improvementin both schedule and effort predictive accuracy whencalibrating the multiplicative constant and exponentialconstant with “local” data *
• Backfiring introduces several sources of potential error,but in the end we will need to see “apples” to compare tovendor “apples”
• We cannot improve until we set the bar!
*[B. Boehm, et. al., Software Cost Estimation with COCOMO II (PrenticeHall: Upper Saddle River, NJ; 2000), pp 175 – 181.]

29
Software Estimation ChallengeTaking up the challenge – attacking the problem!
• Developing a Software Historical Estimation Database(SHED)
• Started with two recent projects (DS and URET) to locate,analyze and tabulate actual versus estimated LOC, FP,effort, requirement count by mode, type, language, etc.
• Object: determine most useful (informational) datarelationships and develop database to make data asaccessible, consistent, complete and granular aspractical
• Iterate for new and perhaps other recent complete SISdevelopments

30
• You do not have the data you thought you had
• The data does not mean what you thought
• Some of the “data” is just plain erroneous
• No one ever thought you would need “that” data
When you attempt to do this at a granularlevel you will likely discover:
WARNING: Beyond This Point Be Dragons

31
Outline
• Overview
• Function Point Methodology
• Developing Historical Database
• Application of COCOMO II
• Concluding Remarks

32
Purpose of COCOMO II
To help people reason aboutthe cost and schedule implications of their
software decisions
©University of Southern California, Center for Software Engineering

33
COCOMOII
Software product size estimate
Software product, process,computer, and personnelattributes
Software reuse, maintenance,and increment parameters
Software organization’sproject data
Software development, maintenancecost and schedule estimates
Cost, schedule distribution by phase, activity, increment
COCOMO II recalibrated to organization’s data
COCOMO II Overview
©University of Southern California, Center for Software Engineering

34
Feasibility
Concept ofOperation
Rqts.Spec.
Plansand
Rqts.
ProductDesign
ProductDesignSpec.
DetailDesignSpec.
DetailDesign
Devel.and Test
AcceptedSoftware
Phases and Milestones
RelativeSize Range x
4x
2x
1.25x
1.5x
0.25x
0.5x ApplicationsComposition
(3 parameters)
Early Design(13 parameters)
Post-Architecture(23 parameters)
COCOMO II Model Stages
©University of Southern California, Center for Software Engineering

35
PMestimated
=A×(Size)(SF)× EMii
∏
Early Design and Post-Arch Models
• Effort:
• Size– KSLOC (Thousands of Source Lines of Code)
– UFP (Unadjusted Function Points) * KSLOC/UFP• KSLOC/UFP factor varies by language
– EKSLOC (Equivalent KSLOC) used for adaptation
• SF: Scale Factors (5)
• EM: Effort Multipliers (7 for ED, 17 for PA)
©University of Southern California, Center for Software Engineering

36
Tailoring and Application of COCOMO II
• COCOMO II is an industry calibrated parametric model• Equations convert the driver values (including) size to
effort and schedule based on data on multiple projects(161 in the current database)– 17 effort adjustment factor (multipliers) cover 4 kinds of
parameters:• Product, Platform, Project and Personnel
– 5 [economy/diseconomy of] "scale" factors
• Local calibration possible if enough data available:Common errors within an organization can be factoredout– by adjusting base multiplier using linear regression (LR)– by adjusting base exponent using LR in log space
37
Tailoring and Application of COCOMO II
• Incremental Builds requires adaptation of model,especially those that are Spiral Model based withmultiple development spirals– Often trade development cost for earlier capability availability (i.e.
schedule)
– Less overall "breakage" due to working kinks in high-prioritycapabilities out early; but higher breakage [potential] in/fordeferred capabilities
• System of Systems presents new challenges:accumulating cost; but with dependencies acrosssystems; ...need to gather new historical data

URETURET
2002| 2003 | 2004 | 2005 | 2006 | 2007 | 2008 | 2009 | 2010U2.1 U3.0 U3.1 U4.1U4.0 U5.0 U6.0 U7.0 U8.0
EBUSEBUS
EIC andEIC andR-PositionR-PositionRefreshRefresh
PTR Drops + New Function
Split off GARelease
D-PositionD-PositionRefreshRefresh
CheckpointIntegration
Ops Int / ESI
TC GA Site GAs
H.O. toI&T
Last Site GA
PTR Drops for CriticalProblems Only
Old URETBaselineAtrophies
Old DSRBaselineAtrophies
OngoingERAMBaseline
20 KSLOC 26K 20K 18+(D-pos)K 14K 4K 5K 5K
OngoingURETBaseline
Last SiteOperational
SitesOperational
Last SiteOperational
SitesOperational
DSRDSRBCC22 BCC23 BCC24 BCC25 BCC26 BCC27 BCC28
Early DevCheckpoints
SoftwareDrops
SeedBaseline
14 KSLOC 41+(D-pos)K 12K 11K 10K 10K
OngoingDSRBaseline
Last SiteOperational
SitesOperational
SeedBaseline
Continuous Sync
Continuous Sync
Sync CriticalFixes Only
Sync CriticalFixes Only
Sync
Sync
Sync
Continuous Sync
Continuous Sync
Seed New DSR (DisplayApps Only) from ERAMBaseline
Seed New URET (CP AppsOnly) from ERAM Baseline
S=Support Infra, I= Ops Infra, C=CP Apps, D=Display Apps, E=ERAM Apps
S, I, D
S, I, C, D, E
S, I, C, D, E
D
C
S, I, E
Note: Thisrelease isneveroperational
S, I, C, (D, E)
Sync
Sync
Product of Lockheed Martin ATM
ERAM Conceptual Plan
38

39
Relativecost
©University of Southern California, Center for Software Engineering
Amount Modified
1.0
0.75
0.5
0.25
0.25 0.5 0.75 1.0
0.55
0.70
1.0
0.046
Usual LinearAssumption
Data on 2954NASA modules*
* R. Selby, “Empirically Analyzing Software Reuse in a production Environment,” in SoftwareReuse:: Emerging Technology, IEEE Computer Society Press, 1988., pp 176-189
Nonlinear Reuse Effects

40
Reuse and Reengineering Effects
• Add Assessment & Assimilation increment (AA)– Similar to conversion planning increment
• Add software understanding increment (SU)– To cover nonlinear software understanding effects
– Coupled with software unfamiliarity level (UNFM)
– Apply only if reused software is modified
• Results in revised Equivalent Source Lines of Code(ESLOC)– AAF = 0.4(DM) + 0.3 (CM) + 0.3 (IM)– ESLOC = ASLOC[AA+AAF(1+0.02(SU)(UNFM))],– AAF < 0.5– ESLOC = ASLOC[AA+AAF(SU)(UNFM))], AAF > 0.5
©University of Southern California, Center for Software Engineering

41
Re-estimation Reasons
• Size Estimate changes: more detailed
• Functionality changes => size changes
• Environment changes => driver changes
• Milestones
• Close-loop control
©University of Southern California, Center for Software Engineering

42
Using COCOMO II to Cope With Change
©University of Southern California, Center for Software Engineering

43
Outline
• Overview
• Function Point Methodology
• Developing Historical Database
• Application of COCOMO II
• Concluding Remarks

44
Program Control of Estimate Risk
• Traditional estimate approach used in parallel
• New estimate approach using FP & COCOMO II
• Separate Investment Analysis Team developsestimate with SEER™ (Galorath's Suite ofAnalysis Tools)
• Vendors proposal estimate and supportingdocumentation

45
Initial Findings
• It takes a lot of dedicated time and effort by theSoftware Acquisition specialists to do this
• Preliminary results of FPM are encouraging; westill need to address counts attributable toNDI/Reuse
• We probably will have to keep working onhistorical data base and perhaps use it as part ofestimate revisions
• Be prepared: You may have to slay somedragons along the way

46
Questions?
???????????????????????????????????????????????????????????????????????????????????????????????????????????????????????????????????????????????????????????????????????????????????????????????????????????????????????????????????????????????????????????????????????????????????????????????????????????????????????????????????????????????????????????????