Refining New Zealand...Refining NZ is a Northland success story. Our refining and distribution...
65
Refining New Zealand Annual Report 2019
Transcript of Refining New Zealand...Refining NZ is a Northland success story. Our refining and distribution...

Refin
ing
New
Zea
land
An
nual
Rep
ort 2
019

RIGHT FOR NEW ZEALAND.
Our job is to be right for New Zealand, now and in the future.
Our refining infrastructure and related assets – jetties, storage tanks and the Refinery to Auckland Pipeline (RAP) – are critical to the supply of transport fuels throughout the country.
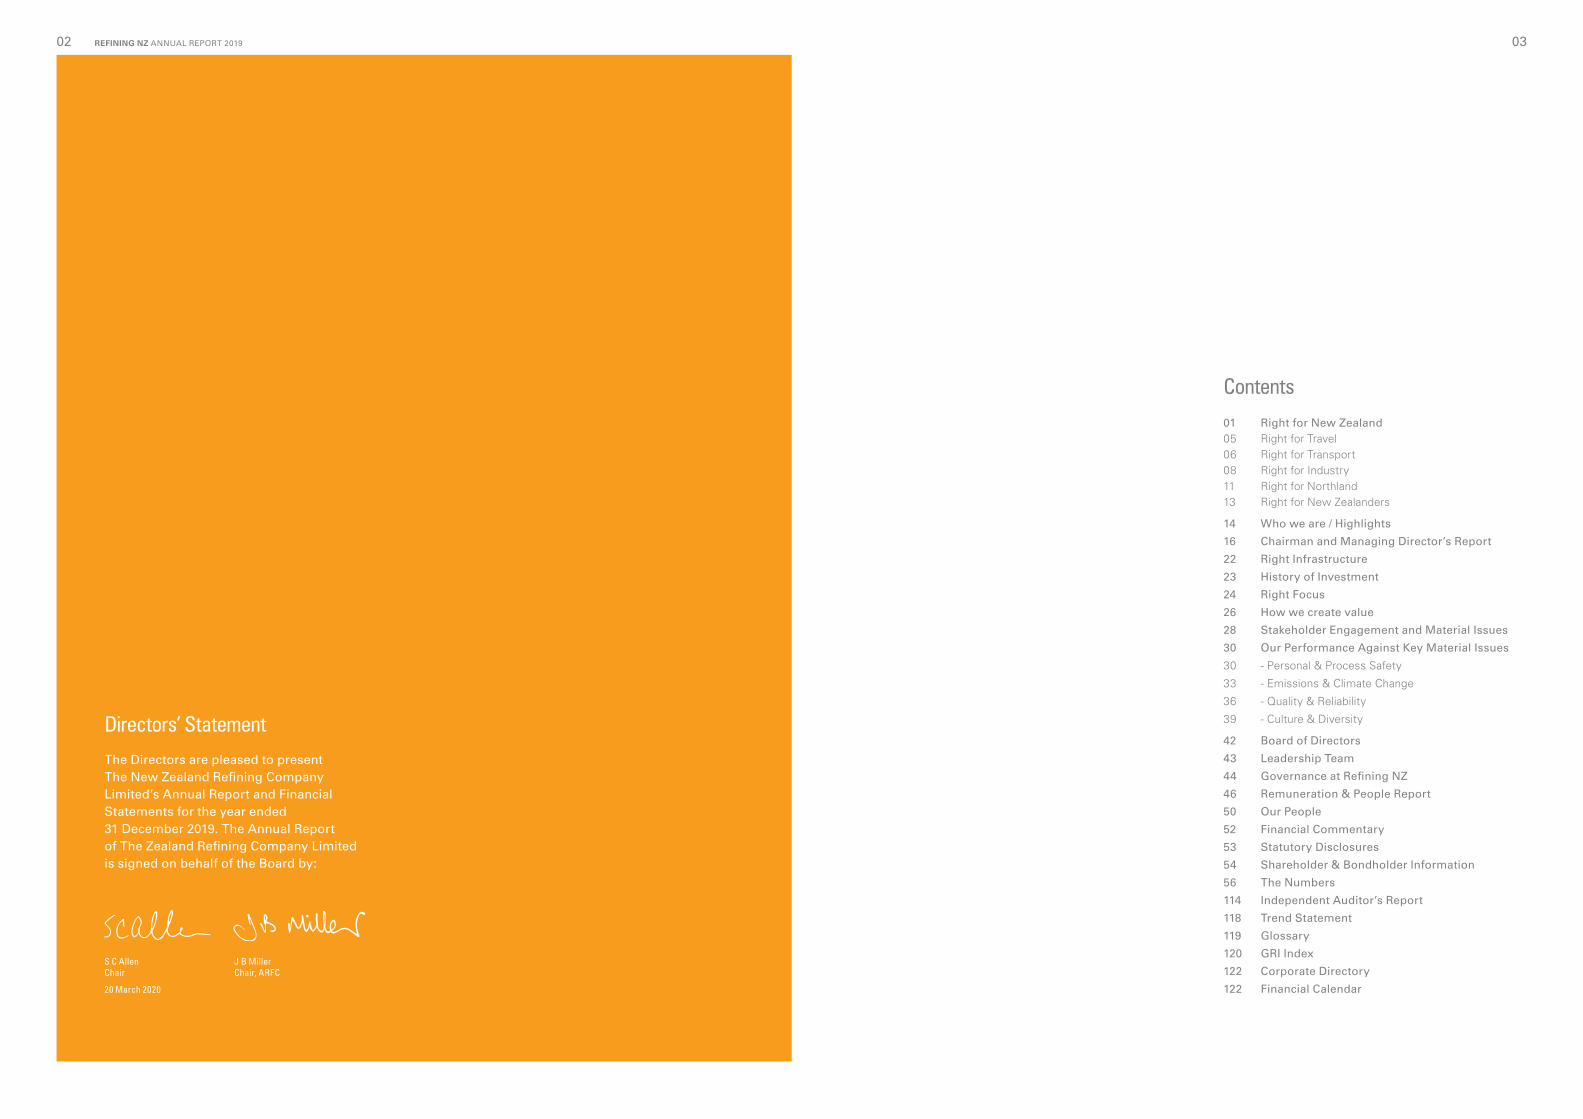
Seventy per cent of the transport fuels consumed in New Zealand are produced at the Refinery. Thirty eight per cent of the country’s fuel storage is at our Marsden Point site. The RAP is the most cost-effective and environmentally responsible means of distributing fuels to Auckland.
The technical capability and commitment of our people underpin our operations and provide value-add opportunities to the benefit of our many stakeholders.
We will continue to do what we do 24 hours a day, seven days a week – and we see an opportunity to evolve our infrastructure and refining assets to meet the need for lower carbon fuels of the future.
01
Directors’ Statement The Directors are pleased to present The New Zealand Refining Company Limited’s Annual Report and Financial Statements for the year ended 31 December 2019. The Annual Report of The Zealand Refining Company Limited is signed on behalf of the Board by:
S C AllenChair
20 March 2020
J B MillerChair, ARFC
Contents01 Right for New Zealand05 Right for Travel06 Right for Transport08 Right for Industry11 Right for Northland13 Right for New Zealanders
14 Who we are / Highlights
16 Chairman and Managing Director’s Report
22 Right Infrastructure
23 History of Investment
24 Right Focus
26 How we create value
28 Stakeholder Engagement and Material Issues
30 Our Performance Against Key Material Issues
30 - Personal & Process Safety
33 - Emissions & Climate Change
36 - Quality & Reliability
39 - Culture & Diversity
42 Board of Directors
43 Leadership Team
44 Governance at Refining NZ
46 Remuneration & People Report
50 Our People
52 Financial Commentary
53 Statutory Disclosures
54 Shareholder & Bondholder Information
56 The Numbers
114 Independent Auditor’s Report
118 Trend Statement
119 Glossary
120 GRI Index
122 Corporate Directory
122 Financial Calendar
REFINING NZ ANNUAL REPORT 201902 03

RIGHT FOR TRAVEL.
ENOUGH JET FUEL TO FILL
70,000A320S EACH YEAR
New Zealand is a nation of travellers. We visit each other, we visit places far away, and we are visited. Tourism is one of the driving forces in our economy.
Jet fuel from the Refinery powers the aviation sector that makes tourism possible. Four million litres of jet fuel per day flow through the RAP and onto Auckland International Airport. That’s enough to power 470 A320 journeys from Auckland to Sydney.
We have continued to invest in increasing the capacity of the RAP in time to meet growing demand. Since 2017 our upgrade projects have lifted capacity by more than 10 per cent and we have identified further opportunities to increase capacity in the future.
Over the longer term, it is expected that demand for jet fuel will continue to grow strongly as tourism and the economy grow. Auckland International Airport has forecast a near-doubling of passenger numbers to 40 million (260,000 flights) by 2040.
REFINING NZ ANNUAL REPORT 201904 05

RIGHT FOR TRANSPORT.
New Zealanders rely on safe, efficient and economic transport for the goods and services that sustain us.
Much of the country’s demand for transport fuels is met by products made at our Refinery with longhaul trucking particularly dependent on our high quality diesel. Diesel is used at a rate equivalent to one truck filling every seven seconds.
The current mix of transport fuels will meet the majority of New Zealand’s transport needs in the foreseeable future. As transport and fuel technologies evolve it will likely be complemented by lower-carbon alternatives including electric power, hydrogen and biofuels.
With our deep capability and existing infrastructure we can play a crucial role as New Zealand transitions to a lower-carbon economy.
ENOUGH DIESEL TO FILL MORE THAN
4.5MTRUCKS EACH YEAR
REFINING NZ ANNUAL REPORT 201906 07

RIGHT FOR INDUSTRY.
Businesses of every kind depend on fuel from our Refinery to enable them to serve their customers. They can do their jobs only if we do ours – providing a continuous, reliable and safe supply of high-quality fuel products for distribution throughout the country.
Sustaining our performance at this level means operating to exacting standards every minute of every day. We keep an eye to the future and are always looking to improve, by tapping into the knowledge of our teams and working in collaboration with our customers.
In infrastructure, our bitumen supports the maintenance of 60,000 km of roads each year – in and around major centres, on country roads across New Zealand, and on roads of national significance.
In agriculture, sulphur extracted from crude oil during the refining process is a vital feedstock in the production of crop fertilisers that maximise pasture growth.
In a world of growth and change, our reliability and safety, based on a deeply embedded culture of operational excellence, will become more important than ever.
OUR BITUMEN SUPPORTS THE
MAINTENANCE OF
60,000KMSOF NZ ROADS EACH YEAR
REFINING NZ ANNUAL REPORT 201908 09

RIGHT FOR NORTHLAND.
Refining NZ is a Northland success story.
Our refining and distribution business is a significant employer, with around 1,100 Northland jobs and 2,400 specialist jobs across the country relying on work from Marsden Point. In total, we have $1.4 billion invested in our physical and other assets and contribute 6.5 per cent to Northland’s GDP.
It’s not just about the numbers. Our people understand that the Refinery’s future depends on world-class performance. They apply a broad range of technical, professional and life skills every day. Their achievements, and the standards they keep, create value both at work and in the community.
Most of our people are Northlanders. We are part of the community – at work, at home and through the Company’s responsible engagement with Iwi and hapu, local authorities, businesses, schools, sporting groups and other interest groups. Playing our part in Northland’s future is a powerful motivating force.
6.5%OF NORTHLAND’S
GDP^
^ www.infometrics.co.nz
REFINING NZ ANNUAL REPORT 201910 11

RIGHT FOR NEW ZEALANDERS.
61,000TRUCK MOVEMENTS REDUCED WITH THE USE OF THE PIPELINE
TO AUCKLAND
The need for New Zealand to refine its own transport fuels, ensuring access to a reliable and high-quality supply of affordable fuels, was realised in the 1950s. More than 60 years later, and with a wealth of experience and technical know-how under our belts, the need is as strong as ever.
We work closely with our customers to ensure the petrol, diesel and jet fuel we make helps keep you moving – as you go to work, head out for the weekend or jet away.
We’ve also made substantial investments in our refining and distribution assets to make our fuels cleaner, lighten our environmental footprint and meet demand as the population of Auckland and the rest of the country continues to grow.
As proud Kiwis we are conscious of the need to transition to lower-carbon fuels that are better for our environment. With our capability in refining and our track record of reducing emissions, we are well placed to contribute to the supply of sustainable fuels for a low-carbon economy. That transition is coming. Managing it is the right thing to do for all New Zealanders.
REFINING NZ ANNUAL REPORT 201912 13
WHO WE ARE
REFINED TO MULTIPLE PRODUCTSAT MARSDEN POINT
CRUDE OIL IMPORTED TO REFINING NZ
42M BARRELS
ANNUAL OUTPUT6.5B LITRES
70%OF NEW ZEALAND’S
FUEL NEEDS
SUPPLYING
PERSONAL TRANSPORT
CO2
AGRICULTURE FERTILISER
ROADS
FREIGHT
AIR TRAVELHEAVY INDUSTRY
~Our infrastructure assets based around our Refinery at Marsden Point, form the backbone of the New Zealand transport fuels supply chain. The quality fuels we produce keep New Zealand and New Zealanders moving.
DISTRIBUTED THROUGH OUR 170KM PIPELINE TO AUCKLAND INTO STORAGE TANKS AT WIRI
OF NZ FUEL STORAGE LOCATED AT
MARSDEN POINT
DISTRIBUTED BY LAND AND SEA
HIGHLIGHTS
Diesel produced
Jet fuel produced
2.3BLitres
1.7BLitres
1.9BLitres
Gross Refining Margin (GRM)
(2018: 6.31USD)
(2018: 1.4B)
(2018: 2.0B)
(2018: 1.8B)
5.34USD per Barrel
EBITDA^
(2018: $153m)
$118mNPAT
(2018: $29.6m)
$4.2mFree Cash Flows^
(2018: ($58m))$39.4m
Petrol produced
(2018: 21.0m)
(2018: 40.4m)
Refinery throughput
RAP throughput
42.7m
20.8m
Barrels
Barrels
* per 200,000 hours, rolling 12 month ^ For a full definition, refer to glossary on page 119
0.27TRCFR*^
(2018: 0.76)
0.13LTIFR^
(2018: 0.48)
48% 52%
38%
REFINING NZ ANNUAL REPORT 201914 15
RIGHT NOW We’re refining our business
to meet the future need for transport fuels.
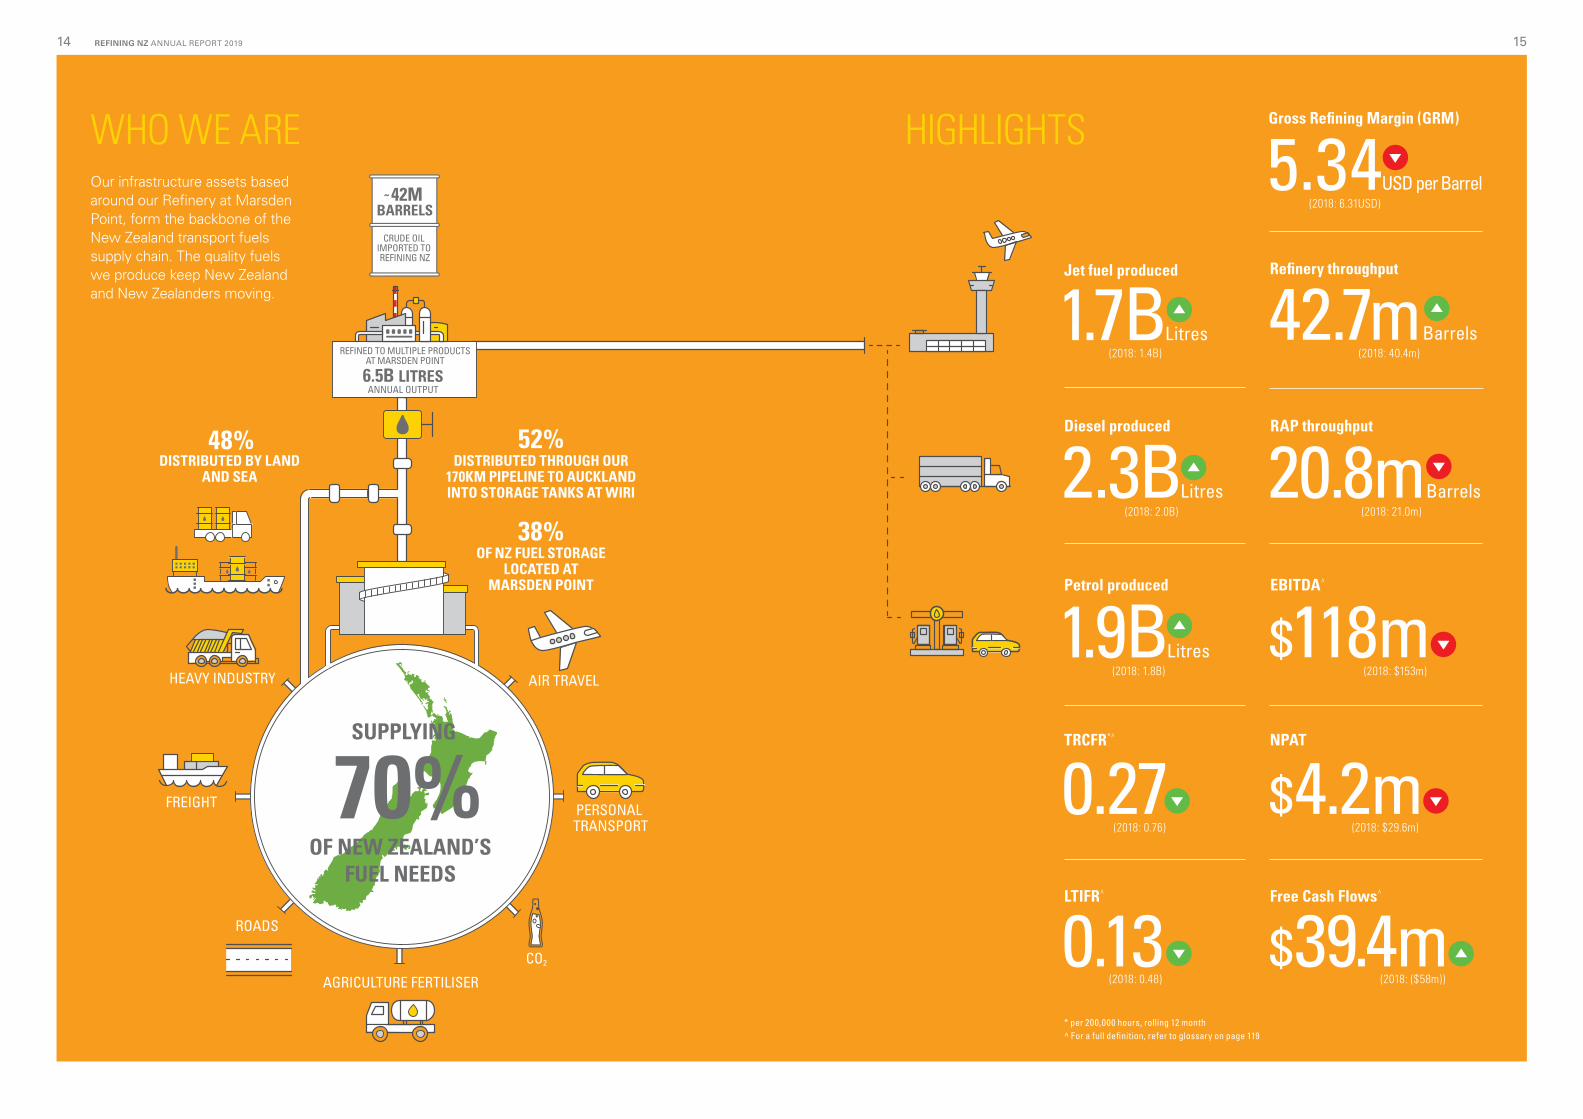
The year in review was one in which the Company’s excellent operational performance was not matched by its financial results, with a Net Profit after Tax (NPAT) of $4.2 million, (2018: $29.6 million) reflecting the extreme volatility in the global refining sector and cost pressures on the Company.
While disappointing in the short term, we expect that strong gains in our operational performance, track record of investment in key infrastructure assets and actions to reduce costs and improve revenue, should allow us to take advantage of market conditions when they improve.
Market factors combined to drive refining margins down in the final months of the year. The impact of low margins on the Company was exacerbated by the $3.8 million impact of the Transpower outage in November, electricity and gas price increases and one-off expenditure, including the costs related to the Government pipeline Inquiry.
In 2019 our operational performance was excellent, with very high availability of our processing units and new records being set on crude intake and production. To a significant extent, this excellent performance reflected a full year’s benefit from the maintenance Turnaround^ completed in 2018.
Right for New Zealand
With our critical role in the transport fuels supply chain, the Refinery and distribution infrastructure into the heart of Auckland is vital to the well-being of people and communities throughout New Zealand. The ability of our refining and distribution business to meet around 70 per cent of New Zealand’s overall demand for transport fuels (63% petrol; 62% diesel; 88% jet fuel) supports the continued productivity of the travel, transport, industrial and other sectors of the national economy.
Our deep capability in refining, built up over nearly 60 years and investment in processing facilities to produce high quality (low sulphur) fuels, positions us to play a significant
role in shaping the future of New Zealand’s transport fuels, and enabling the country to meet its climate change obligations into the future.
We have advanced several projects to deliver operational efficiencies and enhance margins, with the long-term aim being to lift our competitiveness and returns to shareholders. The Company is also continuing with preparations for a $37 million solar farm adjacent to the Refinery, noting that the project has to be submitted to the Refining NZ Board for final approval.
Health, safety and wellbeing
Our personal and process safety performance in 2019 was outstanding. Health, safety and wellbeing are core values for the Company. Continuing to improve our performance ensures that our people and our Refinery remain safe at all times, while the impact of our operations on our environment and our community is minimised.
In 2019 the lost time injury frequency rate (LTIFR) was 0.13 (2018: 0.48) per 200,000 hours worked, a marked improvement on the prior year with only one lost time injury. This performance reflects the success of our safety culture programme E Tu Tangata (Stand in the Gap) rolled out across the Refinery via a series of Hauora Korero (safety talks) and Hauora Hikoi (safety walks).
We operate New Zealand’s highest hazard facility and are constantly working to improve our health and safety performance in line with our Safety Case which was approved in 2020 by the regulator, WorkSafe. In 2019 our process safety performance was outstanding, with no Tier 1 or Tier 2 incidents (2018: two Tier 1; three Tier 2). That performance is top quartile when benchmarked against our European oil industry peers*.
CHAIRMAN AND MANAGING DIRECTOR’S REPORT
* CONCAWE (European Oil Company Organisation for Environment, Health and Safety) ^ Refer to glossary on page 119
REFINING NZ ANNUAL REPORT 201916 17REFINING NZ ANNUAL REPORT 201916 17
Refining margins weaker than expected
Our Refinery operates in a cyclic industry and volatility is to be expected. In 2019 factors outside the Company’s control – global supply and demand – had a direct impact on the Company’s returns to shareholders.
Our Gross Refining Margin averaged USD 5.34 per barrel, compared with USD 6.31 in 2018. This was weaker than expected as global refining margins felt the impact of higher exports of products from China, demand growth being lower than expected, and new refining capacity coming online early in China and other parts of Asia.
While the Singapore Complex Margin dropped significantly as a result of the above, our uplift over the Singapore Complex Margin significantly increased to USD 4.32 per barrel underpinned by excellent operational availability and performance.
Higher crude freight rate costs resulted from US sanctions on Chinese crude tanker companies. The expected lift in diesel margins in the lead up to MARPOL (regulations for lower sulphur content in shipping fuels) did not arrive as had been forecast, by market commentators, while High Sulphur Fuel Oil margins fell strongly.
Given the headwinds in the market, including the uncertain impact of the COVID-19 outbreak on demand and supply, the low margin environment we have experienced will likely remain for the first half of 2020.
Responding to low refining margins
Our management team has worked with the Board on a comprehensive plan to respond to the lower margin environment and secure long-term value for shareholders.
The primary focus of the Company’s plan has been to immediately reduce our cash spend, cutting our 2020 capital programme by 20 per cent, rationalising operating costs as well as increasing revenue. At the same time, we are looking at different options available to enable the Company to stay at the core of the fuel supply chain in New Zealand. Executing the plan should enable the Company to continue to add resilience to the fuel supply chain by optimising our essential infrastructure assets.
Excellent operational performance
The operational availability of our processing units was at 99.7 per cent, with the utilisation rate on the Hydrocracker unit at its highest level for the past decade. This positive performance was achieved despite the Transpower outage in the region in November which saw a total loss of power to the Refinery.
Operational availability on the RAP was greater than 99 per cent, with annual throughput at 20.8 million barrels, the second highest level on record. In 2019 the Refinery achieved a throughput of 42.7 million barrels (2018: 40.4 million).
Operating and capital costs remained tightly controlled as refinery operations came under sustained pressure from significantly higher electricity and gas prices. Ongoing supply issues with the Pohokura offshore natural gas field meant that access to natural gas supplies had to be carefully managed during the year. We have subsequently contracted our natural gas requirements for a number of years ahead with a credible market participant with diverse supply options.
Customer promise: quality, reliability, competitiveness
New Zealand’s economic growth drives increasing demand for all fuels, particularly for diesel, while tourism demands an increasing supply of jet fuel. Maintaining an attractive value proposition for our customers requires a constant focus on improving the quality, reliability and competitiveness of our refining operations.
Our short duration, planned maintenance on the Hydrocracker unit is expected to be completed in early April. Preparations for a second longer duration Turnaround is advancing with those preparations benchmarked as ‘top quartile’ by an external Turnaround specialist.
The forward profile of our tank maintenance programme 2020 to 2023 has been revised without compromising personal or process safety on site.
In June, the Company commenced the 12-month turbidity monitoring programme, a key condition of the dredging resource consent, and we continue to explore options to optimise the capital cost and benefits of the dredging programme with our customers.
Environmental sustainability
Our focus on improving our operations extends to a commitment to world class environmental performance.
We are continuing to improve our emissions profile through energy-saving projects, including those carried out through our partnership with the Energy Efficiency and Conservation Authority (EECA).
The process of renewing the Refinery’s resource consents which expire 31 December 2022, is progressing with all expert reports on the Refinery’s discharges to land, air and water now complete. We expect to lodge a resource consent application in the second quarter of this year.
Work continues on our waste water management systems to ensure they remain robust in extreme weather events.
MARPOL
We are broadening our crude diet to minimise the impact of the MARPOL regulations which came into force on 1 January 2020. Four new, lower cost crudes have been tested successfully and forward crude procurement decisions by our customers are already being made as a result.
Government Inquiry findings
The final report of the Government Inquiry into the 2017 pipeline outage and the resilience of fuel supply into the Auckland region was released in September 2019.
The Inquiry concluded that the Company had maintained and operated the RAP properly and in keeping with all legal requirements and standard industry practice. We were also encouraged by the Inquiry noting that Refining NZ is working to make timely investment decisions, and that it has a clear goal of having new infrastructure in place shortly before it is needed to meet demand (i.e. rather than just in time or too late).
The Company is continuing to push for further legislative protections for the pipeline, and we are working with the Government and industry on ways to further improve the resilience of Auckland’s fuel supply chain.
Emissions trading scheme
In 2019 the Government confirmed that Refining NZ will be brought in to the New Zealand Emissions Trading Scheme (NZETS) with an allocation of carbon units after the Negotiated Greenhouse Agreement (NGA) expires at the end of 2022.
Entry into the NZETS on the basis of our 2006-2009 emissions is an imperative for the Company as we transition to a future based on lower carbon fuels. We believe that our strong track record of emissions reduction, which has seen the Company invest around $750 million in technology to make cleaner fuels, and lower our emissions, provides a solid platform for our entry in the NZETS.
Ongoing investment in our infrastructure assets requires farsighted and predictable policy given that our investment planning is based on 25-30 year asset life.
We are mindful of the potential disruption from further reforms to the NZETS currently before Parliament, especially a review of carbon unit allocation to EITE (Emissions Intensive Trade Exposed) businesses and are continuing to monitor this issue closely.
Dividend
Given the challenging, low margin environment the Company is operating in the Directors have resolved that it is prudent to not pay a final dividend. With an interim dividend of two cents paid in September, the total dividend payment for the year is two cents per share.
Governance
Board and Management changes
Mark Tume resigned after 11 years as a Director in February 2019. Mark made a significant contribution to the Board, including as Chairman of the Audit, Risk and Finance Committee for two years.
Chief Executive Officer Mike Fuge resigned in September and left the Company on 21 February 2020. Following an international search, the Board appointed Naomi James as his successor. Naomi joins the Company from Santos Limited, one of Australia’s largest independent oil and gas producers, where she was responsible for midstream infrastructure assets including oil and gas processing facilities. Naomi will join the Company in April 2020.
Director Paul Zealand has stepped into the role of Managing Director during the CEO transition. Paul will not be considered an Independent Director during his tenure of Managing Director. The Board is grateful to Paul for his significant contribution during this period.
REFINING NZ ANNUAL REPORT 201918 19REFINING NZ ANNUAL REPORT 201918
Andrew Brewer was appointed to the new role of Chief Operating Officer, effective 16 March 2020. He brings a wealth of experience from the refining sector, having spent the previous 18 years with Caltex in Australia and Chevron in Canada, in both refinery and supply leadership roles.
Audit changes
In December, the Refining NZ Board aligned its audit policy and its external audit services with recent market guidance from the Financial Markets Authority.
The Refining NZ Board reissued the Company’s Auditor Independence policy statement (a copy is available on the Company’s website) and carried out a market assessment of external audit services, which it is required to do every ten years under that policy.
After a thorough assessment process – which included consideration of the level of non-assurance services provided and the length of tenure of the then current auditor – the Board appointed Ernst & Young (EY) to provide external audit services to the Company. EY will stand for reappointment by shareholders at the Company’s 2020 Annual Shareholder Meeting.
Outlook
The second half of 2019 proved extremely challenging for the refining segment of the Company and is continuing to prove so; the headwinds in the market have carried over to the first quarter of the year and are compounded by the ongoing negative impact of COVID-19 on demand and supply in the Asia Pacific region.
The full impact of COVID-19 is yet to play out, but it is likely to produce further volatility as demand returns and refining capacity comes back on line, especially in China. New Zealand is being impacted significantly and our customers are responding daily to the changing product demand profile. The demand for transport fuels is evolving rapidly and we are working closely with our customers on how we may assist with their Supply Chain Management. Market commentator FGE is forecasting a rebound in global oil demand in the first half of 2021.
Given the current trading environment and the significant uncertainties ahead we are looking at all tactical and strategic responses to the financial challenges we face and are keeping the Government informed as the situation unfolds.
Our team at Marsden Point remains focused on the safe and reliable performance of our refining operations and the multi-fuel pipeline to Auckland, backed by a rationalised programme of operational and capital spending. This should ensure that we can continue to provide a reliable supply of high-quality products to our customers and, looking ahead, that we are well placed to benefit from our excellent operational performance when global refining margins improve.
REFINING NZ ANNUAL REPORT 201920 21REFINING NZ ANNUAL REPORT 201920 21
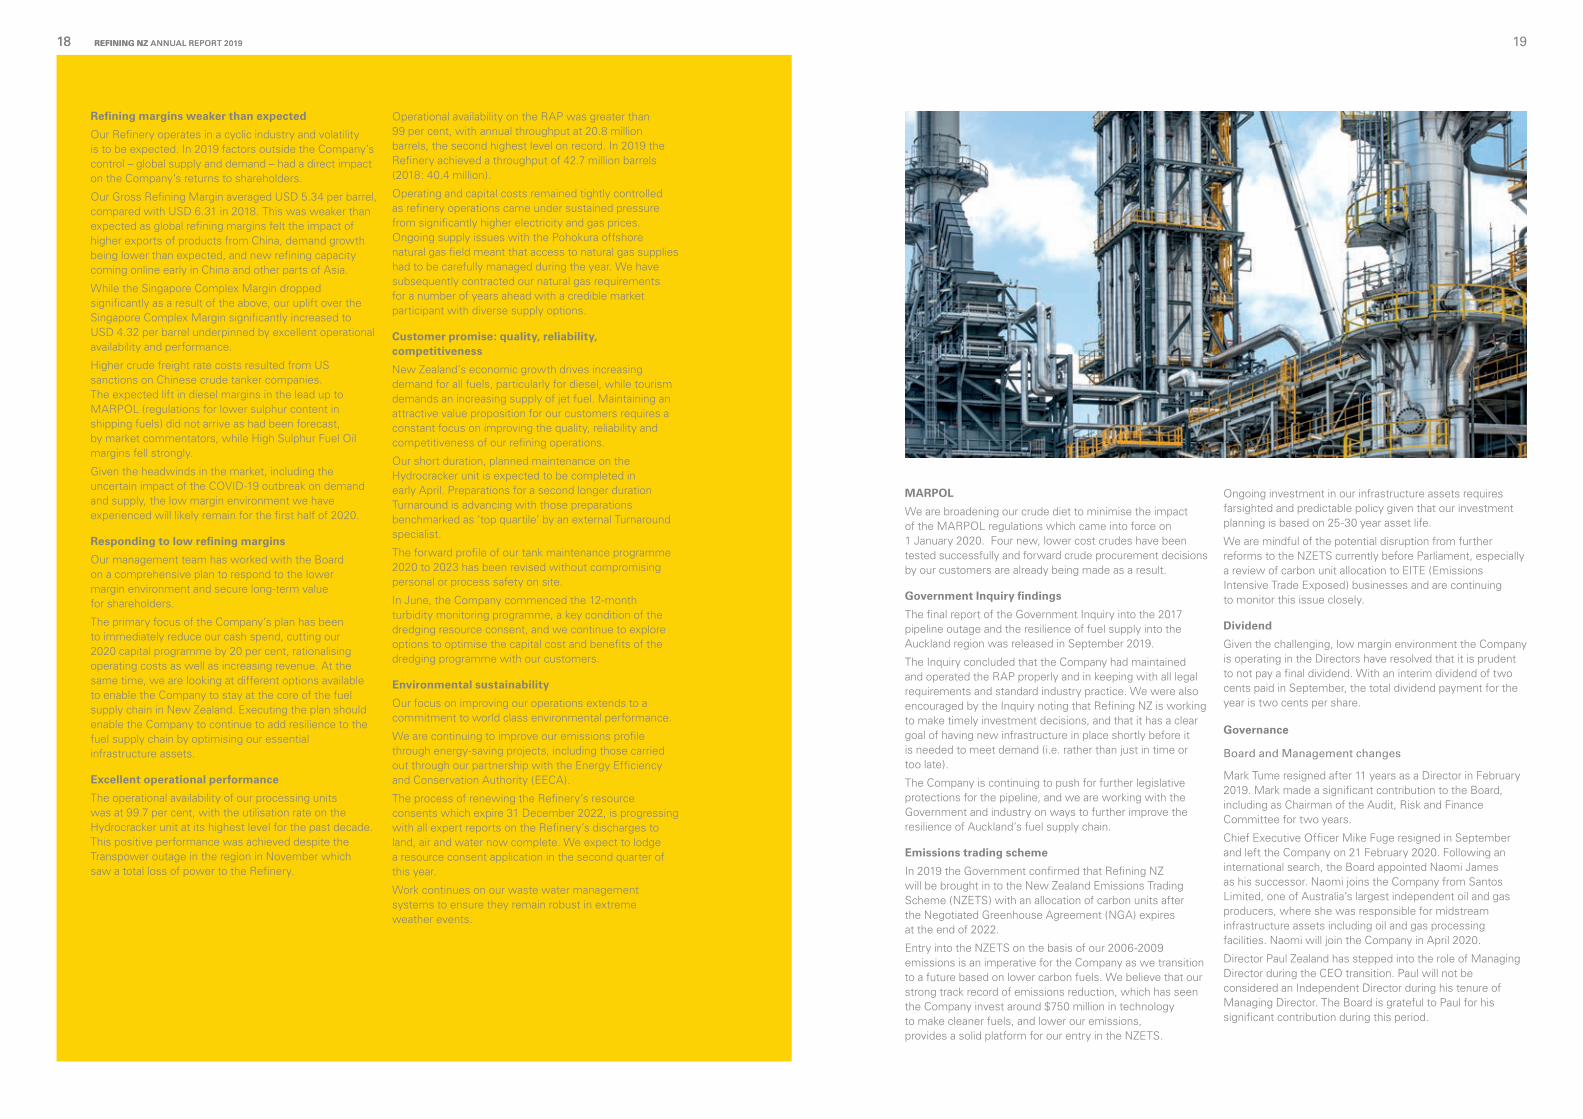
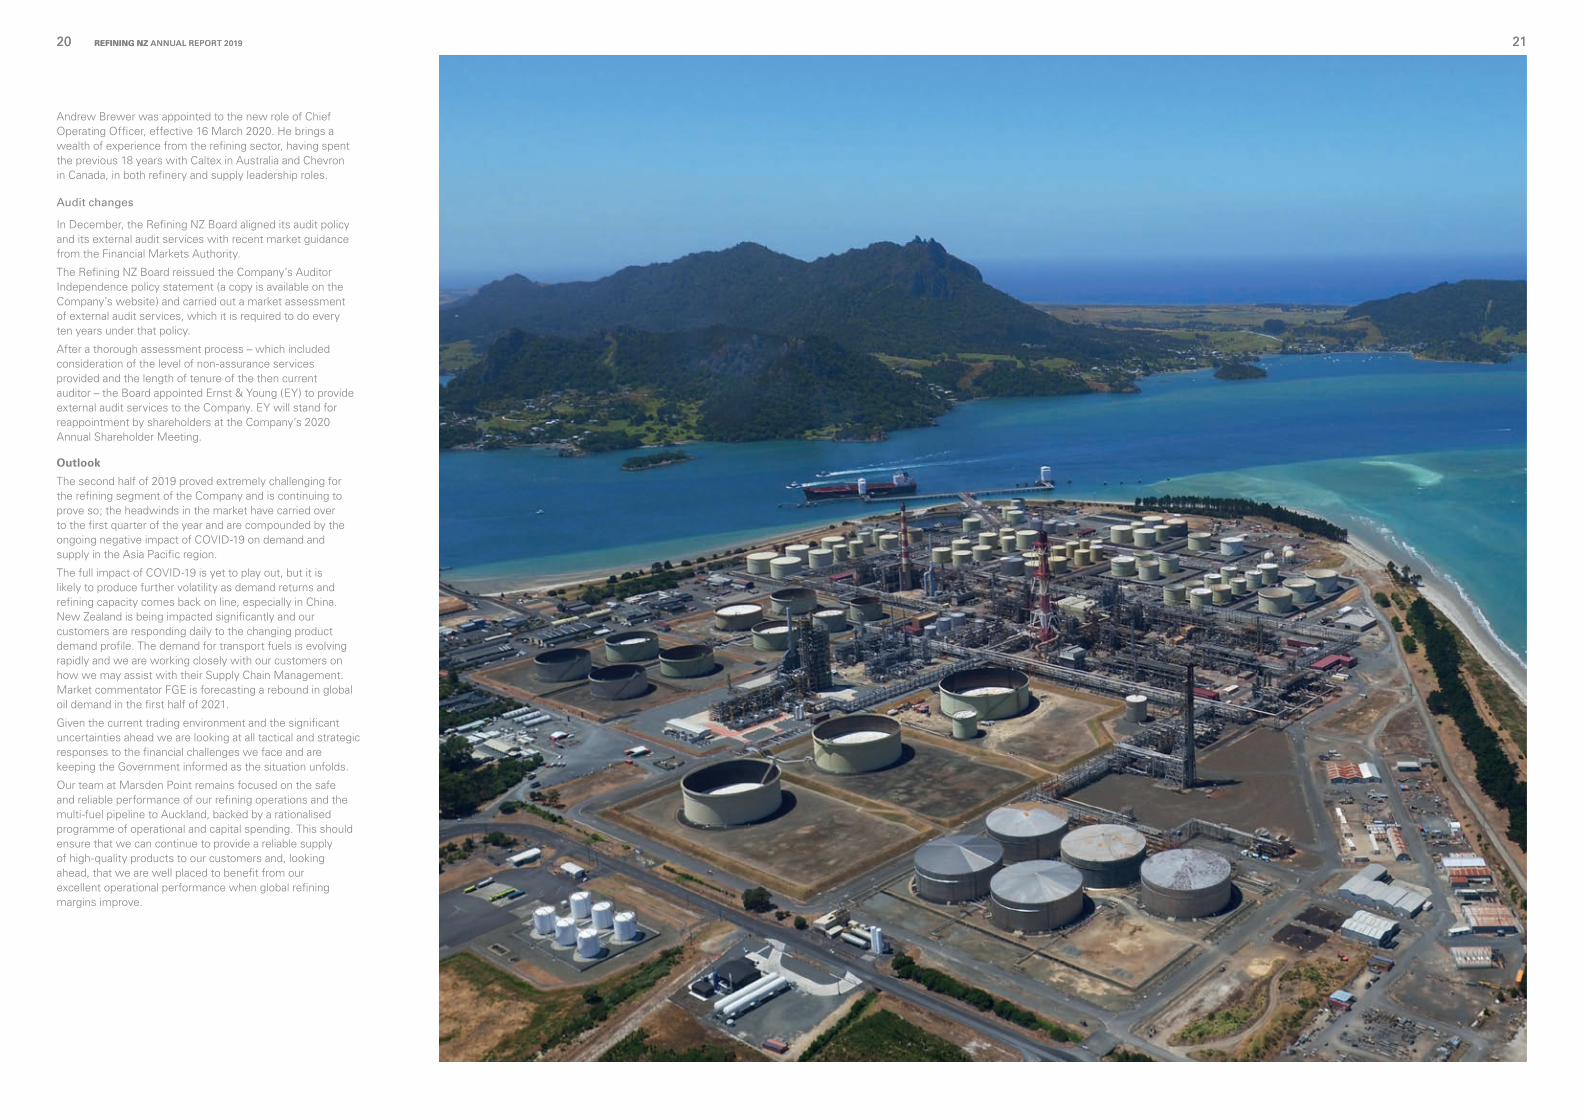
The Marsden Point Refinery and associated infrastructure were originally built in the 1960s as the Government recognised the need for New Zealand to have the capability to refine crude oil to produce transport fuels within the country, reducing its reliance on imported fuel. We have continued to build on that key infrastructure over the past 60 years to keep New Zealanders on the move.
The high-value infrastructure assets now under our management – our jetties, storage tanks and the Refinery to Auckland Pipeline – are critical to the ongoing security of New Zealand’s fuel supplies and to New Zealanders’ well-being and prosperity.
The Marsden Point site has three jetties over which 40-42 million barrels of crude oil are delivered and 6.5 billion litres of product are shipped each year, and 126 tanks in which crude or refined product is stored. It is the starting point for the 170 kilometre RAP, which moves petrol, diesel and jet fuel to the Wiri oil terminal in South Auckland. About half of our production is distributed via the RAP to Auckland and half is sent across our jetties into coastal tankers or to road tankers for delivery around New Zealand.
We invest to ensure that these critical assets remain at the core of the transport fuel supply chain in New Zealand and can continue to play their vital role in maintaining the nation’s security of supply. We also invest to ensure that the Refinery’s processing capability remains world-class in performance and reliability, with the capability to safely meet demand for the existing fuel portfolio and the nation’s transport needs in the future.
Our original two jetties were constructed in 1964 and we are in the middle of a significant refurbishment plan to ensure they continue to service the Refinery and our distribution business.
We are four years into a multi-year tank refurbishment programme, conducted under regulatory and technical oversight. This major programme of work has been optimised, resulting in a smoother and more efficient capital spend. Key enablers for this include the use of acoustic emissions testing to assess tank conditions, robotic blasting and painting and automated tank cleaning, which improves not only capital efficiency but also quality and safety.
Since 2017 capacity upgrade projects have lifted throughput capacity on the RAP by more than ten per cent to ensure we can continue to meet the need for transport fuels as Auckland continues to grow.
Meanwhile the Company continues to invest in assets and processes that deliver efficiencies, provide options for an expanded range of products and improve the safety of those who work on the site.
RIGHT INFRASTRUCTURE
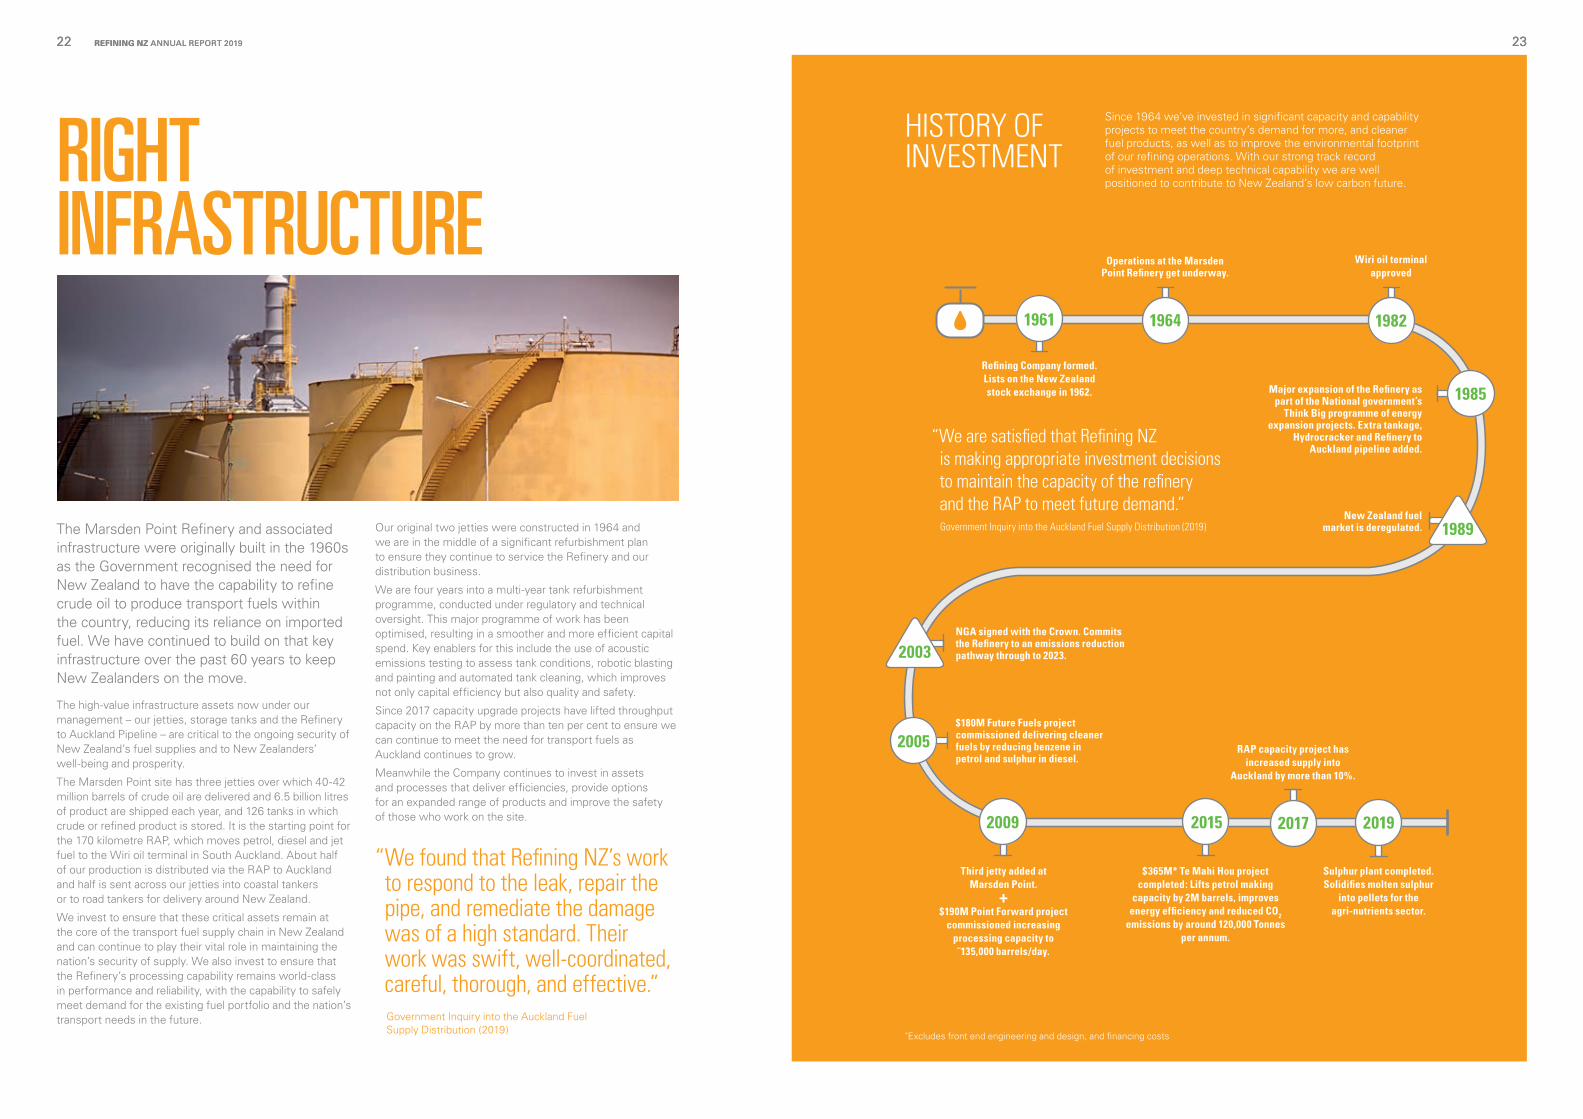
Refining Company formed. Lists on the New Zealand stock exchange in 1962. Major expansion of the Refinery as
part of the National government’s Think Big programme of energy
expansion projects. Extra tankage, Hydrocracker and Refinery to
Auckland pipeline added.
NGA signed with the Crown. Commits the Refinery to an emissions reduction pathway through to 2023.
Third jetty added at Marsden Point.
$190M Point Forward project commissioned increasing
processing capacity to ˜135,000 barrels/day.
RAP capacity project has increased supply into
Auckland by more than 10%.
HISTORY OF INVESTMENT
Operations at the Marsden Point Refinery get underway.
New Zealand fuel market is deregulated.
Wiri oil terminal approved
$180M Future Fuels project commissioned delivering cleaner fuels by reducing benzene in petrol and sulphur in diesel.
$365M* Te Mahi Hou project completed: Lifts petrol making
capacity by 2M barrels, improves energy efficiency and reduced CO2
emissions by around 120,000 Tonnes per annum.
“We are satisfied that Refining NZ is making appropriate investment decisions to maintain the capacity of the refinery and the RAP to meet future demand.”
Government Inquiry into the Auckland Fuel Supply Distribution (2019)
Government Inquiry into the Auckland Fuel Supply Distribution (2019)
1961 1964
Sulphur plant completed. Solidifies molten sulphur
into pellets for the agri-nutrients sector.
“ We found that Refining NZ’s work to respond to the leak, repair the pipe, and remediate the damage was of a high standard. Their work was swift, well-coordinated, careful, thorough, and effective.”
1982
1985
1989
+
2015 2017 2019
Since 1964 we’ve invested in significant capacity and capability projects to meet the country’s demand for more, and cleaner fuel products, as well as to improve the environmental footprint of our refining operations. With our strong track record of investment and deep technical capability we are well positioned to contribute to New Zealand’s low carbon future.
2003
2005
2009
*Excludes front end engineering and design, and financing costs
REFINING NZ ANNUAL REPORT 201922 23REFINING NZ ANNUAL REPORT 201922 23
260
250
240
230
220
210
200
1902006 2007 2008 2009 2010 2011 2012 2013 2014 2015 2016 2017 2018 2019
est
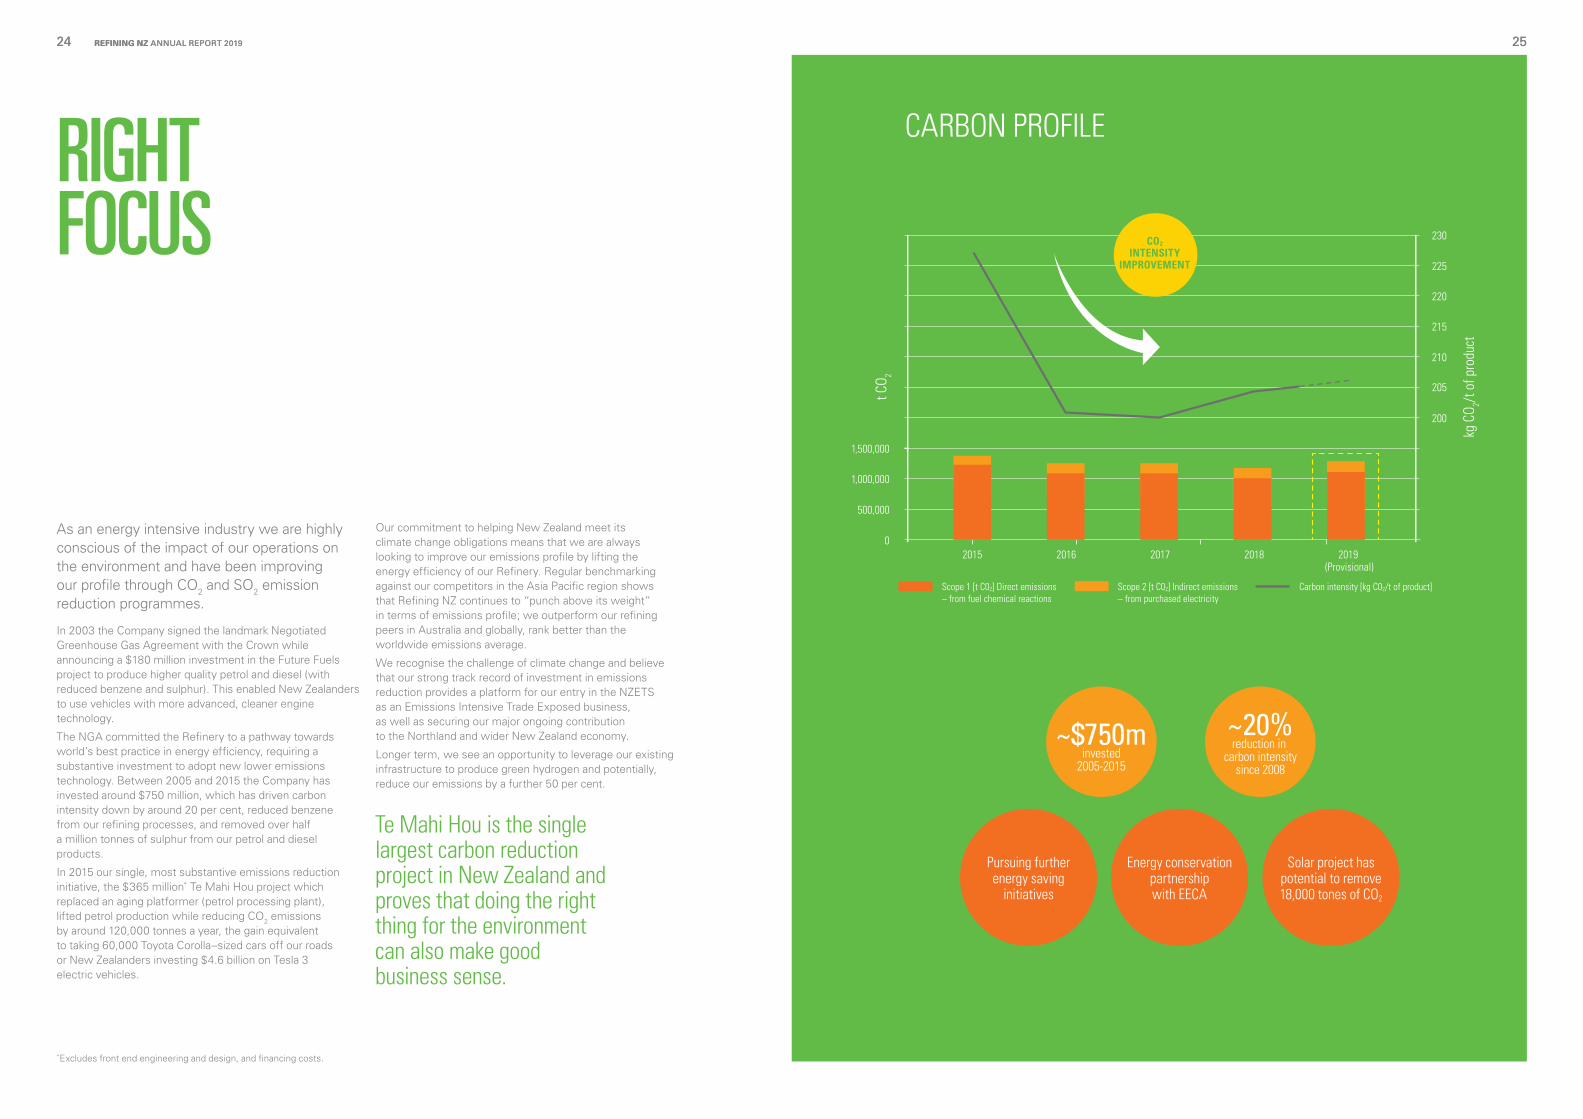
~$750m ~20%reduction in
carbon intensitysince 2008
>35,000
C02 I
nten
sity
[tC0
2/t p
rodu
ctio
n]
C02intensity
improvement
Te Mahi Hou ($425m)~10% CO2 intensity reduction and120,000 tCO2 emission reduction
HCU and HMU upgrades ($2.2m)~3% CO2 intensity reduction Point Forward ($190m)
~8% CO2 intensity reduction
Avg 2016 – 2019 Total C02/tonne production
invested2005-2015
tonnes p.a. sulphur removed from fuels
since 2005
260
250
240
230
220
210
200
1902006 2007 2008 2009 2010 2011 2012 2013 2014 2015 2016 2017 2018 2019
est
~$750m ~20%reduction in
carbon intensitysince 2008
>35,000
C02 I
nten
sity
[tC0
2/t p
rodu
ctio
n]
C02intensity
improvement
Te Mahi Hou ($425m)~10% CO2 intensity reduction and120,000 tCO2 emission reduction
HCU and HMU upgrades ($2.2m)~3% CO2 intensity reduction Point Forward ($190m)
~8% CO2 intensity reduction
Avg 2016 – 2019 Total C02/tonne production
invested2005-2015
tonnes p.a. sulphur removed from fuels
since 2005
Pursuing further energy saving
initiatives
Energy conservation partnership with EECA
Solar project has potential to remove 18,000 tones of CO2
As an energy intensive industry we are highly conscious of the impact of our operations on the environment and have been improving our profile through CO2 and SO2 emission reduction programmes.
In 2003 the Company signed the landmark Negotiated Greenhouse Gas Agreement with the Crown while announcing a $180 million investment in the Future Fuels project to produce higher quality petrol and diesel (with reduced benzene and sulphur). This enabled New Zealanders to use vehicles with more advanced, cleaner engine technology.
The NGA committed the Refinery to a pathway towards world’s best practice in energy efficiency, requiring a substantive investment to adopt new lower emissions technology. Between 2005 and 2015 the Company has invested around $750 million, which has driven carbon intensity down by around 20 per cent, reduced benzene from our refining processes, and removed over half a million tonnes of sulphur from our petrol and diesel products.
In 2015 our single, most substantive emissions reduction initiative, the $365 million* Te Mahi Hou project which replaced an aging platformer (petrol processing plant), lifted petrol production while reducing CO2 emissions by around 120,000 tonnes a year, the gain equivalent to taking 60,000 Toyota Corolla–sized cars off our roads or New Zealanders investing $4.6 billion on Tesla 3 electric vehicles.
Our commitment to helping New Zealand meet its climate change obligations means that we are always looking to improve our emissions profile by lifting the energy efficiency of our Refinery. Regular benchmarking against our competitors in the Asia Pacific region shows that Refining NZ continues to “punch above its weight” in terms of emissions profile; we outperform our refining peers in Australia and globally, rank better than the worldwide emissions average.
We recognise the challenge of climate change and believe that our strong track record of investment in emissions reduction provides a platform for our entry in the NZETS as an Emissions Intensive Trade Exposed business, as well as securing our major ongoing contribution to the Northland and wider New Zealand economy.
Longer term, we see an opportunity to leverage our existing infrastructure to produce green hydrogen and potentially, reduce our emissions by a further 50 per cent.
RIGHT FOCUS
Te Mahi Hou is the single largest carbon reduction project in New Zealand and proves that doing the right thing for the environment can also make good business sense.
1,000,000
500,000
0
1,500,000
200
205
210
215
220
225
230
2015 2016 2017 2018 2019(Provisional)
Scope 1 [t C02] Direct emissions – from fuel chemical reactions
Scope 2 [t C02] Indirect emissions – from purchased electricity
Carbon intensity [kg C02/t of product]
CARBON PROFILE
CO2
INTENSITY IMPROVEMENT
t CO 2
kg C
O 2/t o
f pro
duct
*Excludes front end engineering and design, and financing costs.
REFINING NZ ANNUAL REPORT 201924 25REFINING NZ ANNUAL REPORT 201924 25
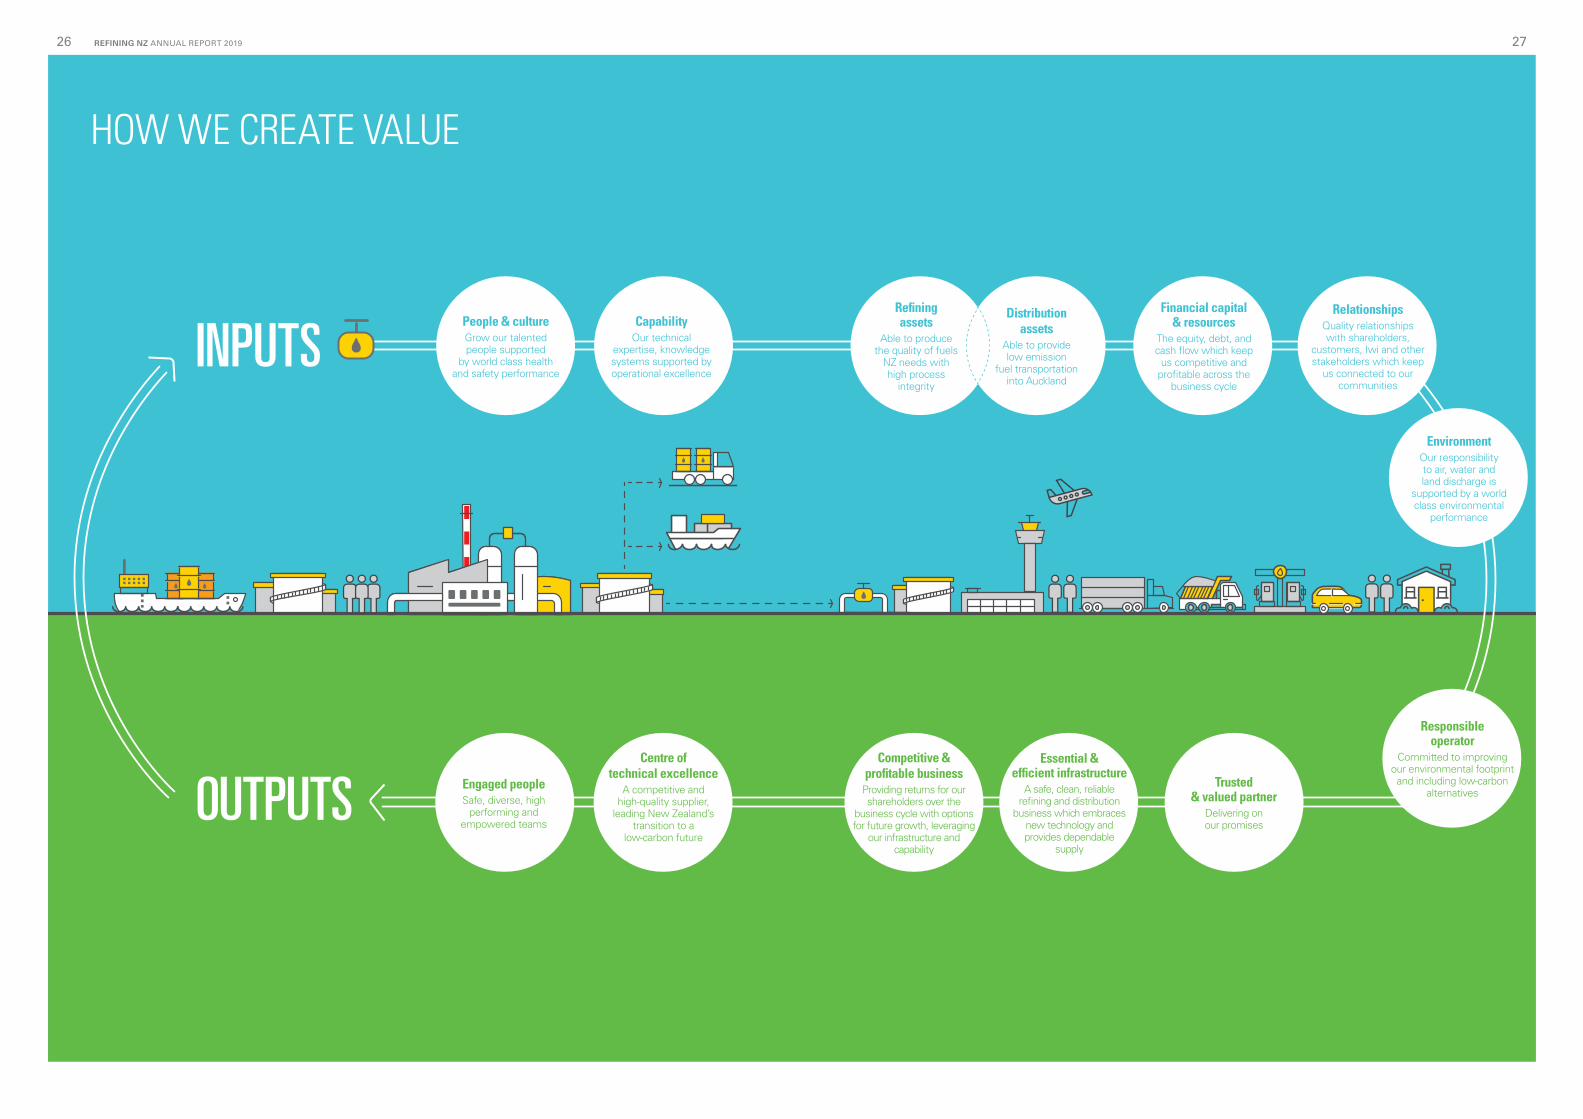
HOW WE CREATE VALUE
INPUTS
Engaged peopleSafe, diverse, high
performing and empowered teams
People & cultureGrow our talented people supported
by world class health and safety performance
CapabilityOur technical
expertise, knowledge systems supported by operational excellence
Centre of technical excellence
A competitive and high-quality supplier,
leading New Zealand’s transition to a
low-carbon future
Competitive & profitable businessProviding returns for our shareholders over the
business cycle with options for future growth, leveraging
our infrastructure and capability
Financial capital & resources
The equity, debt, and cash flow which keep
us competitive and profitable across the
business cycle
Essential & efficient infrastructure
A safe, clean, reliable refining and distribution
business which embraces new technology and provides dependable
supply
Trusted & valued partner
Delivering on our promises
Refining assets
Able to produce the quality of fuels
NZ needs with high process
integrity
Distribution assets
Able to provide low emission
fuel transportation into Auckland
OUTPUTS
EnvironmentOur responsibility to air, water and land discharge is
supported by a world class environmental
performance
Responsible operator
Committed to improving our environmental footprint and including low-carbon
alternatives
RelationshipsQuality relationships with shareholders,
customers, Iwi and other stakeholders which keep
us connected to our communities
REFINING NZ ANNUAL REPORT 201926 27
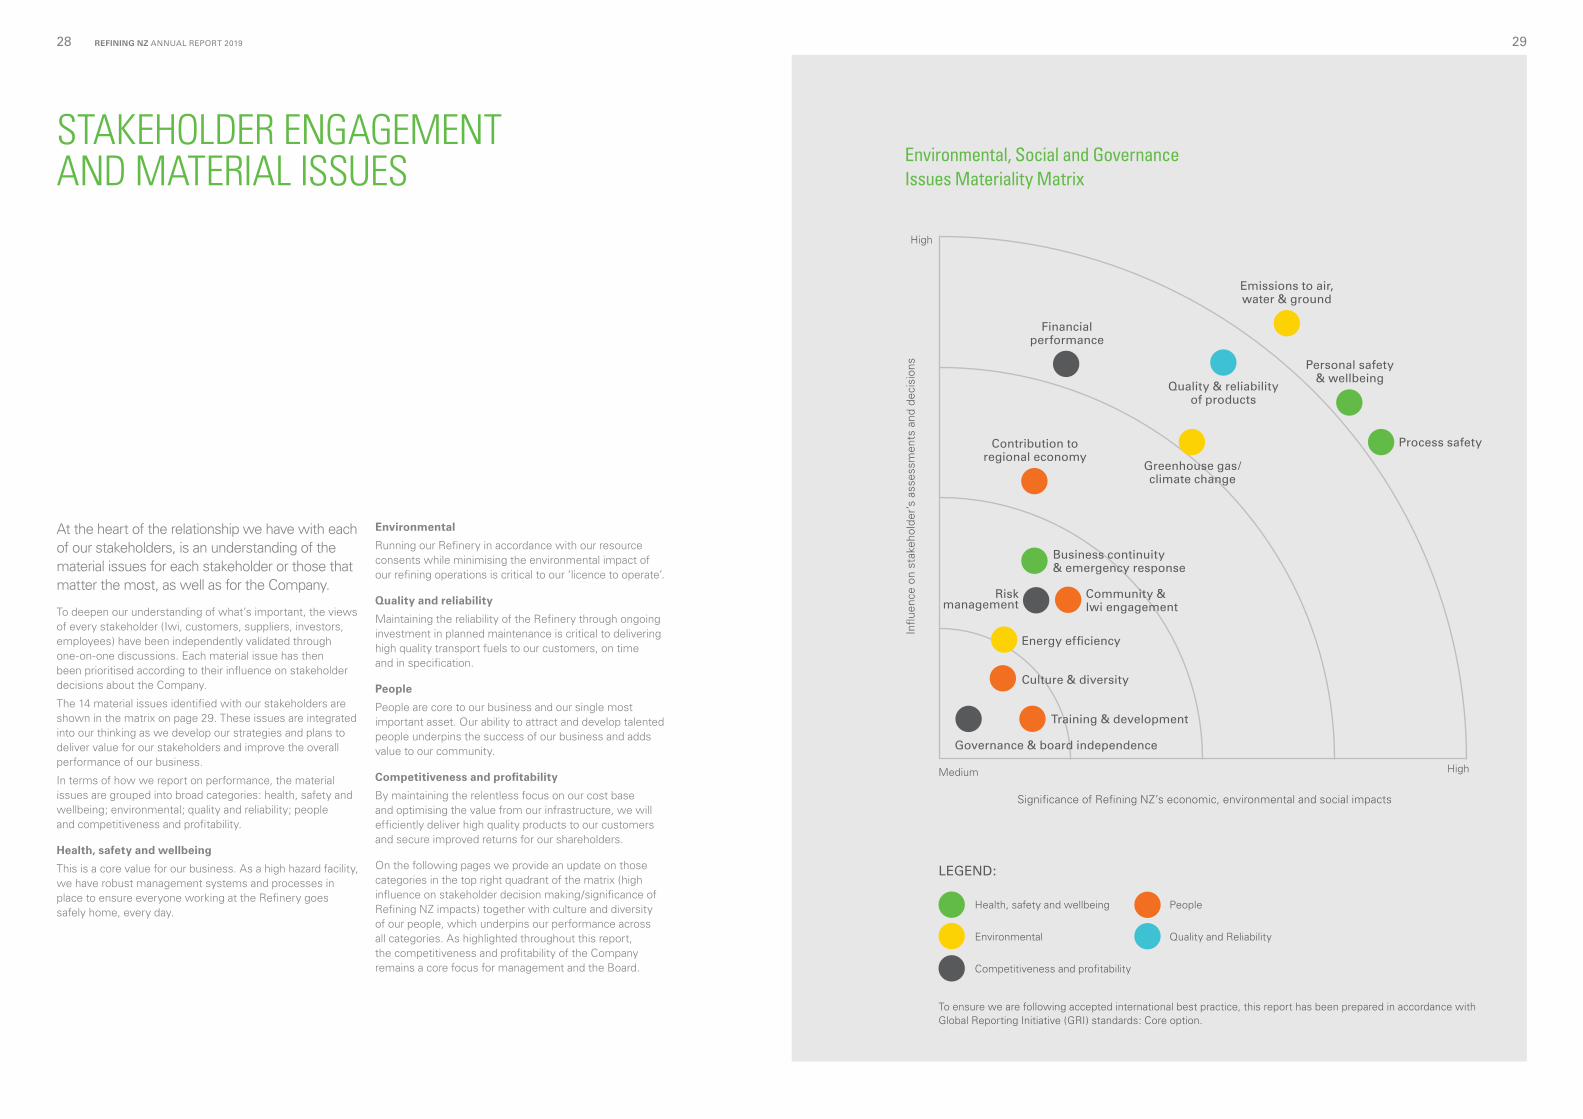
Significance of Refining NZ’s economic, environmental and social impacts
STAKEHOLDER ENGAGEMENT AND MATERIAL ISSUES
Influ
ence
on
stak
ehol
der’s
ass
essm
ents
and
dec
isio
ns
High
Medium High
Process safety
At the heart of the relationship we have with each of our stakeholders, is an understanding of the material issues for each stakeholder or those that matter the most, as well as for the Company.
To deepen our understanding of what’s important, the views of every stakeholder (Iwi, customers, suppliers, investors, employees) have been independently validated through one-on-one discussions. Each material issue has then been prioritised according to their influence on stakeholder decisions about the Company.
The 14 material issues identified with our stakeholders are shown in the matrix on page 29. These issues are integrated into our thinking as we develop our strategies and plans to deliver value for our stakeholders and improve the overall performance of our business.
In terms of how we report on performance, the material issues are grouped into broad categories: health, safety and wellbeing; environmental; quality and reliability; people and competitiveness and profitability.
Health, safety and wellbeing
This is a core value for our business. As a high hazard facility, we have robust management systems and processes in place to ensure everyone working at the Refinery goes safely home, every day.
Environmental
Running our Refinery in accordance with our resource consents while minimising the environmental impact of our refining operations is critical to our ‘licence to operate’.
Quality and reliability
Maintaining the reliability of the Refinery through ongoing investment in planned maintenance is critical to delivering high quality transport fuels to our customers, on time and in specification.
People
People are core to our business and our single most important asset. Our ability to attract and develop talented people underpins the success of our business and adds value to our community.
Competitiveness and profitability
By maintaining the relentless focus on our cost base and optimising the value from our infrastructure, we will efficiently deliver high quality products to our customers and secure improved returns for our shareholders.
On the following pages we provide an update on those categories in the top right quadrant of the matrix (high influence on stakeholder decision making/significance of Refining NZ impacts) together with culture and diversity of our people, which underpins our performance across all categories. As highlighted throughout this report, the competitiveness and profitability of the Company remains a core focus for management and the Board.
To ensure we are following accepted international best practice, this report has been prepared in accordance with Global Reporting Initiative (GRI) standards: Core option.
LEGEND:
Health, safety and wellbeing
Environmental
Competitiveness and profitability
People
Quality and Reliability
Environmental, Social and Governance Issues Materiality Matrix
REFINING NZ ANNUAL REPORT 201928 29
Governance & board independence
Training & development
Contribution to regional economy
Quality & reliability of products
Personal safety & wellbeing
Business continuity & emergency response
Community & Iwi engagement
Risk management
Energy efficiency
Culture & diversity
Financial performance
Emissions to air, water & ground
Greenhouse gas/climate change
DELIVER A WORLD CLASS HEALTH & SAFETY PERFORMANCE
Safety and wellbeing is one of our core values. We have an active programme to embed a culture that supports the safety and wellbeing of our employees, contractors and visitors to our site.
Our safety performance improved considerably in 2019, with no Tier 1 or Tier 2 incidents occurring and a reduction in lost time injury frequency rate (LTIFR) from 0.48 to 0.13 per 200,000 hours worked. Our performance was boosted by the introduction of the E Tu Tangata programme, which aims to embed a culture that values and delivers both personal and process safety.
Our programme is governed by the Central Safety Committee (CSC), chaired by our Managing Director and including the Leadership Team, along with subject matter experts, employees and contractor representatives. Six sub-committees are charged with the specifics of implementing and further developing our systems. Performance data is collected and reported back to the CSC for review. Personal safety is recorded in terms of the total recordable case frequency rate (TRCFR) and LTIFR, while process safety reporting takes place under a framework endorsed by the American Petroleum Institute – refer to page 119 for definitions of Tier 1 and Tier 2 Process Safety Events.
Our Safety Case, submitted to Worksafe in 2018 and approved in early 2020, has been promoted widely within and outside the Company. The Safety Case details how the Refinery identifies hazards that could result in major incidents (safety assessments), the systems used to manage the risk posed by major incidents (safety management system) and the systems for responding to any incidents (Emergency Response Management Plan).
The Safety Case was mandated under the 2015 Health and Safety at Work Act, given the Company is the largest and the most technically complex high hazard facility in New Zealand. While it is a matter of compliance, we have embraced the Safety Case as an opportunity to interrogate our systems and processes and provide assurance to workers, responding agencies and our community that the potential for major incidents has been assessed and effective controls are in place. As part of our 2020 programme we will address opportunities identified by Worksafe to enhance elements of our existing programme.
Our Emergency Services team undertook a busy programme of training for safety, preparedness and response, both internally and in conjunction with external peers. A key focus was training with Auckland fire brigades, which are first responders to any emergency involving the RAP within the Auckland city limits. More frequent and smaller scenario-based training was also carried out in conjunction with external response agencies.
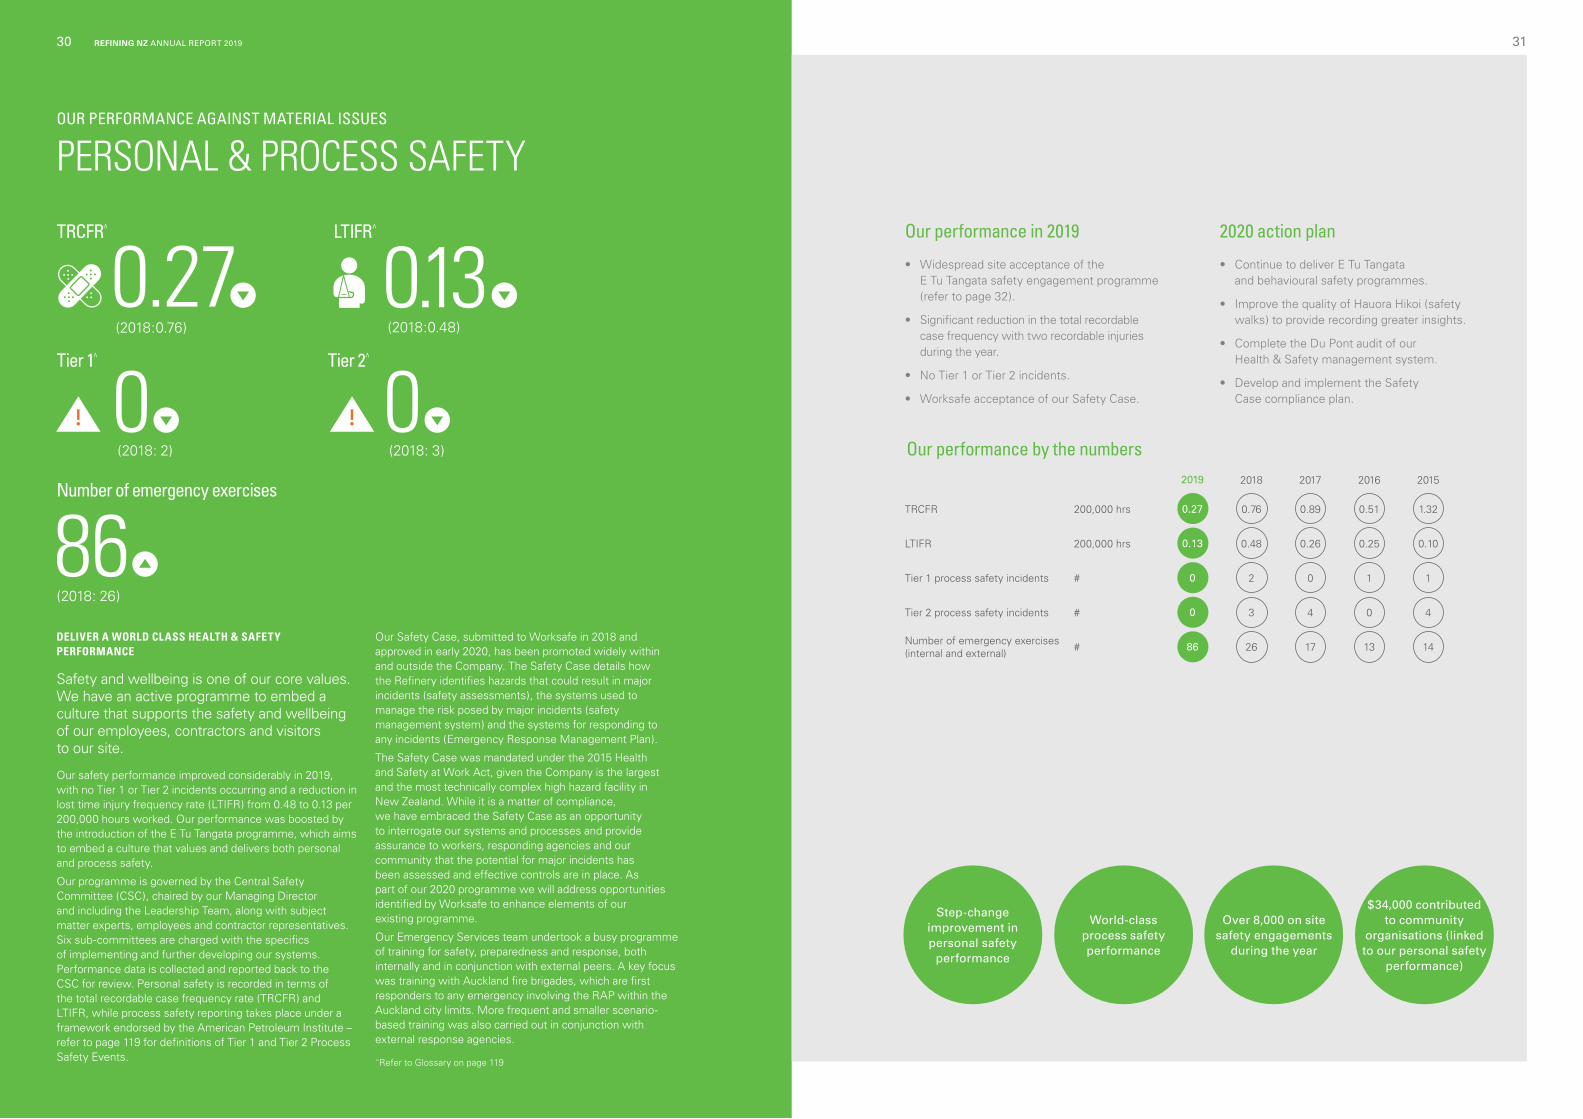
OUR PERFORMANCE AGAINST MATERIAL ISSUES
TRCFR^
Tier 1̂ Tier 2^
Number of emergency exercises
LTIFR^
(2018:0.76)
(2018: 2) (2018: 3)
(2018: 26)
(2018:0.48)
0.270 0
86
0.13
PERSONAL & PROCESS SAFETY
Our performance in 2019
• Widespread site acceptance of the E Tu Tangata safety engagement programme (refer to page 32).
• Significant reduction in the total recordable case frequency with two recordable injuries during the year.
• No Tier 1 or Tier 2 incidents.
• Worksafe acceptance of our Safety Case.
2020 action plan
• Continue to deliver E Tu Tangata and behavioural safety programmes.
• Improve the quality of Hauora Hikoi (safety walks) to provide recording greater insights.
• Complete the Du Pont audit of our Health & Safety management system.
• Develop and implement the Safety Case compliance plan.
Our performance by the numbers 2019 2018 2017 2016 2015
TRCFR 200,000 hrs 0.27 0.76 0.89 0.51 1.32
LTIFR 200,000 hrs 0.13 0.48 0.26 0.25 0.10
Tier 1 process safety incidents # 0 2 0 1 1
Tier 2 process safety incidents # 0 3 4 0 4
Number of emergency exercises (internal and external) # 86 26 17 13 14
Step-change improvement in personal safety
performance
World-class process safety performance
Over 8,000 on site safety engagements
during the year
$34,000 contributed to community
organisations (linked to our personal safety
performance)
^Refer to Glossary on page 119
31REFINING NZ ANNUAL REPORT 201930
“We really wanted our colleagues to know that when we are safe here, inside the gates, it’s not just us who benefit,” says Cory. “Our communities benefit when we practice safety. We wanted to recognise our collective efforts by making a quarterly donation to local charities.”
“The charities are voted on by our people. In 2019 we were able to donate to two fantastic local charities – Food for Life, which provides hot, healthy meals to children in low-decile Northland schools; and Te Tai Tokerau Emergency Housing Charitable Trust, which provides safe and affordable housing for our homeless population.”
One of the greatest strengths of E Tu Tangata is that it is designed, managed and supported by employees – the result being a significant improvement to our health and safety performance during 2019.
CASE STUDY
A grass roots initiative that took hold and grew
E Tu Tangata – our site-wide programme to embed a deep and effective safety culture – has grown and earned acceptance across the Refinery since its launch in early 2019.
E Tu Tangata was a grass roots response to a story of heart-breaking loss told by Wiremu and Marsella Edmonds to the site in 2018. “Hearing that story was a wero to me – a challenge – to really shake up the safety culture of our workplace and to make it relevant and meaningful – particularly for those who work hard to keep themselves and their buddies safe on site, as well as for our community,” says Cory Abraham, health and safety advisor. “We designed E Tu Tangata to do just that.”
“We partnered with the local school, which helped design a logo for the programme. The integrated patterns at the bottom represent all the different companies we work with onsite. The weave of the patterns represents unity. The fishbone pattern represents the programme, while Mount Manaia and the A Block stack represent our physical presence here at Marsden Point.”
The Kaihautu Award was designed alongside the programme as a quarterly recognition of individuals who have stood out for their attitudes towards health and safety. That concept extended to include a quarterly donation to a local community group, with the amount set by reference to our site-wide health and safety performance.
Image and brand to be supplied
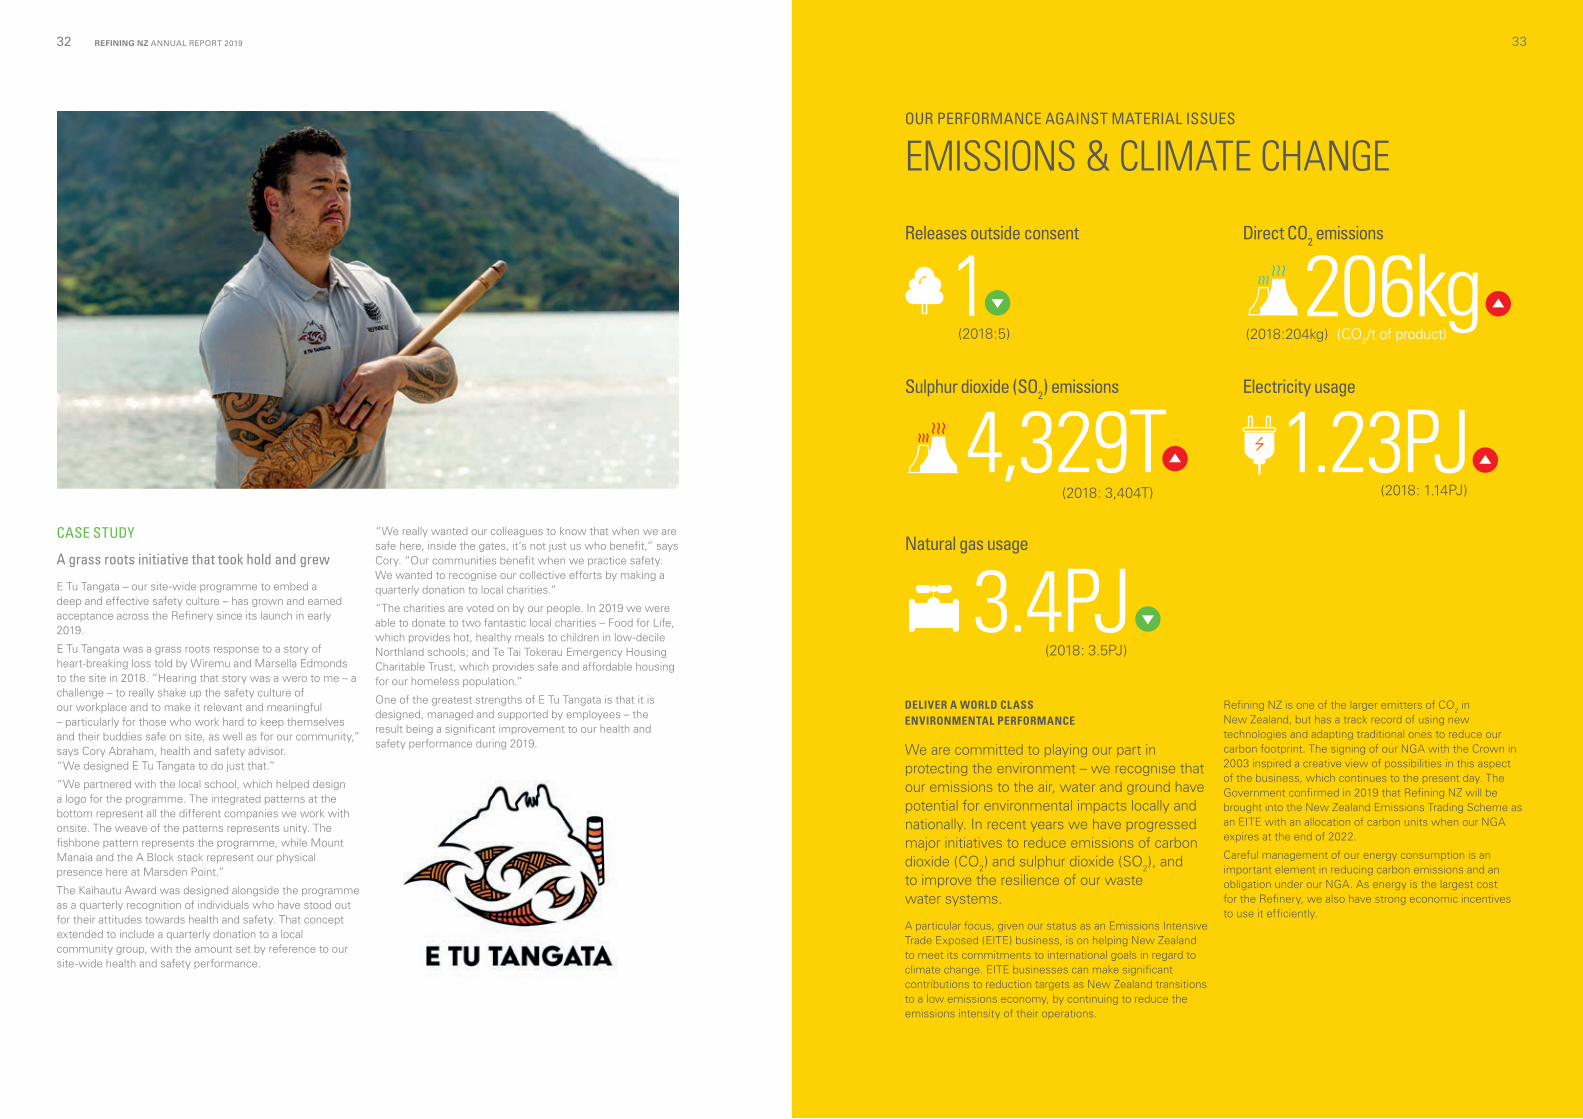
EMISSIONS & CLIMATE CHANGEOUR PERFORMANCE AGAINST MATERIAL ISSUES
DELIVER A WORLD CLASS ENVIRONMENTAL PERFORMANCE
We are committed to playing our part in protecting the environment – we recognise that our emissions to the air, water and ground have potential for environmental impacts locally and nationally. In recent years we have progressed major initiatives to reduce emissions of carbon dioxide (CO2) and sulphur dioxide (SO2), and to improve the resilience of our waste water systems.
A particular focus, given our status as an Emissions Intensive Trade Exposed (EITE) business, is on helping New Zealand to meet its commitments to international goals in regard to climate change. EITE businesses can make significant contributions to reduction targets as New Zealand transitions to a low emissions economy, by continuing to reduce the emissions intensity of their operations.
Refining NZ is one of the larger emitters of CO2 in New Zealand, but has a track record of using new technologies and adapting traditional ones to reduce our carbon footprint. The signing of our NGA with the Crown in 2003 inspired a creative view of possibilities in this aspect of the business, which continues to the present day. The Government confirmed in 2019 that Refining NZ will be brought into the New Zealand Emissions Trading Scheme as an EITE with an allocation of carbon units when our NGA expires at the end of 2022.
Careful management of our energy consumption is an important element in reducing carbon emissions and an obligation under our NGA. As energy is the largest cost for the Refinery, we also have strong economic incentives to use it efficiently.
Direct CO2 emissions
(2018:204kg) (CO2/t of product)
206kg
Natural gas usage
(2018: 3.5PJ)
3.4PJ
Sulphur dioxide (SO2) emissions
(2018: 3,404T)
4,329T
Releases outside consent
(2018:5)
1Electricity usage
(2018: 1.14PJ)
1.23PJ
REFINING NZ ANNUAL REPORT 201932 33
CASE STUDY
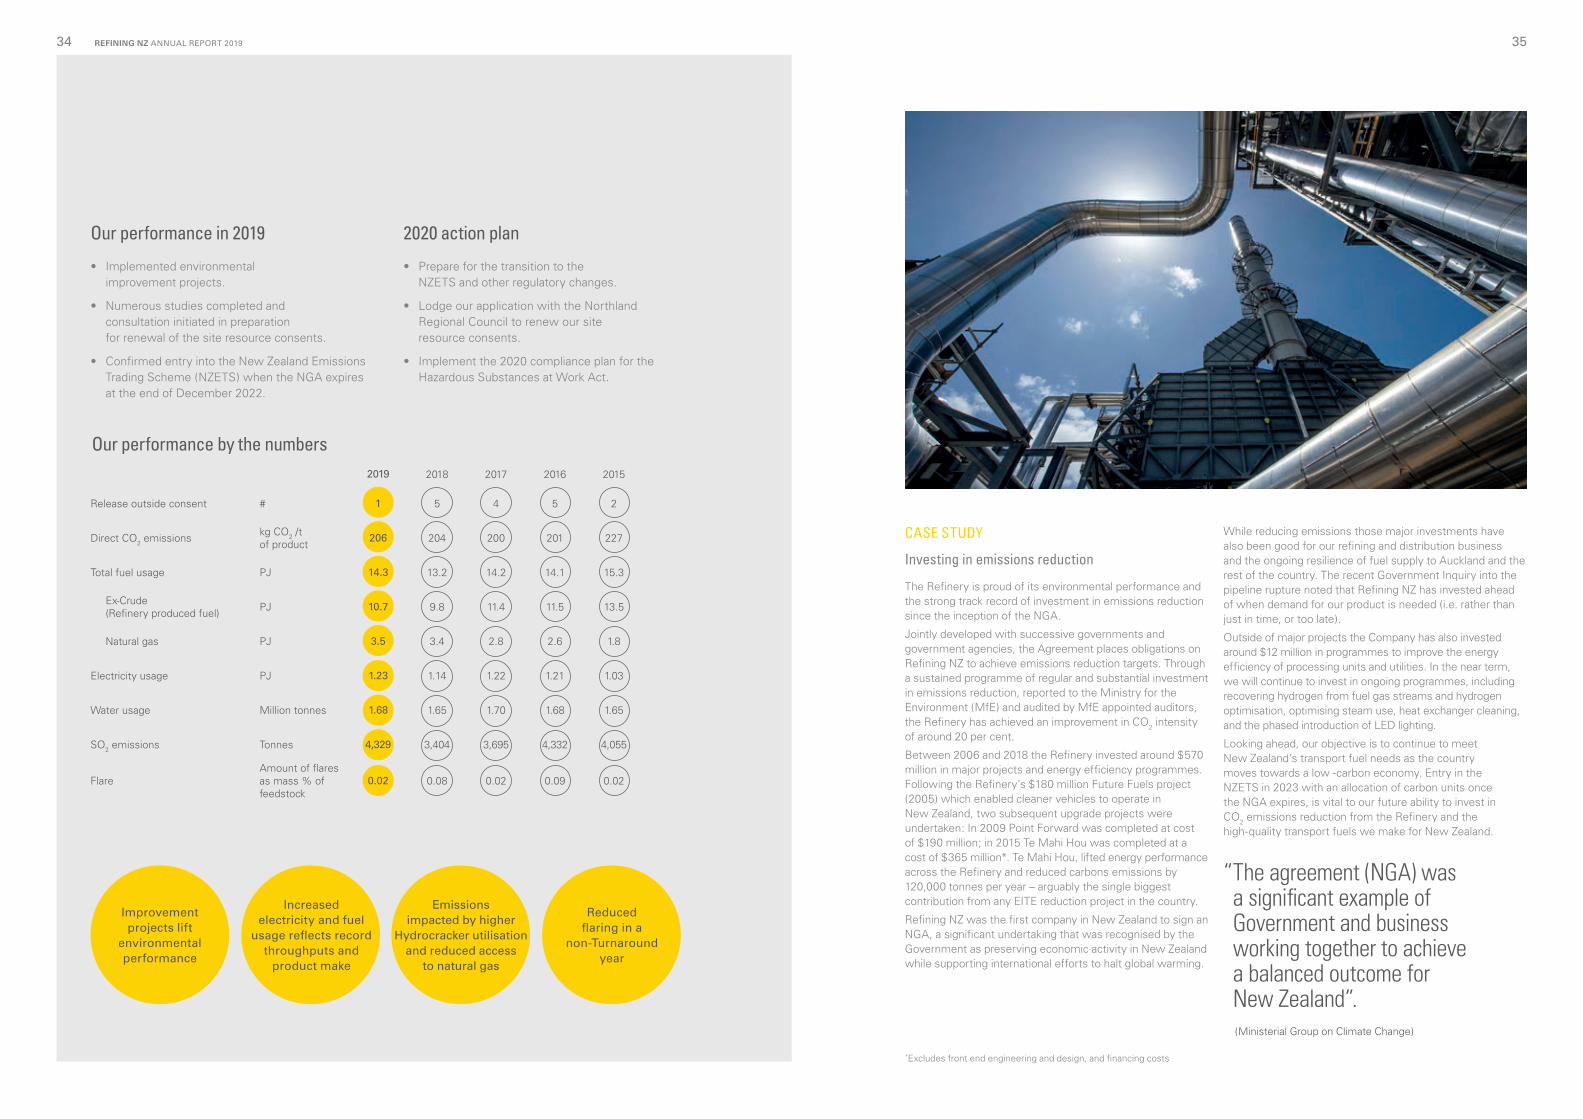
Investing in emissions reduction
The Refinery is proud of its environmental performance and the strong track record of investment in emissions reduction since the inception of the NGA.
Jointly developed with successive governments and government agencies, the Agreement places obligations on Refining NZ to achieve emissions reduction targets. Through a sustained programme of regular and substantial investment in emissions reduction, reported to the Ministry for the Environment (MfE) and audited by MfE appointed auditors, the Refinery has achieved an improvement in CO2 intensity of around 20 per cent.
Between 2006 and 2018 the Refinery invested around $570 million in major projects and energy efficiency programmes. Following the Refinery’s $180 million Future Fuels project (2005) which enabled cleaner vehicles to operate in New Zealand, two subsequent upgrade projects were undertaken: In 2009 Point Forward was completed at cost of $190 million; in 2015 Te Mahi Hou was completed at a cost of $365 million*. Te Mahi Hou, lifted energy performance across the Refinery and reduced carbons emissions by 120,000 tonnes per year – arguably the single biggest contribution from any EITE reduction project in the country.
Refining NZ was the first company in New Zealand to sign an NGA, a significant undertaking that was recognised by the Government as preserving economic activity in New Zealand while supporting international efforts to halt global warming.
While reducing emissions those major investments have also been good for our refining and distribution business and the ongoing resilience of fuel supply to Auckland and the rest of the country. The recent Government Inquiry into the pipeline rupture noted that Refining NZ has invested ahead of when demand for our product is needed (i.e. rather than just in time, or too late).
Outside of major projects the Company has also invested around $12 million in programmes to improve the energy efficiency of processing units and utilities. In the near term, we will continue to invest in ongoing programmes, including recovering hydrogen from fuel gas streams and hydrogen optimisation, optimising steam use, heat exchanger cleaning, and the phased introduction of LED lighting.
Looking ahead, our objective is to continue to meet New Zealand’s transport fuel needs as the country moves towards a low -carbon economy. Entry in the NZETS in 2023 with an allocation of carbon units once the NGA expires, is vital to our future ability to invest in CO2 emissions reduction from the Refinery and the high-quality transport fuels we make for New Zealand.
Our performance in 2019
• Implemented environmental improvement projects.
• Numerous studies completed and consultation initiated in preparation for renewal of the site resource consents.
• Confirmed entry into the New Zealand Emissions Trading Scheme (NZETS) when the NGA expires at the end of December 2022.
2020 action plan
• Prepare for the transition to the NZETS and other regulatory changes.
• Lodge our application with the Northland Regional Council to renew our site resource consents.
• Implement the 2020 compliance plan for the Hazardous Substances at Work Act.
Our performance by the numbers 2019 2018 2017 2016 2015
Release outside consent # 1 5 4 5 2
Direct CO2 emissions kg CO2 /t of product
206 204 200 201 227
Total fuel usage PJ 14.3 13.2 14.2 14.1 15.3
Ex-Crude (Refinery produced fuel) PJ 10.7 9.8 11.4 11.5 13.5
Natural gas PJ 3.5 3.4 2.8 2.6 1.8
Electricity usage PJ 1.23 1.14 1.22 1.21 1.03
Water usage Million tonnes 1.68 1.65 1.70 1.68 1.65
SO2 emissions Tonnes 4,329 3,404 3,695 4,332 4,055
FlareAmount of flares as mass % of feedstock
0.02 0.08 0.02 0.09 0.02
Improvement projects lift
environmental performance
Increased electricity and fuel
usage reflects record throughputs and
product make
Emissions impacted by higher
Hydrocracker utilisation and reduced access
to natural gas
Reduced flaring in a
non-Turnaround year
“ The agreement (NGA) was a significant example of Government and business working together to achieve a balanced outcome for New Zealand”.(Ministerial Group on Climate Change)
*Excludes front end engineering and design, and financing costs
2020 action plan
• Continue to deliver E Tu Tangata and behavioural safety programmes.
• Improve the quality of Hauora Hikoi (safety walks) to provide recording greater insights.
• Complete the Du Pont audit of our Health & Safety management system.
• Develop and implement the Safety Case compliance plan.
REFINING NZ ANNUAL REPORT 201934 35
QUALITY & RELIABILITYOUR PERFORMANCE AGAINST MATERIAL ISSUES
Refinery throughput
Operational availability
RAP throughput
(2018:21.0m)
(2018:40.4m)
(2018:90.7%)
20.8m
42.7m
99.7%
BUILD ON THE QUALITY & RELIABILITY ELEMENTS OF OUR CUSTOMER PROMISE
The reliability of our processing units and the high quality of our fuel products are essential to the resilient supply of fuel products (petrol, diesel, jet fuel) to our customers in Auckland and across New Zealand.
Maintaining the reliability and quality elements of our customer promise means constant monitoring of our performance and the people, plant, systems and processes behind that, and adopting a continuous improvement mindset. The Refinery runs a quality management system to the requirements of ISO 9001 (Quality Management), which is externally audited on a regular basis.
Our performance goal is to deliver to our customers in full, on time and in specification. Keeping unplanned downtime to a minimum is critical and our operational availability compares well with refineries of a similar size and complexity in the region.
In 2019 we progressed a range of projects to improve our current performance and position our operations for the future. These projects have either provided or are expected to lift our operational performance and increase product volumes in order to deliver a reliable and quality supply option to our customers and improved returns to shareholders.
Unplanned RAP downtime
(2018:1.3)
0.9%
Unplanned Refinery downtime
(2018:0.8)
1.6%
Our performance in 2019
• Accelerated and optimised our tank maintenance programme, avoiding the need to convert a tank for jet service and reducing the investment that would otherwise be required.
• Advanced our Crude Shipping Project via optimisation discussions with our customers and started baseline water quality monitoring.
• Sulphur Plant successfully commissioned.
• Continued with preparations for 2020 planned maintenance Turnarounds. Preparedness benchmarked as ‘top quartile’.
• Trialled new crudes to give our customers more buying choice.
2020 action plan
• Maintain systems and programmes of work to deliver product to our customers – in full, on time, and in specification.
• Deliver a successful Turnaround 2020 and continue preparations for 2021 Turnaround.
• Continue to improve the yield on the Continuous Catalytic Reformer Platformer and complete the first statutory inspection since commissioning in 2015.
• Achieve ISO 55001 Asset Management accreditation.
Our performance by the numbers 2019 2018 2017 2016 2015
Refinery throughput million barrels 42.7 40.4 41.7 42.7 42.6
RAP throughput million barrels 20.8 21.0 19.8 20.1 18.4
Operational availability % 99.7 90.7 98.0 96.9 97.7
Unplanned Refinery downtime % 1.6 0.8 0.6 0.9 0.3
Unplanned RAP downtime % 0.9 1.3 4.6 0.9 0.6
Strong Refinery throughput resulting in several production
records
RAP throughput was the second
highest on record
High operational availability on the
Refinery’s processing units
Low unplanned downtime on both the Refinery and
the RAP
37REFINING NZ ANNUAL REPORT 201936
CASE STUDY
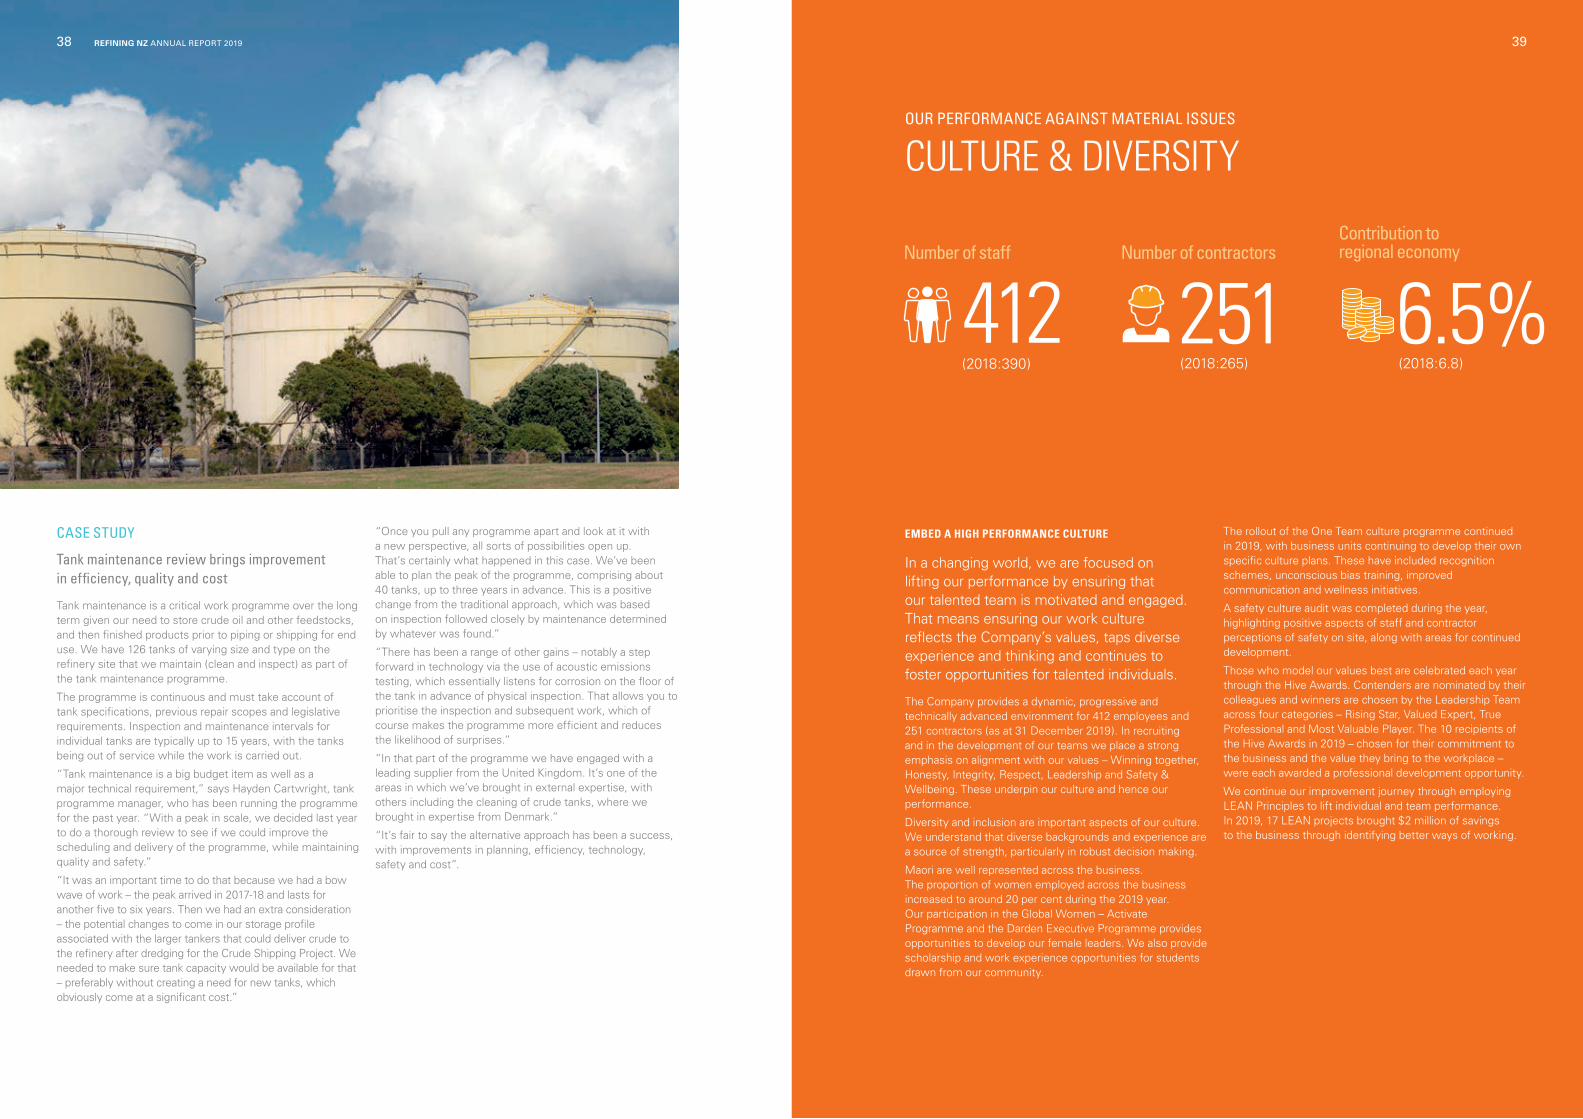
Tank maintenance review brings improvement in efficiency, quality and cost
Tank maintenance is a critical work programme over the long term given our need to store crude oil and other feedstocks, and then finished products prior to piping or shipping for end use. We have 126 tanks of varying size and type on the refinery site that we maintain (clean and inspect) as part of the tank maintenance programme.
The programme is continuous and must take account of tank specifications, previous repair scopes and legislative requirements. Inspection and maintenance intervals for individual tanks are typically up to 15 years, with the tanks being out of service while the work is carried out.
“Tank maintenance is a big budget item as well as a major technical requirement,” says Hayden Cartwright, tank programme manager, who has been running the programme for the past year. “With a peak in scale, we decided last year to do a thorough review to see if we could improve the scheduling and delivery of the programme, while maintaining quality and safety.”
“It was an important time to do that because we had a bow wave of work – the peak arrived in 2017-18 and lasts for another five to six years. Then we had an extra consideration – the potential changes to come in our storage profile associated with the larger tankers that could deliver crude to the refinery after dredging for the Crude Shipping Project. We needed to make sure tank capacity would be available for that – preferably without creating a need for new tanks, which obviously come at a significant cost.”
“Once you pull any programme apart and look at it with a new perspective, all sorts of possibilities open up. That’s certainly what happened in this case. We’ve been able to plan the peak of the programme, comprising about 40 tanks, up to three years in advance. This is a positive change from the traditional approach, which was based on inspection followed closely by maintenance determined by whatever was found.”
“There has been a range of other gains – notably a step forward in technology via the use of acoustic emissions testing, which essentially listens for corrosion on the floor of the tank in advance of physical inspection. That allows you to prioritise the inspection and subsequent work, which of course makes the programme more efficient and reduces the likelihood of surprises.”
“In that part of the programme we have engaged with a leading supplier from the United Kingdom. It’s one of the areas in which we’ve brought in external expertise, with others including the cleaning of crude tanks, where we brought in expertise from Denmark.”
“It’s fair to say the alternative approach has been a success, with improvements in planning, efficiency, technology, safety and cost”.
CULTURE & DIVERSITYOUR PERFORMANCE AGAINST MATERIAL ISSUES
EMBED A HIGH PERFORMANCE CULTURE
In a changing world, we are focused on lifting our performance by ensuring that our talented team is motivated and engaged. That means ensuring our work culture reflects the Company’s values, taps diverse experience and thinking and continues to foster opportunities for talented individuals.
The Company provides a dynamic, progressive and technically advanced environment for 412 employees and 251 contractors (as at 31 December 2019). In recruiting and in the development of our teams we place a strong emphasis on alignment with our values – Winning together, Honesty, Integrity, Respect, Leadership and Safety & Wellbeing. These underpin our culture and hence our performance.
Diversity and inclusion are important aspects of our culture. We understand that diverse backgrounds and experience are a source of strength, particularly in robust decision making.
Maori are well represented across the business. The proportion of women employed across the business increased to around 20 per cent during the 2019 year. Our participation in the Global Women – Activate Programme and the Darden Executive Programme provides opportunities to develop our female leaders. We also provide scholarship and work experience opportunities for students drawn from our community.
The rollout of the One Team culture programme continued in 2019, with business units continuing to develop their own specific culture plans. These have included recognition schemes, unconscious bias training, improved communication and wellness initiatives.
A safety culture audit was completed during the year, highlighting positive aspects of staff and contractor perceptions of safety on site, along with areas for continued development.
Those who model our values best are celebrated each year through the Hive Awards. Contenders are nominated by their colleagues and winners are chosen by the Leadership Team across four categories – Rising Star, Valued Expert, True Professional and Most Valuable Player. The 10 recipients of the Hive Awards in 2019 – chosen for their commitment to the business and the value they bring to the workplace – were each awarded a professional development opportunity.
We continue our improvement journey through employing LEAN Principles to lift individual and team performance. In 2019, 17 LEAN projects brought $2 million of savings to the business through identifying better ways of working.
Number of staff Number of contractorsContribution to regional economy
(2018:390) (2018:265) (2018:6.8)
412 251 6.5%
REFINING NZ ANNUAL REPORT 201938 39
Our performance in 2019
• Continued rollout of the “One Team” culture programme.
• Inaugural Kaihautu Awards to reinforce the Company’s values.
• Safety culture audit completed.
• Mentoring provided to high-potential employees through leadership development programmes.
• Increased female representation across the Company to around 20 per cent.
• Professional development awarded to ten recipients of Hive Awards.
2020 action plan
• Continued participation in the Darden Executive Programme and the Global Women – Activate Programme.
• Cultural safety development workshops as part of the E Tu Tangata programme.
• Continued focus on values, with the safety observation programme acknowledging good values-based behaviours observed in the field.
• A regional Girls in Trades forum to be facilitated in conjunction with the Ministry of Education, supporting career pathways for young women studying STEM courses.
Our performance by the numbers 2019 2018 2017 2016 2015
Number of staff (excluding Directors) Headcount 412 390 396 386 394
Number of contractors Headcount 251 265 293 178 178
Contribution to regional economy* % of Northland GDP 6.5 6.8 7.3 7.5 7.5
CASE STUDY
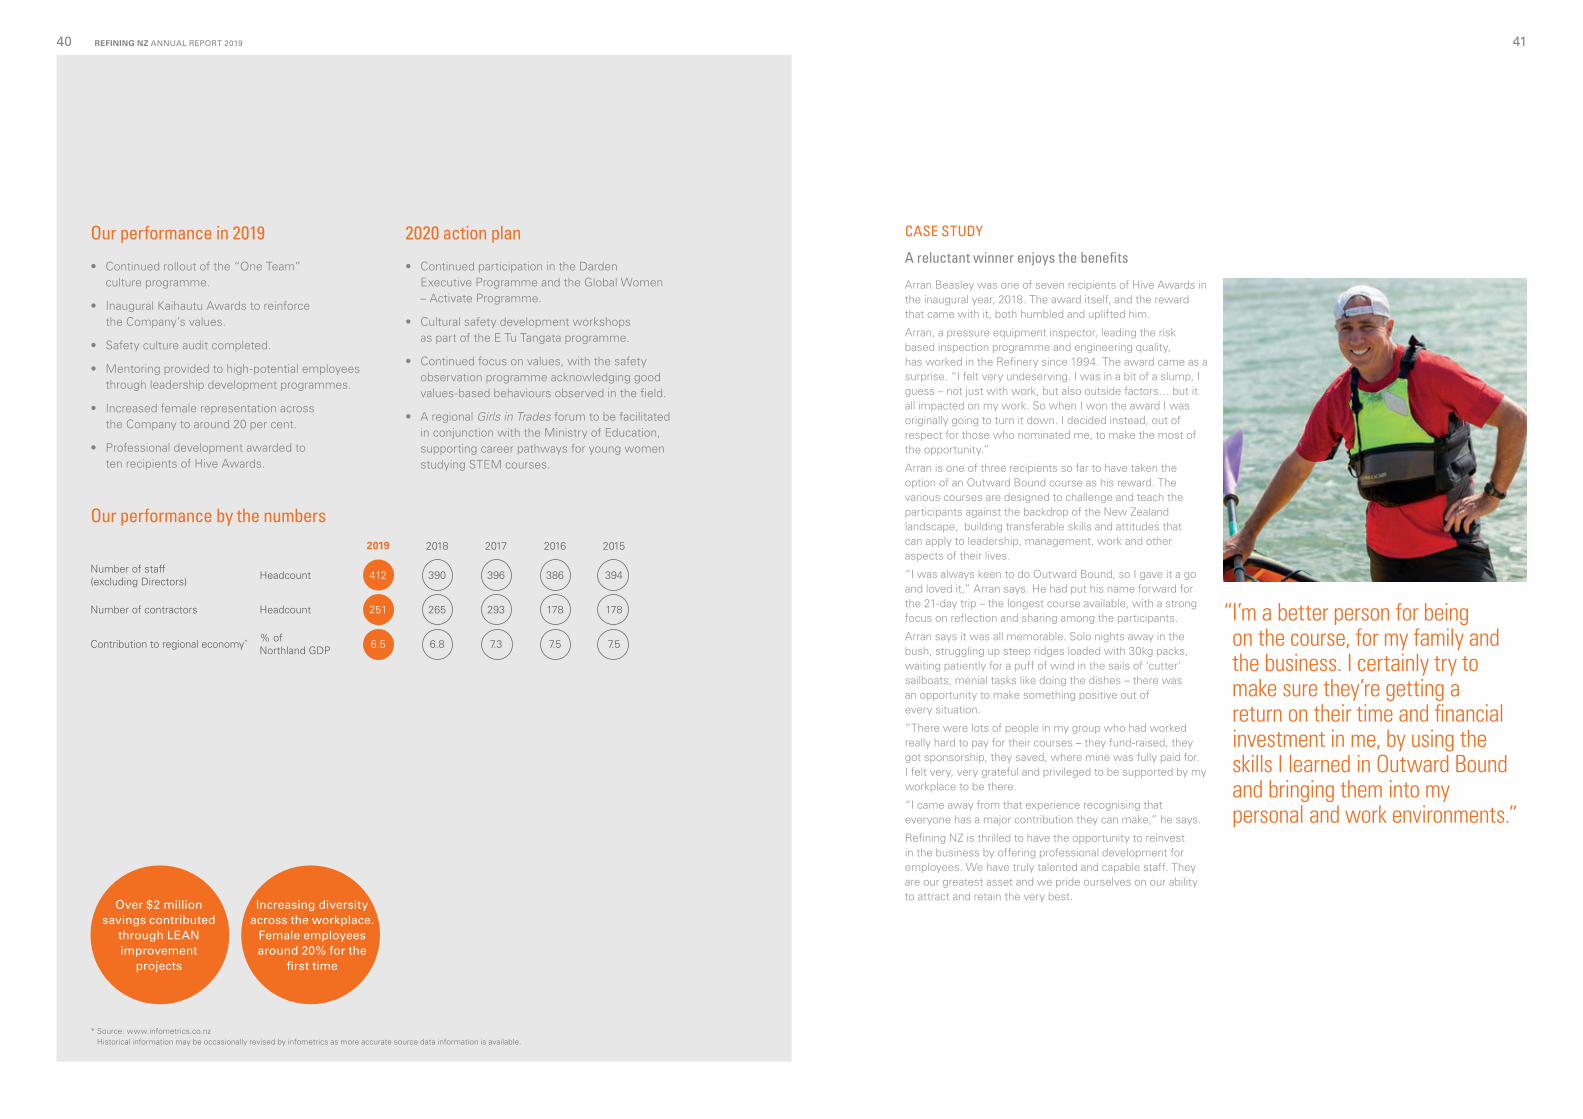
A reluctant winner enjoys the benefits
Arran Beasley was one of seven recipients of Hive Awards in the inaugural year, 2018. The award itself, and the reward that came with it, both humbled and uplifted him.
Arran, a pressure equipment inspector, leading the risk based inspection programme and engineering quality, has worked in the Refinery since 1994. The award came as a surprise. “I felt very undeserving. I was in a bit of a slump, I guess – not just with work, but also outside factors… but it all impacted on my work. So when I won the award I was originally going to turn it down. I decided instead, out of respect for those who nominated me, to make the most of the opportunity.”
Arran is one of three recipients so far to have taken the option of an Outward Bound course as his reward. The various courses are designed to challenge and teach the participants against the backdrop of the New Zealand landscape, building transferable skills and attitudes that can apply to leadership, management, work and other aspects of their lives.
“I was always keen to do Outward Bound, so I gave it a go and loved it,” Arran says. He had put his name forward for the 21-day trip – the longest course available, with a strong focus on reflection and sharing among the participants.
Arran says it was all memorable. Solo nights away in the bush, struggling up steep ridges loaded with 30kg packs, waiting patiently for a puff of wind in the sails of ‘cutter’ sailboats, menial tasks like doing the dishes – there was an opportunity to make something positive out of every situation.
“There were lots of people in my group who had worked really hard to pay for their courses – they fund-raised, they got sponsorship, they saved, where mine was fully paid for. I felt very, very grateful and privileged to be supported by my workplace to be there.
“I came away from that experience recognising that everyone has a major contribution they can make,” he says.
Refining NZ is thrilled to have the opportunity to reinvest in the business by offering professional development for employees. We have truly talented and capable staff. They are our greatest asset and we pride ourselves on our ability to attract and retain the very best.
“ I’m a better person for being on the course, for my family and the business. I certainly try to make sure they’re getting a return on their time and financial investment in me, by using the skills I learned in Outward Bound and bringing them into my personal and work environments.”
* Source: www.infometrics.co.nz Historical information may be occasionally revised by infometrics as more accurate source data information is available.
Over $2 million savings contributed
through LEAN improvement
projects
Increasing diversity across the workplace.
Female employees around 20% for the
first time
REFINING NZ ANNUAL REPORT 201940 41

BOARD OF DIRECTORS LEADERSHIP TEAM
Simon AllenIndependent Chairman
Equity interest: 35,000 shares (2018: 35,000)
Deborah BoffaDirector
Equity interest: Nil
Andrew BrewerChief Operating Officer
Riccardo CavalloDirector
Equity interest: Nil
James MillerIndependent Director
Equity interest: 23,000 shares (2018: 23,000)
Vanessa StoddartIndependent Director
Equity interest: Nil
Paul ZealandManaging Director
Equity interest: Nil
For full biographies see our website
REFININGNZ.COM
REFINING NZ ANNUAL REPORT 201942 43
Joe AkariChief People and Capability Officer
Robin BaxterEngineering Manager
Denise JensenChief Financial Officer and
Company Secretary
Greg McNeillCommunications and External
Affairs Manager
Jack StewartActing Refining Manager
Kevin StillSupply Chain and
Business Optimisation Manager
Napo HenareRefining NZ Kaumatua
(Cultural advisor to Managing Director)
Equity interest: Nil
Lindis JonesDirector
Equity interest: Nil
Julian YoungChief Development Officer
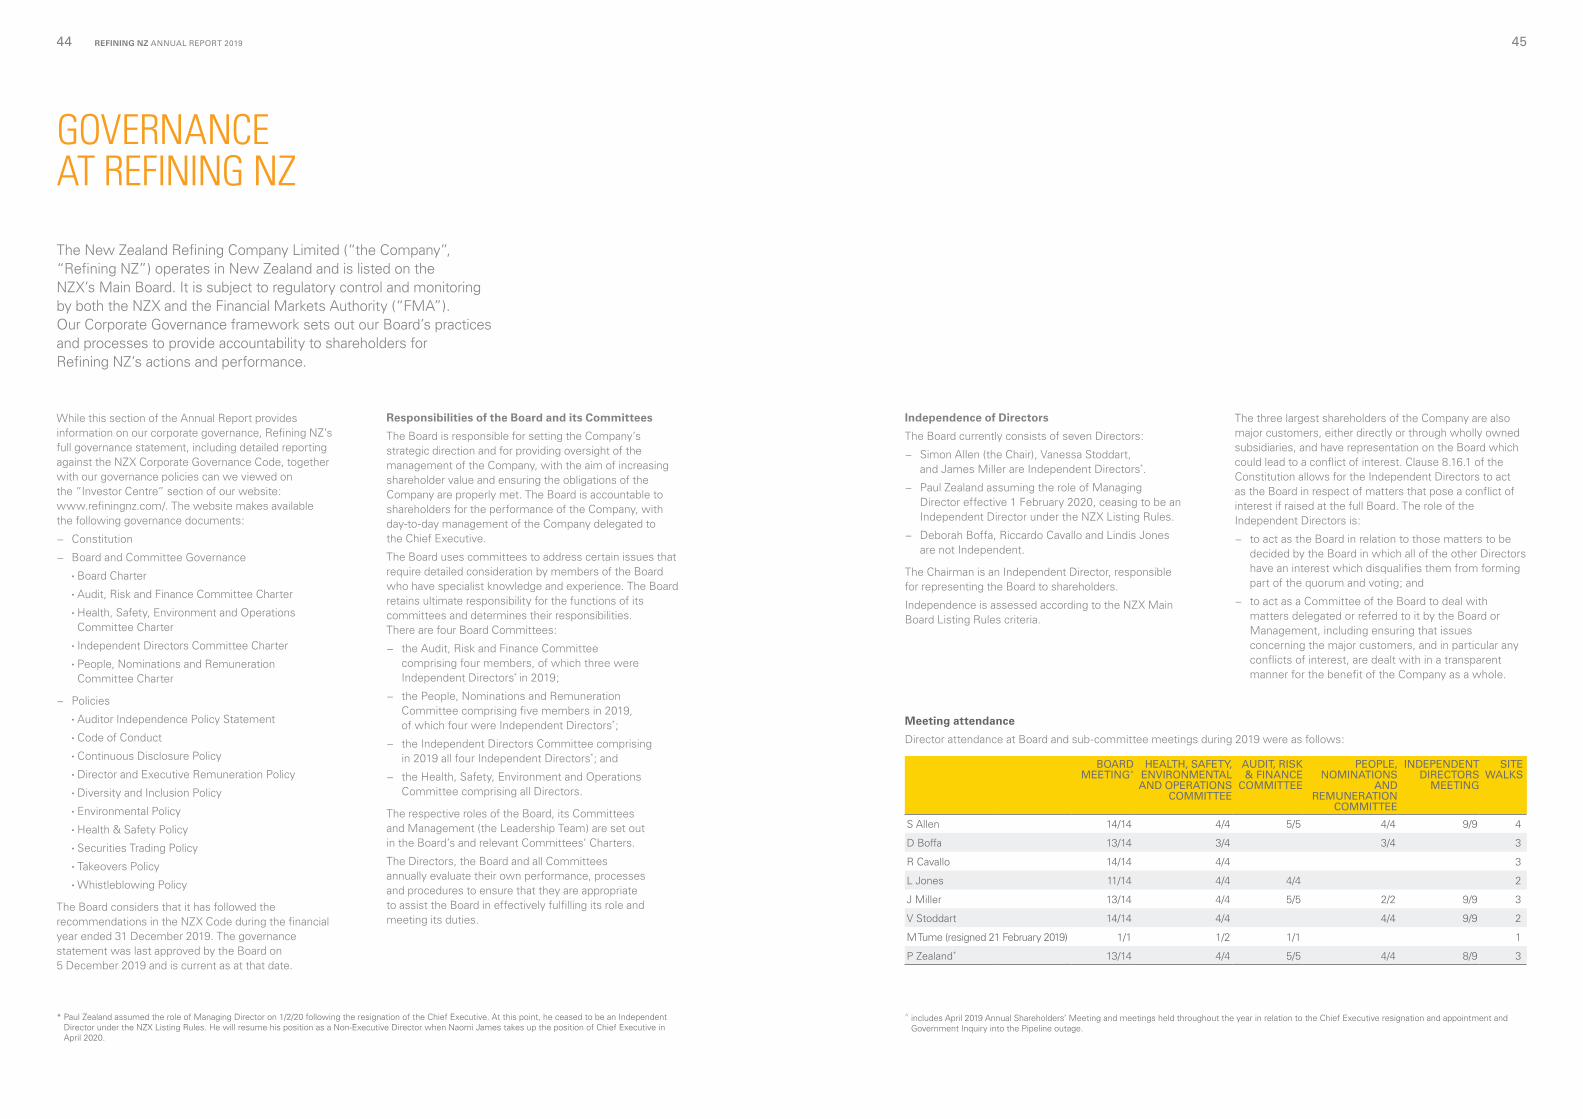
Meeting attendance
Director attendance at Board and sub-committee meetings during 2019 were as follows:
BOARD MEETING^
HEALTH, SAFETY, ENVIRONMENTAL AND OPERATIONS
COMMITTEE
AUDIT, RISK & FINANCE
COMMITTEE
PEOPLE, NOMINATIONS
AND REMUNERATION
COMMITTEE
INDEPENDENT DIRECTORS
MEETING
SITE WALKS
S Allen 14/14 4/4 5/5 4/4 9/9 4
D Boffa 13/14 3/4 3/4 3
R Cavallo 14/14 4/4 3
L Jones 11/14 4/4 4/4 2
J Miller 13/14 4/4 5/5 2/2 9/9 3
V Stoddart 14/14 4/4 4/4 9/9 2
M Tume (resigned 21 February 2019) 1/1 1/2 1/1 1
P Zealand* 13/14 4/4 5/5 4/4 8/9 3
GOVERNANCE AT REFINING NZ
The New Zealand Refining Company Limited (“the Company”, “Refining NZ”) operates in New Zealand and is listed on the NZX’s Main Board. It is subject to regulatory control and monitoring by both the NZX and the Financial Markets Authority (“FMA”). Our Corporate Governance framework sets out our Board’s practices and processes to provide accountability to shareholders for Refining NZ’s actions and performance.
While this section of the Annual Report provides information on our corporate governance, Refining NZ’s full governance statement, including detailed reporting against the NZX Corporate Governance Code, together with our governance policies can we viewed on the ”Investor Centre” section of our website: www.refiningnz.com/. The website makes available the following governance documents:
− Constitution
− Board and Committee Governance
• Board Charter
• Audit, Risk and Finance Committee Charter
• Health, Safety, Environment and Operations Committee Charter
• Independent Directors Committee Charter
• People, Nominations and Remuneration Committee Charter
− Policies
• Auditor Independence Policy Statement
• Code of Conduct
• Continuous Disclosure Policy
• Director and Executive Remuneration Policy
• Diversity and Inclusion Policy
• Environmental Policy
• Health & Safety Policy
• Securities Trading Policy
• Takeovers Policy
• Whistleblowing Policy
The Board considers that it has followed the recommendations in the NZX Code during the financial year ended 31 December 2019. The governance statement was last approved by the Board on 5 December 2019 and is current as at that date.
Independence of Directors
The Board currently consists of seven Directors:
− Simon Allen (the Chair), Vanessa Stoddart, and James Miller are Independent Directors*.
− Paul Zealand assuming the role of Managing Director effective 1 February 2020, ceasing to be an Independent Director under the NZX Listing Rules.
− Deborah Boffa, Riccardo Cavallo and Lindis Jones are not Independent.
The Chairman is an Independent Director, responsible for representing the Board to shareholders.
Independence is assessed according to the NZX Main Board Listing Rules criteria.
Responsibilities of the Board and its Committees
The Board is responsible for setting the Company’s strategic direction and for providing oversight of the management of the Company, with the aim of increasing shareholder value and ensuring the obligations of the Company are properly met. The Board is accountable to shareholders for the performance of the Company, with day-to-day management of the Company delegated to the Chief Executive.
The Board uses committees to address certain issues that require detailed consideration by members of the Board who have specialist knowledge and experience. The Board retains ultimate responsibility for the functions of its committees and determines their responsibilities. There are four Board Committees:
− the Audit, Risk and Finance Committee comprising four members, of which three were Independent Directors* in 2019;
− the People, Nominations and Remuneration Committee comprising five members in 2019, of which four were Independent Directors*;
− the Independent Directors Committee comprising in 2019 all four Independent Directors*; and
− the Health, Safety, Environment and Operations Committee comprising all Directors.
The respective roles of the Board, its Committees and Management (the Leadership Team) are set out in the Board’s and relevant Committees’ Charters.
The Directors, the Board and all Committees annually evaluate their own performance, processes and procedures to ensure that they are appropriate to assist the Board in effectively fulfilling its role and meeting its duties.
The three largest shareholders of the Company are also major customers, either directly or through wholly owned subsidiaries, and have representation on the Board which could lead to a conflict of interest. Clause 8.16.1 of the Constitution allows for the Independent Directors to act as the Board in respect of matters that pose a conflict of interest if raised at the full Board. The role of the Independent Directors is:
− to act as the Board in relation to those matters to be decided by the Board in which all of the other Directors have an interest which disqualifies them from forming part of the quorum and voting; and
− to act as a Committee of the Board to deal with matters delegated or referred to it by the Board or Management, including ensuring that issues concerning the major customers, and in particular any conflicts of interest, are dealt with in a transparent manner for the benefit of the Company as a whole.
^ includes April 2019 Annual Shareholders’ Meeting and meetings held throughout the year in relation to the Chief Executive resignation and appointment and Government Inquiry into the Pipeline outage.
* Paul Zealand assumed the role of Managing Director on 1/2/20 following the resignation of the Chief Executive. At this point, he ceased to be an Independent Director under the NZX Listing Rules. He will resume his position as a Non-Executive Director when Naomi James takes up the position of Chief Executive in April 2020.
REFINING NZ ANNUAL REPORT 201944 45
REMUNERATION & PEOPLE REPORT
Director and executive team remuneration
The Company has adopted a Director and Executive Remuneration Policy for remuneration of the Board and Leadership Team. Refining NZ’s remuneration framework and policies are overseen by the People, Nominations and Remuneration Committee in line with the Charter.
Remuneration
Refining NZ aims to attract and retain appropriately qualified and experienced individuals. Refining NZ applies a fair and equitable approach to remuneration and reward practices, taking into account internal and external relativities balanced against the commercial environment.
The Board will take independent advice and establish market rates and medians against New Zealand businesses of comparable size and complexity, having regard to industry specific and generic roles. Individual performance, company performance and market relativity are key considerations in setting remuneration levels.
In 2019, the Company engaged remuneration consultants Korn Ferry to undertake a comprehensive pay equity review to help ensure that remuneration processes equitably reward performance.
In 2018, the Board took independent advice in relation to the remuneration offered to the Chief Executive and a number of Leadership Team members.
Directors’ Remuneration
The Board determines the level of remuneration paid to Directors within the amounts approved by shareholders (that is, from the approved collective pool). The current approved fee pool limit is $900,000 and was approved by shareholders at the Annual Shareholders’ Meeting in April 2018. The Company undertook a market benchmarking of Directors’ fees in 2019. However, recognising the Company’s financial performance, the Board has elected not to increase Directors’ fees at this time.
The Directors do not participate in any profit-based incentive system. No Director of the Company has received, or become entitled to receive, a benefit (other than a benefit included in the total emoluments received or due and receivable by Directors shown in this report), including shares, remuneration paid by subsidiary company or other payments from services provided (including Directors and Officers insurance cover). The Chairman does not receive additional fees for being on a Committee. No loans have been made to Directors.
Chief Executive Remuneration
Chief Executive’s employment commenced on 27 August 2018. On 17 September 2019 Mike Fuge advised of his decision to resign from his role which became effective on 21 February 2020. As a result of the change, the remuneration detail provided below relates to payments made to the resigning Chief Executive.
The Chief Executive’s remuneration is approved by the Board and is reviewed annually.
Total Remuneration paid to Mike Fuge in the period 1 January to December 2019 was $932,000 and comprised of two components:
− fixed remuneration – base salary of $900,000, and
− other benefits of $32,000.
Directors’ remuneration is set at a level to remain comparable with other companies in New Zealand, taking into account the expertise, skills and responsibilities of Directors. The Directors of the subsidiary companies, Independent Petroleum Laboratory Limited Maranga Ra Limited and Maranga Ra Holdings Limited, are not remunerated in that position.
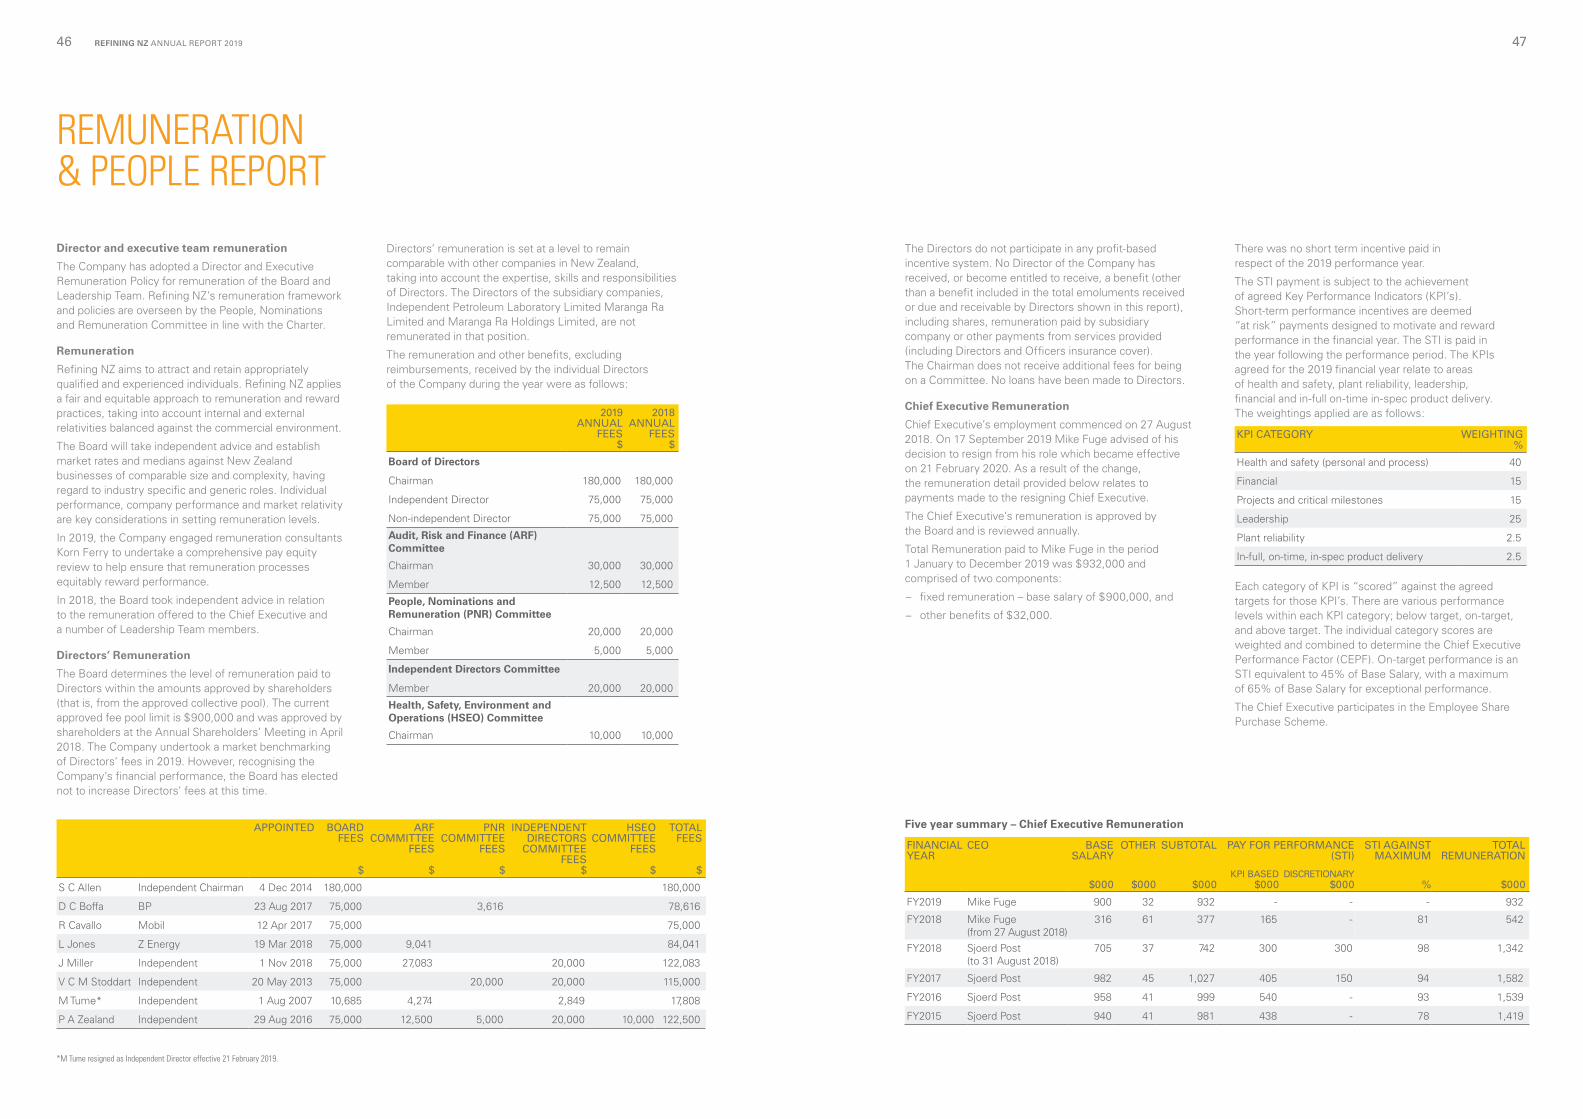
The remuneration and other benefits, excluding reimbursements, received by the individual Directors of the Company during the year were as follows:
2019ANNUAL
FEES$
2018ANNUAL
FEES$
Board of Directors
Chairman 180,000 180,000
Independent Director 75,000 75,000
Non-independent Director 75,000 75,000
Audit, Risk and Finance (ARF) Committee
Chairman 30,000 30,000
Member 12,500 12,500
People, Nominations and Remuneration (PNR) Committee
Chairman 20,000 20,000
Member 5,000 5,000
Independent Directors Committee
Member 20,000 20,000
Health, Safety, Environment and Operations (HSEO) Committee
Chairman 10,000 10,000
There was no short term incentive paid in respect of the 2019 performance year.
The STI payment is subject to the achievement of agreed Key Performance Indicators (KPI’s). Short-term performance incentives are deemed “at risk” payments designed to motivate and reward performance in the financial year. The STI is paid in the year following the performance period. The KPIs agreed for the 2019 financial year relate to areas of health and safety, plant reliability, leadership, financial and in-full on-time in-spec product delivery. The weightings applied are as follows:
KPI CATEGORY WEIGHTING%
Health and safety (personal and process) 40
Financial 15
Projects and critical milestones 15
Leadership 25
Plant reliability 2.5
In-full, on-time, in-spec product delivery 2.5
Each category of KPI is “scored” against the agreed targets for those KPI’s. There are various performance levels within each KPI category; below target, on-target, and above target. The individual category scores are weighted and combined to determine the Chief Executive Performance Factor (CEPF). On-target performance is an STI equivalent to 45% of Base Salary, with a maximum of 65% of Base Salary for exceptional performance.
The Chief Executive participates in the Employee Share Purchase Scheme.
APPOINTED BOARD FEES
$
ARF COMMITTEE
FEES $
PNR COMMITTEE
FEES
$
INDEPENDENT DIRECTORS
COMMITTEE FEES
$
HSEO COMMITTEE
FEES $
TOTAL FEES
$
S C Allen Independent Chairman 4 Dec 2014 180,000 180,000
D C Boffa BP 23 Aug 2017 75,000 3,616 78,616
R Cavallo Mobil 12 Apr 2017 75,000 75,000
L Jones Z Energy 19 Mar 2018 75,000 9,041 84,041
J Miller Independent 1 Nov 2018 75,000 27,083 20,000 122,083
V C M Stoddart Independent 20 May 2013 75,000 20,000 20,000 115,000
M Tume* Independent 1 Aug 2007 10,685 4,274 2,849 17,808
P A Zealand Independent 29 Aug 2016 75,000 12,500 5,000 20,000 10,000 122,500
*M Tume resigned as Independent Director effective 21 February 2019.
Five year summary – Chief Executive Remuneration
FINANCIAL YEAR
CEO BASE SALARY
OTHER SUBTOTAL PAY FOR PERFORMANCE (STI)
STI AGAINST MAXIMUM
TOTAL REMUNERATION
$000 $000 $000 $000 $000 % $000
FY2019 Mike Fuge 900 32 932 - - - 932
FY2018 Mike Fuge(from 27 August 2018)
316 61 377 165 - 81 542
FY2018 Sjoerd Post (to 31 August 2018)
705 37 742 300 300 98 1,342
FY2017 Sjoerd Post 982 45 1,027 405 150 94 1,582
FY2016 Sjoerd Post 958 41 999 540 - 93 1,539
FY2015 Sjoerd Post 940 41 981 438 - 78 1,419
KPI BASED DISCRETIONARY
REFINING NZ ANNUAL REPORT 201946 47
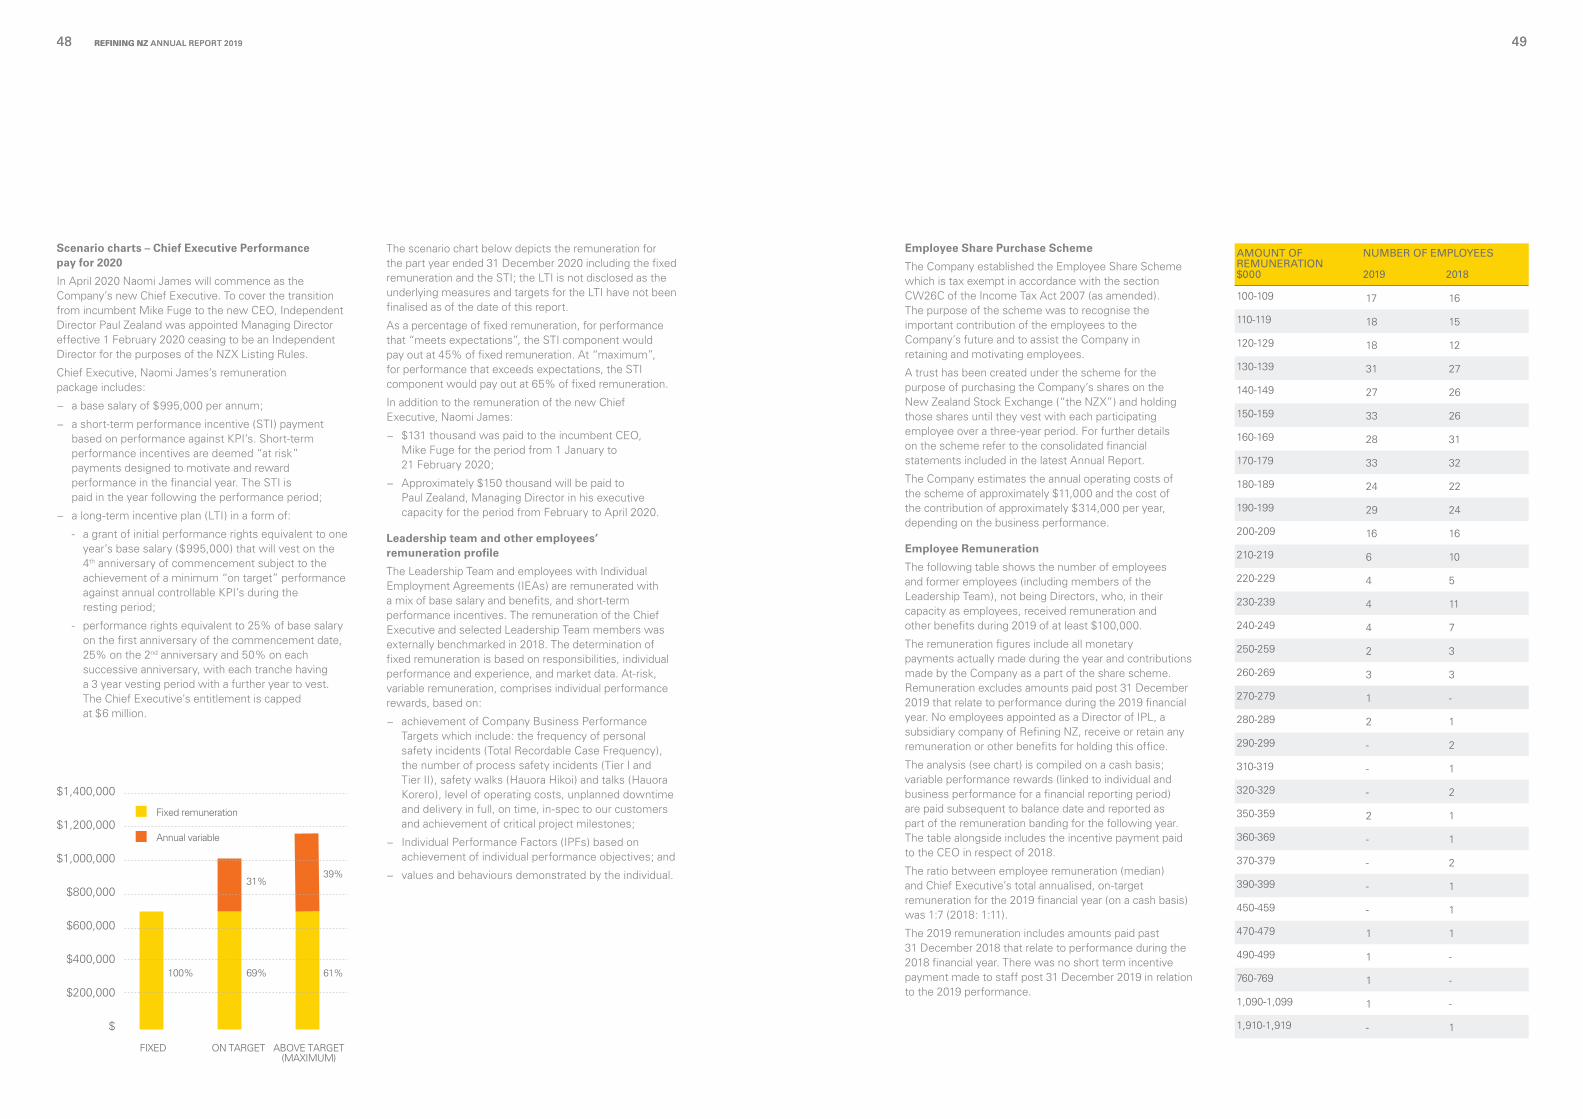
Scenario charts – Chief Executive Performance pay for 2020
In April 2020 Naomi James will commence as the Company’s new Chief Executive. To cover the transition from incumbent Mike Fuge to the new CEO, Independent Director Paul Zealand was appointed Managing Director effective 1 February 2020 ceasing to be an Independent Director for the purposes of the NZX Listing Rules.
Chief Executive, Naomi James’s remuneration package includes:
− a base salary of $995,000 per annum;
− a short-term performance incentive (STI) payment based on performance against KPI’s. Short-term performance incentives are deemed “at risk” payments designed to motivate and reward performance in the financial year. The STI is paid in the year following the performance period;
− a long-term incentive plan (LTI) in a form of:
- a grant of initial performance rights equivalent to one year’s base salary ($995,000) that will vest on the 4th anniversary of commencement subject to the achievement of a minimum “on target” performance against annual controllable KPI’s during the resting period;
- performance rights equivalent to 25% of base salary on the first anniversary of the commencement date, 25% on the 2nd anniversary and 50% on each successive anniversary, with each tranche having a 3 year vesting period with a further year to vest. The Chief Executive’s entitlement is capped at $6 million.
Employee Share Purchase Scheme
The Company established the Employee Share Scheme which is tax exempt in accordance with the section CW26C of the Income Tax Act 2007 (as amended). The purpose of the scheme was to recognise the important contribution of the employees to the Company’s future and to assist the Company in retaining and motivating employees.
A trust has been created under the scheme for the purpose of purchasing the Company’s shares on the New Zealand Stock Exchange (“the NZX”) and holding those shares until they vest with each participating employee over a three-year period. For further details on the scheme refer to the consolidated financial statements included in the latest Annual Report.
The Company estimates the annual operating costs of the scheme of approximately $11,000 and the cost of the contribution of approximately $314,000 per year, depending on the business performance.
Employee Remuneration
The following table shows the number of employees and former employees (including members of the Leadership Team), not being Directors, who, in their capacity as employees, received remuneration and other benefits during 2019 of at least $100,000.
The remuneration figures include all monetary payments actually made during the year and contributions made by the Company as a part of the share scheme. Remuneration excludes amounts paid post 31 December 2019 that relate to performance during the 2019 financial year. No employees appointed as a Director of IPL, a subsidiary company of Refining NZ, receive or retain any remuneration or other benefits for holding this office.
The analysis (see chart) is compiled on a cash basis; variable performance rewards (linked to individual and business performance for a financial reporting period) are paid subsequent to balance date and reported as part of the remuneration banding for the following year. The table alongside includes the incentive payment paid to the CEO in respect of 2018.
The ratio between employee remuneration (median) and Chief Executive’s total annualised, on-target remuneration for the 2019 financial year (on a cash basis) was 1:7 (2018: 1:11).
The 2019 remuneration includes amounts paid past 31 December 2018 that relate to performance during the 2018 financial year. There was no short term incentive payment made to staff post 31 December 2019 in relation to the 2019 performance.
The scenario chart below depicts the remuneration for the part year ended 31 December 2020 including the fixed remuneration and the STI; the LTI is not disclosed as the underlying measures and targets for the LTI have not been finalised as of the date of this report.
As a percentage of fixed remuneration, for performance that “meets expectations”, the STI component would pay out at 45% of fixed remuneration. At “maximum”, for performance that exceeds expectations, the STI component would pay out at 65% of fixed remuneration.
In addition to the remuneration of the new Chief Executive, Naomi James:
− $131 thousand was paid to the incumbent CEO, Mike Fuge for the period from 1 January to 21 February 2020;
− Approximately $150 thousand will be paid to Paul Zealand, Managing Director in his executive capacity for the period from February to April 2020.
Leadership team and other employees’ remuneration profile
The Leadership Team and employees with Individual Employment Agreements (IEAs) are remunerated with a mix of base salary and benefits, and short-term performance incentives. The remuneration of the Chief Executive and selected Leadership Team members was externally benchmarked in 2018. The determination of fixed remuneration is based on responsibilities, individual performance and experience, and market data. At-risk, variable remuneration, comprises individual performance rewards, based on:
− achievement of Company Business Performance Targets which include: the frequency of personal safety incidents (Total Recordable Case Frequency), the number of process safety incidents (Tier I and Tier II), safety walks (Hauora Hikoi) and talks (Hauora Korero), level of operating costs, unplanned downtime and delivery in full, on time, in-spec to our customers and achievement of critical project milestones;
− Individual Performance Factors (IPFs) based on achievement of individual performance objectives; and
− values and behaviours demonstrated by the individual.
AMOUNT OF REMUNERATION $000
NUMBER OF EMPLOYEES
2019 2018
100-109 17 16
110-119 18 15
120-129 18 12
130-139 31 27
140-149 27 26
150-159 33 26
160-169 28 31
170-179 33 32
180-189 24 22
190-199 29 24
200-209 16 16
210-219 6 10
220-229 4 5
230-239 4 11
240-249 4 7
250-259 2 3
260-269 3 3
270-279 1 -
280-289 2 1
290-299 - 2
310-319 - 1
320-329 - 2
350-359 2 1
360-369 - 1
370-379 - 2
390-399 - 1
450-459 - 1
470-479 1 1
490-499 1 -
760-769 1 -
1,090-1,099 1 -
1,910-1,919 - 1
ON TARGETFIXED
100% 69%
31%
ABOVE TARGET(MAXIMUM)
61%
39%
$1,400,000
$1,200,000
$1,000,000
$800,000
$600,000
$400,000
$200,000
$
Fixed remuneration
Annual variable
REFINING NZ ANNUAL REPORT 201948 49REFINING NZ ANNUAL REPORT 201948 49
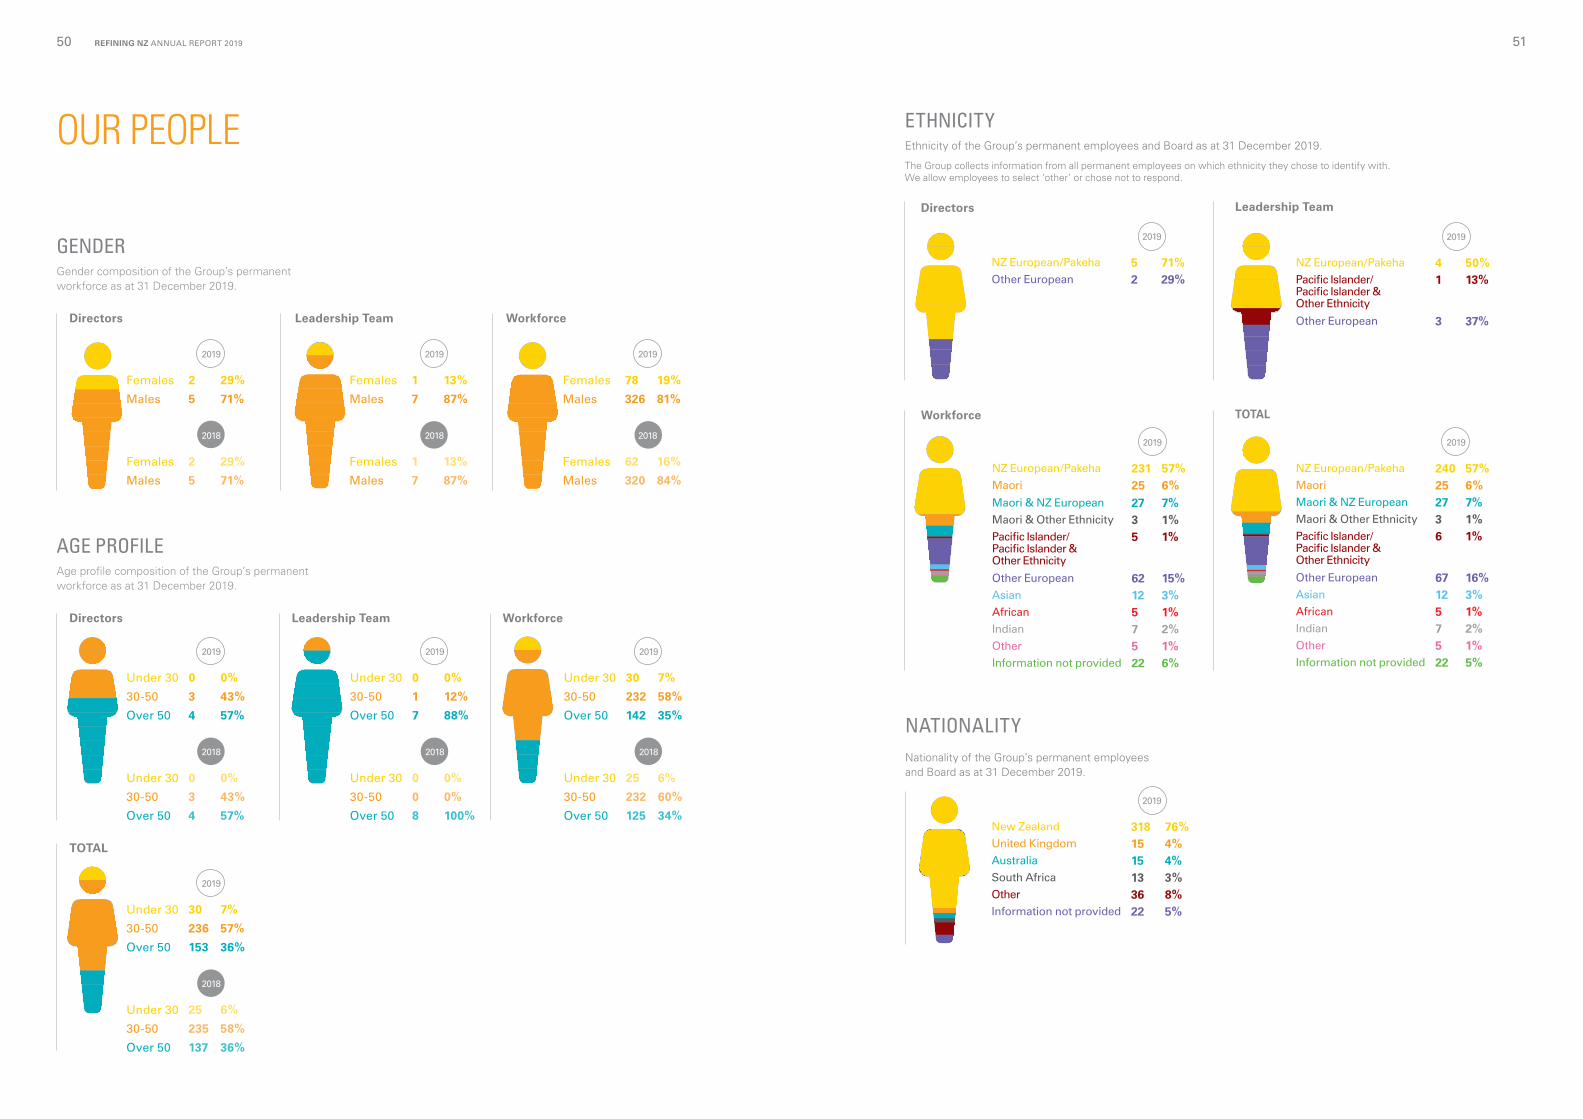
Workforce TOTAL
ETHNICITYEthnicity of the Group’s permanent employees and Board as at 31 December 2019.
The Group collects information from all permanent employees on which ethnicity they chose to identify with. We allow employees to select ‘other’ or chose not to respond.
NATIONALITYNationality of the Group’s permanent employees and Board as at 31 December 2019.
GENDER Gender composition of the Group’s permanent workforce as at 31 December 2019.
Directors
Directors
Leadership Team
Leadership Team Workforce
Workforce
AGE PROFILEAge profile composition of the Group’s permanent workforce as at 31 December 2019.
TOTAL
2019
Females 2 29%
Males 5 71%
2018
Females 2 29%
Males 5 71%
2019
Under 30 0 0%
30-50 3 43%
Over 50 4 57%
2018
Under 30 0 0%
30-50 3 43%
Over 50 4 57%
2019
Under 30 0 0%
30-50 1 12%
Over 50 7 88%
2018
Under 30 0 0%
30-50 0 0%
Over 50 8 100%
2019
Under 30 30 7%
30-50 232 58%
Over 50 142 35%
2018
Under 30 25 6%
30-50 232 60%
Over 50 125 34%
2019
Under 30 30 7%
30-50 236 57%
Over 50 153 36%
2018
Under 30 25 6%
30-50 235 58%
Over 50 137 36%
2019
Females 1 13%
Males 7 87%
2018
Females 1 13%
Males 7 87%
2019
Females 78 19%
Males 326 81%
2018
Females 62 16%
Males 320 84%
2019
NZ European/Pakeha 231 57%Maori 25 6%Maori & NZ European 27 7%Maori & Other Ethnicity 3 1%Pacific Islander/ Pacific Islander & Other Ethnicity
5 1%
Other European 62 15%Asian 12 3%African 5 1%Indian 7 2%Other 5 1%Information not provided 22 6%
2019
New Zealand 318 76%United Kingdom 15 4%Australia 15 4%South Africa 13 3%Other 36 8%Information not provided 22 5%
2019
NZ European/Pakeha 240 57%Maori 25 6%Maori & NZ European 27 7%Maori & Other Ethnicity 3 1%Pacific Islander/ Pacific Islander & Other Ethnicity
6 1%
Other European 67 16%Asian 12 3%African 5 1%Indian 7 2%Other 5 1%Information not provided 22 5%
OUR PEOPLE
Directors
2019
NZ European/Pakeha 5 71%Other European 2 29%
Leadership Team
2019
NZ European/Pakeha 4 50%Pacific Islander/ Pacific Islander & Other Ethnicity
1 13%
Other European 3 37%
REFINING NZ ANNUAL REPORT 201950 51
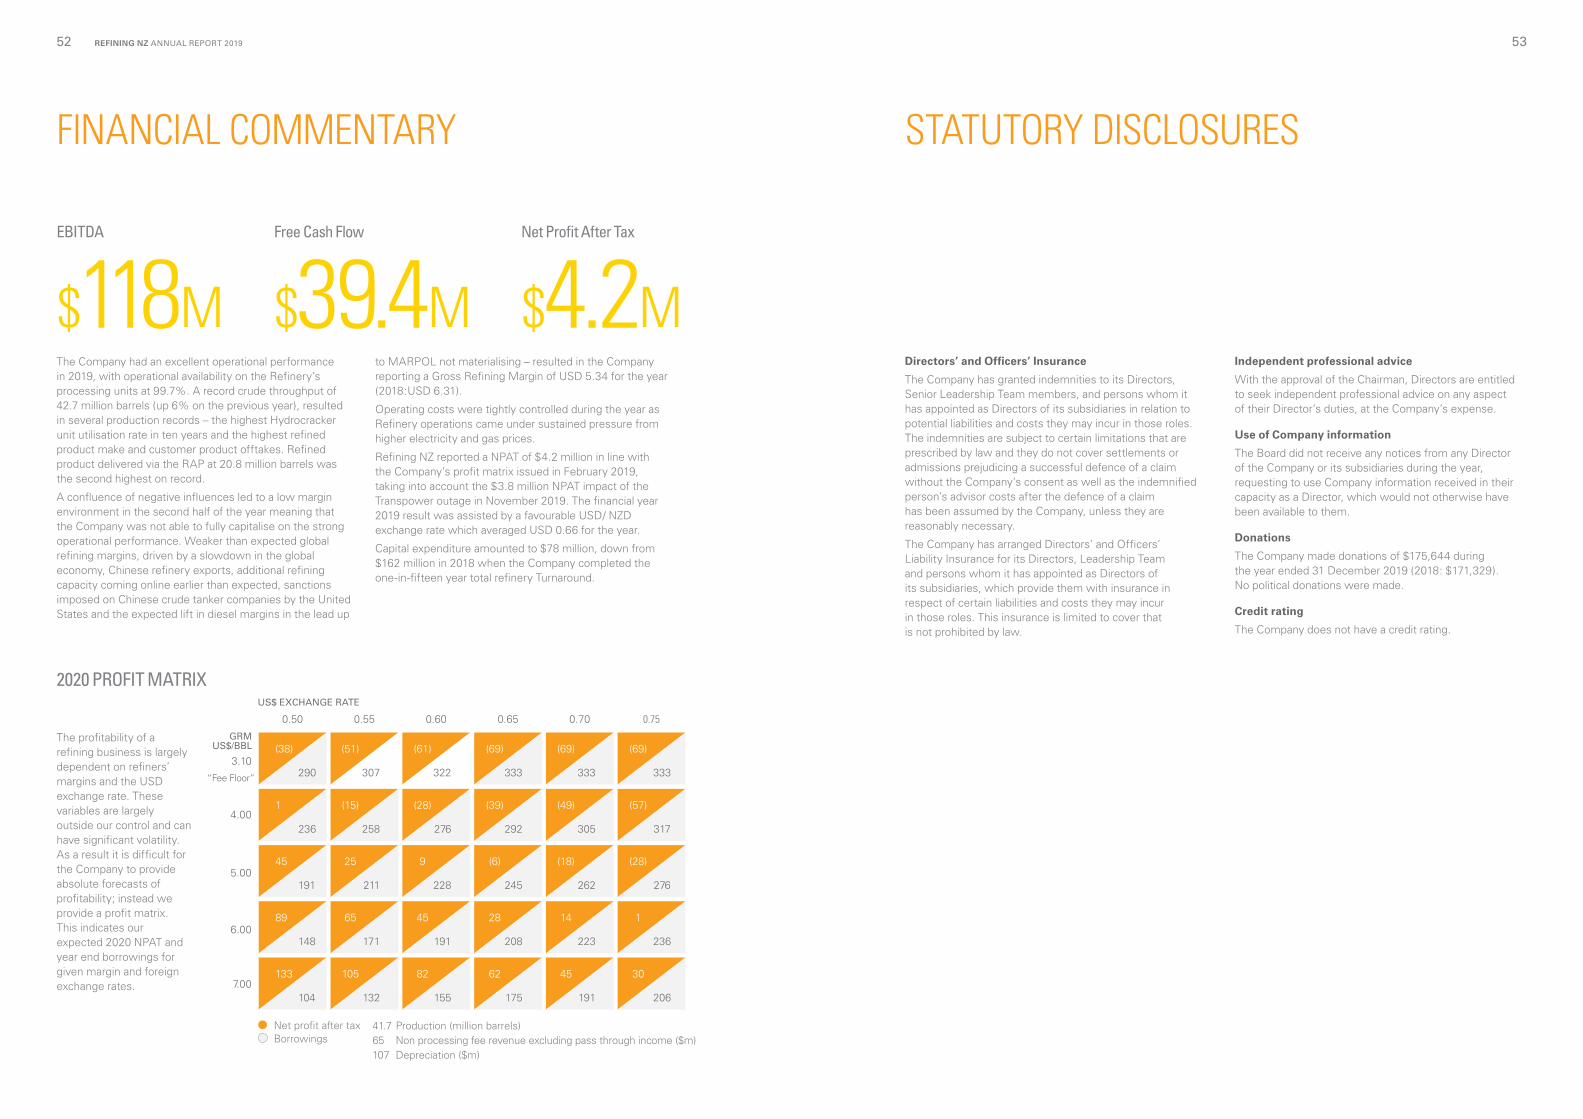
STATUTORY DISCLOSURESFINANCIAL COMMENTARY
Directors’ and Officers’ Insurance
The Company has granted indemnities to its Directors, Senior Leadership Team members, and persons whom it has appointed as Directors of its subsidiaries in relation to potential liabilities and costs they may incur in those roles. The indemnities are subject to certain limitations that are prescribed by law and they do not cover settlements or admissions prejudicing a successful defence of a claim without the Company’s consent as well as the indemnified person’s advisor costs after the defence of a claim has been assumed by the Company, unless they are reasonably necessary.
The Company has arranged Directors’ and Officers’ Liability Insurance for its Directors, Leadership Team and persons whom it has appointed as Directors of its subsidiaries, which provide them with insurance in respect of certain liabilities and costs they may incur in those roles. This insurance is limited to cover that is not prohibited by law.
Independent professional advice
With the approval of the Chairman, Directors are entitled to seek independent professional advice on any aspect of their Director’s duties, at the Company’s expense.
Use of Company information
The Board did not receive any notices from any Director of the Company or its subsidiaries during the year, requesting to use Company information received in their capacity as a Director, which would not otherwise have been available to them.
Donations
The Company made donations of $175,644 during the year ended 31 December 2019 (2018: $171,329). No political donations were made.
Credit rating
The Company does not have a credit rating.
The Company had an excellent operational performance in 2019, with operational availability on the Refinery’s processing units at 99.7%. A record crude throughput of 42.7 million barrels (up 6% on the previous year), resulted in several production records – the highest Hydrocracker unit utilisation rate in ten years and the highest refined product make and customer product offtakes. Refined product delivered via the RAP at 20.8 million barrels was the second highest on record.
A confluence of negative influences led to a low margin environment in the second half of the year meaning that the Company was not able to fully capitalise on the strong operational performance. Weaker than expected global refining margins, driven by a slowdown in the global economy, Chinese refinery exports, additional refining capacity coming online earlier than expected, sanctions imposed on Chinese crude tanker companies by the United States and the expected lift in diesel margins in the lead up
US$ EXCHANGE RATE
GRM US$/BBL
4.00
3.10
“Fee Floor”
5.00
6.00
7.00
0.50 0.600.55 0.65 0.70 0.75
41.7 Production (million barrels)65 Non processing fee revenue excluding pass through income ($m)107 Depreciation ($m)
Net profit after taxBorrowings
(38) (51) (61) (69) (69) (69)
290 307 322 333 333 333
1 (15) (28) (39) (49) (57)
236 258 276 292 305 317
45 25 9 (6) (18) (28)
191 211 228 245 262 276
89 65 45 28 14 1
148 171 191 208 223 236
133 105 82 62 45 30
104 132 155 175 191 206
to MARPOL not materialising – resulted in the Company reporting a Gross Refining Margin of USD 5.34 for the year (2018:USD 6.31).
Operating costs were tightly controlled during the year as Refinery operations came under sustained pressure from higher electricity and gas prices.
Refining NZ reported a NPAT of $4.2 million in line with the Company’s profit matrix issued in February 2019, taking into account the $3.8 million NPAT impact of the Transpower outage in November 2019. The financial year 2019 result was assisted by a favourable USD/ NZD exchange rate which averaged USD 0.66 for the year.
Capital expenditure amounted to $78 million, down from $162 million in 2018 when the Company completed the one-in-fifteen year total refinery Turnaround.
2020 PROFIT MATRIX
EBITDA Free Cash Flow Net Profit After Tax
$118M $39.4M $4.2M
The profitability of a refining business is largely dependent on refiners’ margins and the USD exchange rate. These variables are largely outside our control and can have significant volatility. As a result it is difficult for the Company to provide absolute forecasts of profitability; instead we provide a profit matrix. This indicates our expected 2020 NPAT and year end borrowings for given margin and foreign exchange rates.
REFINING NZ ANNUAL REPORT 201952 53
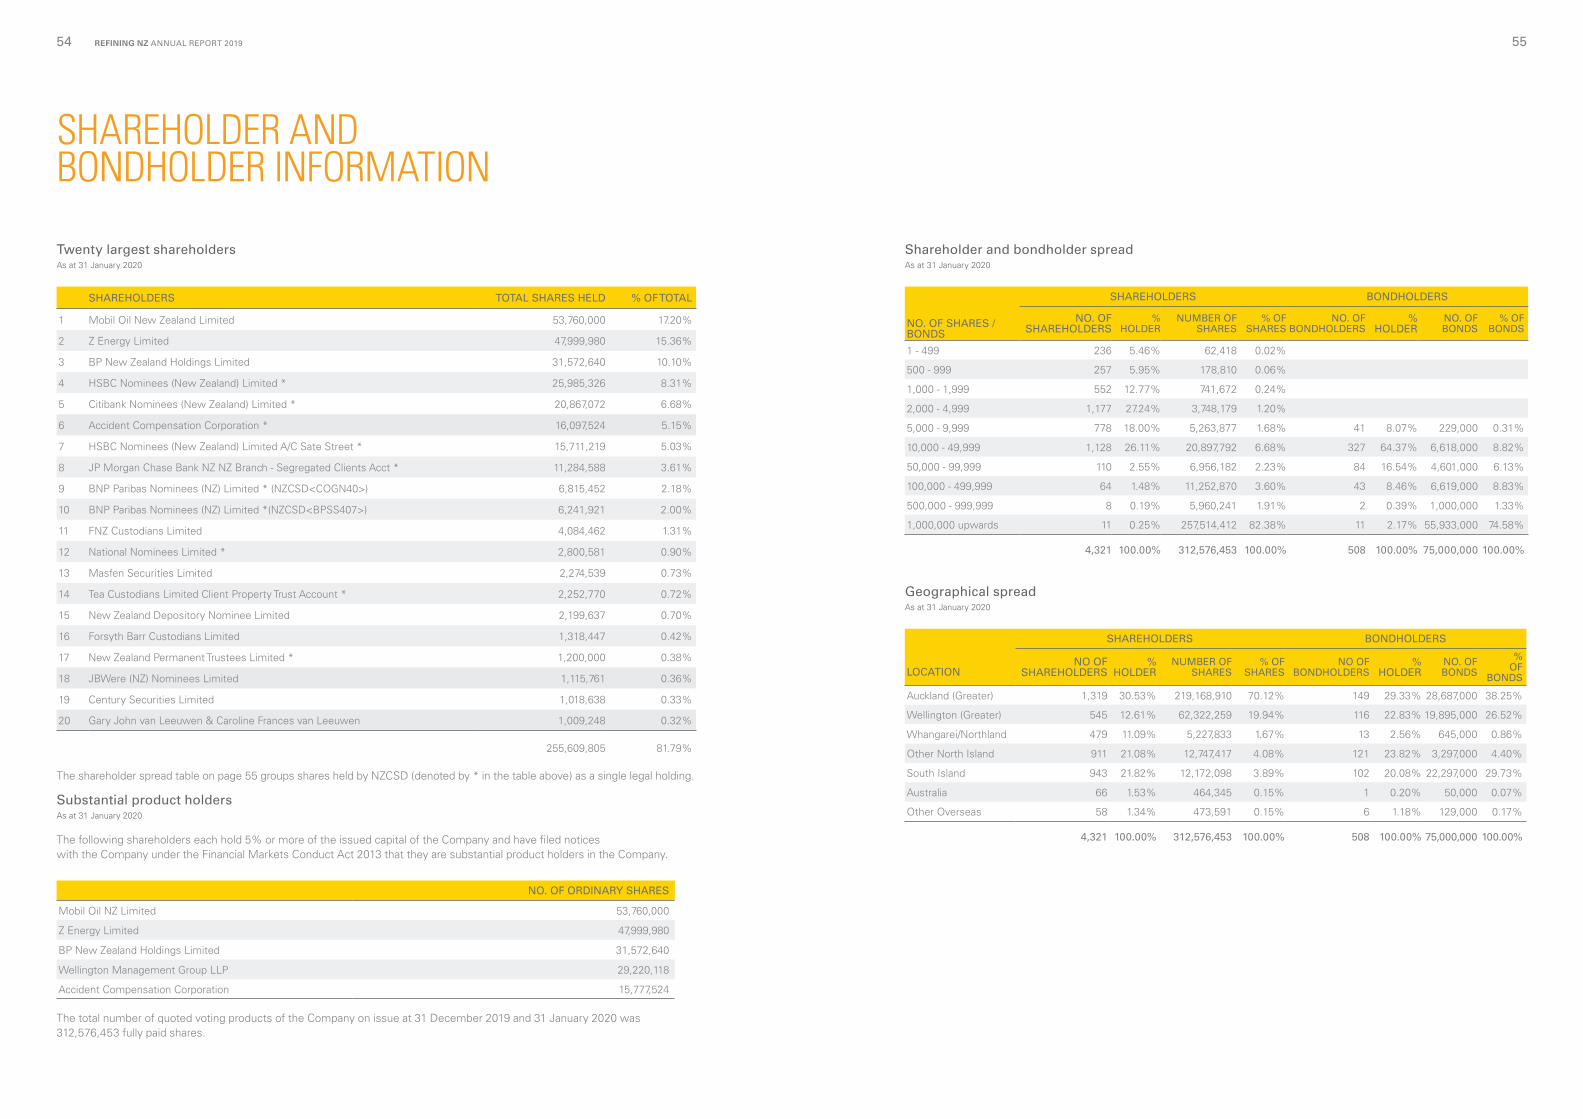
Twenty largest shareholdersAs at 31 January 2020
]\-[=’]’-’
SHAREHOLDERS TOTAL SHARES HELD % OF TOTAL
1 Mobil Oil New Zealand Limited 53,760,000 17.20%
2 Z Energy Limited 47,999,980 15.36%
3 BP New Zealand Holdings Limited 31,572,640 10.10%
4 HSBC Nominees (New Zealand) Limited * 25,985,326 8.31%
5 Citibank Nominees (New Zealand) Limited * 20,867,072 6.68%
6 Accident Compensation Corporation * 16,097,524 5.15%
7 HSBC Nominees (New Zealand) Limited A/C Sate Street * 15,711,219 5.03%
8 JP Morgan Chase Bank NZ NZ Branch - Segregated Clients Acct * 11,284,588 3.61%
9 BNP Paribas Nominees (NZ) Limited * (NZCSD<COGN40>) 6,815,452 2.18%
10 BNP Paribas Nominees (NZ) Limited *(NZCSD<BPSS407>) 6,241,921 2.00%
11 FNZ Custodians Limited 4,084,462 1.31%
12 National Nominees Limited * 2,800,581 0.90%
13 Masfen Securities Limited 2,274,539 0.73%
14 Tea Custodians Limited Client Property Trust Account * 2,252,770 0.72%
15 New Zealand Depository Nominee Limited 2,199,637 0.70%
16 Forsyth Barr Custodians Limited 1,318,447 0.42%
17 New Zealand Permanent Trustees Limited * 1,200,000 0.38%
18 JBWere (NZ) Nominees Limited 1,115,761 0.36%
19 Century Securities Limited 1,018,638 0.33%
20 Gary John van Leeuwen & Caroline Frances van Leeuwen 1,009,248 0.32%
255,609,805 81.79%
The shareholder spread table on page 55 groups shares held by NZCSD (denoted by * in the table above) as a single legal holding.
Substantial product holdersAs at 31 January 2020
The following shareholders each hold 5% or more of the issued capital of the Company and have filed notices with the Company under the Financial Markets Conduct Act 2013 that they are substantial product holders in the Company.
NO. OF ORDINARY SHARES
Mobil Oil NZ Limited 53,760,000
Z Energy Limited 47,999,980
BP New Zealand Holdings Limited 31,572,640
Wellington Management Group LLP 29,220,118
Accident Compensation Corporation 15,777,524
The total number of quoted voting products of the Company on issue at 31 December 2019 and 31 January 2020 was 312,576,453 fully paid shares.
Shareholder and bondholder spreadAs at 31 January 2020
SHAREHOLDERS BONDHOLDERS
NO. OF SHARES / BONDS
NO. OF SHAREHOLDERS
% HOLDER
NUMBER OF SHARES
% OF SHARES
NO. OF BONDHOLDERS
% HOLDER
NO. OF BONDS
% OF BONDS
1 - 499 236 5.46% 62,418 0.02%
500 - 999 257 5.95% 178,810 0.06%
1,000 - 1,999 552 12.77% 741,672 0.24%
2,000 - 4,999 1,177 27.24% 3,748,179 1.20%
5,000 - 9,999 778 18.00% 5,263,877 1.68% 41 8.07% 229,000 0.31%
10,000 - 49,999 1,128 26.11% 20,897,792 6.68% 327 64.37% 6,618,000 8.82%
50,000 - 99,999 110 2.55% 6,956,182 2.23% 84 16.54% 4,601,000 6.13%
100,000 - 499,999 64 1.48% 11,252,870 3.60% 43 8.46% 6,619,000 8.83%
500,000 - 999,999 8 0.19% 5,960,241 1.91% 2 0.39% 1,000,000 1.33%
1,000,000 upwards 11 0.25% 257,514,412 82.38% 11 2.17% 55,933,000 74.58%
4,321 100.00% 312,576,453 100.00% 508 100.00% 75,000,000 100.00%
Geographical spreadAs at 31 January 2020
SHAREHOLDERS BONDHOLDERS
LOCATIONNO OF
SHAREHOLDERS%
HOLDERNUMBER OF
SHARES% OF
SHARES NO OF
BONDHOLDERS%
HOLDERNO. OF BONDS
% OF
BONDS
Auckland (Greater) 1,319 30.53% 219,168,910 70.12% 149 29.33% 28,687,000 38.25%
Wellington (Greater) 545 12.61% 62,322,259 19.94% 116 22.83% 19,895,000 26.52%
Whangarei/Northland 479 11.09% 5,227,833 1.67% 13 2.56% 645,000 0.86%
Other North Island 911 21.08% 12,747,417 4.08% 121 23.82% 3,297,000 4.40%
South Island 943 21.82% 12,172,098 3.89% 102 20.08% 22,297,000 29.73%
Australia 66 1.53% 464,345 0.15% 1 0.20% 50,000 0.07%
Other Overseas 58 1.34% 473,591 0.15% 6 1.18% 129,000 0.17%
4,321 100.00% 312,576,453 100.00% 508 100.00% 75,000,000 100.00%
SHAREHOLDER AND BONDHOLDER INFORMATION
REFINING NZ ANNUAL REPORT 201954 55
PAGE
Group Financial Statements
Consolidated Income Statement 58 The income earned and operating expenditure incurred by the Refining NZ Group during the financial year
Consolidated Statement of Comprehensive Income 59 Items of income and operating expense not recognised in the income statement and hence taken to reserves in equity
Consolidated Balance Sheet 60 A summary of the Refining NZ Group assets and liabilities at the end of the financial year
Consolidated Statement of Changes in Equity 62 Components that make up the capital and reserves of the Refining NZ Group and the changes of each component during the financial year
Consolidated Statement of Cash Flows 64 Cash generated and used by the Refining NZ Group during the financial year
Notes to the Consolidated Financial Statements 65
PERFORMANCE 69
DEBT AND EQUITY 80
OPERATING ASSETS AND LIABILITIES 86
FINANCIAL RISK MANAGEMENT 103
OTHER 111
Independent Auditor’s Report 114
Consolidated Financial StatementsFOR THE YEAR ENDED 31 DECEMBER 2019THE
NUMBERS
REFINING NZ ANNUAL REPORT 201956 57
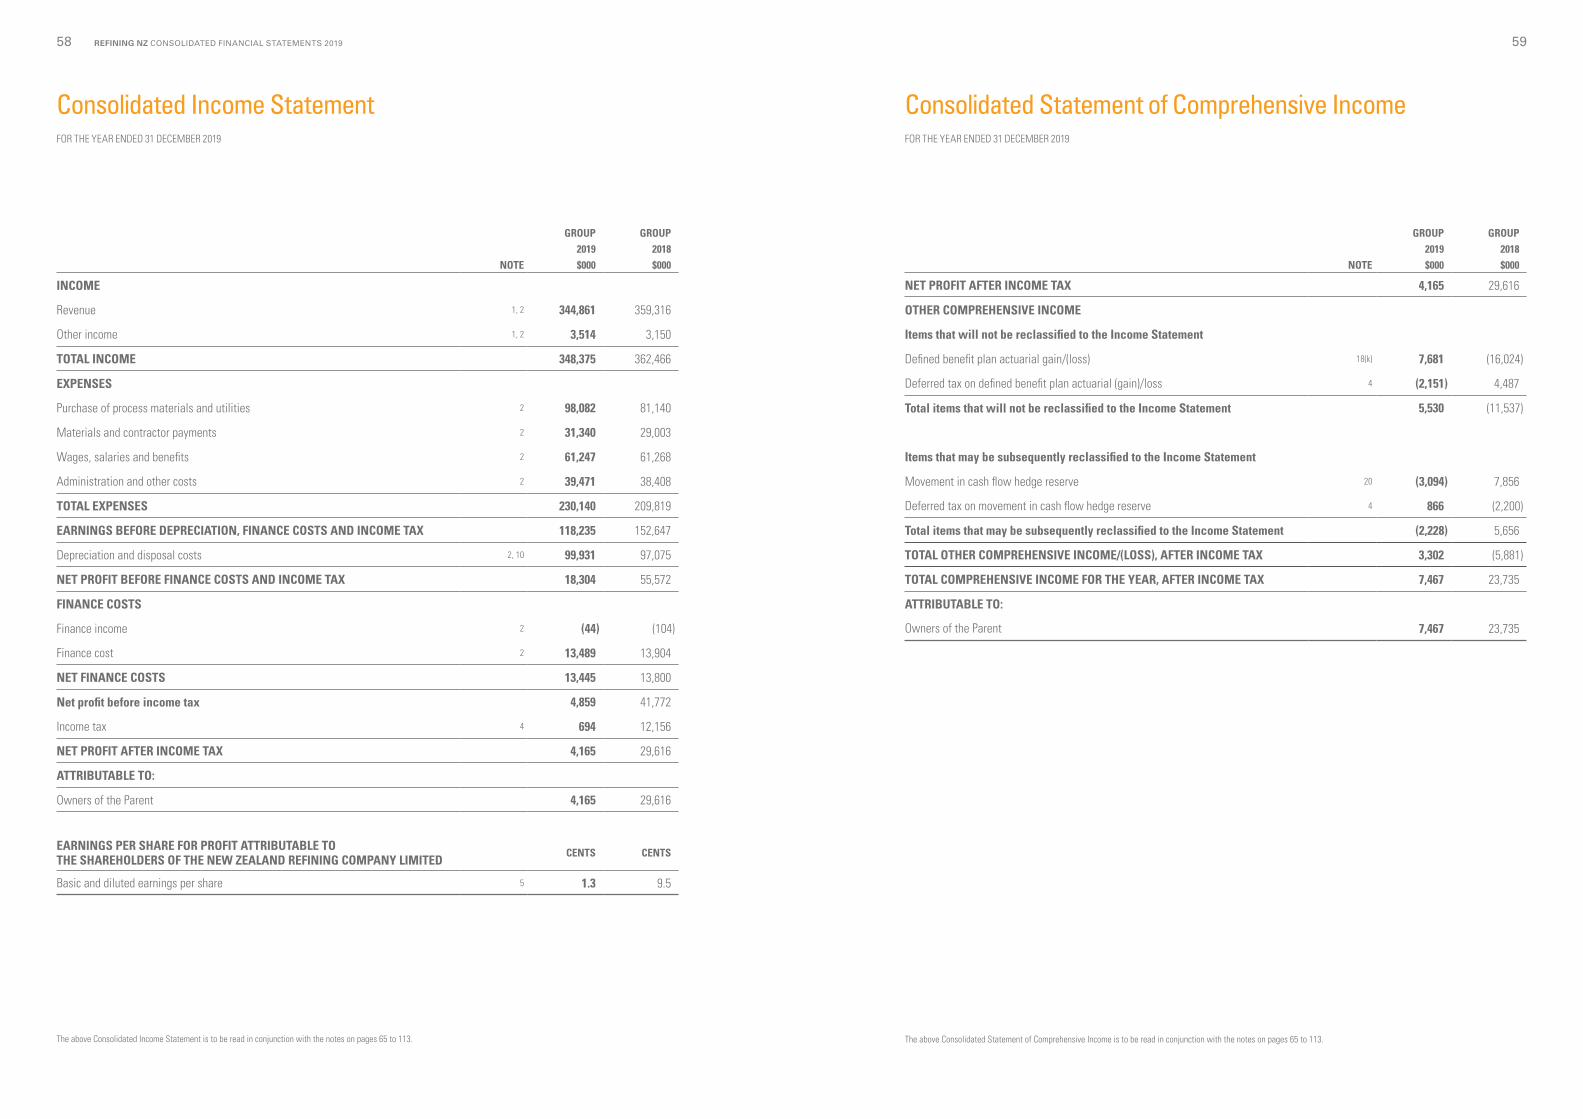
Consolidated Statement of Comprehensive IncomeFOR THE YEAR ENDED 31 DECEMBER 2019
Consolidated Income StatementFOR THE YEAR ENDED 31 DECEMBER 2019
GROUP GROUP2019 2018
NOTE $000 $000
INCOME
Revenue 1, 2 344,861 359,316
Other income 1, 2 3,514 3,150
TOTAL INCOME 348,375 362,466
EXPENSES
Purchase of process materials and utilities 2 98,082 81,140
Materials and contractor payments 2 31,340 29,003
Wages, salaries and benefits 2 61,247 61,268
Administration and other costs 2 39,471 38,408
TOTAL EXPENSES 230,140 209,819
EARNINGS BEFORE DEPRECIATION, FINANCE COSTS AND INCOME TAX 118,235 152,647
Depreciation and disposal costs 2, 10 99,931 97,075
NET PROFIT BEFORE FINANCE COSTS AND INCOME TAX 18,304 55,572
FINANCE COSTS
Finance income 2 (44) (104)
Finance cost 2 13,489 13,904
NET FINANCE COSTS 13,445 13,800
Net profit before income tax 4,859 41,772
Income tax 4 694 12,156
NET PROFIT AFTER INCOME TAX 4,165 29,616
ATTRIBUTABLE TO:
Owners of the Parent 4,165 29,616
EARNINGS PER SHARE FOR PROFIT ATTRIBUTABLE TO THE SHAREHOLDERS OF THE NEW ZEALAND REFINING COMPANY LIMITED
CENTS CENTS
Basic and diluted earnings per share 5 1.3 9.5
The above Consolidated Income Statement is to be read in conjunction with the notes on pages 65 to 113.
GROUP GROUP2019 2018
NOTE $000 $000
NET PROFIT AFTER INCOME TAX 4,165 29,616
OTHER COMPREHENSIVE INCOME
Items that will not be reclassified to the Income Statement
Defined benefit plan actuarial gain/(loss) 18(k) 7,681 (16,024)
Deferred tax on defined benefit plan actuarial (gain)/loss 4 (2,151) 4,487
Total items that will not be reclassified to the Income Statement 5,530 (11,537)
Items that may be subsequently reclassified to the Income Statement
Movement in cash flow hedge reserve 20 (3,094) 7,856
Deferred tax on movement in cash flow hedge reserve 4 866 (2,200)
Total items that may be subsequently reclassified to the Income Statement (2,228) 5,656
TOTAL OTHER COMPREHENSIVE INCOME/(LOSS), AFTER INCOME TAX 3,302 (5,881)
TOTAL COMPREHENSIVE INCOME FOR THE YEAR, AFTER INCOME TAX 7,467 23,735
ATTRIBUTABLE TO:
Owners of the Parent 7,467 23,735
The above Consolidated Statement of Comprehensive Income is to be read in conjunction with the notes on pages 65 to 113.
REFINING NZ CONSOLIDATED FINANCIAL STATEMENTS 201958 59
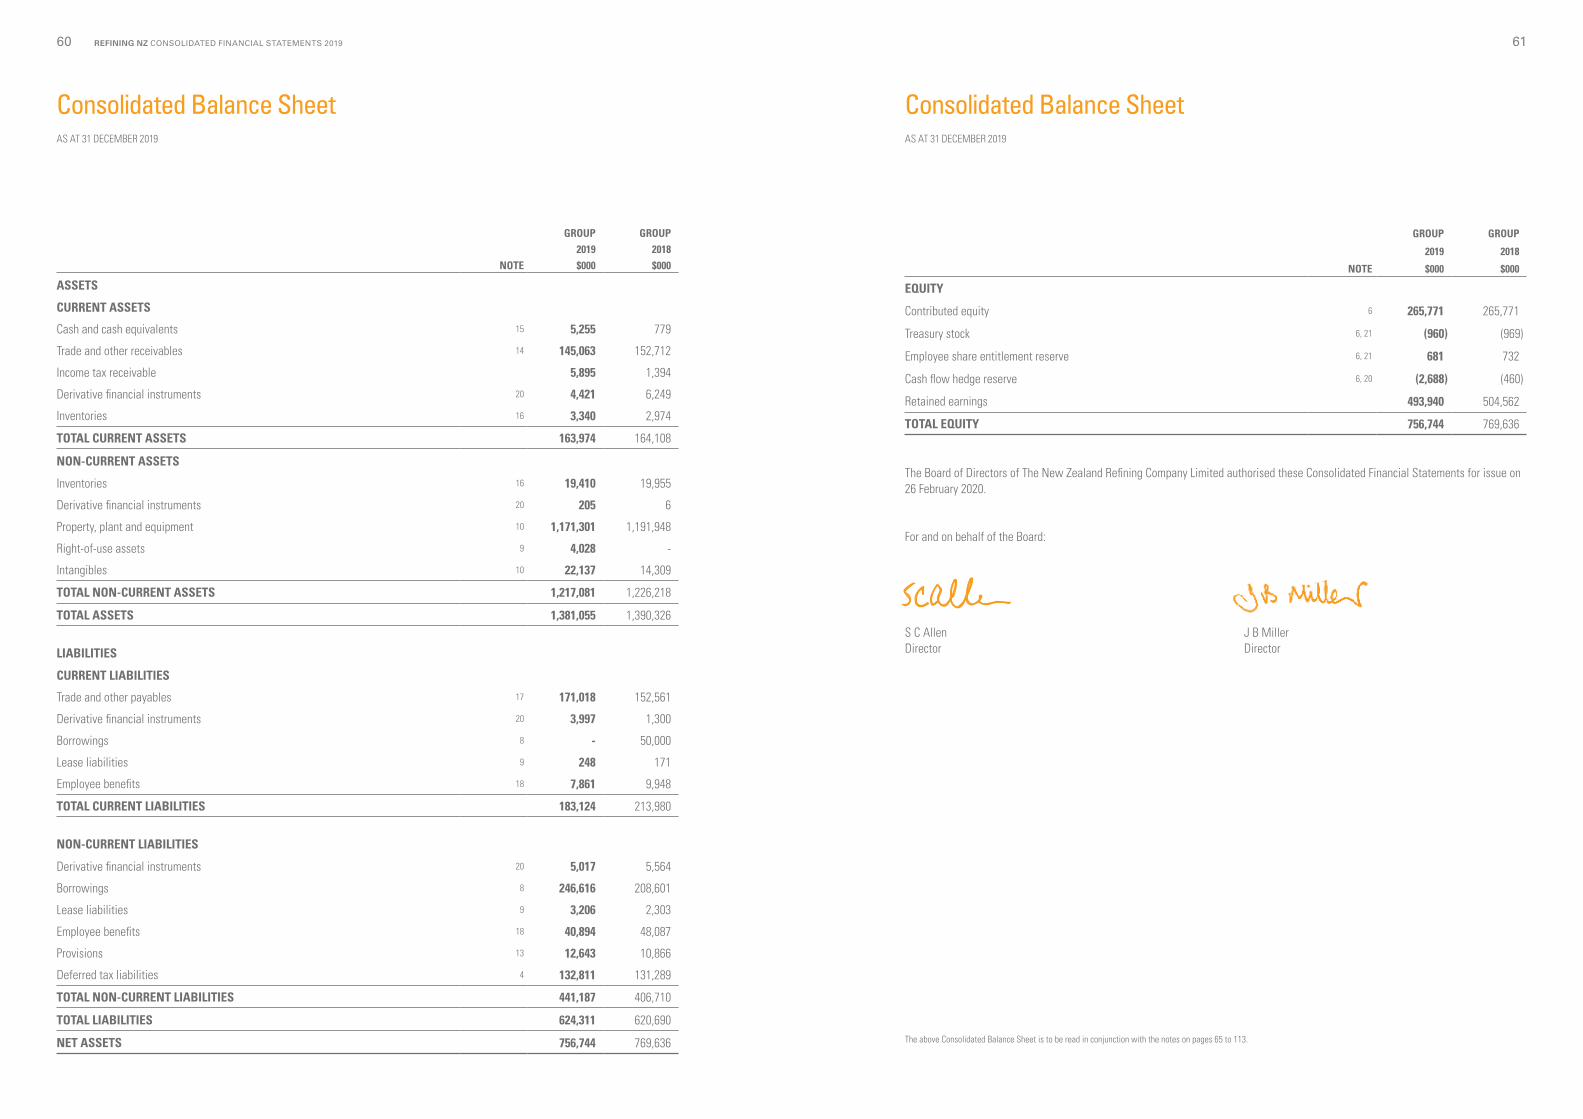
Consolidated Balance SheetAS AT 31 DECEMBER 2019
GROUP GROUP2019 2018
NOTE $000 $000
ASSETS
CURRENT ASSETS
Cash and cash equivalents 15 5,255 779
Trade and other receivables 14 145,063 152,712
Income tax receivable 5,895 1,394
Derivative financial instruments 20 4,421 6,249
Inventories 16 3,340 2,974
TOTAL CURRENT ASSETS 163,974 164,108
NON-CURRENT ASSETS
Inventories 16 19,410 19,955
Derivative financial instruments 20 205 6
Property, plant and equipment 10 1,171,301 1,191,948
Right-of-use assets 9 4,028 -
Intangibles 10 22,137 14,309
TOTAL NON-CURRENT ASSETS 1,217,081 1,226,218
TOTAL ASSETS 1,381,055 1,390,326
LIABILITIES
CURRENT LIABILITIES
Trade and other payables 17 171,018 152,561
Derivative financial instruments 20 3,997 1,300
Borrowings 8 - 50,000
Lease liabilities 9 248 171
Employee benefits 18 7,861 9,948
TOTAL CURRENT LIABILITIES 183,124 213,980
NON-CURRENT LIABILITIES
Derivative financial instruments 20 5,017 5,564
Borrowings 8 246,616 208,601
Lease liabilities 9 3,206 2,303
Employee benefits 18 40,894 48,087
Provisions 13 12,643 10,866
Deferred tax liabilities 4 132,811 131,289
TOTAL NON-CURRENT LIABILITIES 441,187 406,710
TOTAL LIABILITIES 624,311 620,690
NET ASSETS 756,744 769,636 The above Consolidated Balance Sheet is to be read in conjunction with the notes on pages 65 to 113.
GROUP GROUP
2019 2018
NOTE $000 $000
EQUITY
Contributed equity 6 265,771 265,771
Treasury stock 6, 21 (960) (969)
Employee share entitlement reserve 6, 21 681 732
Cash flow hedge reserve 6, 20 (2,688) (460)
Retained earnings 493,940 504,562
TOTAL EQUITY 756,744 769,636
The Board of Directors of The New Zealand Refining Company Limited authorised these Consolidated Financial Statements for issue on 26 February 2020.
For and on behalf of the Board: S C Allen J B MillerDirector Director
Consolidated Balance SheetAS AT 31 DECEMBER 2019
REFINING NZ CONSOLIDATED FINANCIAL STATEMENTS 201960 61
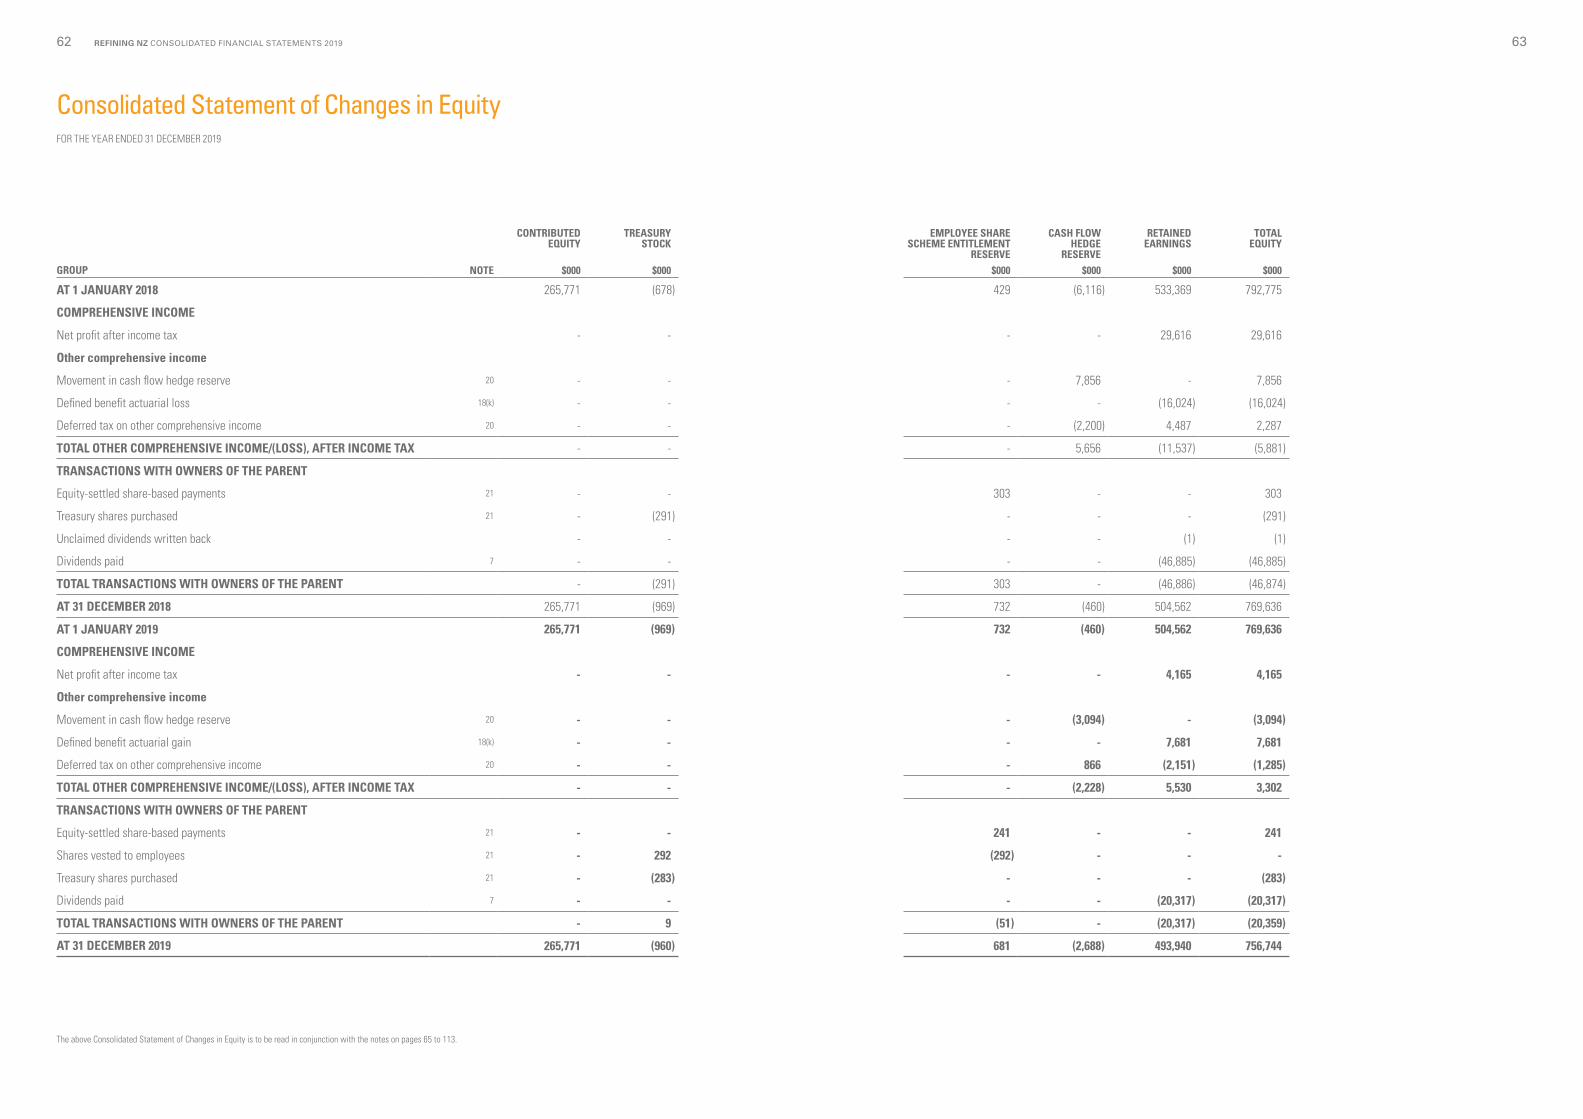
Consolidated Statement of Changes in EquityFOR THE YEAR ENDED 31 DECEMBER 2019
CONTRIBUTEDEQUITY
TREASURY STOCK
EMPLOYEE SHARE SCHEME ENTITLEMENT
RESERVE
CASH FLOW HEDGE
RESERVE
RETAINED EARNINGS
TOTAL EQUITY
GROUP NOTE $000 $000 $000 $000 $000 $000
AT 1 JANUARY 2018 265,771 (678) 429 (6,116) 533,369 792,775
COMPREHENSIVE INCOME
Net profit after income tax - - - - 29,616 29,616
Other comprehensive income
Movement in cash flow hedge reserve 20 - - - 7,856 - 7,856
Defined benefit actuarial loss 18(k) - - - - (16,024) (16,024)
Deferred tax on other comprehensive income 20 - - - (2,200) 4,487 2,287
TOTAL OTHER COMPREHENSIVE INCOME/(LOSS), AFTER INCOME TAX - - - 5,656 (11,537) (5,881)
TRANSACTIONS WITH OWNERS OF THE PARENT
Equity-settled share-based payments 21 - - 303 - - 303
Treasury shares purchased 21 - (291) - - - (291)
Unclaimed dividends written back - - - - (1) (1)
Dividends paid 7 - - - - (46,885) (46,885)
TOTAL TRANSACTIONS WITH OWNERS OF THE PARENT - (291) 303 - (46,886) (46,874)
AT 31 DECEMBER 2018 265,771 (969) 732 (460) 504,562 769,636
AT 1 JANUARY 2019 265,771 (969) 732 (460) 504,562 769,636
COMPREHENSIVE INCOME
Net profit after income tax - - - - 4,165 4,165
Other comprehensive income
Movement in cash flow hedge reserve 20 - - - (3,094) - (3,094)
Defined benefit actuarial gain 18(k) - - - - 7,681 7,681
Deferred tax on other comprehensive income 20 - - - 866 (2,151) (1,285)
TOTAL OTHER COMPREHENSIVE INCOME/(LOSS), AFTER INCOME TAX - - - (2,228) 5,530 3,302
TRANSACTIONS WITH OWNERS OF THE PARENT
Equity-settled share-based payments 21 - - 241 - - 241
Shares vested to employees 21 - 292 (292) - - -
Treasury shares purchased 21 - (283) - - - (283)
Dividends paid 7 - - - - (20,317) (20,317)
TOTAL TRANSACTIONS WITH OWNERS OF THE PARENT - 9 (51) - (20,317) (20,359)
AT 31 DECEMBER 2019 265,771 (960) 681 (2,688) 493,940 756,744
The above Consolidated Statement of Changes in Equity is to be read in conjunction with the notes on pages 65 to 113.
REFINING NZ CONSOLIDATED FINANCIAL STATEMENTS 201962 63
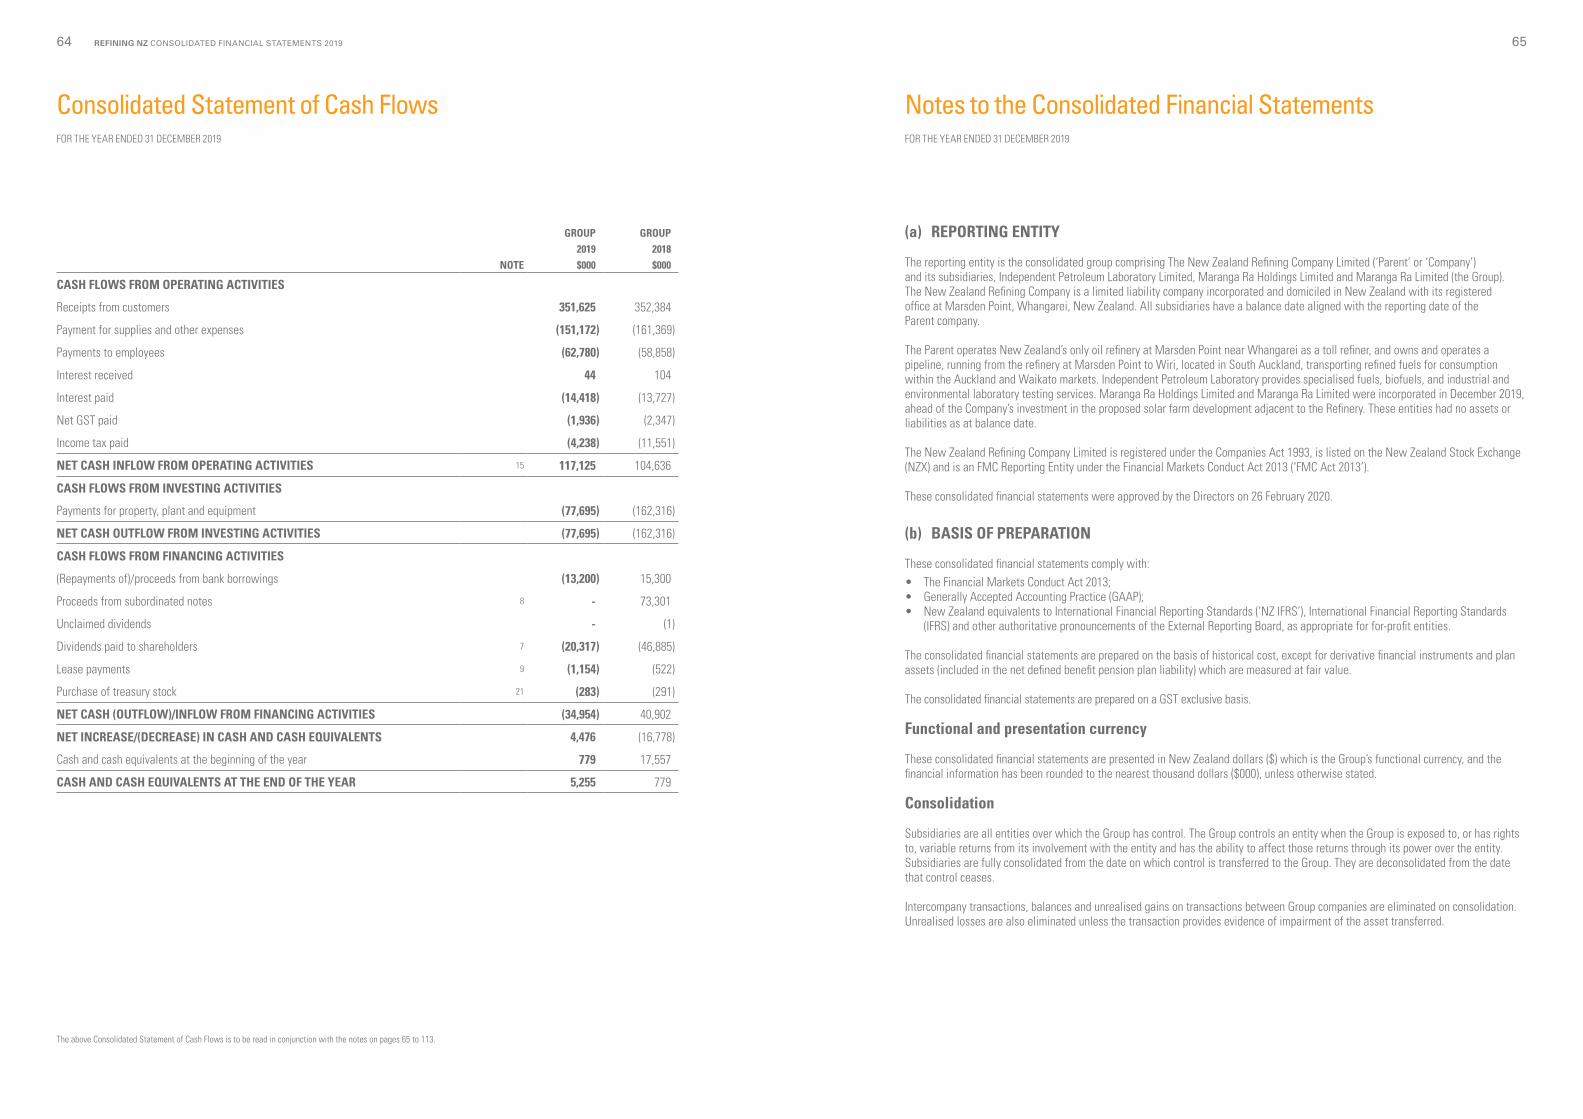
Notes to the Consolidated Financial StatementsFOR THE YEAR ENDED 31 DECEMBER 2019
Consolidated Statement of Cash FlowsFOR THE YEAR ENDED 31 DECEMBER 2019
GROUP GROUP2019 2018
NOTE $000 $000
CASH FLOWS FROM OPERATING ACTIVITIES
Receipts from customers 351,625 352,384
Payment for supplies and other expenses (151,172) (161,369)
Payments to employees (62,780) (58,858)
Interest received 44 104
Interest paid (14,418) (13,727)
Net GST paid (1,936) (2,347)
Income tax paid (4,238) (11,551)
NET CASH INFLOW FROM OPERATING ACTIVITIES 1515 117,125 104,636
CASH FLOWS FROM INVESTING ACTIVITIES
Payments for property, plant and equipment (77,695) (162,316)
NET CASH OUTFLOW FROM INVESTING ACTIVITIES (77,695) (162,316)
CASH FLOWS FROM FINANCING ACTIVITIES
(Repayments of)/proceeds from bank borrowings (13,200) 15,300
Proceeds from subordinated notes 8 - 73,301
Unclaimed dividends - (1)
Dividends paid to shareholders 7 (20,317) (46,885)
Lease payments 9 (1,154) (522)
Purchase of treasury stock 21 (283) (291)
NET CASH (OUTFLOW)/INFLOW FROM FINANCING ACTIVITIES (34,954) 40,902
NET INCREASE/(DECREASE) IN CASH AND CASH EQUIVALENTS 4,476 (16,778)
Cash and cash equivalents at the beginning of the year 779 17,557
CASH AND CASH EQUIVALENTS AT THE END OF THE YEAR 5,255 779
(a) REPORTING ENTITY
The reporting entity is the consolidated group comprising The New Zealand Refining Company Limited (‘Parent’ or ‘Company’) and its subsidiaries, Independent Petroleum Laboratory Limited, Maranga Ra Holdings Limited and Maranga Ra Limited (the Group). The New Zealand Refining Company is a limited liability company incorporated and domiciled in New Zealand with its registered office at Marsden Point, Whangarei, New Zealand. All subsidiaries have a balance date aligned with the reporting date of the Parent company.
The Parent operates New Zealand’s only oil refinery at Marsden Point near Whangarei as a toll refiner, and owns and operates a pipeline, running from the refinery at Marsden Point to Wiri, located in South Auckland, transporting refined fuels for consumption within the Auckland and Waikato markets. Independent Petroleum Laboratory provides specialised fuels, biofuels, and industrial and environmental laboratory testing services. Maranga Ra Holdings Limited and Maranga Ra Limited were incorporated in December 2019, ahead of the Company’s investment in the proposed solar farm development adjacent to the Refinery. These entities had no assets or liabilities as at balance date.
The New Zealand Refining Company Limited is registered under the Companies Act 1993, is listed on the New Zealand Stock Exchange (NZX) and is an FMC Reporting Entity under the Financial Markets Conduct Act 2013 (‘FMC Act 2013’).
These consolidated financial statements were approved by the Directors on 26 February 2020.
(b) BASIS OF PREPARATION
These consolidated financial statements comply with: • The Financial Markets Conduct Act 2013;• Generally Accepted Accounting Practice (GAAP);• New Zealand equivalents to International Financial Reporting Standards (‘NZ IFRS’), International Financial Reporting Standards
(IFRS) and other authoritative pronouncements of the External Reporting Board, as appropriate for for-profit entities.
The consolidated financial statements are prepared on the basis of historical cost, except for derivative financial instruments and plan assets (included in the net defined benefit pension plan liability) which are measured at fair value.
The consolidated financial statements are prepared on a GST exclusive basis.
Functional and presentation currency
These consolidated financial statements are presented in New Zealand dollars ($) which is the Group’s functional currency, and the financial information has been rounded to the nearest thousand dollars ($000), unless otherwise stated.
Consolidation
Subsidiaries are all entities over which the Group has control. The Group controls an entity when the Group is exposed to, or has rights to, variable returns from its involvement with the entity and has the ability to affect those returns through its power over the entity. Subsidiaries are fully consolidated from the date on which control is transferred to the Group. They are deconsolidated from the date that control ceases.
Intercompany transactions, balances and unrealised gains on transactions between Group companies are eliminated on consolidation. Unrealised losses are also eliminated unless the transaction provides evidence of impairment of the asset transferred.
The above Consolidated Statement of Cash Flows is to be read in conjunction with the notes on pages 65 to 113.
REFINING NZ CONSOLIDATED FINANCIAL STATEMENTS 201964 65
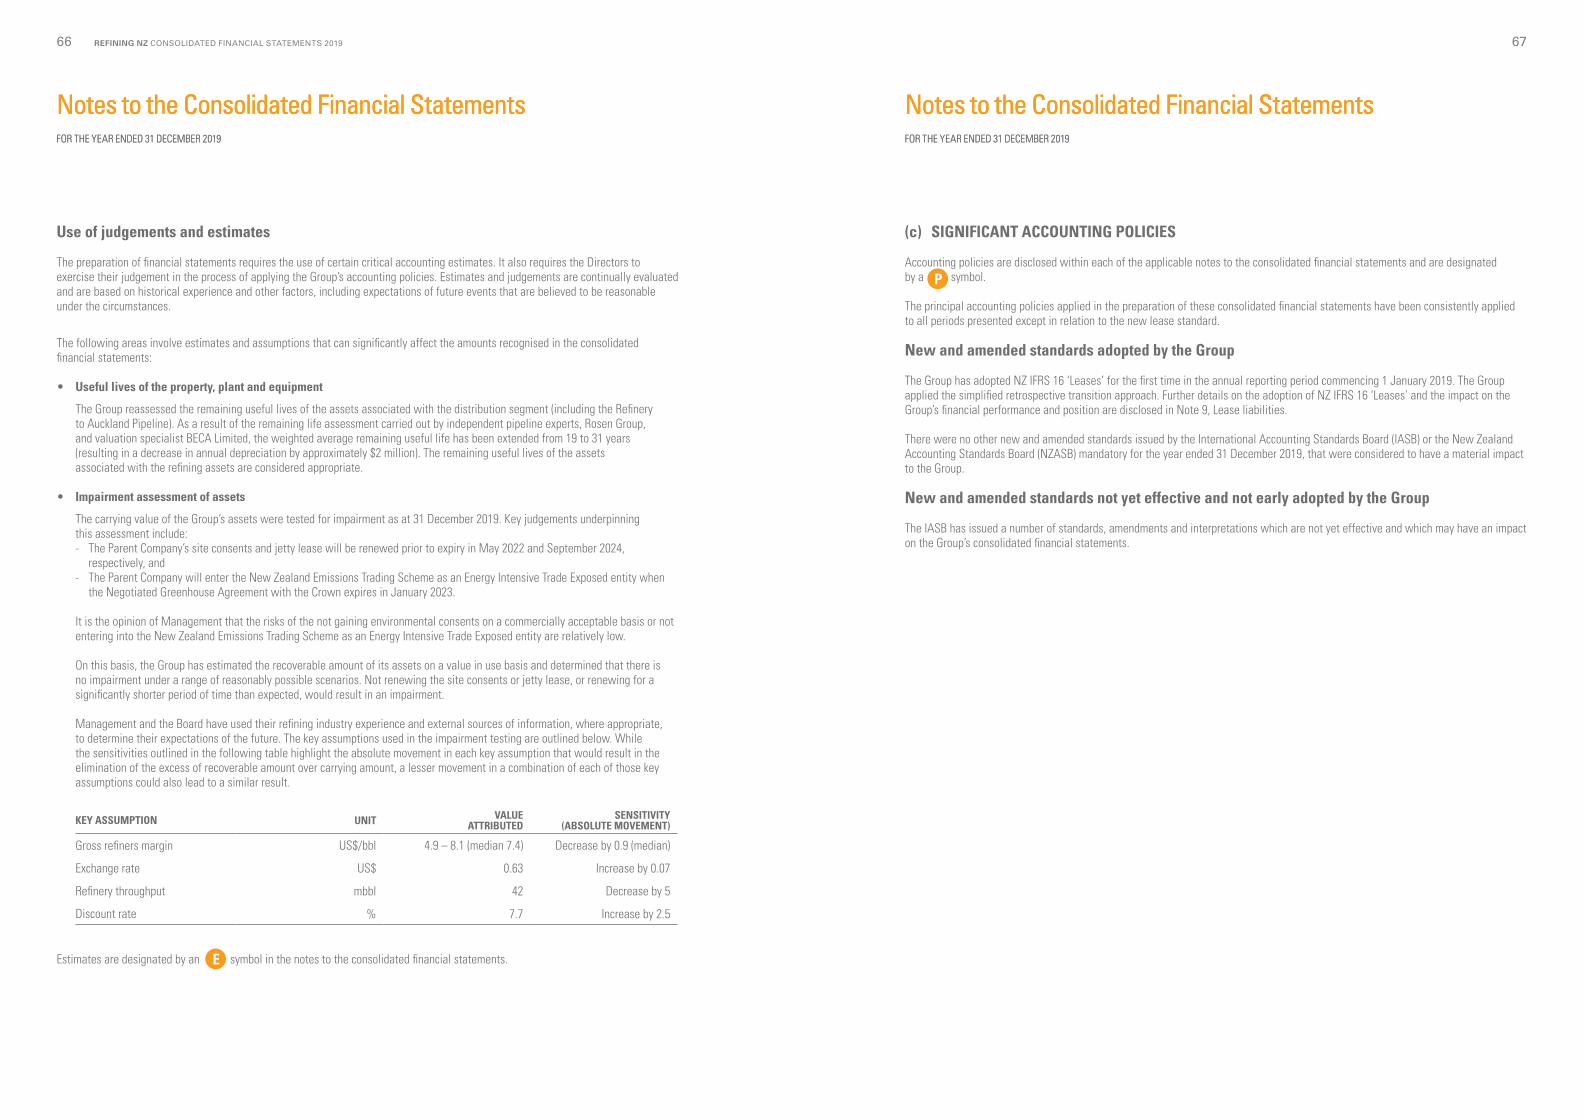
Notes to the Consolidated Financial StatementsFOR THE YEAR ENDED 31 DECEMBER 2019
Notes to the Consolidated Financial StatementsFOR THE YEAR ENDED 31 DECEMBER 2019
Use of judgements and estimates
The preparation of financial statements requires the use of certain critical accounting estimates. It also requires the Directors to exercise their judgement in the process of applying the Group’s accounting policies. Estimates and judgements are continually evaluated and are based on historical experience and other factors, including expectations of future events that are believed to be reasonable under the circumstances.
The following areas involve estimates and assumptions that can significantly affect the amounts recognised in the consolidated financial statements:
• Useful lives of the property, plant and equipment
The Group reassessed the remaining useful lives of the assets associated with the distribution segment (including the Refinery to Auckland Pipeline). As a result of the remaining life assessment carried out by independent pipeline experts, Rosen Group, and valuation specialist BECA Limited, the weighted average remaining useful life has been extended from 19 to 31 years (resulting in a decrease in annual depreciation by approximately $2 million). The remaining useful lives of the assets associated with the refining assets are considered appropriate.
• Impairment assessment of assets
The carrying value of the Group’s assets were tested for impairment as at 31 December 2019. Key judgements underpinning this assessment include: - The Parent Company’s site consents and jetty lease will be renewed prior to expiry in May 2022 and September 2024, respectively, and - The Parent Company will enter the New Zealand Emissions Trading Scheme as an Energy Intensive Trade Exposed entity when
the Negotiated Greenhouse Agreement with the Crown expires in January 2023.
It is the opinion of Management that the risks of the not gaining environmental consents on a commercially acceptable basis or not entering into the New Zealand Emissions Trading Scheme as an Energy Intensive Trade Exposed entity are relatively low. On this basis, the Group has estimated the recoverable amount of its assets on a value in use basis and determined that there is no impairment under a range of reasonably possible scenarios. Not renewing the site consents or jetty lease, or renewing for a significantly shorter period of time than expected, would result in an impairment. Management and the Board have used their refining industry experience and external sources of information, where appropriate, to determine their expectations of the future. The key assumptions used in the impairment testing are outlined below. While the sensitivities outlined in the following table highlight the absolute movement in each key assumption that would result in the elimination of the excess of recoverable amount over carrying amount, a lesser movement in a combination of each of those key assumptions could also lead to a similar result.
KEY ASSUMPTION UNIT VALUE ATTRIBUTED
SENSITIVITY (ABSOLUTE MOVEMENT)
Gross refiners margin US$/bbl 4.9 – 8.1 (median 7.4) Decrease by 0.9 (median)
Exchange rate US$ 0.63 Increase by 0.07
Refinery throughput mbbl 42 Decrease by 5
Discount rate % 7.7 Increase by 2.5
Estimates are designated by an E symbol in the notes to the consolidated financial statements.
(c) SIGNIFICANT ACCOUNTING POLICIES
Accounting policies are disclosed within each of the applicable notes to the consolidated financial statements and are designated by a P symbol.
The principal accounting policies applied in the preparation of these consolidated financial statements have been consistently applied to all periods presented except in relation to the new lease standard.
New and amended standards adopted by the Group
The Group has adopted NZ IFRS 16 ‘Leases’ for the first time in the annual reporting period commencing 1 January 2019. The Group applied the simplified retrospective transition approach. Further details on the adoption of NZ IFRS 16 ‘Leases’ and the impact on theGroup’s financial performance and position are disclosed in Note 9, Lease liabilities.
There were no other new and amended standards issued by the International Accounting Standards Board (IASB) or the New Zealand Accounting Standards Board (NZASB) mandatory for the year ended 31 December 2019, that were considered to have a material impact to the Group.
New and amended standards not yet effective and not early adopted by the Group
The IASB has issued a number of standards, amendments and interpretations which are not yet effective and which may have an impact on the Group’s consolidated financial statements.
REFINING NZ CONSOLIDATED FINANCIAL STATEMENTS 201966 67
Notes to the Consolidated Financial StatementsFOR THE YEAR ENDED 31 DECEMBER 2019
Notes to the Consolidated Financial StatementsFOR THE YEAR ENDED 31 DECEMBER 2019
PAGE
PERFORMANCE 691 Segment reporting 692 Income and expenses 723 Related parties 754 Taxation 785 Earnings per share 79
DEBT AND EQUITY 806 Equity 807 Dividends 818 Borrowings 819 Lease liabilities 83
OPERATING ASSETS AND LIABILITIES 8610 Property, plant and equipment, and intangibles 8611 Operating leases 9012 Capital commitments 9013 Provisions 9114 Trade and other receivables 9215 Cash and cash equivalents 9316 Inventories 9417 Trade and other payables 9518 Employee benefits 96
FINANCIAL RISK MANAGEMENT 10319 Financial risk management 10320 Derivative financial instruments 108
OTHER 11121 Employee share-based payments 11122 Contingent liabilities 11223 Auditor’s fees 112
Notes to the Consolidated Financial StatementsFOR THE YEAR ENDED 31 DECEMBER 2019
PERFORMANCEThis section focuses on Refining NZ’s financial performance and the returns provided to equity holders. The following notes are included:
Note 1: Segment reportingNote 2: Income and expensesNote 3: Related partiesNote 4: TaxationNote 5: Earnings per share
1. SEGMENT REPORTING
(a) Identification and description of reportable segments
Operating segments are reported in a manner consistent with the internal reporting provided to the Leadership Team, identified as the chief operating decision-maker. The Leadership Team reviews the Group’s internal reporting of oil refining and distribution separately in order to assess their performance and allocate resources. The operating segments, based on these reports are as follows:
Oil Refining
The Parent owns and operates an oil refinery located at Marsden Point, 160 kilometres north of Auckland. The oil refinery is able to process a wide range of crude oil types imported from around the world.
Distribution
The Parent owns infrastructure to support the distribution of manufactured products to its customers. The Refinery to Auckland Pipeline (RAP) transfers product to the Wiri Oil terminal located in South Auckland (refer note 3).
Other
Other includes the subsidiary companies’ operations and properties. These have not been included in a reportable segment as they are not separately reported to the Leadership Team.
Sales between segments are carried out at arm’s length and represent charges by the subsidiary companies (included in “Other”) to Oil Refining. The revenue from external parties reported to the Leadership Team is measured in a manner consistent with that in the Income Statement. All revenue is generated in New Zealand.
Revenue derived from major customers, and the relevant operating segments, is disclosed in note 3.
(b) Reporting measures
The performance of the operating segments is based on earnings before depreciation, finance costs and income tax and net profit after income tax. This information is measured in a manner consistent with that in the consolidated financial statements.
The Group manages assets and liabilities on a central basis and therefore does not provide any segment information of this nature.
69REFINING NZ CONSOLIDATED FINANCIAL STATEMENTS 201968
Notes to the Consolidated Financial StatementsFOR THE YEAR ENDED 31 DECEMBER 2019
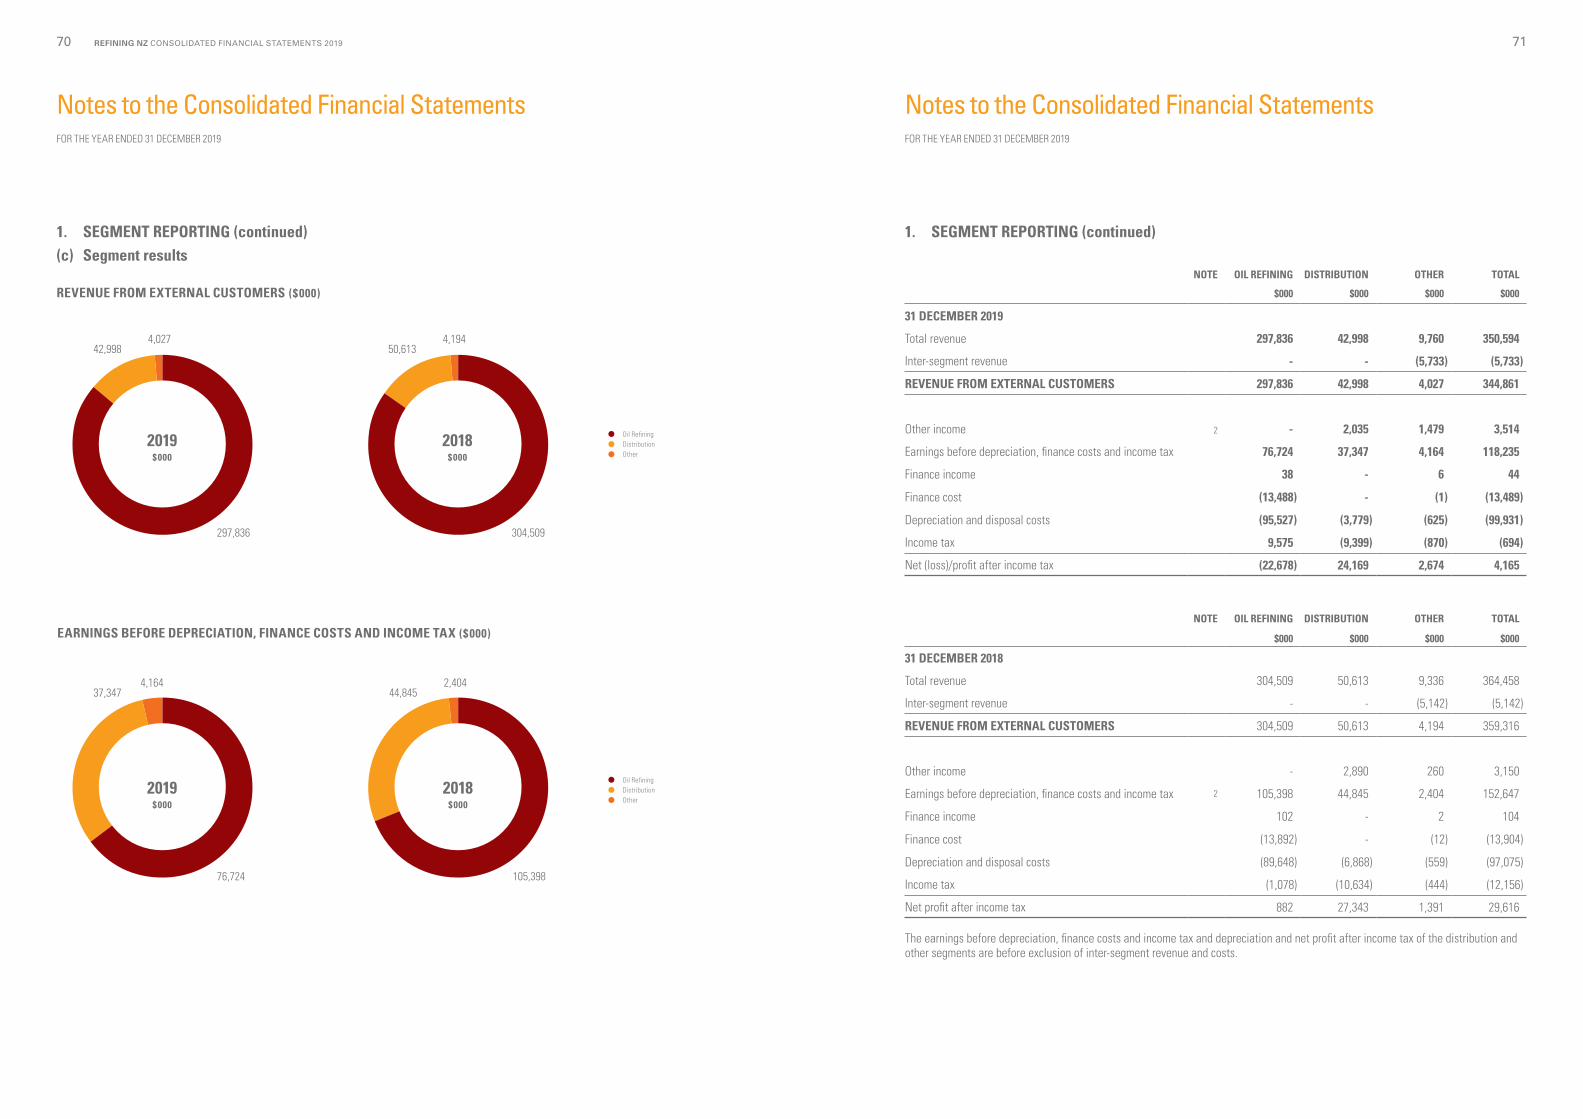
1. SEGMENT REPORTING (continued)(c) Segment results
1. SEGMENT REPORTING (continued)
NOTE OIL REFINING DISTRIBUTION OTHER TOTAL
$000 $000 $000 $000
31 DECEMBER 2019
Total revenue 297,836 42,998 9,760 350,594
Inter-segment revenue - - (5,733) (5,733)
REVENUE FROM EXTERNAL CUSTOMERS 297,836 42,998 4,027 344,861
Other income 222 2 - 2,035 1,479 3,514
Earnings before depreciation, finance costs and income tax 76,724 37,347 4,164 118,235
Finance income 38 - 6 44
Finance cost (13,488) - (1) (13,489)
Depreciation and disposal costs (95,527) (3,779) (625) (99,931)
Income tax 9,575 (9,399) (870) (694)
Net (loss)/profit after income tax (22,678) 24,169 2,674 4,165
NOTE OIL REFINING DISTRIBUTION OTHER TOTAL
$000 $000 $000 $000
31 DECEMBER 2018
Total revenue 304,509 50,613 9,336 364,458
Inter-segment revenue - - (5,142) (5,142)
REVENUE FROM EXTERNAL CUSTOMERS 304,509 50,613 4,194 359,316
Other income - 2,890 260 3,150
Earnings before depreciation, finance costs and income tax 2 105,398 44,845 2,404 152,647
Finance income 102 - 2 104
Finance cost (13,892) - (12) (13,904)
Depreciation and disposal costs (89,648) (6,868) (559) (97,075)
Income tax (1,078) (10,634) (444) (12,156)
Net profit after income tax 882 27,343 1,391 29,616
The earnings before depreciation, finance costs and income tax and depreciation and net profit after income tax of the distribution and other segments are before exclusion of inter-segment revenue and costs.
42,998
297,836
4,027
Oil RefiningDistributionOther
REVENUE FROM EXTERNAL CUSTOMERS ($000)
50,613
304,509
4,194
2019 $000
2018 $000
37,347 44,845
76,724 105,398
4,164 2,404
Oil RefiningDistributionOther
EARNINGS BEFORE DEPRECIATION, FINANCE COSTS AND INCOME TAX ($000)
2019 $000
2018 $000
REFINING NZ CONSOLIDATED FINANCIAL STATEMENTS 201970 71
Notes to the Consolidated Financial StatementsFOR THE YEAR ENDED 31 DECEMBER 2019
Notes to the Consolidated Financial StatementsFOR THE YEAR ENDED 31 DECEMBER 2019
2. INCOME AND EXPENSES
P Revenue is recognised when control of a good or service transfers to a customer. Processing fees, pipeline fees and other services provided by the Group are identified as distinct performance obligations which are satisfied over time and for which a transaction price is separately determined and allocated. No significant judgement is involved in the price determination and allocation. An output method is applied to measure progress of the services provided. The Group does not have contracts with customers where significant financing components, non-cash considerations or consideration payable to customers, obligations for refunds or specific warranties would be existent. Specific accounting policies are as follows:
Refining revenue
Processing fees and other processing related fees, such as blending and reprocessing (presented as “Other refining related income”) are recognised over time as processing services are delivered. The revenue from processing and other processing related fees is recognised in the amounts invoiced, applying paragraph B16 of NZ IFRS 15 ‘Revenue from Contracts with Customers’, reflecting actual volumes processed (including intermediate products), adjusted for fee floor and cap, when applicable.
The cost of natural gas, used by the Parent in the refining process, is recovered from customers and presented as a component of refining revenue; the Parent acts as principal with respect to procuring and selling natural gas.
Distribution revenue
Pipeline and terminalling fee revenue is recognised over time as refined products are delivered to the Wiri Oil terminal in South Auckland, and in the amount to which the Group has a right to invoice customers, applying the practical expedient in NZ IFRS 15, within an operating period.
Rental income from operating leases (including Wiri Oil terminal rental) is recognised on a straight-line basis in accordance with the substance of the relevant agreements.
Other revenue
Revenue from other contracts (primarily relating to provision of services) is recognised over time as goods or services are delivered to customers.
2. INCOME AND EXPENSES (continued)
Net profit before income tax includes the following income and expenses:GROUP GROUP
2019 2018
NOTE $000 $000
REVENUE
Processing fees 241,970 258,873
Natural gas recovery 39,579 31,987
Other refining related income 16,287 13,649
Refining revenue 297,836 304,509
Pipeline and terminalling fee revenue 36,473 44,088
Wiri land and terminal lease income 11 6,525 6,525
Distribution revenue 42,998 50,613
Other operating income 4,027 4,194
TOTAL REVENUE 344,861 359,316
OTHER INCOME
Other income 3,514 3,150
TOTAL OTHER INCOME 3,514 3,150
TOTAL INCOME 348,375 362,466
And charging:
Process materials and utilities 58,502 49,153
Natural gas 39,580 31,987
PURCHASE OF PROCESS MATERIALS AND UTILITIES 98,082 81,140
Contractor payments 23,433 20,856
Materials 7,752 8,124
Obsolescence provision recognised 155 23
TOTAL MATERIALS AND CONTRACTOR PAYMENTS 31,340 29,003
Wages and salaries 55,324 55,854
Defined contribution pension plan contributions 1,771 1,597
Defined benefit pension plan expense 18(j) 3,685 3,272
Medical plan contributions 18(j) 226 242
Equity-settled share-based payments 21 241 303
TOTAL WAGES, SALARIES AND BENEFITS 61,247 61,268
Administration and other expenses 23 4,099 5,962
Contract services 17,158 16,202
Consultants 6,721 4,873
Insurance 4,830 3,964
REFINING NZ CONSOLIDATED FINANCIAL STATEMENTS 201972 73
Notes to the Consolidated Financial StatementsFOR THE YEAR ENDED 31 DECEMBER 2019
Notes to the Consolidated Financial StatementsFOR THE YEAR ENDED 31 DECEMBER 2019
2. INCOME AND EXPENSES (continued)
GROUP GROUP2019 2018
NOTE $000 $000
Rates 1,187 1,282
Employee related costs 4,005 4,151
Directors' fees 795 780
Operating lease expenses:
Wiri Oil land rental 500 500
Other - 523
Donations 176 171
TOTAL ADMINISTRATION AND OTHER COSTS 39,471 38,408
Depreciation of property, plant and equipment 10 99,058 96,424
Depreciation of right-of-use assets 9 440 -
Loss on disposal of property, plant and equipment 10 433 651
TOTAL DEPRECIATION AND DISPOSAL COSTS 99,931 97,075
Interest expense:
Bank borrowings 11,107 13,975
Subordinated notes 3,894 243
Restoration provision finance charge 254 345
Finance leases 9 342 -
Interest capitalised to qualifying asset (2,108) (659)
TOTAL FINANCE COSTS 13,489 13,904
Finance income:
Interest income on short-term bank deposits (44) (104)
TOTAL FINANCE INCOME (44) (104)
NET FINANCE COSTS 13,445 13,800
TOTAL COSTS 343,516 320,694
NET PROFIT BEFORE INCOME TAX 4,859 41,772
Insurance recoveries
Following the Refinery to Auckland pipeline rupture on 14 September 2017, the Parent Company incurred costs associated with repairs to the pipeline and the recovery and remediation of the leak site which was completed in May 2018.
The Company had insurance policies to cover both environmental remediation and loss of revenue following the incident. In this financial year the Company recognised $2.1 million of insurance recoveries as “Other income” (2018: $1.8 million) under the material damage and business interruption policy for loss of revenue.
3. RELATED PARTIES
(a) Shareholders and other related parties
The Group enters into transactions with the oil companies who are also shareholders of the Parent, and Wiri Oil Services Limited (Wiri Oil), a company that is owned by shareholders of the Parent.
Details of shareholdings at 31 December are:
2019 2018
% %
BP New Zealand Holdings Limited (BP) 10.10 10.10
Mobil Oil NZ Limited (Mobil) 17.20 17.20
Z Energy Limited (Z Energy) 15.36 15.36
The nature, transactions and balances with the shareholders and other related parties are as follows:
(i) REVENUE FROM RELATED PARTIES
Revenue from the oil refining and distribution segments is derived from the oil companies as follows:
TRANSACTION VALUES FOR THE YEAR ENDED 31 DECEMBER
BALANCES OUTSTANDING AS AT 31 DECEMBER
2019 2018 2019 2018$000 $000 $000 $000
BP 89,066 90,661 38,060 32,766
Mobil 80,894 83,567 32,955 26,420
Z Energy 151,836 164,164 68,080 74,365
Wiri Oil 7,073 7,047 29 24
TOTAL 328,869 345,439 139,124 133,575
Processing fees
The Group has separate processing agreements with each of the three oil companies which have been in place since 1995. They are long-term “evergreen” contracts which continue unless renegotiated or terminated by mutual consent or by a customer on one year’s notice. 93% (2018: 94%) of the Group’s total operating revenue is earned under the processing agreements. Refer to note 19(a) for further details.
Leases
The Parent leases land from Wiri Oil Services Limited (Wiri Oil) and owns the Wiri Oil terminal (plant) located on this land. The land and plant is leased back to Wiri Oil. The leases are non-cancellable operating leases, which expire in February 2025 with no right of renewal. At the end of the lease term, ownership of the Wiri Oil terminal reverts to Wiri Oil Services Limited.
Excise duty
Excise duty is collected from the Oil Companies and paid to the New Zealand Customs Service on the same day each month (refer notes 14 and 17) and is included in the above balances outstanding as at 31 December.
REFINING NZ CONSOLIDATED FINANCIAL STATEMENTS 201974 75
Notes to the Consolidated Financial StatementsFOR THE YEAR ENDED 31 DECEMBER 2019
Notes to the Consolidated Financial StatementsFOR THE YEAR ENDED 31 DECEMBER 2019
3. RELATED PARTIES (continued)
(ii) PURCHASES OF GOODS AND SERVICES
The Group purchases sulphur, a by-product of the refining process, which is on sold to third parties, and other fuels, from related parties as follows:
TRANSACTION VALUES FOR THE YEAR ENDED 31 DECEMBER
BALANCES OUTSTANDING AS AT 31 DECEMBER
2019 2018 2019 2018$000 $000 $000 $000
BP 735 1,087 - 170
Mobil 311 996 - 145
Z Energy 1,133 2,689 185 328
TOTAL 2,179 4,772 185 643
(iii) OTHER CHARGES
A portion of the Group’s material damage and business interruption and contract works and liability insurance is held by companies related to shareholders.
TRANSACTION VALUES FOR THE YEAR ENDED 31 DECEMBER
BALANCES OUTSTANDING AS AT 31 DECEMBER
2019 2018 2019 2018$000 $000 $000 $000
BP – Jupiter Insurance Ltd 702 619 - -
ExxonMobil (Ancon) 331 - - -
TOTAL 1,033 619 - -
3. RELATED PARTIES (continued)
(b) Directors’ fees and key management personnel compensation
Directors’ fees are disclosed in note 2.
Key management personnel include all members of the Leadership Team.
GROUP GROUP2019 2018$000 $000
Salaries and other short-term employee benefits 3,929 4,489
Post-employment benefits 139 160
TOTAL KEY MANAGEMENT PERSONNEL COMPENSATION 4,068 4,649
Number of personnel at 31 December 8 8
The above analysis is compiled on a cash basis; variable performance rewards (linked to individual and business performance for a financial reporting period) are paid subsequent to balance date and reported as part of payments to key management personnel for the following year.
Key management personnel compensation in 2018 includes the short term incentives paid to the former CEO (Sjoerd Post) and members of the leadership team in respect of the 2017 performance year. The 2018 total key management personnel compensation include: • the short term incentives paid to the former CEO and members of the leadership team in respect of the 2017 performance year, and, • $600 thousand paid to the former CEO in respect of the 2018 performance year, comprising: a pro-rata short term incentive payment
pursuant to the achievement of 2018 key performance indicators and an additional discretionary payment, pursuant to the terms of his employment agreement, in recognition of an agreed contract extension.
REFINING NZ CONSOLIDATED FINANCIAL STATEMENTS 201976 77
Notes to the Consolidated Financial StatementsFOR THE YEAR ENDED 31 DECEMBER 2019
Notes to the Consolidated Financial StatementsFOR THE YEAR ENDED 31 DECEMBER 2019
4. TAXATION
(a) Income tax expense
P The income tax expense for the year is the tax payable on the current year’s taxable income based on the New Zealand income tax rate on the basis of the tax laws enacted or substantively enacted at the end of the reporting period, adjusted by changes in deferred tax assets and liabilities attributable to temporary differences between the tax bases of assets and liabilities and their carrying amounts in the consolidated financial statements and to unused tax losses.
GROUP GROUP
2019 2018
NOTE $000 $000
NET PROFIT BEFORE INCOME TAX EXPENSE 4,859 41,772
Tax at the New Zealand corporate income tax rate of 28% (2018: 28%) 1,361 11,696
Tax effect of amounts which are either non-deductible or taxable in calculating taxable income:
Income not assessable for tax (203) -
Expenses not deductible for tax 61 285
Adjustments in respect of current income tax in respect of previous years (525) 175
INCOME TAX EXPENSE, REPRESENTED BY: 694 12,156
Current tax expense 457 1,704
Deferred tax recognised in the income statement 4(b) 237 10,452
(b) Deferred tax
P Deferred tax assets and liabilities arise from temporary differences between the tax base of assets and liabilities and their carrying amounts in the consolidated financial statements, and are recognised for temporary differences at the tax rates expected to apply when the assets are recovered or liabilities are settled, based on those tax rates which are enacted or substantively enacted. An exception is made for certain temporary differences arising from the initial recognition of an asset or liability.
Deferred tax assets are recognised for deductible temporary differences and unused tax losses only if it is probable that future taxable amounts will be available to utilise those temporary differences and losses.
Current and deferred tax balances attributable to amounts recognised in other comprehensive income or directly in equity are also recognised in other comprehensive income or directly in equity, respectively.
4. TAXATION (continued)
DEFERRED TAX LIABILITY/(ASSET)PROPERTY,
PLANT AND EQUIPMENT
PROVISIONS EMPLOYEE BENEFITS
FINANCIAL INSTRUMENTS
TAX LOSSES
TOTAL
NOTE $000 $000 $000 $000 $000 $000
1 JANUARY 2018 139,218 (4,129) (9,587) (2,378) - 123,124
Deferred tax in respect of previous years (899) (197) 12 - - (1,084)Deferred tax in respect of current year 17,018 (82) (790) - (4,610) 11,536
Deferred tax recognised in the income statement 4(a) 16,119 (279) (778) - (4,610) 10,452 Included in other comprehensive income - - (4,487) 2,200 - (2,287)
31 DECEMBER 2018 155,337 (4,408) (14,852) (178) (4,610) 131,289 Deferred tax in respect of previous years (159) (118) 36 - (284) (525)Deferred tax in respect of current year 1,238 (175) (347) - 46 762
Deferred tax recognised in the income statement 4(a) 1,079 (293) (311) - (238) 237 Included in other comprehensive income - - 2,151 (866) - 1,285
31 DECEMBER 2019 156,416 (4,701) (13,012) (1,044) (4,848) 132,811
The Group has unused tax losses of $17.3 million (2018: $16.5 million) available to carry forward.
5. EARNINGS PER SHARE
P Earnings per share is calculated by dividing the profit attributable to shareholders of the Company by the weighted average number of ordinary shares on issue during the year. The Company’s share-based payments described in note 21 have no material dilutive effect on the earnings per share.
TOTAL TOTAL
NOTE 2019 2018
Profit after tax attributable to shareholders of the Company ($000) 4,165 29,616
Weighted average number of shares on issue (000’s) 6 312,177 312,243
BASIC AND DILUTED EARNINGS PER SHARE 1.3 9.5
REFINING NZ CONSOLIDATED FINANCIAL STATEMENTS 201978 79
Notes to the Consolidated Financial StatementsFOR THE YEAR ENDED 31 DECEMBER 2019
Notes to the Consolidated Financial StatementsFOR THE YEAR ENDED 31 DECEMBER 2019
DEBT AND EQUITYThe Group’s objective when managing capital (net assets of the Group) is to safeguard the Group’s ability to continue as a going concern in order to provide returns for shareholders and benefit for other stakeholders and to maintain an appropriate capital structure. The Group borrows under a negative pledge arrangement (refer note 8). The Group monitors rolling forecasts which take into consideration the Group’s debt financing plans and covenant compliance, to ensure that it is able to continue meeting funding requirements.
In order to maintain or adjust the capital structure, the Group may adjust the amount of dividends paid to shareholders, return capital to shareholders, or issue new shares.
This section outlines Refining NZ’s capital structure and includes the following Notes:
Note 6: EquityNote 7: DividendsNote 8: BorrowingsNote 9: Lease liabilities
6. EQUITY
Contributed equity
The issued capital of the Company is represented by 312,576,453 no par value ordinary shares (2018: 312,576,453) issued and fully paid, less 417,644 (2018: 375,848) treasury shares held by CRS Nominees Limited (refer to note 21). All ordinary shares rank equally with one vote attached to each ordinary share.
Treasury stock
Treasury stock represents the value of shares acquired by the Parent on-market in respect of the Employee Share Purchase Scheme (refer to note 21).
Employee share entitlement reserve
The employee share entitlement reserve is used to recognise the fair value of shares granted but not vested. Amounts are transferred to share capital when the shares vest to the employee (refer to note 21).
Cash flow hedge reserve
The cash flow hedge reserve comprises the effective portion of the cumulative net change in the fair value of hedging instruments used in cash flow hedges pending subsequent recognition in the income statement.
7. DIVIDENDS
CENTS TOTAL TOTAL
PER 2019 2018
SHARE $000 $000
Final dividend for 2017 12.0 - 37,508
Interim dividend for 2018 3.0 - 9,377
Final dividend for 2018 4.5 14,067 -
Interim dividend for 2019 2.0 6,250 -
TOTAL 20,317 46,885
The dividends were fully imputed. Supplementary dividends of $0.750 million (2018: $1.532 million) were paid to shareholders who were not tax residents in New Zealand for which the Group received a foreign investor tax credit entitlement.
Imputation credits available to shareholders for subsequent reporting periods amount to $23.589 million as at 31 December 2019 (2018: $30.441 million).
Dividend declared post balance date
The Group has declared no final dividend (2018: 4.5 cents per share).
8. BORROWINGS
P Borrowings are initially recognised at fair value, net of transaction costs incurred. Borrowings are subsequently measured at amortised cost. Borrowings are classified as current liabilities unless the Group has an unconditional right to defer settlement for at least 12 months after the balance date.
The chart below outlines the maturity profile of the borrowings:
Utilised Facilities (cash advance) Undrawn Facilities (cash advance) Subordinated notes
0 1–2 YEARS0–1 YEAR
98,100
1,900
2–3 YEARS
74,000
6,000
3–4 YEARS
95,000
75,000*
5+ YEARS
120,000
100,000
80,000
60,000
40,000
20,000
120,000
100,000
80,000
60,000
40,000
20,000
$ 00
0
*The carrying value of the subordinated notes as at 31 December 2019 amounts to $74.5 million. The difference between the carrying value and the $75 million face value is due to interest and issue costs. While the expiry date of the subordinated notes is on 1 March 2034, the maturity profile reflects the notes as maturing in 2024 on the basis that – as a result of an election process – the Company may elect to either redeem the notes or offer new conditions to the noteholders.
REFINING NZ CONSOLIDATED FINANCIAL STATEMENTS 201980 81
Notes to the Consolidated Financial StatementsFOR THE YEAR ENDED 31 DECEMBER 2019
Notes to the Consolidated Financial StatementsFOR THE YEAR ENDED 31 DECEMBER 2019
8. BORROWINGS (continued)
The carrying amounts of borrowings approximate their fair value. The borrowings are unsecured. The Parent borrows under a negative pledge arrangement which requires certain certificates and covenants, including debt to total debt and equity, security to tangible assets and EBITDA to interest ratios. All of these requirements have been met.
The Parent has the ability to determine which revolving cash advance facility will be drawn upon to meet funding requirements.
In February 2019 the Company reduced its existing committed bank facility limits from $350 million to $275 million and extended the $50 million facility expiring in March 2019 to March 2021. In December 2019, the Company extended its $95 million facilities expiring in March 2020 to March 2025. In addition, as at 31 December 2019 the Company held $35 million of uncommitted facilities. The purpose of the uncommitted facilities is to support short dated debt drawings. The table below presents the year end borrowings with their maturity dates, as well as undrawn facilities at 31 December:
GROUP GROUP
MATURITY 2019 2018
DATE $000 $000
BORROWINGS
Current borrowings:
Revolving cash advances Mar-19 - 50,000
Total current bank borrowings - 50,000
Non-current borrowings:
Revolving cash advances Mar-20 - 2,000
Revolving cash advances Mar-20 - 67,300
Revolving cash advances Mar-21 98,100 4,000
Revolving cash advances Mar-22 74,000 2,000
Term loan Mar-21 - 60,000
Revolving cash advances Mar-25 - -
Subordinated notes Mar-34 74,516 73,301
Total non-current borrowings 246,616 208,601
TOTAL BORROWINGS 246,616 258,601
EFFECTIVE INTEREST RATE
Bank loans 6.0% 5.6%
Subordinated notes 5.4% 5.4%
UNDRAWN FACILITIES
Revolving cash advances Mar-20 - 50,700
Revolving cash advances Mar-21 1,900 26,000
Revolving cash advances Mar-22 6,000 88,000
Revolving cash advances Mar-25 95,000 -
TOTAL UNDRAWN BORROWING FACILITIES 102,900 164,700
9. LEASE LIABILITIES
Adoption of NZ IFRS 16 ‘Leases’
NZ IFRS 16 ‘Leases’ was issued in February 2016 and is mandatory for annual reporting periods beginning on or after 1 January 2019. It has resulted in more leases being recognised on the balance sheet for lessees, as the distinction between operating and finance leases is removed. Under the new standard, an asset (the right to use the leased item) and a financial liability to pay rentals are recognised. The only exemptions for the Group are short-term and low value leases. The accounting treatment for lessors has not significantly changed under the new standard.
The Group applied the simplified retrospective transition approach where outstanding lease payments are discounted using the incremental borrowing rate at 1 January 2019. This results in the right-of-use asset being recognised at an amount equal to the lease liability. The Group applied the transitional provisions of NZ IFRS 16 ‘Leases’ which allowed it to not account for:• leases, where the lease term ends within 12 months of 1 January 2019, and• contracts which had not been previously recognised aa leases in accordance with either NZ IAS 17 ‘Leases’ or NZ IFRIC 4
‘Determining whether an Arrangement contains a Lease’.
The weighted average lessee’s incremental borrowing rate applied to lease liabilities recognised in the balance sheet at the date of initial application was 4%. The variance between operating lease commitments disclosed at 31 December 2018 and Lease liabilities at 1 January 2019 is outlined in the table below:
GROUP
2018
$000
Operating lease commitments as at 31 December 2018 2,845
Discounted using the Group's incremental borrowing rate (189)
Add: finance lease liabilities recognised as at 31 December 2018 2,474
Less: short-term leases recognised on a straight-line basis as expense (204)
Less: contracts reassesed as service agreements (2,625)
Add: adjustments from a different treatment of extension and termination options 1,477
LEASE LIABILITY RECOGNISED AS AT 1 JANUARY 2019 3,778
Finance leases – Group as a lessee
P Leases are recognised as a right-of-use asset and a corresponding liability at the date at which the leased asset is available for use by the Group. Assets and liabilities arising from a lease are initially measured on a present value basis. Each lease payment is allocated between the liability and finance cost. The finance cost is charged to income statement over the lease period so as to produce a constant periodic rate of interest on the remaining balance of the liability for each period. The right-of-use asset is depreciated over the shorter of the asset’s useful life and the lease term on a straight-line basis.
Payments associated with short-term leases and leases of low-value assets are recognised on a straight-line basis as an expense in profit or loss. Short-term leases are leases with a lease term of 12 months or less.
REFINING NZ CONSOLIDATED FINANCIAL STATEMENTS 201982 83
Notes to the Consolidated Financial StatementsFOR THE YEAR ENDED 31 DECEMBER 2019
Notes to the Consolidated Financial StatementsFOR THE YEAR ENDED 31 DECEMBER 2019
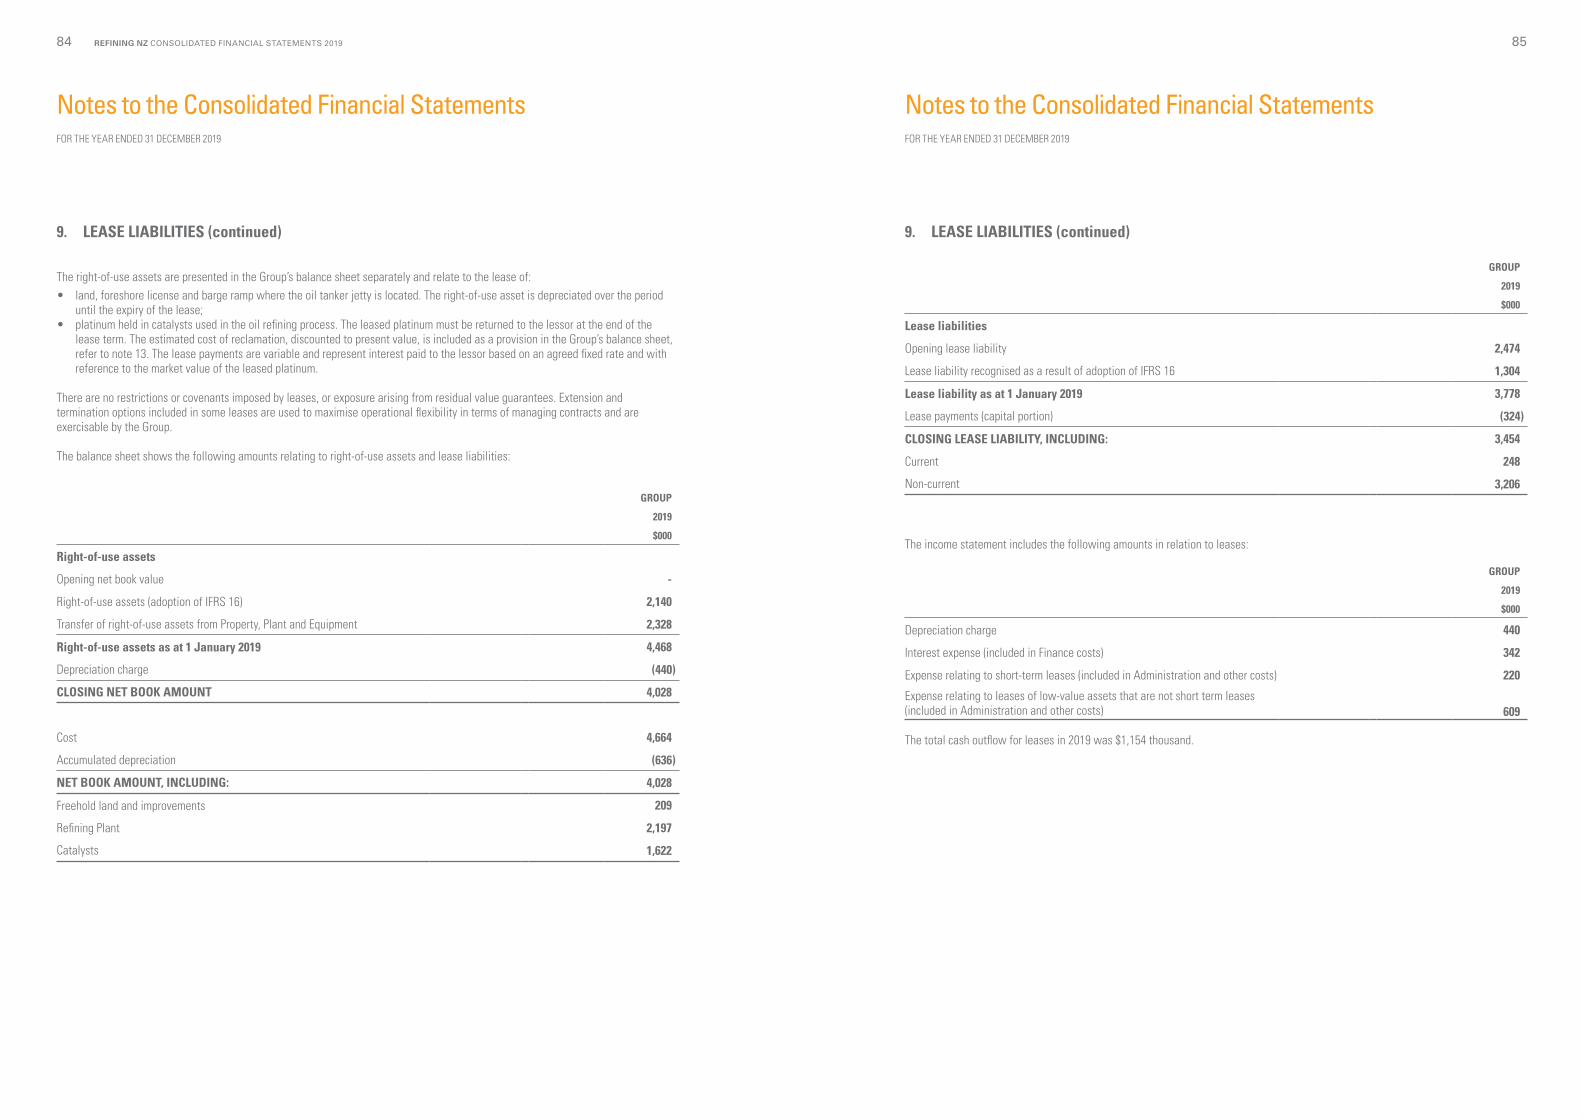
9. LEASE LIABILITIES (continued)
The right-of-use assets are presented in the Group’s balance sheet separately and relate to the lease of:• land, foreshore license and barge ramp where the oil tanker jetty is located. The right-of-use asset is depreciated over the period
until the expiry of the lease;• platinum held in catalysts used in the oil refining process. The leased platinum must be returned to the lessor at the end of the
lease term. The estimated cost of reclamation, discounted to present value, is included as a provision in the Group’s balance sheet, refer to note 13. The lease payments are variable and represent interest paid to the lessor based on an agreed fixed rate and with reference to the market value of the leased platinum.
There are no restrictions or covenants imposed by leases, or exposure arising from residual value guarantees. Extension and termination options included in some leases are used to maximise operational flexibility in terms of managing contracts and are exercisable by the Group.
The balance sheet shows the following amounts relating to right-of-use assets and lease liabilities:
GROUP
2019
$000
Right-of-use assets
Opening net book value -
Right-of-use assets (adoption of IFRS 16) 2,140
Transfer of right-of-use assets from Property, Plant and Equipment 2,328
Right-of-use assets as at 1 January 2019 4,468
Depreciation charge (440)
CLOSING NET BOOK AMOUNT 4,028
Cost 4,664
Accumulated depreciation (636)
NET BOOK AMOUNT, INCLUDING: 4,028
Freehold land and improvements 209
Refining Plant 2,197
Catalysts 1,622
9. LEASE LIABILITIES (continued)
GROUP
2019
$000
Lease liabilities
Opening lease liability 2,474
Lease liability recognised as a result of adoption of IFRS 16 1,304
Lease liability as at 1 January 2019 3,778
Lease payments (capital portion) (324)
CLOSING LEASE LIABILITY, INCLUDING: 3,454
Current 248
Non-current 3,206
The income statement includes the following amounts in relation to leases:
GROUP
2019
$000
Depreciation charge 440
Interest expense (included in Finance costs) 342
Expense relating to short-term leases (included in Administration and other costs) 220
Expense relating to leases of low-value assets that are not short term leases (included in Administration and other costs) 609
The total cash outflow for leases in 2019 was $1,154 thousand.
REFINING NZ CONSOLIDATED FINANCIAL STATEMENTS 201984 85
Notes to the Consolidated Financial StatementsFOR THE YEAR ENDED 31 DECEMBER 2019
Notes to the Consolidated Financial StatementsFOR THE YEAR ENDED 31 DECEMBER 2019
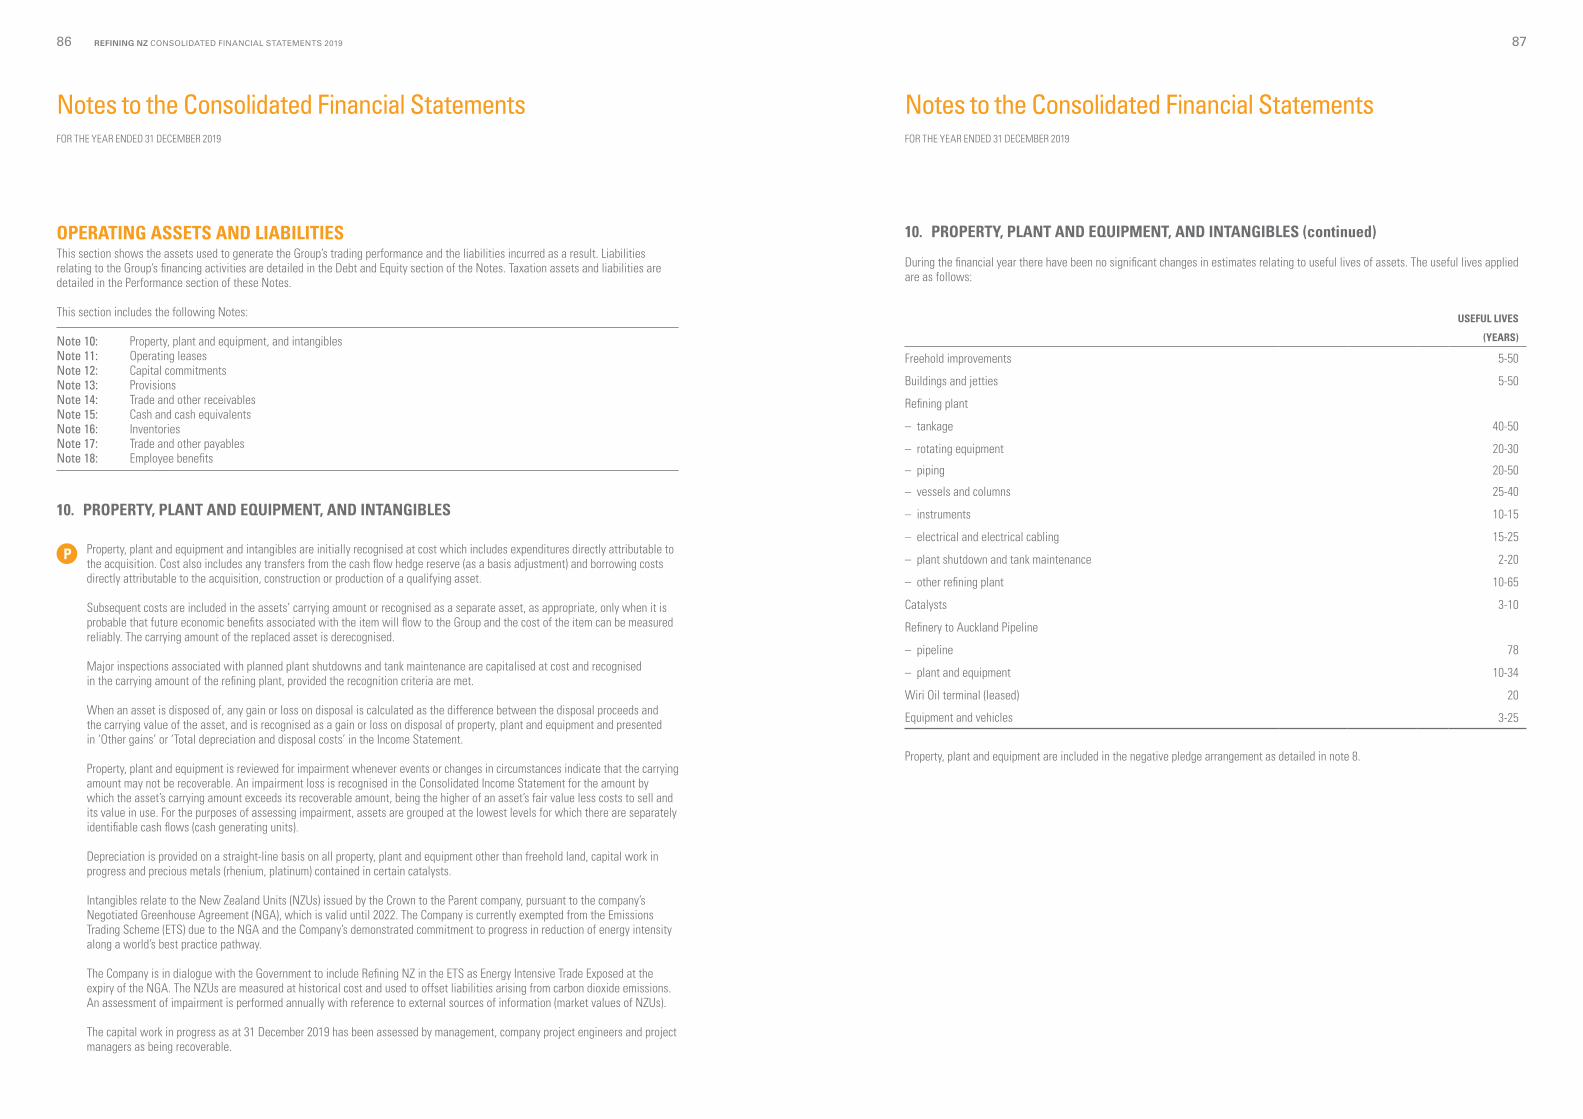
OPERATING ASSETS AND LIABILITIESThis section shows the assets used to generate the Group’s trading performance and the liabilities incurred as a result. Liabilities relating to the Group’s financing activities are detailed in the Debt and Equity section of the Notes. Taxation assets and liabilities are detailed in the Performance section of these Notes.
This section includes the following Notes:
Note 10: Property, plant and equipment, and intangiblesNote 11: Operating leasesNote 12: Capital commitmentsNote 13: ProvisionsNote 14: Trade and other receivablesNote 15: Cash and cash equivalentsNote 16: InventoriesNote 17: Trade and other payablesNote 18: Employee benefits
10. PROPERTY, PLANT AND EQUIPMENT, AND INTANGIBLES
P Property, plant and equipment and intangibles are initially recognised at cost which includes expenditures directly attributable to the acquisition. Cost also includes any transfers from the cash flow hedge reserve (as a basis adjustment) and borrowing costs directly attributable to the acquisition, construction or production of a qualifying asset.
Subsequent costs are included in the assets’ carrying amount or recognised as a separate asset, as appropriate, only when it is probable that future economic benefits associated with the item will flow to the Group and the cost of the item can be measured reliably. The carrying amount of the replaced asset is derecognised.
Major inspections associated with planned plant shutdowns and tank maintenance are capitalised at cost and recognised in the carrying amount of the refining plant, provided the recognition criteria are met.
When an asset is disposed of, any gain or loss on disposal is calculated as the difference between the disposal proceeds and the carrying value of the asset, and is recognised as a gain or loss on disposal of property, plant and equipment and presented in ‘Other gains’ or ‘Total depreciation and disposal costs’ in the Income Statement.
Property, plant and equipment is reviewed for impairment whenever events or changes in circumstances indicate that the carrying amount may not be recoverable. An impairment loss is recognised in the Consolidated Income Statement for the amount by which the asset’s carrying amount exceeds its recoverable amount, being the higher of an asset’s fair value less costs to sell and its value in use. For the purposes of assessing impairment, assets are grouped at the lowest levels for which there are separately identifiable cash flows (cash generating units).
Depreciation is provided on a straight-line basis on all property, plant and equipment other than freehold land, capital work in progress and precious metals (rhenium, platinum) contained in certain catalysts.
Intangibles relate to the New Zealand Units (NZUs) issued by the Crown to the Parent company, pursuant to the company’s Negotiated Greenhouse Agreement (NGA), which is valid until 2022. The Company is currently exempted from the Emissions Trading Scheme (ETS) due to the NGA and the Company’s demonstrated commitment to progress in reduction of energy intensity along a world’s best practice pathway.
The Company is in dialogue with the Government to include Refining NZ in the ETS as Energy Intensive Trade Exposed at the expiry of the NGA. The NZUs are measured at historical cost and used to offset liabilities arising from carbon dioxide emissions. An assessment of impairment is performed annually with reference to external sources of information (market values of NZUs).
The capital work in progress as at 31 December 2019 has been assessed by management, company project engineers and project managers as being recoverable.
10. PROPERTY, PLANT AND EQUIPMENT, AND INTANGIBLES (continued)
During the financial year there have been no significant changes in estimates relating to useful lives of assets. The useful lives applied are as follows:
USEFUL LIVES
(YEARS)
Freehold improvements 5-50
Buildings and jetties 5-50
Refining plant
– tankage 40-50
– rotating equipment 20-30
– piping 20-50
– vessels and columns 25-40
– instruments 10-15
– electrical and electrical cabling 15-25
– plant shutdown and tank maintenance 2-20
– other refining plant 10-65
Catalysts 3-10
Refinery to Auckland Pipeline
– pipeline 78
– plant and equipment 10-34
Wiri Oil terminal (leased) 20
Equipment and vehicles 3-25
Property, plant and equipment are included in the negative pledge arrangement as detailed in note 8.
REFINING NZ CONSOLIDATED FINANCIAL STATEMENTS 201986 87
Notes to the Consolidated Financial StatementsFOR THE YEAR ENDED 31 DECEMBER 2019
Notes to the Consolidated Financial StatementsFOR THE YEAR ENDED 31 DECEMBER 2019
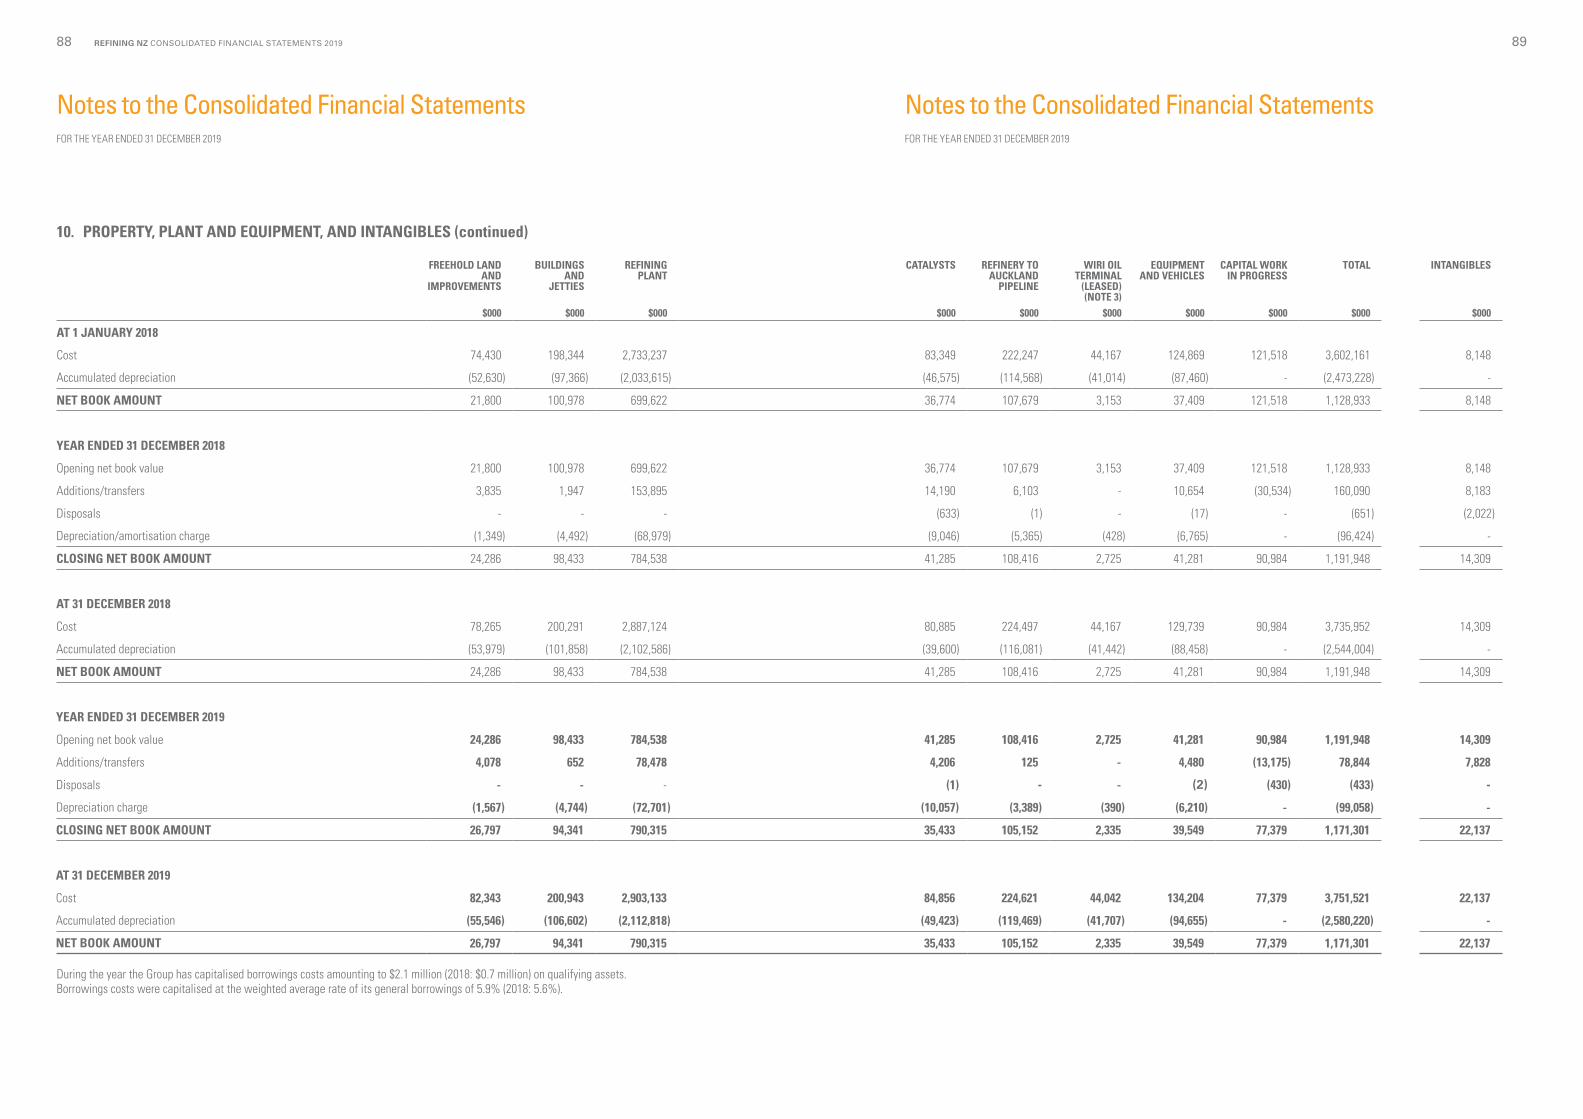
10. PROPERTY, PLANT AND EQUIPMENT, AND INTANGIBLES (continued)
FREEHOLD LAND AND
IMPROVEMENTS
BUILDINGSAND
JETTIES
REFININGPLANT
CATALYSTS REFINERY TO AUCKLAND
PIPELINE
WIRI OIL TERMINAL
(LEASED)(NOTE 3)
EQUIPMENT AND VEHICLES
CAPITAL WORK IN PROGRESS
TOTAL INTANGIBLES
$000 $000 $000 $000 $000 $000 $000 $000 $000 $000
AT 1 JANUARY 2018
Cost 74,430 198,344 2,733,237 83,349 222,247 44,167 124,869 121,518 3,602,161 8,148
Accumulated depreciation (52,630) (97,366) (2,033,615) (46,575) (114,568) (41,014) (87,460) - (2,473,228) -
NET BOOK AMOUNT 21,800 100,978 699,622 36,774 107,679 3,153 37,409 121,518 1,128,933 8,148
YEAR ENDED 31 DECEMBER 2018
Opening net book value 21,800 100,978 699,622 36,774 107,679 3,153 37,409 121,518 1,128,933 8,148
Additions/transfers 3,835 1,947 153,895 14,190 6,103 - 10,654 (30,534) 160,090 8,183
Disposals - - - (633) (1) - (17) - (651) (2,022)
Depreciation/amortisation charge (1,349) (4,492) (68,979) (9,046) (5,365) (428) (6,765) - (96,424) -
CLOSING NET BOOK AMOUNT 24,286 98,433 784,538 41,285 108,416 2,725 41,281 90,984 1,191,948 14,309
AT 31 DECEMBER 2018
Cost 78,265 200,291 2,887,124 80,885 224,497 44,167 129,739 90,984 3,735,952 14,309
Accumulated depreciation (53,979) (101,858) (2,102,586) (39,600) (116,081) (41,442) (88,458) - (2,544,004) -
NET BOOK AMOUNT 24,286 98,433 784,538 41,285 108,416 2,725 41,281 90,984 1,191,948 14,309
YEAR ENDED 31 DECEMBER 2019
Opening net book value 24,286 98,433 784,538 41,285 108,416 2,725 41,281 90,984 1,191,948 14,309
Additions/transfers 4,078 652 78,478 4,206 125 - 4,480 (13,175) 78,844 7,828
Disposals - - - (1) - - (2) (430) (433) -
Depreciation charge (1,567) (4,744) (72,701) (10,057) (3,389) (390) (6,210) - (99,058) -
CLOSING NET BOOK AMOUNT 26,797 94,341 790,315 35,433 105,152 2,335 39,549 77,379 1,171,301 22,137
AT 31 DECEMBER 2019
Cost 82,343 200,943 2,903,133 84,856 224,621 44,042 134,204 77,379 3,751,521 22,137
Accumulated depreciation (55,546) (106,602) (2,112,818) (49,423) (119,469) (41,707) (94,655) - (2,580,220) -
NET BOOK AMOUNT 26,797 94,341 790,315 35,433 105,152 2,335 39,549 77,379 1,171,301 22,137
During the year the Group has capitalised borrowings costs amounting to $2.1 million (2018: $0.7 million) on qualifying assets. Borrowings costs were capitalised at the weighted average rate of its general borrowings of 5.9% (2018: 5.6%).
REFINING NZ CONSOLIDATED FINANCIAL STATEMENTS 201988 89
Notes to the Consolidated Financial StatementsFOR THE YEAR ENDED 31 DECEMBER 2019
Notes to the Consolidated Financial StatementsFOR THE YEAR ENDED 31 DECEMBER 2019
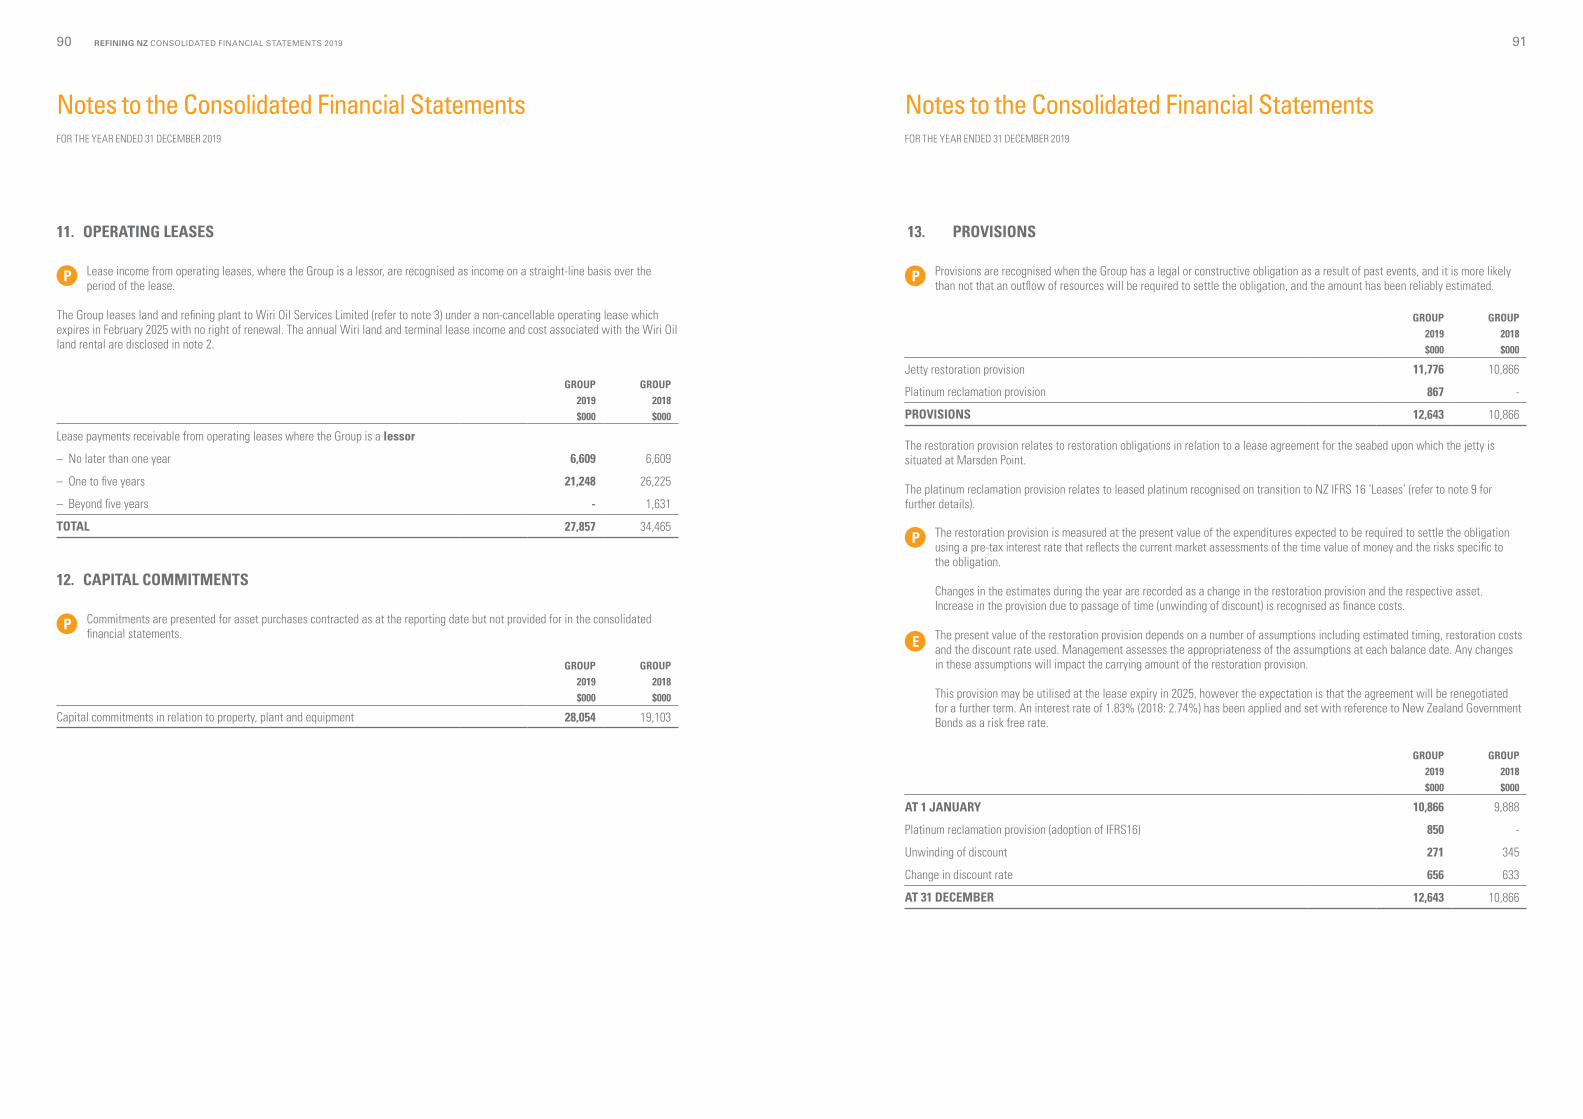
11. OPERATING LEASES
P Lease income from operating leases, where the Group is a lessor, are recognised as income on a straight-line basis over the period of the lease.
The Group leases land and refining plant to Wiri Oil Services Limited (refer to note 3) under a non-cancellable operating lease which expires in February 2025 with no right of renewal. The annual Wiri land and terminal lease income and cost associated with the Wiri Oil land rental are disclosed in note 2.
GROUP GROUP2019 2018$000 $000
Lease payments receivable from operating leases where the Group is a lessor
– No later than one year 6,609 6,609
– One to five years 21,248 26,225
– Beyond five years - 1,631
TOTAL 27,857 34,465
12. CAPITAL COMMITMENTS
P Commitments are presented for asset purchases contracted as at the reporting date but not provided for in the consolidated financial statements.
GROUP GROUP2019 2018$000 $000
Capital commitments in relation to property, plant and equipment 28,054 19,103
13. PROVISIONS
P Provisions are recognised when the Group has a legal or constructive obligation as a result of past events, and it is more likely than not that an outflow of resources will be required to settle the obligation, and the amount has been reliably estimated.
GROUP GROUP2019 2018$000 $000
Jetty restoration provision 11,776 10,866
Platinum reclamation provision 867 -
PROVISIONS 12,643 10,866
The restoration provision relates to restoration obligations in relation to a lease agreement for the seabed upon which the jetty is situated at Marsden Point.
The platinum reclamation provision relates to leased platinum recognised on transition to NZ IFRS 16 ‘Leases’ (refer to note 9 for further details).
P The restoration provision is measured at the present value of the expenditures expected to be required to settle the obligation using a pre-tax interest rate that reflects the current market assessments of the time value of money and the risks specific to the obligation.
Changes in the estimates during the year are recorded as a change in the restoration provision and the respective asset. Increase in the provision due to passage of time (unwinding of discount) is recognised as finance costs.
E The present value of the restoration provision depends on a number of assumptions including estimated timing, restoration costs and the discount rate used. Management assesses the appropriateness of the assumptions at each balance date. Any changes in these assumptions will impact the carrying amount of the restoration provision.
This provision may be utilised at the lease expiry in 2025, however the expectation is that the agreement will be renegotiated for a further term. An interest rate of 1.83% (2018: 2.74%) has been applied and set with reference to New Zealand Government Bonds as a risk free rate.
GROUP GROUP2019 2018$000 $000
AT 1 JANUARY 10,866 9,888
Platinum reclamation provision (adoption of IFRS16) 850 -
Unwinding of discount 271 345
Change in discount rate 656 633
AT 31 DECEMBER 12,643 10,866
REFINING NZ CONSOLIDATED FINANCIAL STATEMENTS 201990 91
Notes to the Consolidated Financial StatementsFOR THE YEAR ENDED 31 DECEMBER 2019
Notes to the Consolidated Financial StatementsFOR THE YEAR ENDED 31 DECEMBER 2019
15. CASH AND CASH EQUIVALENTS
P Cash and cash equivalents includes cash on hand, deposits held at call with financial institutions, other short-term, highly liquid investments with original maturities of three months or less that are readily convertible to known amounts of cash and which are subject to an insignificant risk of changes in value, and bank overdrafts.
In the Consolidated Statement of Cash Flows, the deposits placements and withdrawals and bank borrowings receipts and repayments are presented on a net basis as their turnover is quick, amounts are large and the maturities are relatively short.
The below presents a reconciliation of net cash flow from operating activities to reported profit:
GROUP GROUP2019 2018
NOTE $000 $000
NET PROFIT AFTER INCOME TAX 4,165 29,616
Adjusted for:
Depreciation and disposal costs 2 99,931 97,075
Movement in deferred tax 4(b) 1,522 8,165
Add movement in deferred tax on items included in other comprehensive income 4(b) (1,285) 2,287
Movement in provisions 13 1,777 978
Less increase in restoration provision relating to property, plant and equipment and right-of-use assets
13 (1,491) (633)
Employee share scheme entitlement reserve 21 241 303
Increase in intangibles 10 (7,828) (6,161)
Interest and other non-cash movements 620 (386)
Impact of changes in working capital items
Decrease in trade and other receivables 14 7,649 3,982
Increase/(decrease) in trade and other payables 17 18,457 (23,638)
Less (decrease)/increase in trade and other payables relating to property, plant and equipment and intangibles (712) 3,517
(Decrease)/increase in employee benefits 18 (9,280) 18,131
Less employee entitlements included in other comprehensive income 18(k) 7,681 (16,024)
(Increase) in income tax receivable (4,501) (9,847)
(Decrease)/increase in inventories 16 179 (2,729)
NET CASH INFLOW FROM OPERATING ACTIVITIES 117,125 104,636
14. TRADE AND OTHER RECEIVABLES
P Trade receivables are recognised initially at fair value and subsequently measured at amortised cost using the effective interest rate method, less impairment. Trade receivables are measured at amortised cost on the basis that they are held within a business model in order to collect, on specified dates, contractual payments of principal.
GROUP GROUP2019 2018
NOTE $000 $000
Processing fees 4,096 15,532
Product distribution 3,773 5,245
Other trade receivables 4,023 3,008
Excise duty 17 127,581 112,102
Derivatives pending settlement 1,645 11,599
Other receivables and prepayments 3,945 5,226
TOTAL TRADE AND OTHER RECEIVABLES 145,063 152,712
Trade receivables in respect of processing fees and distribution are due from customers, and non-interest bearing and are normally settled on 7 to 21 day terms.
Excise duty receivable is due from customers and collected by the Parent on behalf of the New Zealand Customs Service and paid on the same day each month (corresponding offset is presented as a payable in note 17).
Other receivables and prepayments generally arise from transactions outside the usual operating activities of the Group, for example prepaid insurance premiums.
The Group does not expect to have any contracts where the period between the transfer of the promised goods or services to the customer and payment by the customer exceeds one year. As a consequence, the Group does not adjust any of the transaction prices for the time value of money.
No allowance for impairment loss has been recognised as at 31 December 2019 (2018: Nil). Credit risk disclosures required pursuant to NZ IFRS 9 are outlined in note 19(b).
The carrying value of trade receivables approximates their fair values.
Trade and other receivables related party balances are disclosed in note 3.
REFINING NZ CONSOLIDATED FINANCIAL STATEMENTS 201992 93
Notes to the Consolidated Financial StatementsFOR THE YEAR ENDED 31 DECEMBER 2019
Notes to the Consolidated Financial StatementsFOR THE YEAR ENDED 31 DECEMBER 2019
16. INVENTORIES (continued)
E Inventories are reviewed annually for impairment. The inventory obsolescence depends on a number of assumptions, including age and condition of each of the individual inventory items. As at 31 December 2019 management has written down the carrying value of some inventories to estimated net realisable value, taking into account the above assumptions.
The consumption of inventories and any associated write downs are recognised as part of Purchase of process materials and utilities and Materials and contractor payments as disclosed in note 2.
Inventories are included in the negative pledge arrangement (refer note 8).
17. TRADE AND OTHER PAYABLES
P Trade payables, including collected excise duty, are initially recognised at amounts payable.
GROUP GROUP2019 2018
NOTE $000 $000
Trade payables 31,967 29,677
Goods services tax payable 1,847 3,783
Deferred income 10 9,623 6,999
Excise duty 14 127,581 112,102
TOTAL TRADE AND OTHER PAYABLES 171,018 152,561
Trade payables are unsecured, non-interest bearing and are usually paid within 30 days of recognition.
Changes to excise duties have no direct impact on the results of the Group as they are collected from the oil companies (note 14) and paid to the New Zealand Customs Service on the same day each month.
Deferred income relates to the New Zealand Units (NZUs) received in advance – refer to note 10.
Trade and other payables related party balances are disclosed in note 3.
15. CASH AND CASH EQUIVALENTS (continued)
The below sets out an analysis of the Group’s liabilities for which cash flows have been, or will be, classified as financing activities in the statement of cash flows:
CASH AND CASH
EQUIVALENTS
FINANCE LEASE DUE
WITHIN ONE YEAR
FINANCE LEASE DUE AFTER ONE
YEAR
BORROWINGS DUE WITHIN
ONE YEAR
BORROWINGS DUE AFTER ONE YEAR
TOTAL
$000 $000 $000 $000 $000 $000
NET DEBT AS AT 1 JANUARY 2018 (17,557) 222 2,473 - 170,000 155,138
Cash flows 16,778 - - - 88,601 105,379
Finance lease - (222) - - - (222)
Other non-cash movements - 171 (171) 50,000 (50,000) -
NET DEBT AS AT 1 JANUARY 2019 (779) 171 2,302 50,000 208,601 260,295
Cash flows (4,476) - - (50,000) 36,800 (17,676)
Finance lease - (171) (152) - - (323)
Adoption of IFRS 16 ‘Leases’ - 153 1,151 - - 1,304
Other non-cash movements - 95 (95) - 1,215 1,215
NET DEBT AS AT 31 DECEMBER 2019 (5,255) 248 3,206 - 246,616 244,815
Cash and cash equivalents include $4,777 thousand (2018: $2 thousand) held by Refining NZ’s electricity futures broker as collateral.
16. INVENTORIES
P Inventories comprise spare parts and consumables, and are stated at the lower of cost, determined using the weighted average cost method, or net realisable value.
Inventories are classified as current assets where usage is expected to be within 12 months and as non-current assets where usage is expected after 12 months.
GROUP GROUP2019 2018$000 $000
INVENTORIES
Current inventories:
Inventories at weighted average cost 3,774 3,471
Obsolescence provision (434) (497)
Total current inventories 3,340 2,974
Non-current inventories:
Inventories at weighted average cost 23,776 24,103
Obsolescence provision (4,366) (4,148)
Total non-current inventories 19,410 19,955
TOTAL INVENTORIES 22,750 22,929
REFINING NZ CONSOLIDATED FINANCIAL STATEMENTS 201994 95
Notes to the Consolidated Financial StatementsFOR THE YEAR ENDED 31 DECEMBER 2019
Notes to the Consolidated Financial StatementsFOR THE YEAR ENDED 31 DECEMBER 2019
18. EMPLOYEE BENEFITS (continued)
(a) Defined benefit pension plan
Nature of benefits
Total membership of the scheme as at 31 December 2019 was 196 (2018: 199). This total membership includes 66 (2018: 74) current staff members contributing to the scheme, who have pension entitlements based on final salary and membership. At retirement, members may elect to exchange part, or all, of their pension for a cash lump sum. The balance of the membership of the Plan is 123 (2018: 118) pensioners receiving regular pension payments; and 7 (2018: 7) members receiving disability pensions, which can be paid from the Plan until normal retirement age.
Description of regulatory framework
The Financial Markets Authority licenses and supervises regulated superannuation schemes. The Fund is an employer related restricted workplace savings scheme under the Financial Markets Conduct Act 2013 (the Act).
The Act requires an actuarial valuation to be performed for each defined benefit superannuation scheme at least every three years to assess whether the Company’s current level of contributions to the Plan is sufficient to meet future obligations (funding valuation). For detail regarding the latest funding valuation see note 18(h).
At each balance date an accounting update is performed by an independent actuary in accordance with NZ IAS 19 “Employee Benefits” for recording in the Consolidated Balance Sheet. The last full actuarial valuation performed under the Superannuation Schemes Act 1989 was as at 31 March 2019. Description of other entities’ responsibilities for the governance of the fund
The Trustees of the Fund are responsible for the governance of the Fund. The Trustees are appointed by the Company and have a legal obligation to act solely in the best interests of the Fund beneficiaries. The Trustees have the following roles:• Administration of the Fund and payment to the beneficiaries from Plan assets when required in accordance with the Plan rules.• Management and investment of the Plan assets.• Compliance with superannuation law and other applicable regulations.
Description of risks
Under the defined benefit pension plan the Group has a legal obligation to pay further contributions if the Fund does not hold sufficient assets to pay all employees the benefits they are entitled to. There are a number of risks that could expose the Company to such a shortfall; the more significant risks being:• Investment returns – the funding valuation assumes a certain return on assets, which will be available to fund liabilities. Lower
than assumed returns could require the Company to increase contributions to offset the shortfall.• Life expectancy – the majority of the Plan’s obligations are to provide benefits for the life of the member, so increases in life
expectancy will result in an increase in the Plan’s liabilities.
The Plan liabilities are calculated, for financial reporting purposes, using a discount rate set with reference to New Zealand Government Bonds. A decrease in the government bond yield will increase Plan liabilities for financial reporting purposes, but not necessarily impact upon the funding requirements of the Company.
Description of significant events
There were no Fund amendments, curtailments or settlements during 2019 (2018: Nil).
18. EMPLOYEE BENEFITS
Liabilities for employee benefits comprise the following:
2019 2018
CURRENT NON- CURRENT
TOTAL CURRENT NON- CURRENT
TOTAL
NOTE $000 $000 $000 $000 $000 $000
Defined benefit pension plan 18(b) - 24,907 24,907 - 34,428 34,428
Medical plan 18(b) 104 9,958 10,062 207 7,990 8,197
Wages, salaries, annual leave and sick leave 6,610 - 6,610 5,737 - 5,737
Employee incentive scheme - - - 2,905 - 2,905
Long-service leave and retirement bonus 1,147 6,029 7,176 1,099 5,669 6,768
TOTAL 7,861 40,894 48,755 9,948 48,087 58,035
P Defined benefit pension plan (scheme closed since 31 December 2002)
The Parent contributes to a defined benefit pension plan (the “Plan”) for eligible employees. The liability recognised in the Consolidated Balance Sheet in respect of the defined benefit pension plan is the present value of the defined benefit pension plan obligation at the balance date less the fair value of plan assets.
The defined benefit pension plan obligation is calculated annually by independent actuaries using the projected unit credit method. The present value of the defined benefit pension plan obligation is determined by discounting the estimated future cash outflows using interest rates of government bonds that have terms to maturity approximating the terms of the related pension liability.
Actuarial gains and losses arising from experience adjustments and changes in actuarial assumptions are charged or credited to equity in other comprehensive income in the period in which they arise.
Past-service costs are recognised immediately in the Consolidated Income Statement.
P Medical plan (scheme closed since 1996)
The Parent pays health insurance premiums in respect of 21 former and current employees when they retire, until their death. This arrangement is no longer offered to new employees. The medical plan is accounted for in a similar manner to the defined benefit plan outlined above, with an accounting valuation performed by an independent actuary at each balance date.
P Wages, salaries, annual leave and sick leave
These liabilities are measured at the amounts expected to be paid when settled.
P Employee incentive schemes
The Company offers a short term incentive scheme to eligible employees which recognises both individual and Company performance.
The Group recognises a provision where contractually obliged or where there is past practice that has created a constructive obligation.
P Long-service leave and retirement bonus
Long service leave and retirement bonuses are measured based on an actuarial assessment and represent the present value of the estimated future cash outflows, which are expected as a result of employee services provided up to the balance date.
REFINING NZ CONSOLIDATED FINANCIAL STATEMENTS 201996 97
Notes to the Consolidated Financial StatementsFOR THE YEAR ENDED 31 DECEMBER 2019
Notes to the Consolidated Financial StatementsFOR THE YEAR ENDED 31 DECEMBER 2019

18. EMPLOYEE BENEFITS (continued)
MEDICAL PLAN PENSION PLANPRESENT VALUE OF
OBLIGATION
FAIR VALUE OF PLAN ASSETS
TOTAL PRESENT VALUE OF
OBLIGATION
FAIR VALUE OF PLAN ASSETS
TOTAL
NOTE $000 $000 $000 $000 $000 $000
AT 1 JANUARY 2019 EXCLUDING TAXES (8,197) - (8,197) (106,120) 83,054 (23,066)
Current service cost 18(j) - - - (1,902) - (1,902)
Interest (expense)/income 18(j) (226) - (226) (2,552) 1,985 (567)
Remeasurements
– Actual return on plan assets less interest income 18(k) - - - - 9,893 9,893
– Actuarial losses arising from changes in financial assumptions (550) - (550) (2,754) - (2,754)
– Actuarial losses arising from changes in demographic assumptions - - - 44 - 44
– Actuarial (losses)/gains arising from liability experience (1,375) - (1,375) (748) - (748)
DEFINED BENEFIT ACTUARIAL GAIN/(LOSS) 18(k) (1,925) - (1,925) (3,458) 9,893 6,435
Contributions:
– Employers - - - - 2,411 2,411
– Plan participants - - - (453) 453 -
Benefits paid 286 - 286 5,735 (5,735) -
Premiums and expenses paid - - - 427 (427) -
NET LIABILITY EXCLUDING TAXES 31 DECEMBER 2019 (10,062) - (10,062) (108,322) 91,634 (16,688)
(d) Fair value of defined benefit pension plan assets SIGNIFICANT
INPUTS LEVEL 2
$000
Net current assets/(liabilities) 1,876
Debt instruments 8,540
Investment Funds – Composite Funds 81,218
TOTAL ASSETS 91,634
18. EMPLOYEE BENEFITS (continued)
(b) Reconciliation of the medical plan and pension plan net liabilities
MEDICAL PLAN PENSION PLAN2019 2018 2019 2018
NOTE $000 $000 $000 $000
Present value of the defined benefit obligation 18(c) (10,062) (8,197) (108,322) (106,120)
Fair value of plan assets 18(c),18(d) - - 91,634 83,054
DEFICIT (10,062) (8,197) (16,688) (23,066)
Contributions tax - - (8,219) (11,362)
LIABILITY IN THE BALANCE SHEET (10,062) (8,197) (24,907) (34,428)
(c) Movements in the net liabilities recognised in the Balance Sheet
MEDICAL PLAN PENSION PLANPRESENT VALUE OF
OBLIGATION
FAIR VALUE OF PLAN ASSETS
TOTAL PRESENT VALUE OF
OBLIGATION
FAIR VALUE OF PLAN ASSETS
TOTAL
NOTE $000 $000 $000 $000 $000 $000
AT 1 JANUARY 2018 EXCLUDING TAXES (7,422) - (7,422) (104,436) 93,282 (11,154)
Current service cost 18(j) - - - (1,863) - (1,863)
Interest (expense)/income 18(j) (242) - (242) (3,012) 2,682 (330)
Remeasurements
– Actual return on plan assets less interest income 18(k) - - - - (4,607) (4,607)
– Actuarial losses arising from changes in financial assumptions (665) - (665) (6,185) - (6,185)
– Actuarial (losses)/gains arising from liability experience (61) - (61) 543 - 543
DEFINED BENEFIT ACTUARIAL GAIN/(LOSS) 18(k) (726) - (726) (5,642) (4,607) (10,249)
Contributions:
– Employers - - - - 529 529
– Plan participants - - - (482) 482 -
Benefits paid 193 - 193 9,043 (9,043) -
Premiums and expenses paid - - - 271 (271) - NET LIABILITY EXCLUDING TAXES 31 DECEMBER 2018 (8,197) - (8,197) (106,120) 83,054 (23,066)
REFINING NZ CONSOLIDATED FINANCIAL STATEMENTS 201998 99
Notes to the Consolidated Financial StatementsFOR THE YEAR ENDED 31 DECEMBER 2019
Notes to the Consolidated Financial StatementsFOR THE YEAR ENDED 31 DECEMBER 2019
18. EMPLOYEE BENEFITS (continued)
The percentage invested in each asset class at the balance date are:
PENSION PLAN2019 2018
Australasian Equity 10.3% 10.1%
International Equity 33.3% 31.2%
Fixed Income 33.3% 36.4%
Cash 11.3% 10.5%
Property and Other 11.8% 11.8%
The fair value of plan assets includes no amounts relating to:• Any of the Group’s own financial instruments;• Any property occupied by, or other assets used by, the Group.
(e) Principal actuarial assumptions at the balance sheet date
E The present value of the defined benefit pension plan obligation depends on a number of factors that are determined by an independent actuary using a number of assumptions, including the expected rate of salary increases, mortality in retirement and an appropriate discount rate. These assumptions are determined by the Group, in consultation with the independent actuary who performs an accounting valuation in accordance with NZ IAS 19 ‘Employee Benefits’ at each balance date. Any changes in these assumptions will impact the carrying amount of pension obligations.
As at 31 December 2019 the following actuarial assumptions were applied:
2019 2018MEDICAL PLAN PENSION PLAN MEDICAL PLAN PENSION PLAN
Discount rate 2.1% 2.0% 2.8% 2.5%
Expected rate of future salary increases - 2.5% - 2.5%
Pension increases - No provision - No provision
Mortality in retirement New Zealand Life Tables 2012-2014 mortality table, set back by 1 year, together with an age related
future mortality improvement scale.
Health insurance premium 8.0% - 8.0% -
Rate of Fringe Benefit Tax 42.86%-49.25% - 49.25% -
18. EMPLOYEE BENEFITS (continued)
(f) Sensitivity analysis – pension plan
The sensitivity of the defined benefit obligation to changes in the principal assumptions is shown in the graphs below.
(12,004)
(11,760)
1% DISCOUNT RATE INCREASE ($000) 1% DISCOUNT RATE DECREASE ($000)14,876
14,574
(2,163)
(2,119)
1 YEAR DECREASE IN LIFE EXPECTANCY ($000) 1 YEAR INCREASE IN LIFE EXPECTANCY ($000)2,145
2,102
(2,994)
(2,933)
1% SALARY DECREASE ($000) 1% SALARY INCREASE ($000) 3,311
3,244
2019 increase/(decrease) in defined benefit obligation
2018 increase/(decrease) in defined benefit obligation
The above sensitivity analysis is based on a change in an assumption while holding all other assumptions constant. In practice, this is unlikely to occur, and changes in some of the assumptions may be correlated.
The methods and types of assumptions used in preparing the sensitivity analysis are consistent with those applied during the comparative reporting period.
(g) Maturity profile of defined benefit obligation
The average term at which the expected future discounted cash flows are due is 13 years (2018: 12 years). The average undiscounted expected term of all liabilities is 15 years (2018: 16 years).
(h) Funding arrangements
The Actuary determines the Pension Plan’s financial position (funding valuation) every three years in accordance with the Financial Markets Conduct Act 2013. The last funding valuation was completed as at 31 March 2019, at which time the Plan was fully funded based on the assumptions used by the Actuary. These assumptions were consistent with the actuarial assumptions presented in note 18(e), except for the discount rate determined based on the expected long term future returns of the plan rather than the risk free rate of return.
The funding objective adopted at the 31 March 2019 funding valuation is to ensure that the Fund’s assets are not less than the value of accrued benefits. The Company contributes a fixed amount of $1.5 million (including contributions tax at 33%) and a lump sum contribution to fund new disability pensions. The next statutory valuation is due no later than 31 March 2022.
REFINING NZ CONSOLIDATED FINANCIAL STATEMENTS 2019100 101
Notes to the Consolidated Financial StatementsFOR THE YEAR ENDED 31 DECEMBER 2019
Notes to the Consolidated Financial StatementsFOR THE YEAR ENDED 31 DECEMBER 2019
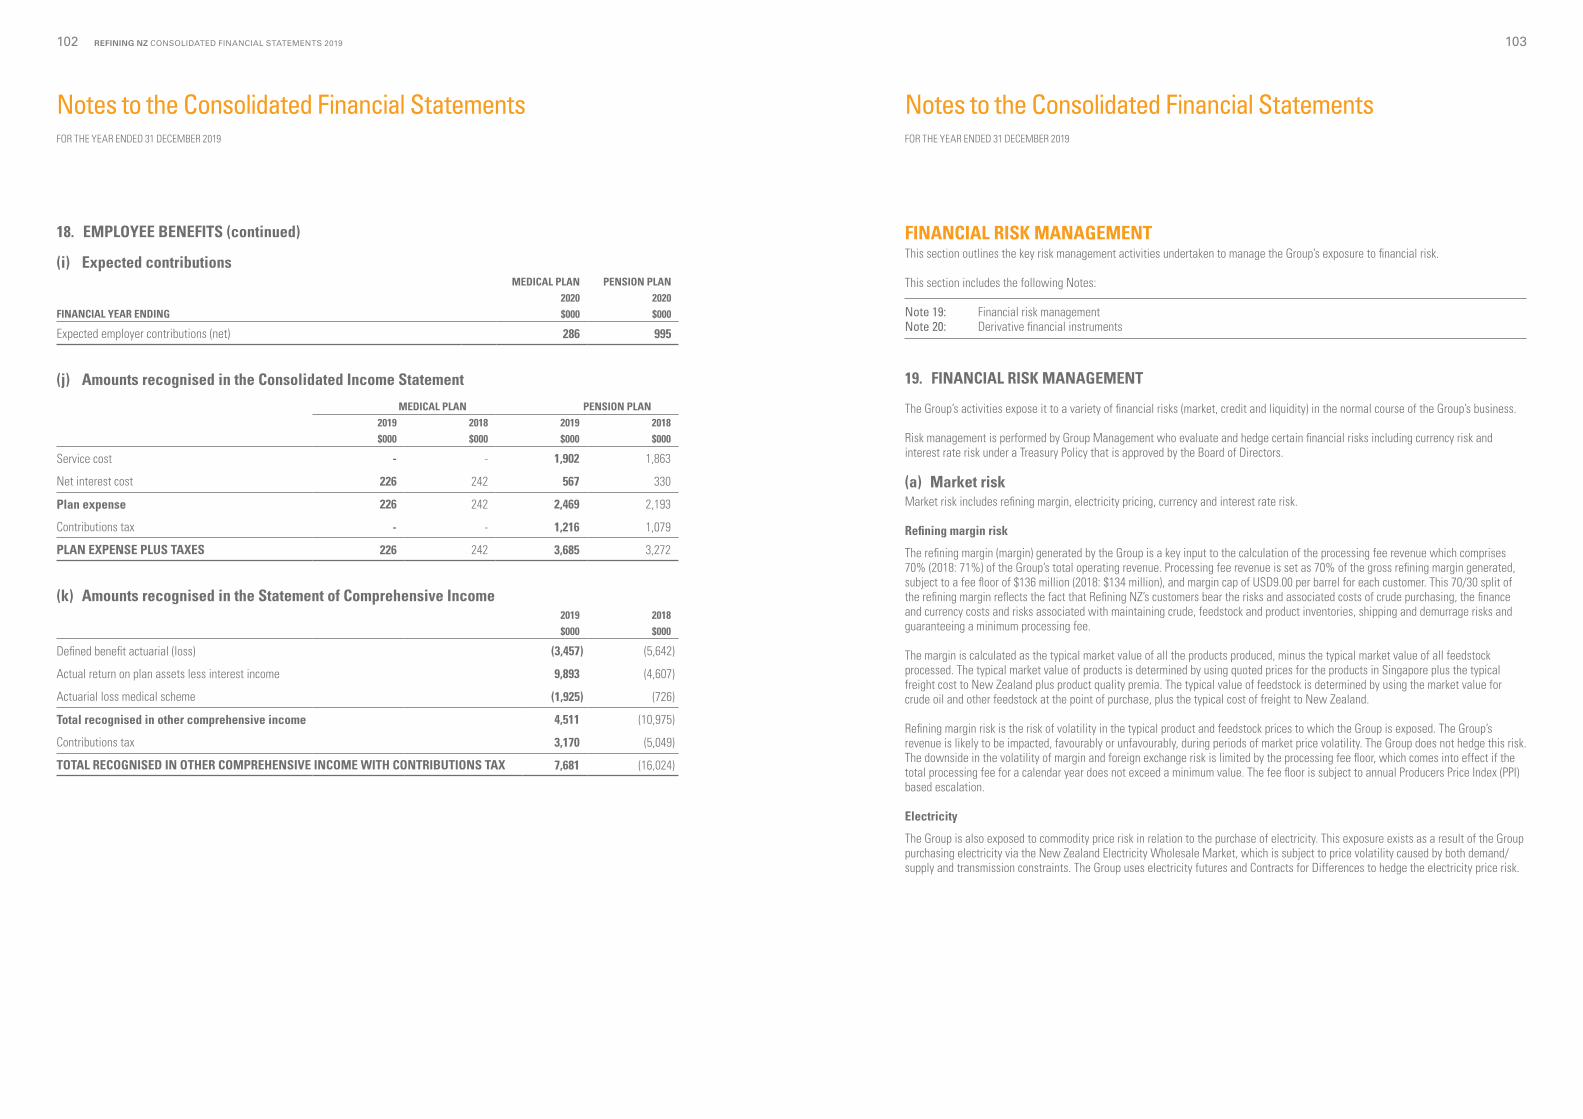
FINANCIAL RISK MANAGEMENTThis section outlines the key risk management activities undertaken to manage the Group’s exposure to financial risk.
This section includes the following Notes:
Note 19: Financial risk managementNote 20: Derivative financial instruments
19. FINANCIAL RISK MANAGEMENT
The Group’s activities expose it to a variety of financial risks (market, credit and liquidity) in the normal course of the Group’s business.
Risk management is performed by Group Management who evaluate and hedge certain financial risks including currency risk and interest rate risk under a Treasury Policy that is approved by the Board of Directors.
(a) Market riskMarket risk includes refining margin, electricity pricing, currency and interest rate risk.
Refining margin risk
The refining margin (margin) generated by the Group is a key input to the calculation of the processing fee revenue which comprises 70% (2018: 71%) of the Group’s total operating revenue. Processing fee revenue is set as 70% of the gross refining margin generated, subject to a fee floor of $136 million (2018: $134 million), and margin cap of USD9.00 per barrel for each customer. This 70/30 split of the refining margin reflects the fact that Refining NZ’s customers bear the risks and associated costs of crude purchasing, the finance and currency costs and risks associated with maintaining crude, feedstock and product inventories, shipping and demurrage risks and guaranteeing a minimum processing fee.
The margin is calculated as the typical market value of all the products produced, minus the typical market value of all feedstock processed. The typical market value of products is determined by using quoted prices for the products in Singapore plus the typical freight cost to New Zealand plus product quality premia. The typical value of feedstock is determined by using the market value for crude oil and other feedstock at the point of purchase, plus the typical cost of freight to New Zealand.
Refining margin risk is the risk of volatility in the typical product and feedstock prices to which the Group is exposed. The Group’s revenue is likely to be impacted, favourably or unfavourably, during periods of market price volatility. The Group does not hedge this risk. The downside in the volatility of margin and foreign exchange risk is limited by the processing fee floor, which comes into effect if the total processing fee for a calendar year does not exceed a minimum value. The fee floor is subject to annual Producers Price Index (PPI) based escalation.
Electricity
The Group is also exposed to commodity price risk in relation to the purchase of electricity. This exposure exists as a result of the Group purchasing electricity via the New Zealand Electricity Wholesale Market, which is subject to price volatility caused by both demand/supply and transmission constraints. The Group uses electricity futures and Contracts for Differences to hedge the electricity price risk.
18. EMPLOYEE BENEFITS (continued)
(i) Expected contributionsMEDICAL PLAN PENSION PLAN
2020 2020FINANCIAL YEAR ENDING $000 $000
Expected employer contributions (net) 286 995
(j) Amounts recognised in the Consolidated Income Statement
MEDICAL PLAN PENSION PLAN2019 2018 2019 2018$000 $000 $000 $000
Service cost - - 1,902 1,863
Net interest cost 226 242 567 330
Plan expense 226 242 2,469 2,193
Contributions tax - - 1,216 1,079
PLAN EXPENSE PLUS TAXES 226 242 3,685 3,272
(k) Amounts recognised in the Statement of Comprehensive Income2019 2018$000 $000
Defined benefit actuarial (loss) (3,457) (5,642)
Actual return on plan assets less interest income 9,893 (4,607)
Actuarial loss medical scheme (1,925) (726)
Total recognised in other comprehensive income 4,511 (10,975)
Contributions tax 3,170 (5,049)
TOTAL RECOGNISED IN OTHER COMPREHENSIVE INCOME WITH CONTRIBUTIONS TAX 7,681 (16,024)
REFINING NZ CONSOLIDATED FINANCIAL STATEMENTS 2019102 103
Notes to the Consolidated Financial StatementsFOR THE YEAR ENDED 31 DECEMBER 2019
Notes to the Consolidated Financial StatementsFOR THE YEAR ENDED 31 DECEMBER 2019
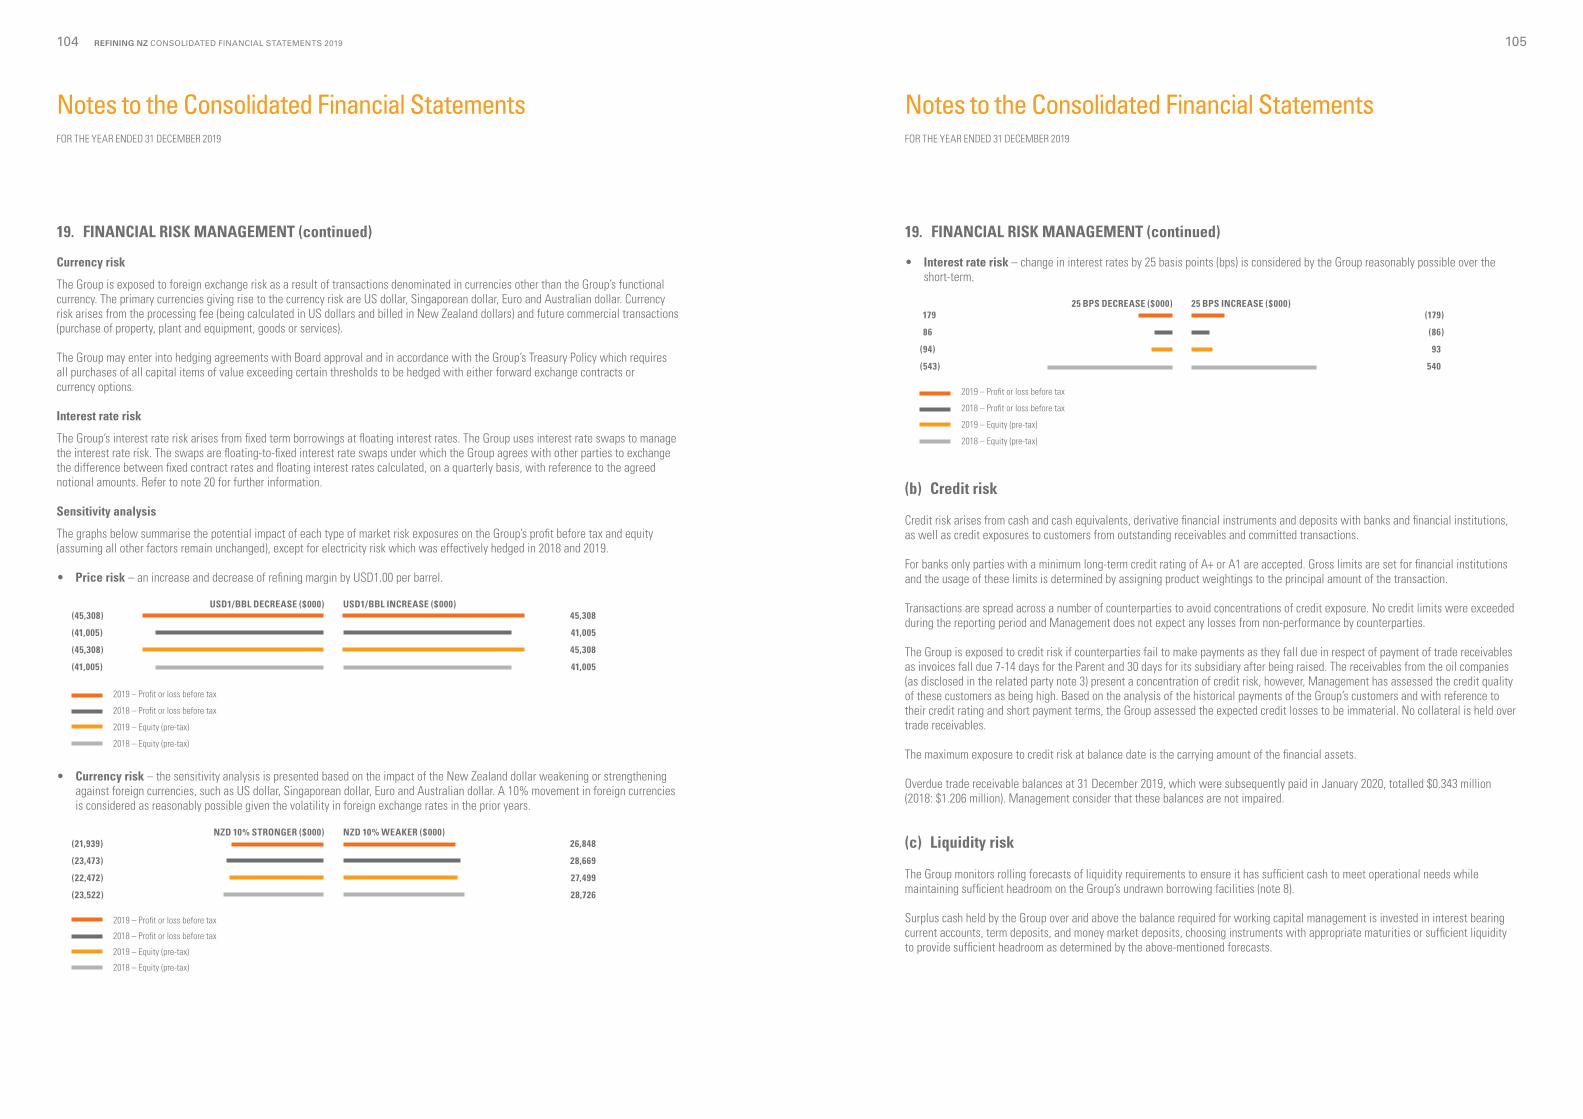
19. FINANCIAL RISK MANAGEMENT (continued)
Currency risk
The Group is exposed to foreign exchange risk as a result of transactions denominated in currencies other than the Group’s functional currency. The primary currencies giving rise to the currency risk are US dollar, Singaporean dollar, Euro and Australian dollar. Currency risk arises from the processing fee (being calculated in US dollars and billed in New Zealand dollars) and future commercial transactions (purchase of property, plant and equipment, goods or services).
The Group may enter into hedging agreements with Board approval and in accordance with the Group’s Treasury Policy which requires all purchases of all capital items of value exceeding certain thresholds to be hedged with either forward exchange contracts or currency options.
Interest rate risk
The Group’s interest rate risk arises from fixed term borrowings at floating interest rates. The Group uses interest rate swaps to manage the interest rate risk. The swaps are floating-to-fixed interest rate swaps under which the Group agrees with other parties to exchange the difference between fixed contract rates and floating interest rates calculated, on a quarterly basis, with reference to the agreed notional amounts. Refer to note 20 for further information.
Sensitivity analysis
The graphs below summarise the potential impact of each type of market risk exposures on the Group’s profit before tax and equity (assuming all other factors remain unchanged), except for electricity risk which was effectively hedged in 2018 and 2019.
• Price risk – an increase and decrease of refining margin by USD1.00 per barrel.
(45,308)
(41,005)
(45,308)
(41,005)
USD1/BBL DECREASE ($000) USD1/BBL INCREASE ($000)45,308
41,005
45,308
41,005
2019 – Profit or loss before tax
2018 – Profit or loss before tax
2019 – Equity (pre-tax)
2018 – Equity (pre-tax)
• Currency risk – the sensitivity analysis is presented based on the impact of the New Zealand dollar weakening or strengthening against foreign currencies, such as US dollar, Singaporean dollar, Euro and Australian dollar. A 10% movement in foreign currencies is considered as reasonably possible given the volatility in foreign exchange rates in the prior years.
(21,939)
(23,473)
(22,472)
(23,522)
NZD 10% STRONGER ($000) NZD 10% WEAKER ($000)26,848
28,669
27,499
28,726
2019 – Profit or loss before tax
2018 – Profit or loss before tax
2019 – Equity (pre-tax)
2018 – Equity (pre-tax)
19. FINANCIAL RISK MANAGEMENT (continued)
• Interest rate risk – change in interest rates by 25 basis points (bps) is considered by the Group reasonably possible over the short-term.
(179
(86
(94)
(543)
25 BPS DECREASE ($000) 25 BPS INCREASE ($000)(179)
(86)
93)
540)
2019 – Profit or loss before tax
2018 – Profit or loss before tax
2019 – Equity (pre-tax)
2018 – Equity (pre-tax)
(b) Credit risk
Credit risk arises from cash and cash equivalents, derivative financial instruments and deposits with banks and financial institutions, as well as credit exposures to customers from outstanding receivables and committed transactions.
For banks only parties with a minimum long-term credit rating of A+ or A1 are accepted. Gross limits are set for financial institutions and the usage of these limits is determined by assigning product weightings to the principal amount of the transaction.
Transactions are spread across a number of counterparties to avoid concentrations of credit exposure. No credit limits were exceeded during the reporting period and Management does not expect any losses from non-performance by counterparties.
The Group is exposed to credit risk if counterparties fail to make payments as they fall due in respect of payment of trade receivables as invoices fall due 7-14 days for the Parent and 30 days for its subsidiary after being raised. The receivables from the oil companies (as disclosed in the related party note 3) present a concentration of credit risk, however, Management has assessed the credit quality of these customers as being high. Based on the analysis of the historical payments of the Group’s customers and with reference to their credit rating and short payment terms, the Group assessed the expected credit losses to be immaterial. No collateral is held over trade receivables.
The maximum exposure to credit risk at balance date is the carrying amount of the financial assets.
Overdue trade receivable balances at 31 December 2019, which were subsequently paid in January 2020, totalled $0.343 million (2018: $1.206 million). Management consider that these balances are not impaired.
(c) Liquidity risk
The Group monitors rolling forecasts of liquidity requirements to ensure it has sufficient cash to meet operational needs while maintaining sufficient headroom on the Group’s undrawn borrowing facilities (note 8).
Surplus cash held by the Group over and above the balance required for working capital management is invested in interest bearing current accounts, term deposits, and money market deposits, choosing instruments with appropriate maturities or sufficient liquidity to provide sufficient headroom as determined by the above-mentioned forecasts.
REFINING NZ CONSOLIDATED FINANCIAL STATEMENTS 2019104 105
Notes to the Consolidated Financial StatementsFOR THE YEAR ENDED 31 DECEMBER 2019
Notes to the Consolidated Financial StatementsFOR THE YEAR ENDED 31 DECEMBER 2019
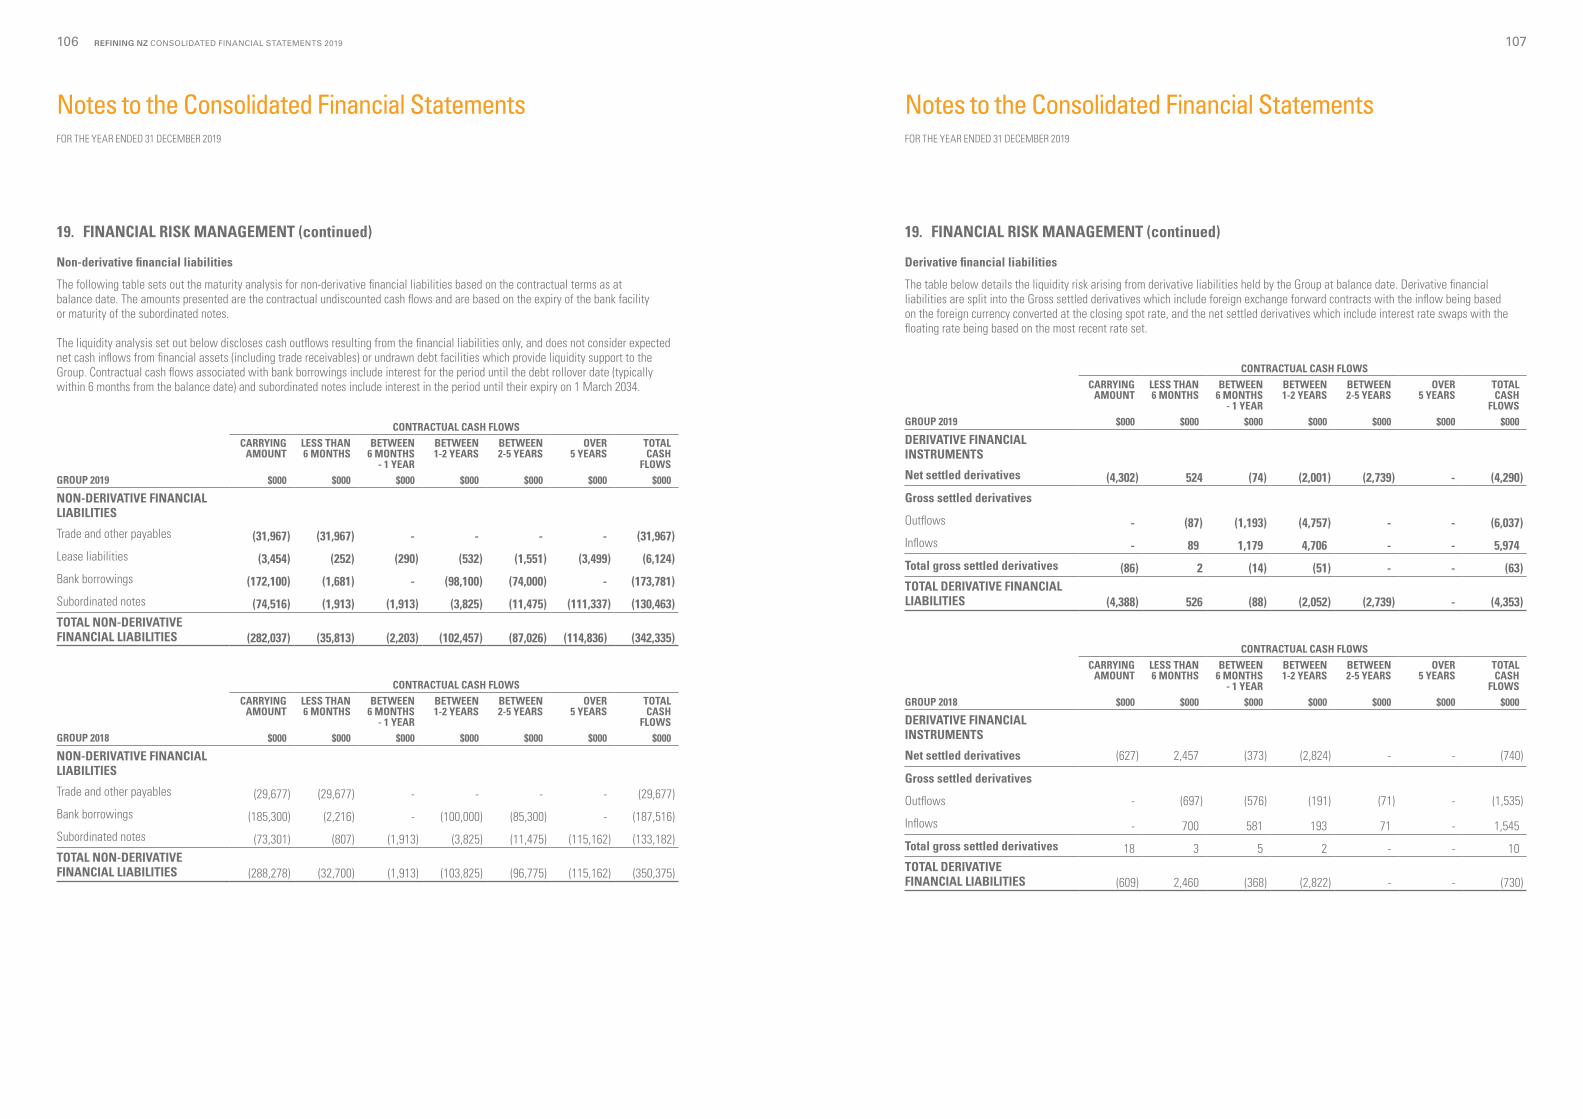
19. FINANCIAL RISK MANAGEMENT (continued)
Derivative financial liabilities
The table below details the liquidity risk arising from derivative liabilities held by the Group at balance date. Derivative financial liabilities are split into the Gross settled derivatives which include foreign exchange forward contracts with the inflow being based on the foreign currency converted at the closing spot rate, and the net settled derivatives which include interest rate swaps with the floating rate being based on the most recent rate set.
CONTRACTUAL CASH FLOWSCARRYING
AMOUNTLESS THAN 6 MONTHS
BETWEEN 6 MONTHS
- 1 YEAR
BETWEEN 1-2 YEARS
BETWEEN 2-5 YEARS
OVER 5 YEARS
TOTAL CASH
FLOWSGROUP 2019 $000 $000 $000 $000 $000 $000 $000
DERIVATIVE FINANCIAL INSTRUMENTS
Net settled derivatives (4,302) 524 (74) (2,001) (2,739) - (4,290)
Gross settled derivatives
Outflows - (87) (1,193) (4,757) - - (6,037)
Inflows - 89 1,179 4,706 - - 5,974
Total gross settled derivatives (86) 2 (14) (51) - - (63)TOTAL DERIVATIVE FINANCIAL LIABILITIES (4,388) 526 (88) (2,052) (2,739) - (4,353)
CONTRACTUAL CASH FLOWSCARRYING
AMOUNTLESS THAN 6 MONTHS
BETWEEN 6 MONTHS
- 1 YEAR
BETWEEN 1-2 YEARS
BETWEEN 2-5 YEARS
OVER 5 YEARS
TOTAL CASH
FLOWSGROUP 2018 $000 $000 $000 $000 $000 $000 $000
DERIVATIVE FINANCIAL INSTRUMENTS
Net settled derivatives (627) 2,457 (373) (2,824) - - (740)
Gross settled derivatives
Outflows - (697) (576) (191) (71) - (1,535)
Inflows - 700 581 193 71 - 1,545
Total gross settled derivatives 18 3 5 2 - - 10 TOTAL DERIVATIVE FINANCIAL LIABILITIES (609) 2,460 (368) (2,822) - - (730)
19. FINANCIAL RISK MANAGEMENT (continued)
Non-derivative financial liabilities
The following table sets out the maturity analysis for non-derivative financial liabilities based on the contractual terms as at balance date. The amounts presented are the contractual undiscounted cash flows and are based on the expiry of the bank facility or maturity of the subordinated notes.
The liquidity analysis set out below discloses cash outflows resulting from the financial liabilities only, and does not consider expected net cash inflows from financial assets (including trade receivables) or undrawn debt facilities which provide liquidity support to the Group. Contractual cash flows associated with bank borrowings include interest for the period until the debt rollover date (typically within 6 months from the balance date) and subordinated notes include interest in the period until their expiry on 1 March 2034.
CONTRACTUAL CASH FLOWSCARRYING
AMOUNTLESS THAN 6 MONTHS
BETWEEN 6 MONTHS
- 1 YEAR
BETWEEN 1-2 YEARS
BETWEEN 2-5 YEARS
OVER 5 YEARS
TOTAL CASH
FLOWSGROUP 2019 $000 $000 $000 $000 $000 $000 $000
NON-DERIVATIVE FINANCIAL LIABILITIES
Trade and other payables (31,967) (31,967) - - - - (31,967)
Lease liabilities (3,454) (252) (290) (532) (1,551) (3,499) (6,124)
Bank borrowings (172,100) (1,681) - (98,100) (74,000) - (173,781)
Subordinated notes (74,516) (1,913) (1,913) (3,825) (11,475) (111,337) (130,463)TOTAL NON-DERIVATIVE FINANCIAL LIABILITIES (282,037) (35,813) (2,203) (102,457) (87,026) (114,836) (342,335)
CONTRACTUAL CASH FLOWSCARRYING
AMOUNTLESS THAN 6 MONTHS
BETWEEN 6 MONTHS
- 1 YEAR
BETWEEN 1-2 YEARS
BETWEEN 2-5 YEARS
OVER 5 YEARS
TOTAL CASH
FLOWSGROUP 2018 $000 $000 $000 $000 $000 $000 $000
NON-DERIVATIVE FINANCIAL LIABILITIES
Trade and other payables (29,677) (29,677) - - - - (29,677)
Bank borrowings (185,300) (2,216) - (100,000) (85,300) - (187,516)
Subordinated notes (73,301) (807) (1,913) (3,825) (11,475) (115,162) (133,182)TOTAL NON-DERIVATIVE FINANCIAL LIABILITIES (288,278) (32,700) (1,913) (103,825) (96,775) (115,162) (350,375)
REFINING NZ CONSOLIDATED FINANCIAL STATEMENTS 2019106 107
Notes to the Consolidated Financial StatementsFOR THE YEAR ENDED 31 DECEMBER 2019
Notes to the Consolidated Financial StatementsFOR THE YEAR ENDED 31 DECEMBER 2019
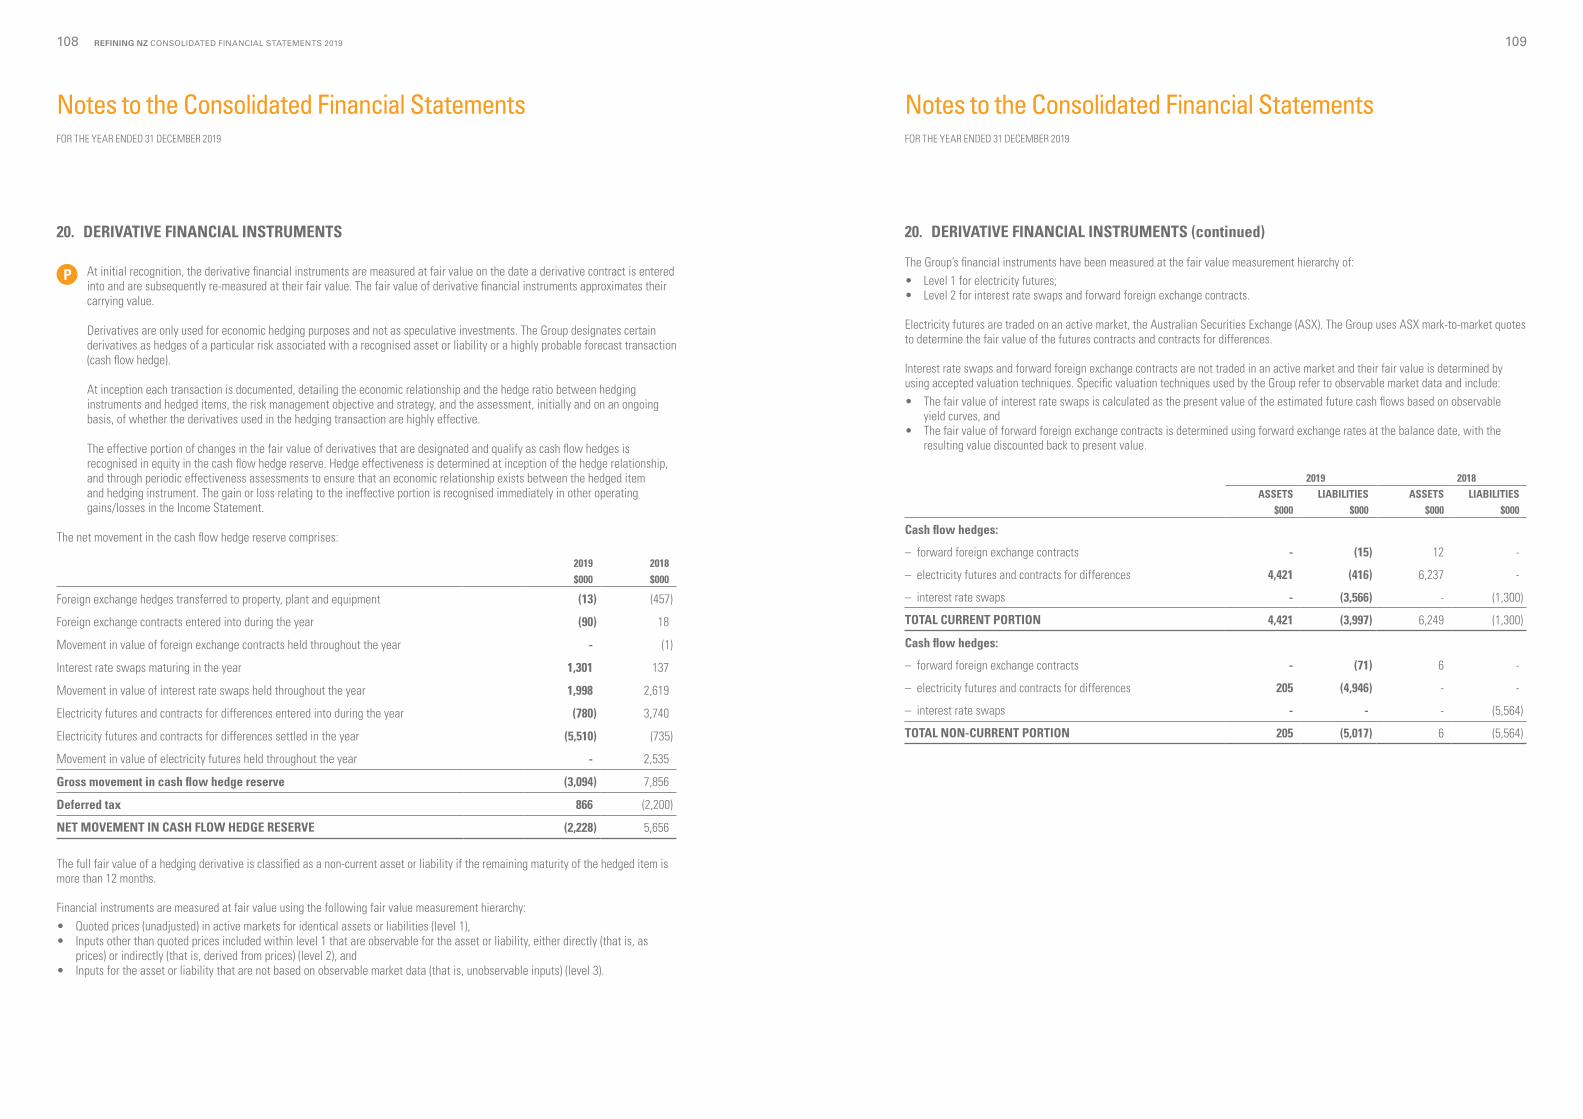
20. DERIVATIVE FINANCIAL INSTRUMENTS (continued)
The Group’s financial instruments have been measured at the fair value measurement hierarchy of:• Level 1 for electricity futures;• Level 2 for interest rate swaps and forward foreign exchange contracts.
Electricity futures are traded on an active market, the Australian Securities Exchange (ASX). The Group uses ASX mark-to-market quotes to determine the fair value of the futures contracts and contracts for differences. Interest rate swaps and forward foreign exchange contracts are not traded in an active market and their fair value is determined by using accepted valuation techniques. Specific valuation techniques used by the Group refer to observable market data and include:• The fair value of interest rate swaps is calculated as the present value of the estimated future cash flows based on observable
yield curves, and• The fair value of forward foreign exchange contracts is determined using forward exchange rates at the balance date, with the
resulting value discounted back to present value.
2019 2018ASSETS LIABILITIES ASSETS LIABILITIES
$000 $000 $000 $000
Cash flow hedges:
– forward foreign exchange contracts - (15) 12 -
– electricity futures and contracts for differences 4,421 (416) 6,237 -
– interest rate swaps - (3,566) - (1,300)
TOTAL CURRENT PORTION 4,421 (3,997) 6,249 (1,300)
Cash flow hedges:
– forward foreign exchange contracts - (71) 6 -
– electricity futures and contracts for differences 205 (4,946) - -
– interest rate swaps - - - (5,564)
TOTAL NON-CURRENT PORTION 205 (5,017) 6 (5,564)
20. DERIVATIVE FINANCIAL INSTRUMENTS
P At initial recognition, the derivative financial instruments are measured at fair value on the date a derivative contract is entered into and are subsequently re-measured at their fair value. The fair value of derivative financial instruments approximates their carrying value.
Derivatives are only used for economic hedging purposes and not as speculative investments. The Group designates certain derivatives as hedges of a particular risk associated with a recognised asset or liability or a highly probable forecast transaction (cash flow hedge).
At inception each transaction is documented, detailing the economic relationship and the hedge ratio between hedging instruments and hedged items, the risk management objective and strategy, and the assessment, initially and on an ongoing basis, of whether the derivatives used in the hedging transaction are highly effective.
The effective portion of changes in the fair value of derivatives that are designated and qualify as cash flow hedges is recognised in equity in the cash flow hedge reserve. Hedge effectiveness is determined at inception of the hedge relationship, and through periodic effectiveness assessments to ensure that an economic relationship exists between the hedged item and hedging instrument. The gain or loss relating to the ineffective portion is recognised immediately in other operating gains/losses in the Income Statement.
The net movement in the cash flow hedge reserve comprises:
2019 2018$000 $000
Foreign exchange hedges transferred to property, plant and equipment (13) (457)
Foreign exchange contracts entered into during the year (90) 18
Movement in value of foreign exchange contracts held throughout the year - (1)
Interest rate swaps maturing in the year 1,301 137
Movement in value of interest rate swaps held throughout the year 1,998 2,619
Electricity futures and contracts for differences entered into during the year (780) 3,740
Electricity futures and contracts for differences settled in the year (5,510) (735)
Movement in value of electricity futures held throughout the year - 2,535
Gross movement in cash flow hedge reserve (3,094) 7,856
Deferred tax 866 (2,200)
NET MOVEMENT IN CASH FLOW HEDGE RESERVE (2,228) 5,656
The full fair value of a hedging derivative is classified as a non-current asset or liability if the remaining maturity of the hedged item is more than 12 months.
Financial instruments are measured at fair value using the following fair value measurement hierarchy:• Quoted prices (unadjusted) in active markets for identical assets or liabilities (level 1),• Inputs other than quoted prices included within level 1 that are observable for the asset or liability, either directly (that is, as
prices) or indirectly (that is, derived from prices) (level 2), and• Inputs for the asset or liability that are not based on observable market data (that is, unobservable inputs) (level 3).
REFINING NZ CONSOLIDATED FINANCIAL STATEMENTS 2019108 109
Notes to the Consolidated Financial StatementsFOR THE YEAR ENDED 31 DECEMBER 2019
Notes to the Consolidated Financial StatementsFOR THE YEAR ENDED 31 DECEMBER 2019
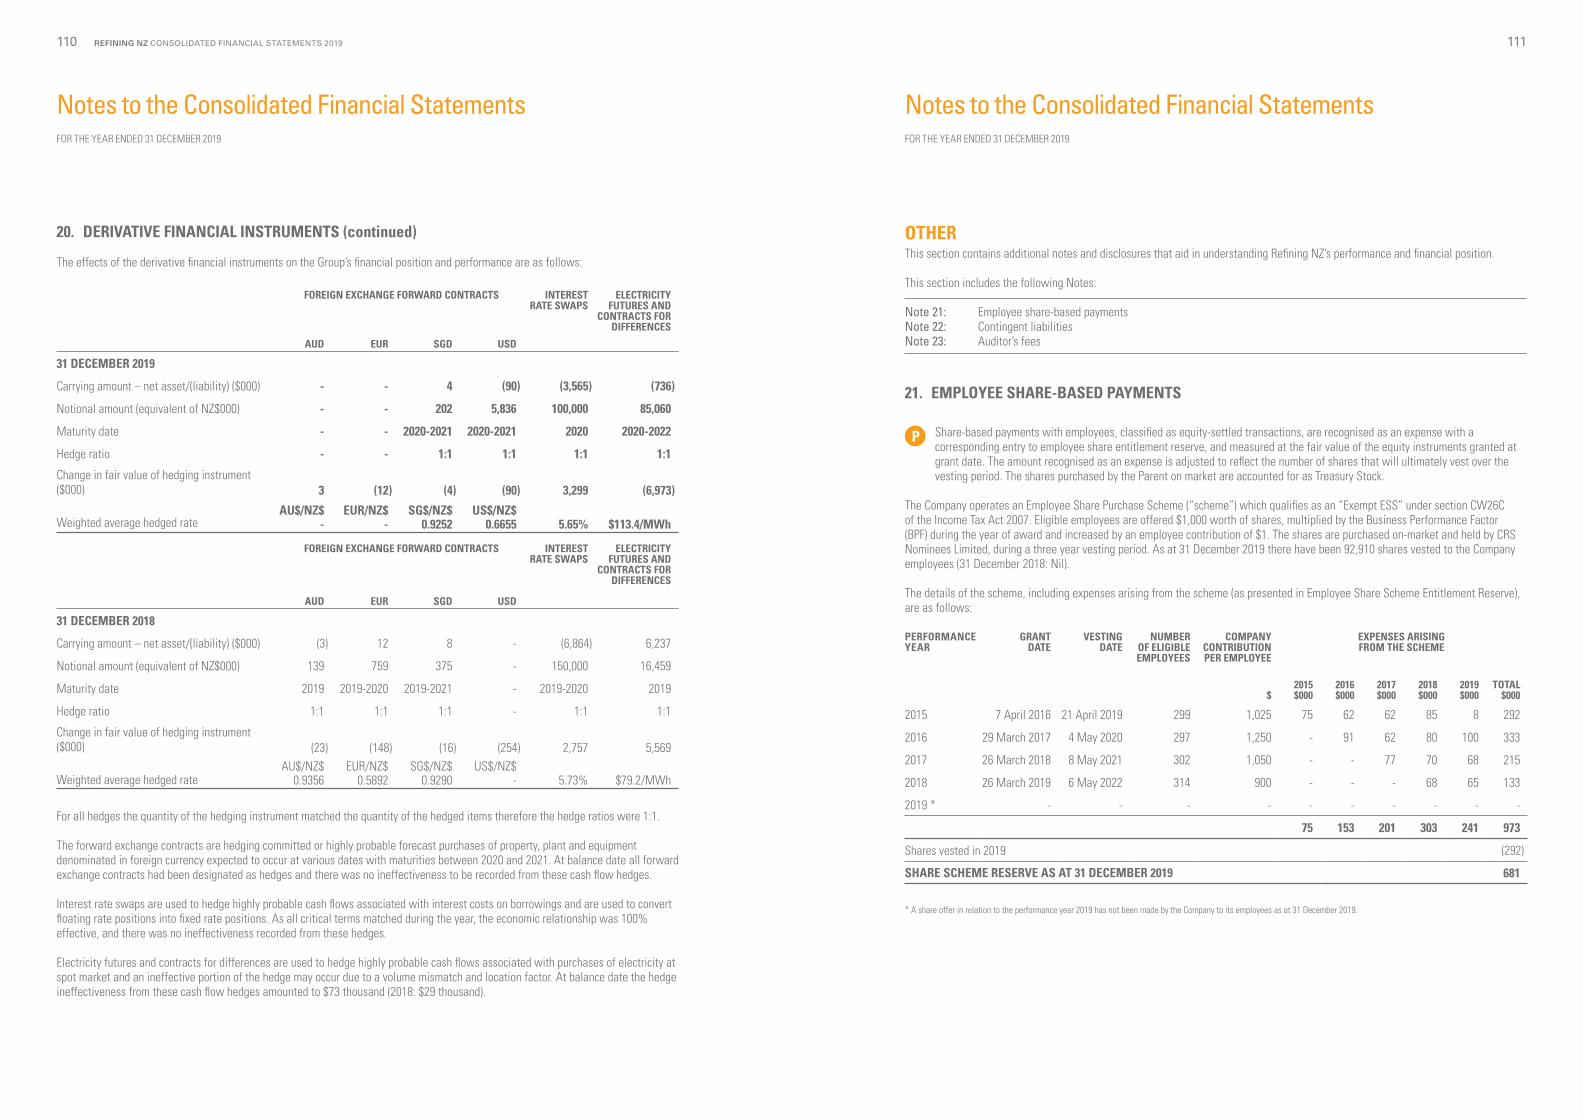
OTHERThis section contains additional notes and disclosures that aid in understanding Refining NZ’s performance and financial position.
This section includes the following Notes:
Note 21: Employee share-based paymentsNote 22: Contingent liabilitiesNote 23: Auditor’s fees
21. EMPLOYEE SHARE-BASED PAYMENTS
P Share-based payments with employees, classified as equity-settled transactions, are recognised as an expense with a corresponding entry to employee share entitlement reserve, and measured at the fair value of the equity instruments granted at grant date. The amount recognised as an expense is adjusted to reflect the number of shares that will ultimately vest over the vesting period. The shares purchased by the Parent on market are accounted for as Treasury Stock.
The Company operates an Employee Share Purchase Scheme (“scheme”) which qualifies as an “Exempt ESS” under section CW26C of the Income Tax Act 2007. Eligible employees are offered $1,000 worth of shares, multiplied by the Business Performance Factor (BPF) during the year of award and increased by an employee contribution of $1. The shares are purchased on-market and held by CRS Nominees Limited, during a three year vesting period. As at 31 December 2019 there have been 92,910 shares vested to the Company employees (31 December 2018: Nil).
The details of the scheme, including expenses arising from the scheme (as presented in Employee Share Scheme Entitlement Reserve), are as follows:
PERFORMANCEYEAR
GRANT DATE
VESTINGDATE
NUMBER OF ELIGIBLE EMPLOYEES
COMPANYCONTRIBUTION PER EMPLOYEE
EXPENSES ARISING FROM THE SCHEME
$2015$000
2016$000
2017$000
2018$000
2019$000
TOTAL$000
2015 7 April 2016 21 April 2019 299 1,025 75 62 62 85 8 292
2016 29 March 2017 4 May 2020 297 1,250 - 91 62 80 100 333
2017 26 March 2018 8 May 2021 302 1,050 - - 77 70 68 215
2018 26 March 2019 6 May 2022 314 900 - - - 68 65 133
2019 * - - - - - - - - - -
75 153 201 303 241 973
Shares vested in 2019 (292)
SHARE SCHEME RESERVE AS AT 31 DECEMBER 2019 681
* A share offer in relation to the performance year 2019 has not been made by the Company to its employees as at 31 December 2019.
20. DERIVATIVE FINANCIAL INSTRUMENTS (continued)
The effects of the derivative financial instruments on the Group’s financial position and performance are as follows:
FOREIGN EXCHANGE FORWARD CONTRACTS INTEREST RATE SWAPS
ELECTRICITY FUTURES AND
CONTRACTS FOR DIFFERENCES
AUD EUR SGD USD
31 DECEMBER 2019
Carrying amount – net asset/(liability) ($000) - - 4 (90) (3,565) (736)
Notional amount (equivalent of NZ$000) - - 202 5,836 100,000 85,060
Maturity date - - 2020-2021 2020-2021 2020 2020-2022
Hedge ratio - - 1:1 1:1 1:1 1:1
Change in fair value of hedging instrument ($000) 3 (12) (4) (90) 3,299 (6,973) Weighted average hedged rate
AU$/NZ$-
EUR/NZ$-
SG$/NZ$0.9252
US$/NZ$0.6655 5.65% $113.4/MWh
FOREIGN EXCHANGE FORWARD CONTRACTS INTEREST RATE SWAPS
ELECTRICITY FUTURES AND
CONTRACTS FOR DIFFERENCES
AUD EUR SGD USD
31 DECEMBER 2018
Carrying amount – net asset/(liability) ($000) (3) 12 8 - (6,864) 6,237
Notional amount (equivalent of NZ$000) 139 759 375 - 150,000 16,459
Maturity date 2019 2019-2020 2019-2021 - 2019-2020 2019
Hedge ratio 1:1 1:1 1:1 - 1:1 1:1
Change in fair value of hedging instrument ($000) (23) (148) (16) (254) 2,757 5,569 Weighted average hedged rate
AU$/NZ$ 0.9356
EUR/NZ$ 0.5892
SG$/NZ$ 0.9290
US$/NZ$ - 5.73% $79.2/MWh
For all hedges the quantity of the hedging instrument matched the quantity of the hedged items therefore the hedge ratios were 1:1.
The forward exchange contracts are hedging committed or highly probable forecast purchases of property, plant and equipment denominated in foreign currency expected to occur at various dates with maturities between 2020 and 2021. At balance date all forward exchange contracts had been designated as hedges and there was no ineffectiveness to be recorded from these cash flow hedges.
Interest rate swaps are used to hedge highly probable cash flows associated with interest costs on borrowings and are used to convert floating rate positions into fixed rate positions. As all critical terms matched during the year, the economic relationship was 100% effective, and there was no ineffectiveness recorded from these hedges.
Electricity futures and contracts for differences are used to hedge highly probable cash flows associated with purchases of electricity at spot market and an ineffective portion of the hedge may occur due to a volume mismatch and location factor. At balance date the hedge ineffectiveness from these cash flow hedges amounted to $73 thousand (2018: $29 thousand).
REFINING NZ CONSOLIDATED FINANCIAL STATEMENTS 2019110 111
Notes to the Consolidated Financial StatementsFOR THE YEAR ENDED 31 DECEMBER 2019
Notes to the Consolidated Financial StatementsFOR THE YEAR ENDED 31 DECEMBER 2019
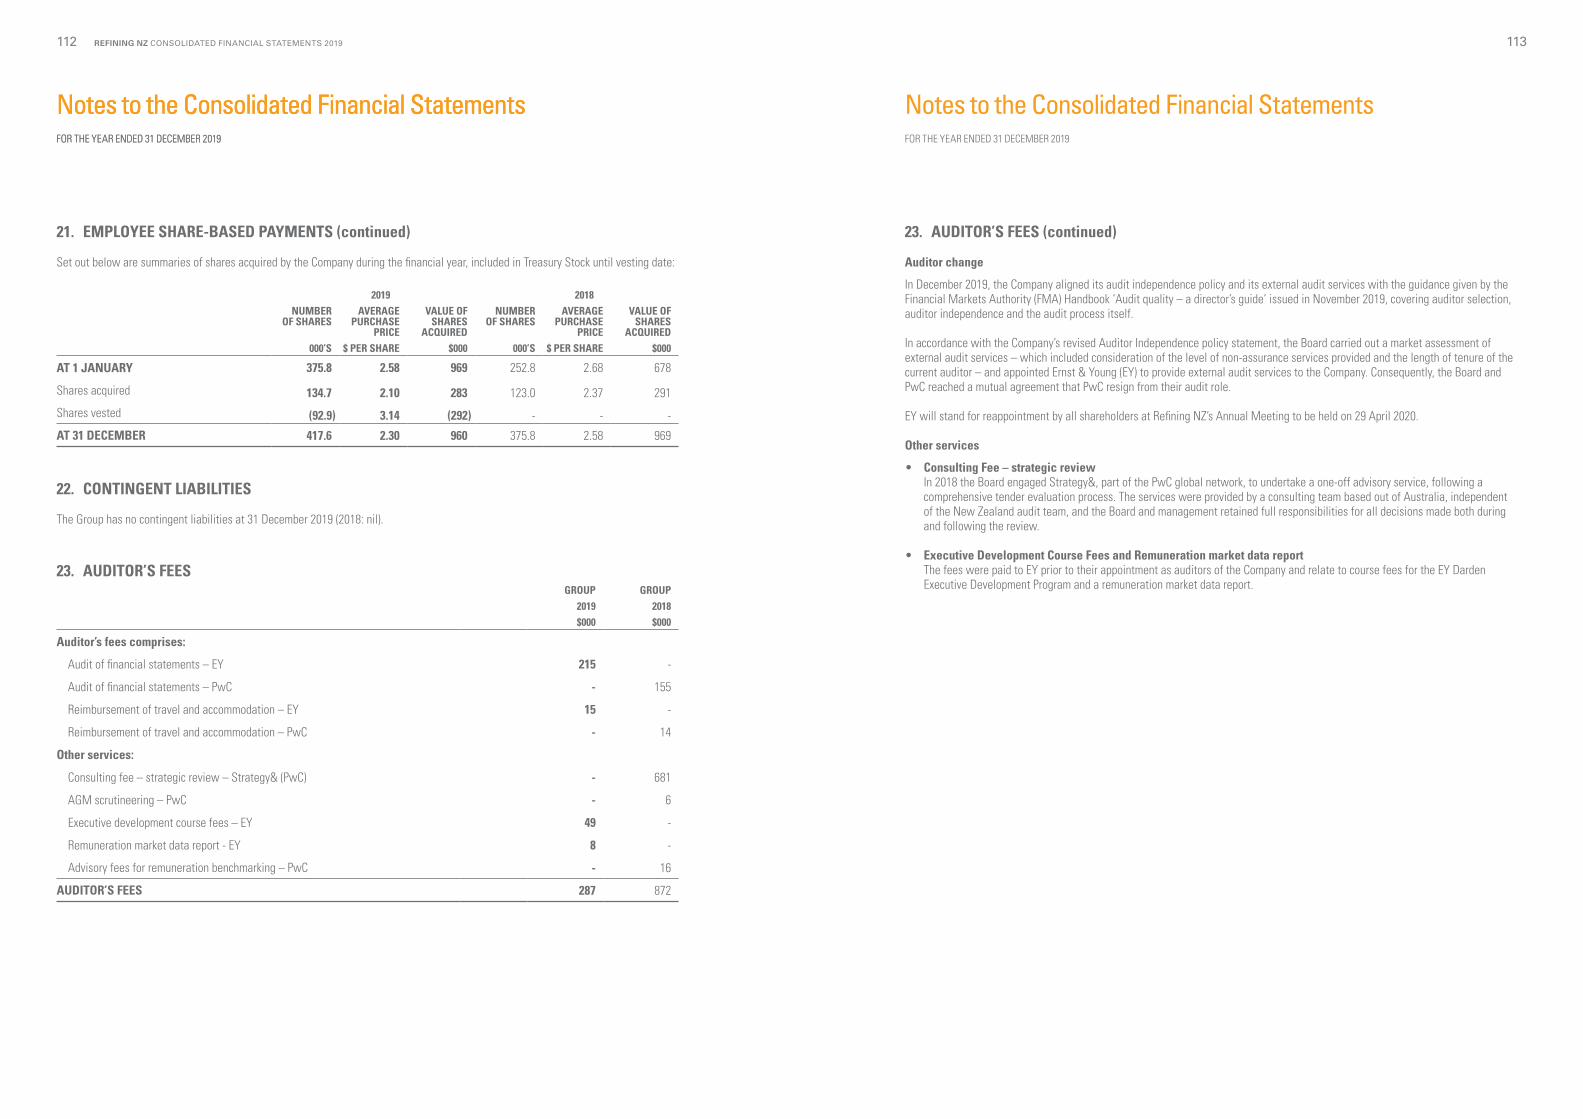
21. EMPLOYEE SHARE-BASED PAYMENTS (continued)
Set out below are summaries of shares acquired by the Company during the financial year, included in Treasury Stock until vesting date:
2019 2018NUMBER
OF SHARESAVERAGE
PURCHASE PRICE
VALUE OF SHARES
ACQUIRED
NUMBER OF SHARES
AVERAGE PURCHASE
PRICE
VALUE OF SHARES
ACQUIRED000’S $ PER SHARE $000 000’S $ PER SHARE $000
AT 1 JANUARY 375.8 2.58 969 252.8 2.68 678
Shares acquired 134.7 2.10 283 123.0 2.37 291
Shares vested (92.9) 3.14 (292) - - -
AT 31 DECEMBER 417.6 2.30 960 375.8 2.58 969
22. CONTINGENT LIABILITIES
The Group has no contingent liabilities at 31 December 2019 (2018: nil).
23. AUDITOR’S FEESGROUP GROUP
2019 2018$000 $000
Auditor’s fees comprises:
Audit of financial statements – EY 215 -
Audit of financial statements – PwC - 155
Reimbursement of travel and accommodation – EY 15 -
Reimbursement of travel and accommodation – PwC - 14
Other services:
Consulting fee – strategic review – Strategy& (PwC) - 681
AGM scrutineering – PwC - 6
Executive development course fees – EY 49 -
Remuneration market data report - EY 8 -
Advisory fees for remuneration benchmarking – PwC - 16
AUDITOR’S FEES 287 872
23. AUDITOR’S FEES (continued)
Auditor change
In December 2019, the Company aligned its audit independence policy and its external audit services with the guidance given by the Financial Markets Authority (FMA) Handbook ‘Audit quality – a director’s guide’ issued in November 2019, covering auditor selection, auditor independence and the audit process itself.
In accordance with the Company’s revised Auditor Independence policy statement, the Board carried out a market assessment of external audit services – which included consideration of the level of non-assurance services provided and the length of tenure of the current auditor – and appointed Ernst & Young (EY) to provide external audit services to the Company. Consequently, the Board and PwC reached a mutual agreement that PwC resign from their audit role.
EY will stand for reappointment by all shareholders at Refining NZ’s Annual Meeting to be held on 29 April 2020.
Other services
• Consulting Fee – strategic review In 2018 the Board engaged Strategy&, part of the PwC global network, to undertake a one-off advisory service, following a comprehensive tender evaluation process. The services were provided by a consulting team based out of Australia, independent of the New Zealand audit team, and the Board and management retained full responsibilities for all decisions made both during and following the review.
• Executive Development Course Fees and Remuneration market data report The fees were paid to EY prior to their appointment as auditors of the Company and relate to course fees for the EY Darden Executive Development Program and a remuneration market data report.
REFINING NZ CONSOLIDATED FINANCIAL STATEMENTS 2019112 113
Notes to the Consolidated Financial StatementsFOR THE YEAR ENDED 31 DECEMBER 2019
Notes to the Consolidated Financial StatementsFOR THE YEAR ENDED 31 DECEMBER 2019
Notes to the Consolidated Financial StatementsFOR THE YEAR ENDED 31 DECEMBER 2019
Independent Auditor’s ReportTO THE SHAREHOLDERS OF NEW ZEALAND REFINING COMPANY LIMITED GROUP
PROCESSING FEE REVENUE
Why significant How our audit addressed the key audit matter
The most significant revenue stream of the Group, and a key determinant of its profitability, is processing fee revenue. In 2019 this amounted to $242m of the total Group revenue of $348m.
Processing fees are material related party transactions with the Group’s shareholding oil companies, who are also its customers.
The processing fee calculation is complex and includes many variables. The calculation is based on an agreed formula defined in the processing agreements with each of the oil companies. Note 19 (a) discloses a summary of the method of calculation and the key inputs into the calculation of the processing fees.
Notes 2 and 3 of the consolidated financial statements explain the accounting policies used and an analysis of processing fee revenue.
In obtaining sufficient appropriate audit evidence:
• We evaluated the Group’s process for calculating and recording processing fee revenue. We understood and verified the design of key controls including management’s review and authorisation of monthly processing fee calculations.
• We agreed the processing fee calculation methodology used to recognise revenue to the method and pricing prescribed in the processing fee agreements and on a sample basis reperformed the calculation of the processing fee for each of the customers.
• We agreed key inputs used in the calculation, on a sample basis, to source documents.
• We confirmed the total annual processing fee with each customer.
• We tested payments received from the oil companies during the year and agreed post year-end cash receipts from each of the customers to the outstanding receivables at year end.
• We reviewed the Group’s accounting policy and related disclosures with regard to the disclosure requirements of IFRS 15, ‘Revenue from Contracts with Customers’ and IAS 24 ‘Related Parties’.
REPORT ON THE AUDIT OF THE FINANCIAL STATEMENTS
OpinionWe have audited the financial statements of The New Zealand Refining Company (“the Company”) Group and its subsidiaries (together “the Group”) on pages 58 to 113, which comprise the consolidated balance sheet of the Group as at 31 December 2019, and the consolidated income statement, consolidated statement of comprehensive income, consolidated statement of changes in equity and consolidated statement of cash flows for the year then ended of the Group, and the notes to the consolidated financial statements including a summary of significant accounting policies.
In our opinion, the consolidated financial statements on pages 58 to 113 present fairly, in all material respects, the consolidated financial position of the Group as at 31 December 2019 and its consolidated financial performance and cash flows for the year then ended in accordance with New Zealand equivalents to International Financial Reporting Standards and International Financial Reporting Standards.
This report is made solely to the company’s shareholders as a body. Our audit has been undertaken so that we might state to the company’s shareholders those matters we are required to state to them in an auditor’s report and for no other purpose. To the fullest extent permitted by law, we do not accept or assume responsibility to anyone other than the company and the company’s shareholders as a body, for our audit work, for this report, or for the opinions we have formed.
Basis for opinionWe conducted our audit in accordance with International Standards on Auditing (New Zealand). Our responsibilities under those standards are further described in the Auditor’s Responsibilities for the Audit of the Financial Statements section of our report.
We are independent of the Group in accordance with Professional and Ethical Standard 1 (revised) Code of Ethics for Assurance Practitioners issued by the New Zealand Auditing and Assurance Standards Board, and we have fulfilled our other ethical responsibilities in accordance with these requirements.
We believe that the audit evidence we have obtained is sufficient and appropriate to provide a basis for our opinion.
Ernst & Young provided remuneration benchmarking and executive development course services to the Group. Partners and employees of our firm may deal with the Group on normal terms within the ordinary course of trading activities of the business of the Group. We have no other relationship with, or interest in, the Group.
Key audit mattersKey audit matters are those matters that, in our professional judgment, were of most significance in our audit of the consolidated financial statements of the current year. These matters were addressed in the context of our audit of the consolidated financial statements as a whole, and in forming our opinion thereon, but we do not provide a separate opinion on these matters. For each matter below, our description of how our audit addressed the matter is provided in that context.
We have fulfilled the responsibilities described in the Auditor’s responsibilities for the audit of the financial statements section of the audit report, including in relation to these matters. Accordingly, our audit included the performance of procedures designed to respond to our assessment of the risks of material misstatement of the financial statements. The results of our audit procedures, including the procedures performed to address the matters below, provide the basis for our audit opinion on the accompanying consolidated financial statements.
Independent Auditor’s ReportTO THE SHAREHOLDERS OF THE NEW ZEALAND REFINING COMPANY LIMITED
REFINING NZ CONSOLIDATED FINANCIAL STATEMENTS 2019114 115
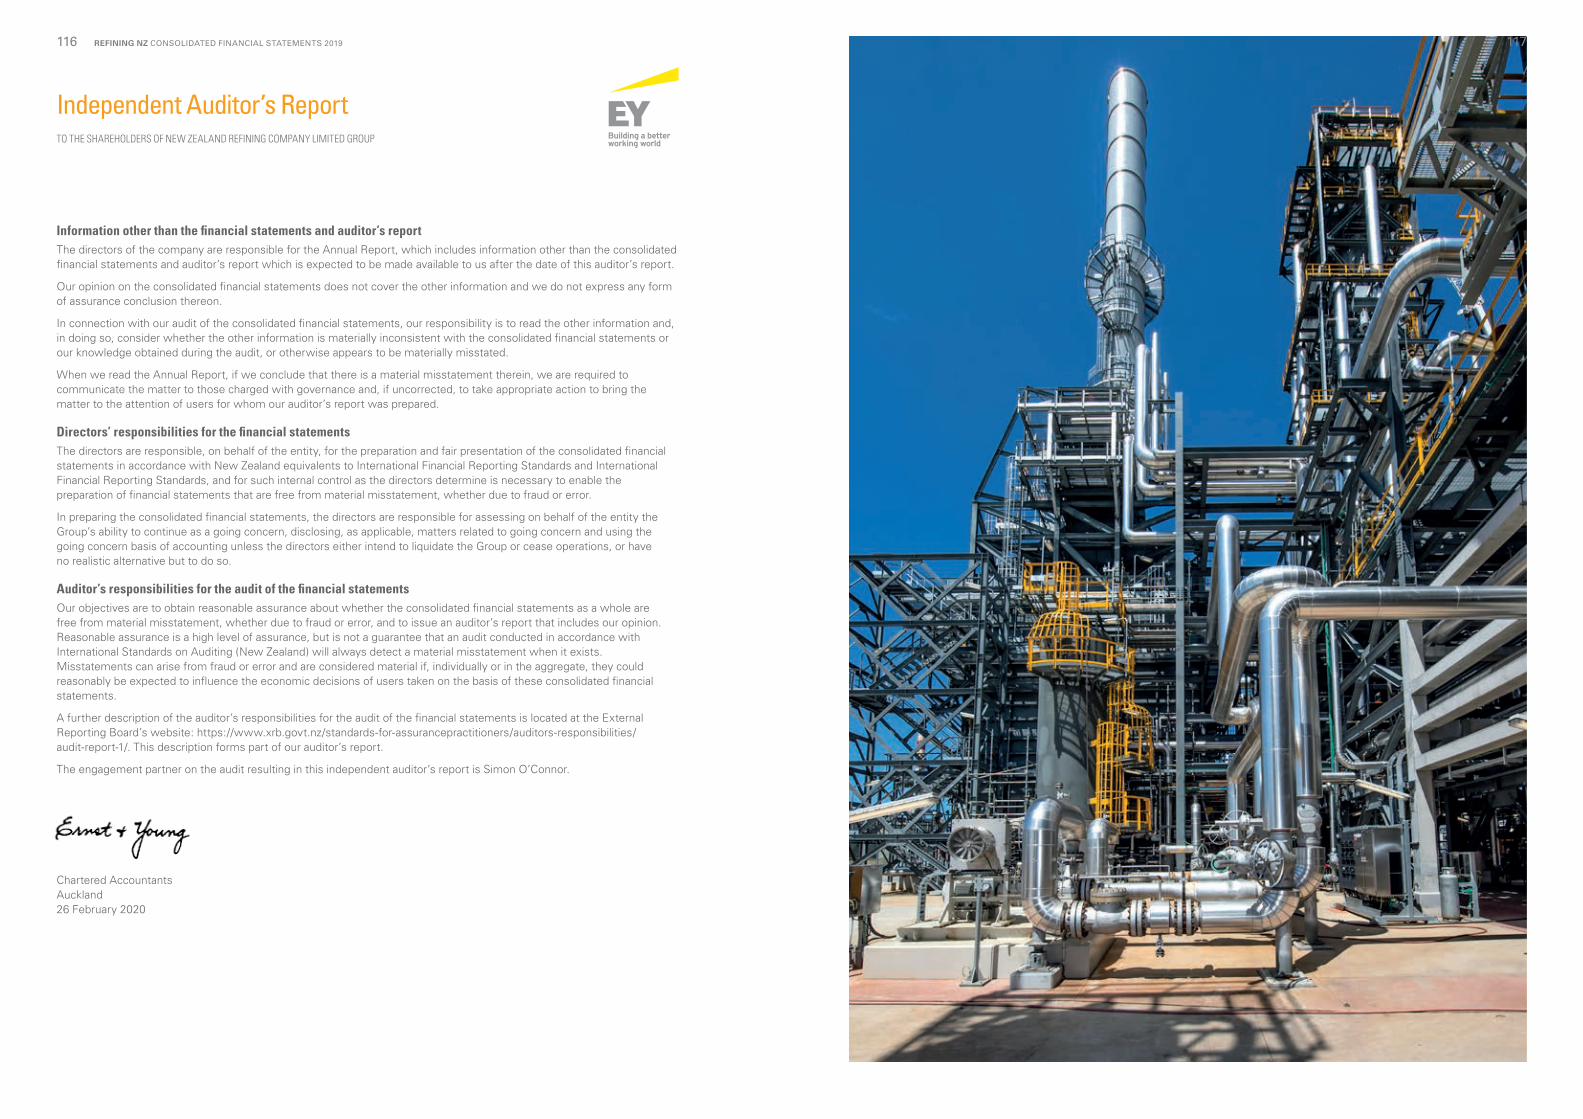
Independent Auditor’s ReportTO THE SHAREHOLDERS OF NEW ZEALAND REFINING COMPANY LIMITED GROUP
Information other than the financial statements and auditor’s report The directors of the company are responsible for the Annual Report, which includes information other than the consolidated financial statements and auditor’s report which is expected to be made available to us after the date of this auditor’s report.
Our opinion on the consolidated financial statements does not cover the other information and we do not express any form of assurance conclusion thereon.
In connection with our audit of the consolidated financial statements, our responsibility is to read the other information and, in doing so, consider whether the other information is materially inconsistent with the consolidated financial statements or our knowledge obtained during the audit, or otherwise appears to be materially misstated.
When we read the Annual Report, if we conclude that there is a material misstatement therein, we are required to communicate the matter to those charged with governance and, if uncorrected, to take appropriate action to bring the matter to the attention of users for whom our auditor’s report was prepared.
Directors’ responsibilities for the financial statements The directors are responsible, on behalf of the entity, for the preparation and fair presentation of the consolidated financial statements in accordance with New Zealand equivalents to International Financial Reporting Standards and International Financial Reporting Standards, and for such internal control as the directors determine is necessary to enable the preparation of financial statements that are free from material misstatement, whether due to fraud or error.
In preparing the consolidated financial statements, the directors are responsible for assessing on behalf of the entity the Group’s ability to continue as a going concern, disclosing, as applicable, matters related to going concern and using the going concern basis of accounting unless the directors either intend to liquidate the Group or cease operations, or have no realistic alternative but to do so.
Auditor’s responsibilities for the audit of the financial statements Our objectives are to obtain reasonable assurance about whether the consolidated financial statements as a whole are free from material misstatement, whether due to fraud or error, and to issue an auditor’s report that includes our opinion. Reasonable assurance is a high level of assurance, but is not a guarantee that an audit conducted in accordance with International Standards on Auditing (New Zealand) will always detect a material misstatement when it exists. Misstatements can arise from fraud or error and are considered material if, individually or in the aggregate, they could reasonably be expected to influence the economic decisions of users taken on the basis of these consolidated financial statements.
A further description of the auditor’s responsibilities for the audit of the financial statements is located at the External Reporting Board’s website: https://www.xrb.govt.nz/standards-for-assurancepractitioners/auditors-responsibilities/audit-report-1/. This description forms part of our auditor’s report.
The engagement partner on the audit resulting in this independent auditor’s report is Simon O’Connor.
Chartered Accountants Auckland 26 February 2020
REFINING NZ CONSOLIDATED FINANCIAL STATEMENTS 2019116 117
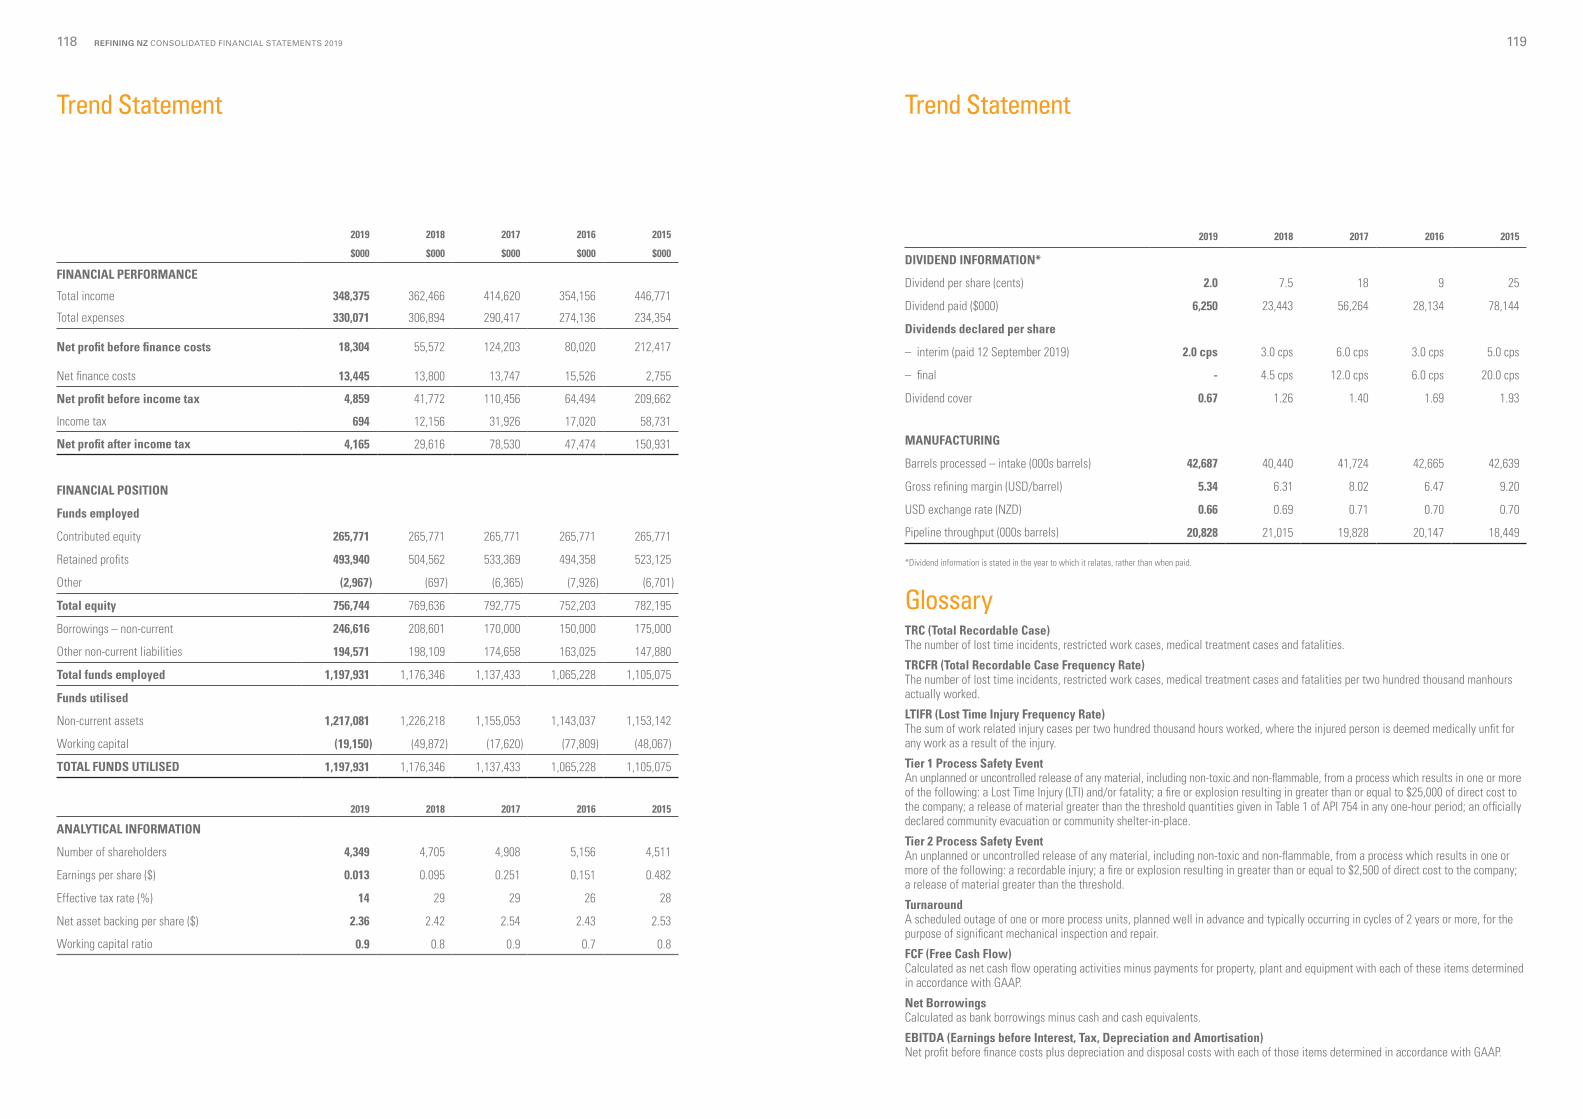
Trend Statement
2019 2018 2017 2016 2015
DIVIDEND INFORMATION*
Dividend per share (cents) 2.0 7.5 18 9 25
Dividend paid ($000) 6,250 23,443 56,264 28,134 78,144
Dividends declared per share
– interim (paid 12 September 2019) 2.0 cps 3.0 cps 6.0 cps 3.0 cps 5.0 cps
– final - 4.5 cps 12.0 cps 6.0 cps 20.0 cps
Dividend cover 0.67 1.26 1.40 1.69 1.93
MANUFACTURING
Barrels processed – intake (000s barrels) 42,687 40,440 41,724 42,665 42,639
Gross refining margin (USD/barrel) 5.34 6.31 8.02 6.47 9.20
USD exchange rate (NZD) 0.66 0.69 0.71 0.70 0.70
Pipeline throughput (000s barrels) 20,828 21,015 19,828 20,147 18,449
*Dividend information is stated in the year to which it relates, rather than when paid.
GlossaryTRC (Total Recordable Case) The number of lost time incidents, restricted work cases, medical treatment cases and fatalities.
TRCFR (Total Recordable Case Frequency Rate) The number of lost time incidents, restricted work cases, medical treatment cases and fatalities per two hundred thousand manhours actually worked.
LTIFR (Lost Time Injury Frequency Rate) The sum of work related injury cases per two hundred thousand hours worked, where the injured person is deemed medically unfit for any work as a result of the injury.
Tier 1 Process Safety Event An unplanned or uncontrolled release of any material, including non-toxic and non-flammable, from a process which results in one or more of the following: a Lost Time Injury (LTI) and/or fatality; a fire or explosion resulting in greater than or equal to $25,000 of direct cost to the company; a release of material greater than the threshold quantities given in Table 1 of API 754 in any one-hour period; an officially declared community evacuation or community shelter-in-place.
Tier 2 Process Safety Event An unplanned or uncontrolled release of any material, including non-toxic and non-flammable, from a process which results in one or more of the following: a recordable injury; a fire or explosion resulting in greater than or equal to $2,500 of direct cost to the company; a release of material greater than the threshold.
Turnaround A scheduled outage of one or more process units, planned well in advance and typically occurring in cycles of 2 years or more, for the purpose of significant mechanical inspection and repair.
FCF (Free Cash Flow) Calculated as net cash flow operating activities minus payments for property, plant and equipment with each of these items determined in accordance with GAAP.
Net Borrowings Calculated as bank borrowings minus cash and cash equivalents.
EBITDA (Earnings before Interest, Tax, Depreciation and Amortisation) Net profit before finance costs plus depreciation and disposal costs with each of those items determined in accordance with GAAP.
Trend Statement
2019 2018 2017 2016 2015
$000 $000 $000 $000 $000
FINANCIAL PERFORMANCE
Total income 348,375 362,466 414,620 354,156 446,771
Total expenses 330,071 306,894 290,417 274,136 234,354
Net profit before finance costs 18,304 55,572 124,203 80,020 212,417
Net finance costs 13,445 13,800 13,747 15,526 2,755
Net profit before income tax 4,859 41,772 110,456 64,494 209,662
Income tax 694 12,156 31,926 17,020 58,731
Net profit after income tax 4,165 29,616 78,530 47,474 150,931
FINANCIAL POSITION
Funds employed
Contributed equity 265,771 265,771 265,771 265,771 265,771
Retained profits 493,940 504,562 533,369 494,358 523,125
Other (2,967) (697) (6,365) (7,926) (6,701)
Total equity 756,744 769,636 792,775 752,203 782,195
Borrowings – non-current 246,616 208,601 170,000 150,000 175,000
Other non-current liabilities 194,571 198,109 174,658 163,025 147,880
Total funds employed 1,197,931 1,176,346 1,137,433 1,065,228 1,105,075
Funds utilised
Non-current assets 1,217,081 1,226,218 1,155,053 1,143,037 1,153,142
Working capital (19,150) (49,872) (17,620) (77,809) (48,067)
TOTAL FUNDS UTILISED 1,197,931 1,176,346 1,137,433 1,065,228 1,105,075
2019 2018 2017 2016 2015
ANALYTICAL INFORMATION
Number of shareholders 4,349 4,705 4,908 5,156 4,511
Earnings per share ($) 0.013 0.095 0.251 0.151 0.482
Effective tax rate (%) 14 29 29 26 28
Net asset backing per share ($) 2.36 2.42 2.54 2.43 2.53
Working capital ratio 0.9 0.8 0.9 0.7 0.8
REFINING NZ CONSOLIDATED FINANCIAL STATEMENTS 2019118 119
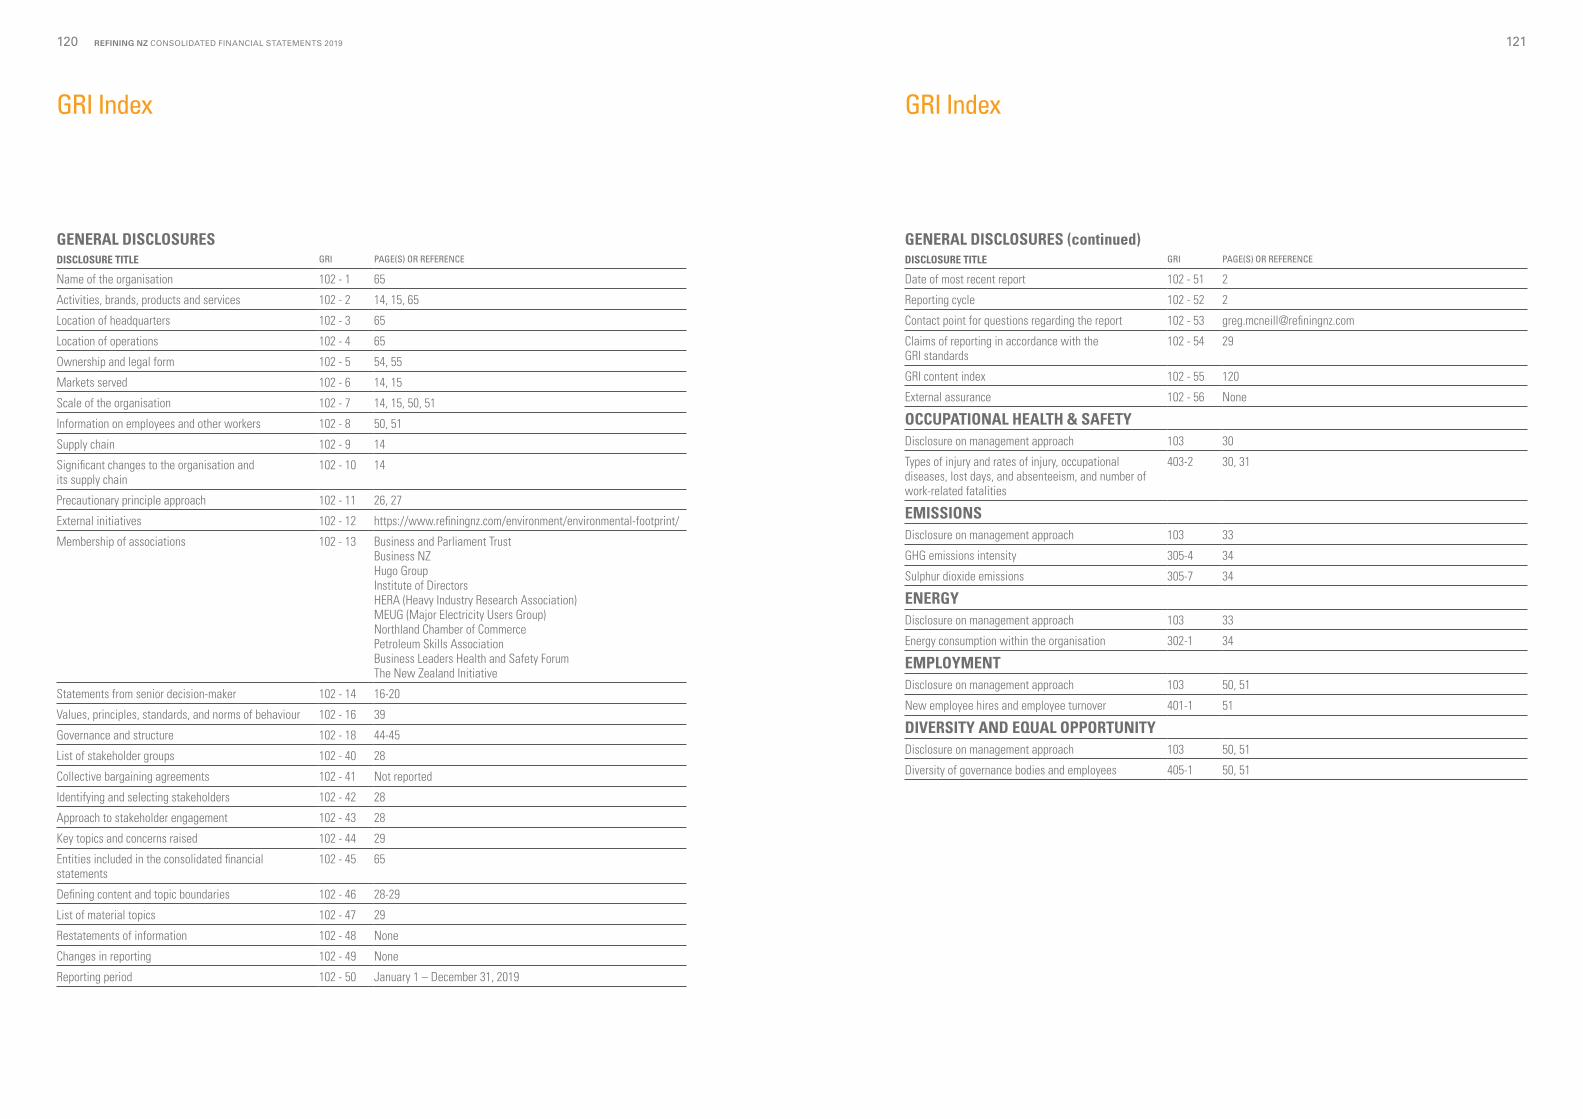
GRI Index
GENERAL DISCLOSURES (continued)DISCLOSURE TITLE GRI PAGE(S) OR REFERENCE
Date of most recent report 102 - 51 2
Reporting cycle 102 - 52 2
Contact point for questions regarding the report 102 - 53 [email protected]
Claims of reporting in accordance with the GRI standards
102 - 54 29
GRI content index 102 - 55 120
External assurance 102 - 56 None
OCCUPATIONAL HEALTH & SAFETYDisclosure on management approach 103 30
Types of injury and rates of injury, occupational diseases, lost days, and absenteeism, and number of work-related fatalities
403-2 30, 31
EMISSIONSDisclosure on management approach 103 33
GHG emissions intensity 305-4 34
Sulphur dioxide emissions 305-7 34
ENERGYDisclosure on management approach 103 33
Energy consumption within the organisation 302-1 34
EMPLOYMENTDisclosure on management approach 103 50, 51
New employee hires and employee turnover 401-1 51
DIVERSITY AND EQUAL OPPORTUNITYDisclosure on management approach 103 50, 51
Diversity of governance bodies and employees 405-1 50, 51
GRI Index
GENERAL DISCLOSURESDISCLOSURE TITLE GRI PAGE(S) OR REFERENCE
Name of the organisation 102 - 1 65
Activities, brands, products and services 102 - 2 14, 15, 65
Location of headquarters 102 - 3 65
Location of operations 102 - 4 65
Ownership and legal form 102 - 5 54, 55
Markets served 102 - 6 14, 15
Scale of the organisation 102 - 7 14, 15, 50, 51
Information on employees and other workers 102 - 8 50, 51
Supply chain 102 - 9 14
Significant changes to the organisation and its supply chain
102 - 10 14
Precautionary principle approach 102 - 11 26, 27
External initiatives 102 - 12 https://www.refiningnz.com/environment/environmental-footprint/
Membership of associations 102 - 13 Business and Parliament TrustBusiness NZHugo GroupInstitute of DirectorsHERA (Heavy Industry Research Association)MEUG (Major Electricity Users Group)Northland Chamber of CommercePetroleum Skills AssociationBusiness Leaders Health and Safety ForumThe New Zealand Initiative
Statements from senior decision-maker 102 - 14 16-20
Values, principles, standards, and norms of behaviour 102 - 16 39
Governance and structure 102 - 18 44-45
List of stakeholder groups 102 - 40 28
Collective bargaining agreements 102 - 41 Not reported
Identifying and selecting stakeholders 102 - 42 28
Approach to stakeholder engagement 102 - 43 28
Key topics and concerns raised 102 - 44 29
Entities included in the consolidated financial statements
102 - 45 65
Defining content and topic boundaries 102 - 46 28-29
List of material topics 102 - 47 29
Restatements of information 102 - 48 None
Changes in reporting 102 - 49 None
Reporting period 102 - 50 January 1 – December 31, 2019
REFINING NZ CONSOLIDATED FINANCIAL STATEMENTS 2019120 121
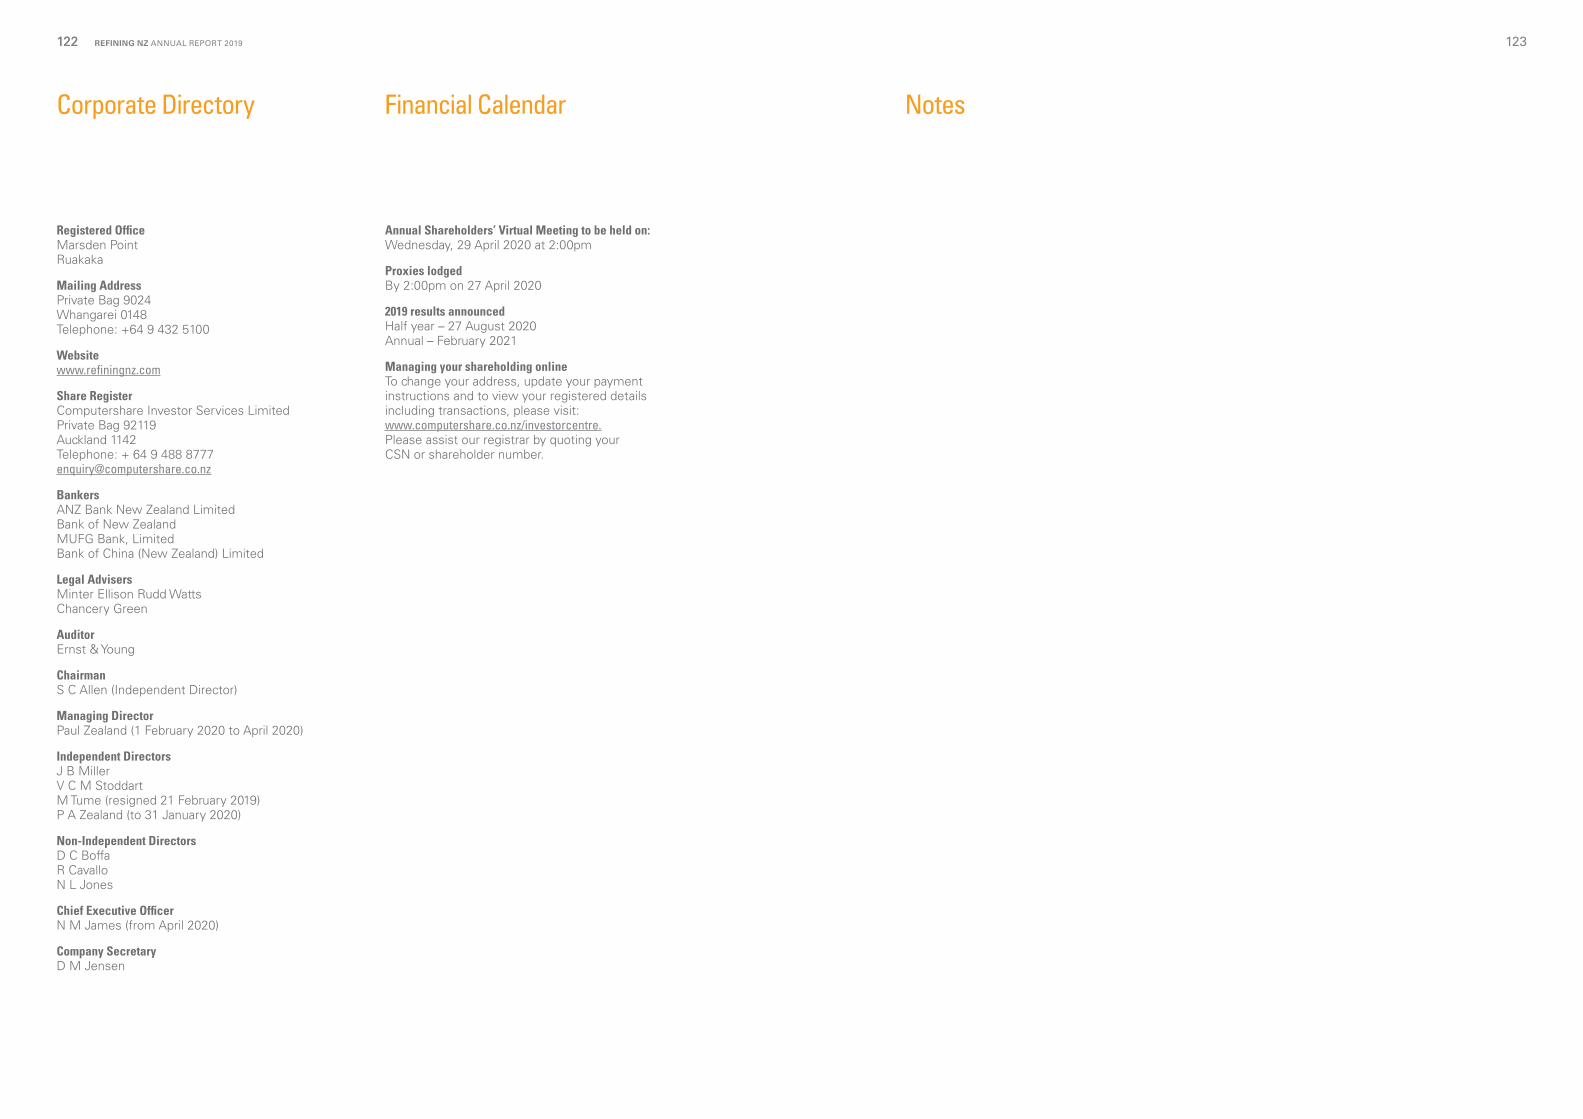
Registered OfficeMarsden PointRuakaka
Mailing AddressPrivate Bag 9024Whangarei 0148Telephone: +64 9 432 5100
Websitewww.refiningnz.com
Share RegisterComputershare Investor Services LimitedPrivate Bag 92119Auckland 1142Telephone: + 64 9 488 [email protected]
BankersANZ Bank New Zealand LimitedBank of New ZealandMUFG Bank, LimitedBank of China (New Zealand) Limited
Legal AdvisersMinter Ellison Rudd WattsChancery Green
AuditorErnst & Young
ChairmanS C Allen (Independent Director)
Managing DirectorPaul Zealand (1 February 2020 to April 2020)
Independent DirectorsJ B MillerV C M StoddartM Tume (resigned 21 February 2019)P A Zealand (to 31 January 2020)
Non-Independent DirectorsD C Boffa R CavalloN L Jones
Chief Executive OfficerN M James (from April 2020)
Company SecretaryD M Jensen
Annual Shareholders’ Virtual Meeting to be held on:Wednesday, 29 April 2020 at 2:00pm
Proxies lodgedBy 2:00pm on 27 April 2020
2019 results announcedHalf year – 27 August 2020Annual – February 2021
Managing your shareholding onlineTo change your address, update your payment instructions and to view your registered details including transactions, please visit: www.computershare.co.nz/investorcentre.Please assist our registrar by quoting your CSN or shareholder number.
Corporate Directory Financial Calendar Notes
123REFINING NZ ANNUAL REPORT 2019122122

Notes
REFINING NZ ANNUAL REPORT 2019124124

REFININGNZ.COM