Refinery Study and Well-to-Wheels Analysis of Higher ... October 2015/Session 4/Anderson... ·...
17
Refinery Study and Well-to-Wheels Analysis of Higher Octane Ratings for U.S. Gasoline Jim Anderson (Ford) Lucie Duesterhoeft (GM) Asim Iqbal (FCA) Tom Leone (Ford) Bill Studzinski (GM) for 2015 CRC Life Cycle Analysis of Transportation Fuels Workshop October 28, 2015
Transcript of Refinery Study and Well-to-Wheels Analysis of Higher ... October 2015/Session 4/Anderson... ·...

Refinery Study and Well-to-Wheels Analysis of Higher Octane Ratings for U.S. Gasoline
Jim Anderson (Ford)
Lucie Duesterhoeft (GM)
Asim Iqbal (FCA)
Tom Leone (Ford)
Bill Studzinski (GM)
for 2015 CRC Life Cycle Analysis of Transportation Fuels Workshop
October 28, 2015

Background
2
GHG reductions require similar (or greater) support from fuels:
higher octane and ultimately lower fossil carbon
Increasingly challenging requirements for light duty vehicles• GHG emissions and fuel economy• Emissions (PM, NOx, hydrocarbons, …) • Safety• Performance• Content
Fuel properties and composition have been changed over time to enable emissions reductions
• Tetraethyl lead removal• Low sulfur (diesel, gasoline)• Low RVP

3
Infrastructure
~160,000 public filling stations in the U.S. ~7,000 provide an alternative fuel ~3,000 locations provide an alternative liquid fuel
Source: U.S. DOE Energy Efficiency & Renewable Energy, Alternative Fuels Data Center, http://www.afdc.energy.gov/locator/stations, October 10, 2015
Higher gasoline octane ratings are an opportunity to improve engine efficiency with the most widely available fuel
E85B20+ElectricPropaneCNGLNGH2

National and Global Variation of Fuel Octane Ratings
4
Lowest mainstream US gasoline RON limits engine compression ratios. Higher minimum market RON provides engine efficiency gain potential.
Market Gasoline RON
Sources: SGS Worldwide Summer 2014 and Winter 2014 Fuel Surveys; Alliance of Automobile Manufacturers’ North American Winter2014 and Summer 2014 Fuel Surveys; Energy Information Agency
˕ MaximumMeanMinimumQuartiles
˕
~85% ~10% ~90% ~10%Market share:
US EU28

Higher Octane Gasoline Considerations
5
Vehicle efficiency gains for higher-octane fuel can outweigh fuel production impacts, yielding net WTW reductions in CO2 emissions
CO2 Emissions
Fuel Octane Rating
% o
f B
aselin
e C
O2
WTW
Today Optimum
Higher octane fuel enables higher engine efficiency, but may increase refinery GHG emissions.Key question: Engine benefit vs. fuel cost
Well-to-wheels (WTW) analyses are needed to identify “optimum” octane ratings (CO2, oil, cost, …)

Well-To-Wheels Analyses Of Gasoline Octane Ratings
6
New considerations such as higher ethanol blends and engine advancements have driven the need for new WTW analyses
Well-to-Wheels = Well-to-Tank + Tank-to-Wheels
• 1970s US (Amoco, Exxon) No oxygenates [1,2]
• 1980 Europe (CONCAWE) No oxygenates [3]
• 2005 Japan (JCAPII) Up to E3 [4]
• 2013 Europe (CONCAWE) Up to E10, refinery only [5]
• 2014 US (MIT) Up to E20, up to 100 RON [6]
• 2015 US (ANL) Up to E40, 100 RON [7]
• 2015 US (USCAR) E10-E30, up to 102 RON [8]
1. Wagner, SAE Technical Paper 730552, 1973.2. Brown, Oil & Gas Journal, 29(9):125, 1974.3. CONCAWE, The rational utilization of fuels in private transport (RUFIT), extrapolation to unleaded gasoline case. Report No. 8/80, 1980.4. Japan Clean Air Program II (JCAPII), Study on CO2 from automobiles and refineries, June 1, 2005.5. CONCAWE, Oil refining in the EU in 2020, with perspectives to 2030, Report No. 1/13R, 2013.6. Speth et al., “Economic and Environmental Benefits of Higher-Octane Gasoline”, Environmental Science & Technology, 48(12):6561, 2014.7. Argonne National Laboratory, “Well-to-wheels Analysis of High Octane Fuels”. ANL/ESD-15/10, July 14, 2015.8. USCAR, “Well-to-Wheels Analysis of Higher Octane Ratings and Ethanol Content for Future U.S. Gasoline”, manuscript in preparation, 2015

USCAR Studies
7
WTW analysis has been conducted; report is now being written for publication
Little data available on refinery impacts
� Refinery study initiated with MathPro Inc.
Many papers on engine efficiency
impacts have been published � Critical literature review conducted.

Refinery Model
8
Linear programming (LP) model covering U.S. as three regions, two seasons
• PADDs 1,2,3 as single region; PADD 4; PADD 5
Refinery LP models identify least-cost refinery operation configurations that meet given requirements and constraints.
ApproachA regional refinery model was used to estimate effects on the U.S. refining sector for various combinations of prospective national RON standard (92 to 102 RON), ethanol content and blending approach (E10, E20, E30, E10+E85).
Key assumptions• Investments allowed• Petroleum product volume projections for 2017 from U.S. DOE EIA AEO2012, maintained for all cases
• Oil $96/bbl, natural gas $5.20/mcf (AEO2012)

Refinery Model – BOB Impacts
• Higher octane rating fuels require (for equal Exx)–Higher BOB RON –Increased reformer severity, throughput
• Higher ethanol content fuels lead to… (for equal RON fuel) –Lower BOB volumes –Lower BOB RON –Reduced reformer severity, throughput
• Cases requiring BOBs with >95 RON were considered infeasible
Reformer Severity
BOB RON
Reformer Throughput
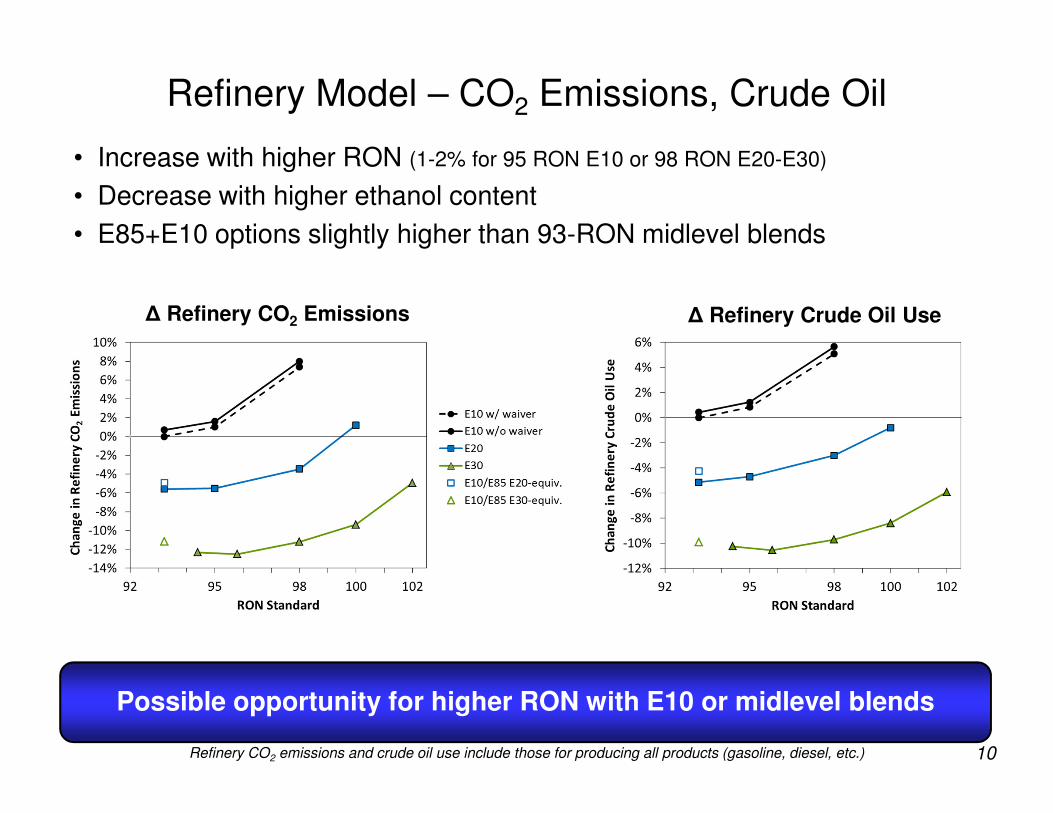
• Increase with higher RON (1-2% for 95 RON E10 or 98 RON E20-E30)
• Decrease with higher ethanol content
• E85+E10 options slightly higher than 93-RON midlevel blends
Refinery Model – CO2 Emissions, Crude Oil
10
Possible opportunity for higher RON with E10 or midlevel blends
∆ Refinery Crude Oil Use∆ Refinery CO2 Emissions
Refinery CO2 emissions and crude oil use include those for producing all products (gasoline, diesel, etc.)

Fuel production cost
• Primary factor: Costs of ethanol and crude oil
• Secondary factor: RON
Refinery Model – Cost
11
Energy price parity (ethanol = 67% of gasoline)
Oil = $96/bbl
(rel. to 93 RON E10)∆ Fuel Cost at Terminal (¢/gge)
Possible opportunity for higher RON with E10 or midlevel blends
Ethanol
Crude oil
RBOB
Recent prices (ethanol = 85% of gasoline)

Engine Efficiency Model
12
1. Fuel knock resistance (DI,GTDI)• RON • Evaporative cooling
• E0-E40 : fully included in RON*• E40+ : 1.6 ON** per 10%v ethanol
(on amount above E40)
Model documented by Leone et al., Environ. Sci. Technol. 49(18):10778 (USCAR: Ford, GM, FCA)* Foong et al., SAE Int. J. Fuels Lubr. 6(1):34, 2013 (Univ. of Melbourne)
Leone et al., SAE 2014-01-1228 (Ford)** Kasseris, SAE 2012-01-1284 (MIT)

Engine Efficiency Model
13
Engine assumption: GTDI
2. Engine CR increase• Baseline CR 10:1 GTDI• 3 ON enables 1 CR#
• Literature: 2.5 to 9 ON/CR, 2.8 in Ford GTDI studies*
3. Engine efficiency increase • CR effect • Part-load effects#,**: +0.5% eff’y
per 10%v ethanol
# Leone et al., Environ. Sci. Technol. 49(18):10778.* Jung et al., SAE 2013-01-1321
Leone et al., SAE 2014-01-1228** Jung et al., SAE 2013-01-1634

Engine Efficiency Model and CO2 Emissions
14
Greatest TTW CO2 emissions benefit for higher octane and higher ethanol blends in optimized engines (higher CR)
vs. 93 RON E10
∆ Tailpipe CO2 Emissions
vs. 92RON E10
∆ Fuel Carbon Intensity (gCO2/MJ)4. Engine CO2 emissions• Engine efficiency• Fuel carbon intensity (C wt% / LHV)
# Hirshfeld et al., ES&T, 2014.
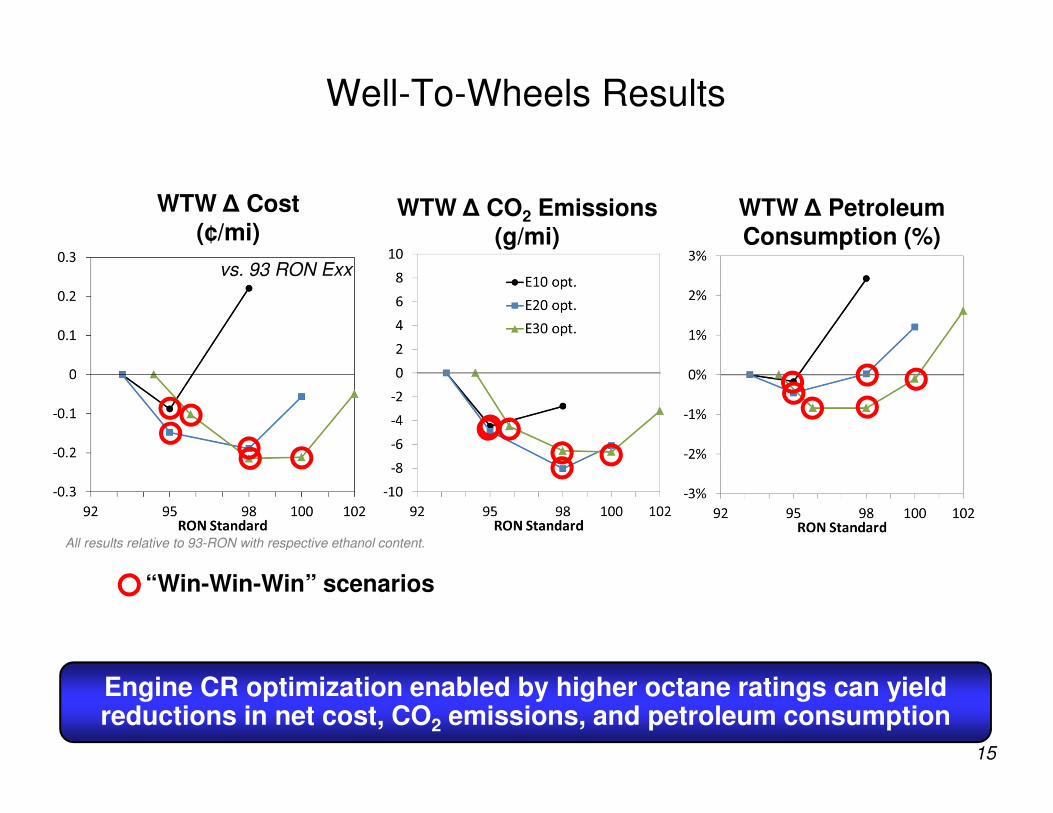
Well-To-Wheels Results
15
Engine CR optimization enabled by higher octane ratings can yield reductions in net cost, CO2 emissions, and petroleum consumption
vs. 93 RON Exx
“Win-Win-Win” scenarios
WTW ∆ Cost (¢/mi)
WTW ∆ CO2 Emissions
(g/mi)
WTW ∆ Petroleum
Consumption (%)
All results relative to 93-RON with respective ethanol content.

WTW: Cost Breakdown Example
16
Fuel cost increase offset by consumer fuel savings in higher efficiency vehicles (higher CR) enabled by higher octane fuels
95 RON E10
Baseline: Current E10
Refineries Consumers
Net 2.3 ¢/gal savings
Additional Crude Oil and Processing
+1.9 ¢/gal
Capital Expense+0.8 ¢/gal
Greater Energy Content
-0.4 ¢/gal
Higher Engine Efficiency via
Higher CR-4.5 ¢/gal

Conclusions
17
Higher octane gasoline provides an opportunity to increase light duty vehicle efficiency and reduce CO2 emissions using the predominant fuel in the U.S. market.
Ethanol is one attractive fuel option to increase octane and reduce GHG footprint.
Higher octane gasoline can provide simultaneous reductions in WTW CO2 emissions, crude oil use, and societal cost.