Reference-free quantification of EEG spectra: Combining...
21
Reference-free quantification of EEG spectra: Combining current source density (CSD) and frequency principal components analysis (fPCA) Craig E. Tenke a,b, * , Ju ¨rgen Kayser a,b a Department of Biopsychology, Unit 50, New York State Psychiatric Institute, 1051 Riverside Drive, New York, NY 10032-2695, USA b Department of Psychiatry, College of Physicians & Surgeons of Columbia University, New York, NY, USA Accepted 4 August 2005 Abstract Objective: Definition of appropriate frequency bands and choice of recording reference limit the interpretability of quantitative EEG, which may be further compromised by distorted topographies or inverted hemispheric asymmetries when employing conventional (non-linear) power spectra. In contrast, fPCA factors conform to the spectral structure of empirical data, and a surface Laplacian (2-dimensional CSD) simplifies topographies by minimizing volume-conducted activity. Conciseness and interpretability of EEG and CSD fPCA solutions were compared for three common scaling methods. Methods: Resting EEG and CSD (30 channels, nose reference, eyes open/closed) from 51 healthy and 93 clinically-depressed adults were simplified as power, log power, and amplitude spectra, and summarized using unrestricted, Varimax-rotated, covariance-based fPCA. Results: Multiple alpha factors were separable from artifact and reproducible across subgroups. Power spectra produced numerous, sharply- defined factors emphasizing low frequencies. Log power spectra produced fewer, broader factors emphasizing high frequencies. Solutions for amplitude spectra showed optimal intermediate tuning, particularly when derived from CSD rather than EEG spectra. These solutions were topographically distinct, detecting multiple posterior alpha generators but excluding the dorsal surface of the frontal lobes. Instead a low alpha/theta factor showed a secondary topography along the frontal midline. Conclusions: CSD amplitude spectrum fPCA solutions provide simpler, reference-independent measures that more directly reflect neuronal activity. Significance: A new quantitative EEG approach affording spectral components is developed that closely parallels the concept of an ERP component in the temporal domain. q 2005 International Federation of Clinical Neurophysiology. Published by Elsevier Ireland Ltd. All rights reserved. Keywords: Quantitative EEG (qEEG); Surface Laplacian; Alpha rhythm; Power spectrum; Frequency PCA; Recording reference 1. Introduction 1.1. Quantification of EEG rhythms Since Berger’s first observations of rhythmicity in the ‘resting’ EEG, the alpha rhythm has arguably become the best known and most frequently studied EEG pattern (Basar, 1997; Gloor, 1969; Niedermeyer, 1997). For healthy, awake adults, alpha is characterized by a spectral peak at approximately 8–13 Hz (the classic ‘alpha band’), and may reflect neuronal activity related to one or more distinct sources. These sources include the classic posterior ‘visual’ alpha, a sensorimotor mu rhythm, a temporal ‘third rhythm’ (Niedermeyer, 1987, 1997), and sleep-related spindle activity (Ishii et al., 2003). Evidence from animal models suggests that alpha rhythmicity is a result of both the tuning of the local cortical network (e.g. Lopes da Silva, 1991; Steriade et al., 1993; Timofeev et al., 2002), as well as the synchronous activation of thalamocortical projections via the thalamic reticular nucleus (Buzsaki, 1991; Steriade, 2000). Currently, the standard approach to study EEG rhythms uses EEG power spectra as a quantitative measure of Clinical Neurophysiology 116 (2005) 2826–2846 www.elsevier.com/locate/clinph 1388-2457/$30.00 q 2005 International Federation of Clinical Neurophysiology. Published by Elsevier Ireland Ltd. All rights reserved. doi:10.1016/j.clinph.2005.08.007 * Corresponding author. Department of Biopsychology, New York State Psychiatric Institute, Unit 50, 1051 Riverside Drive, New York, NY 10032, USA. Tel.: C1 212 543 5483; fax: C1 212 543 6540. E-mail address: [email protected] (C.E. Tenke).
Transcript of Reference-free quantification of EEG spectra: Combining...

Reference-free quantification of EEG spectra: Combining current source
density (CSD) and frequency principal components analysis (fPCA)
Craig E. Tenkea,b,*, Jurgen Kaysera,b
aDepartment of Biopsychology, Unit 50, New York State Psychiatric Institute, 1051 Riverside Drive, New York, NY 10032-2695, USAbDepartment of Psychiatry, College of Physicians & Surgeons of Columbia University, New York, NY, USA
Accepted 4 August 2005
Abstract
Objective: Definition of appropriate frequency bands and choice of recording reference limit the interpretability of quantitative EEG, which
may be further compromised by distorted topographies or inverted hemispheric asymmetries when employing conventional (non-linear)
power spectra. In contrast, fPCA factors conform to the spectral structure of empirical data, and a surface Laplacian (2-dimensional CSD)
simplifies topographies by minimizing volume-conducted activity. Conciseness and interpretability of EEG and CSD fPCA solutions were
compared for three common scaling methods.
Methods: Resting EEG and CSD (30 channels, nose reference, eyes open/closed) from 51 healthy and 93 clinically-depressed adults were
simplified as power, log power, and amplitude spectra, and summarized using unrestricted, Varimax-rotated, covariance-based fPCA.
Results: Multiple alpha factors were separable from artifact and reproducible across subgroups. Power spectra produced numerous, sharply-
defined factors emphasizing low frequencies. Log power spectra produced fewer, broader factors emphasizing high frequencies. Solutions
for amplitude spectra showed optimal intermediate tuning, particularly when derived from CSD rather than EEG spectra. These solutions
were topographically distinct, detecting multiple posterior alpha generators but excluding the dorsal surface of the frontal lobes. Instead a low
alpha/theta factor showed a secondary topography along the frontal midline.
Conclusions: CSD amplitude spectrum fPCA solutions provide simpler, reference-independent measures that more directly reflect neuronal
activity.
Significance: A new quantitative EEG approach affording spectral components is developed that closely parallels the concept of an ERP
component in the temporal domain.
q 2005 International Federation of Clinical Neurophysiology. Published by Elsevier Ireland Ltd. All rights reserved.
Keywords: Quantitative EEG (qEEG); Surface Laplacian; Alpha rhythm; Power spectrum; Frequency PCA; Recording reference
1. Introduction
1.1. Quantification of EEG rhythms
Since Berger’s first observations of rhythmicity in the
‘resting’ EEG, the alpha rhythm has arguably become the
best known and most frequently studied EEG pattern (Basar,
1997; Gloor, 1969; Niedermeyer, 1997). For healthy, awake
adults, alpha is characterized by a spectral peak at
1388-2457/$30.00 q 2005 International Federation of Clinical Neurophysiology.
doi:10.1016/j.clinph.2005.08.007
* Corresponding author. Department of Biopsychology, New York State
Psychiatric Institute, Unit 50, 1051 Riverside Drive, New York, NY 10032,
USA. Tel.: C1 212 543 5483; fax: C1 212 543 6540.
E-mail address: [email protected] (C.E. Tenke).
approximately 8–13 Hz (the classic ‘alpha band’), and
may reflect neuronal activity related to one or more distinct
sources. These sources include the classic posterior ‘visual’
alpha, a sensorimotor mu rhythm, a temporal ‘third rhythm’
(Niedermeyer, 1987, 1997), and sleep-related spindle
activity (Ishii et al., 2003). Evidence from animal models
suggests that alpha rhythmicity is a result of both the tuning
of the local cortical network (e.g. Lopes da Silva, 1991;
Steriade et al., 1993; Timofeev et al., 2002), as well as the
synchronous activation of thalamocortical projections via
the thalamic reticular nucleus (Buzsaki, 1991; Steriade,
2000).
Currently, the standard approach to study EEG rhythms
uses EEG power spectra as a quantitative measure of
Clinical Neurophysiology 116 (2005) 2826–2846
www.elsevier.com/locate/clinph
Published by Elsevier Ireland Ltd. All rights reserved.

C.E. Tenke, J. Kayser / Clinical Neurophysiology 116 (2005) 2826–2846 2827
the variance of the EEG (Bendat and Piersol, 1971; Gasser
and Molinari, 1996; Pivik et al., 1993; Pollock et al., 1991).
This information is commonly reduced even further by
integrating across normative spectral bands (e.g. 8–13 Hz
for alpha). These methodological norms provide operational
definitions of band-limited activity that are easily applied to
groups of subjects, regardless of the presence or absence of
strong rhythmicity in any EEG channel.
Quantitative EEG (qEEG) measures are frequently
applied in clinical research to compare spectral topogra-
phies recorded from individuals with identifiable pathology
with those from a normative database (e.g. Duffy et al.,
1981, 1994). Since this approach is largely descriptive, it
does not explicitly require a theoretical rationale regarding
the nature of the underlying pathology. Instead, statistically
reliable differences themselves provide the means for
classifying EEG rhythms and topographies. This approach
is limited by the characteristics of the normative group, as
well as by the quality, stability and sensitivity of the
underlying EEG differences. A methodological variation,
which relies on selected recording sites to evaluate specific
regional hypotheses (e.g. Davidson and Fox, 1989;
Henriques and Davidson, 1997), has attracted considerable
interest in research on frontal EEG asymmetry and affect in
both healthy and psychiatric populations (e.g. Allen and
Kline, 2004). The field of Brain Computer Interface (BCI)
technology provides convincing evidence for the utility of a
targeted, regional approach to qEEG (Babiloni et al., 2001;
Cincotti et al., 2003; Pfurtscheller, 2003; Pineda et al., 2003;
Wolpaw and McFarland, 1994), since only stable, reliable
EEG changes are suitable as a response interface for
neurologically impaired patients.
Each of these approaches may be appreciated from a
pragmatic, result-driven perspective. However, regional
hypotheses may be evaluated more efficiently if the
information contained in a complete scalp topography is
fully exploited, and even a useful, reproducible BCI
measure can generally be improved once its origin is
thoroughly understood. Unfortunately, only limited ana-
tomical and physiological inferences can be drawn from
EEG spectra. Bridging the gap between the neuronal
generators and the observed EEG spectra requires a
thorough understanding of the strengths and limitations of
spectral methods in the context of a volume-conduction
model.
1.2. Volume-conduction and CSD
CSD is a reference-independent measure of the strength
of extracellular current generators underlying the grossly
recorded EEG that is firmly based on a linear volume-
conduction model (Nicholson, 1973; Nicholson and Free-
man, 1975). This measure can be derived from a vector form
of Ohm’s law:
J Z sE (1)
where J is the current flow density, E is the electric field and
s is the conductivity tensor of the medium. The application
of a divergence operation (V$) allows this formal
relationship to be expressed in scalar terms
Im ZKðV$sðVFÞÞ (2)
where the CSD (Im) is a scalar quantity that is computed
from the negative gradient of the measured field potential
(KVF). If tissue impedance is spatially invariant, s may be
replaced by a scalar constant (ss), yielding Poisson’s source
equation:
KIm Z ssV2F (3)
CSD is thereby proportional to the second spatial
derivative (i.e. Laplacian; V2) of the measured field
potential.
Since CSD is always a macroscopic, volume-based
measure (Nicholson, 1973), the spatial scale and the
physical model in which Eq. (3) is cast will affect
the fidelity of the CSD as a measure of the strength of the
underlying neuronal generator. At the lowest scale, that is,
on the level of scalp-recorded EEG topographies, surface
Laplacian CSD estimates are indices of radial current flow
into the skull from (normal to) the underlying neural tissue
(i.e. radial current flow; Pernier et al., 1988; also see Yao,
2002, and Oostendorp and Oosterom, 1996, for the
relationship between the surface Laplacian and the normal
derivative of the potential gradient). Even at this macro-
scopic scale, surface Laplacians allow cautious inferences
about neuronal generators. At the next, intermediate scale,
the same topographies may be described using inverse
models to infer effective intracranial generators (e.g.
equivalent current dipoles, Scherg and von Cramen, 1985,
1986; LORETA, Pascual-Marqui et al., 1994). Although
these (non-unique) solutions concisely simplify EEG
topographies, the plausibility of putative generators must
be evaluated in the context of a realistic physiology (e.g.
dipolar generators should be oriented normal to the cortical
surface). Finally, at a microscopic scale, CSD profiles
derived from intracranial EEG recordings have the unique
capacity to dissect the ‘cortical dipole’ (Lorente de No,
1947; Mitzdorf, 1985) into physiologically meaningful
patterns of sublaminar sources and sinks (e.g. Buzsaki et
al., 1986; Holsheimer, 1987; Kraut et al., 1985; Mitzdorf,
1985; Nicholson and Freeman, 1975; Schroeder et al.,
1992). However, intracranial CSD is limited by its invasive
nature, being largely restricted to animal models, which
may explain why the relevance of intracranial CSD features
to the scalp-recorded EEG may not be obvious to basic and
clinically-oriented human electrophysiology.
The different CSD measurement scales and models
collectively provide a powerful framework for under-
standing the EEG. Notably, experience obtained from one
scale may provide insights for interpreting data at another.
For example, evidence from a surface Laplacian CSD
topography, or from a representation of it as an equivalent

C.E. Tenke, J. Kayser / Clinical Neurophysiology 116 (2005) 2826–28462828
dipole, may both support inferences regarding a particular
intracranial generator if, and only if, the generator conforms
to known neuroanatomy and physiology (e.g. the location,
orientation, time course and physiological significance is
appropriate for the region in question). Dipole solutions
have advantages if a small number of generators are
adequate to explain the data, but the physiological
plausibility of each identified source must be supported
independently. Moreover, if an inverse solution indicates an
equivalent dipole with an implausible location or orien-
tation, the most appropriate and concise simplification is a
CSD scalp topography. One example of this is when
sharply-localized irregularities in the topography arise from
partial field closure (i.e. most of the activity is locally
cancelled due to the pairing of dipolar activity, with dipole
orientations in opposite directions; cf. Fig. 3 of Tenke et al.,
1993, for an intracranial CSD analog).
1.3. EEG power spectra
1.3.1. Signal and noise in EEG power spectrum
topographies
Fourier transformation reversibly maps real-valued, time
series data into complex-valued, frequency spectra. Even
though linear system properties can be preserved in the
frequency domain, EEG rhythms have historically been
studied using non-linear simplifications of these methods
derived from statistical, random noise models (e.g. Bendat
and Piersol, 1971; Gasser and Molinari, 1996; Pivik et al.,
1993; Srinivasan et al., 1998; Tenke, 1986). These measures
emphasize the average variance (mean squared amplitude)
of a signal, without regard to spatial or temporal properties.
By Parseval’s theorem, total power is identical for temporal
and spectral functions comprising a Fourier transform pair.
While neuronal contributions to the EEG are subject to
linear superposition based on volume conduction, physio-
logical (non-signal) and technical artifacts (noise) also share
these properties which can help to disentangle their sources
from the EEG of interest. For example, the spatial
topography of eye movement or blink artifacts is consistent
with volume conduction across the scalp from the eyes,
justifying the use of linear regression methods to remove or
attenuate them (Gratton et al., 1983; Semlitsch et al., 1986;
Woestenburg et al., 1983). Likewise, muscle artifacts may
overlap EEG alpha frequencies across frontal sites (e.g.
Davidson, 1988; Goncharova et al., 2003; Lee and
Buchsbaum, 1987), but their topographic and frequency
signatures, being generally localized to the vicinity of
specific muscles (e.g. frontalis and temporalis) and
predominantly high-frequency in content, will allow their
classification as artifacts. However, none of these identify-
ing topographic properties are preserved when using power
spectra, which distort the linear relationship between signals
by expressing them as mean squares. This problem is further
exacerbated by the use of a subsequent logarithmic
transformation (Bendat and Piersol, 1971; Pivik et al.,
1993; Tenke, 1986), which can exaggerate extremely small,
but topographically reproducible errors in areas with low
EEG power. It is therefore not surprising that EEG alpha
asymmetries are more stable over posterior regions, where
alpha is prominent and well defined (e.g. Allen et al., 2004a,
b; Debener et al., 2000a).
1.3.2. Impact of the recording reference
EEG scalp topographies are invariably affected by the
choice of a recording reference. While the choice of a ‘bad’
reference may be obvious for a particular topography (e.g. a
frontal or central reference to measure an auditory N100 peak
(Simson et al., 1976; Naatanen and Picton, 1987), no
physically realizable recording reference scheme is immune
to the reference problem, including the (montage-dependent)
average reference. The reference problem is further exacer-
bated when the EEG is quantified using power spectra (Pivik
et al., 1993), which may suffer topographic distortion or the
reversal of hemispheric asymmetries (e.g. Hagemann et al.,
2001). Despite the widespread recognition of these concerns,
the implications of the choice of a recording reference on EEG
power spectrum topographies are often misunderstood.
Fig. 1 shows a heuristic illustration of the recording
reference problem for EEG alpha. In this example, a
sinusoidal waveform has a posterior (planar) topography
that varies linearly in amplitude over space. Peak amplitude
increases from 0 to C3 mV (Fpz to Pz; solid lines in Fig. 1A,
negativity up), with identical activity at lateral and midline
sites (e.g., P3ZPzZP4; C3ZCzZC4), except for an
asymmetry imposed at midfrontal sites (left-smaller-than-
right hemisphere; F3Z0.5Fz!F4Z1.5Fz). After rereferen-
cing all waveforms to Cz (dashed lines in Fig. 1A), the
asymmetry appears to reverse (the 1808 phase-shifted
waveforms are greater at F3 than F4), although the difference
waveforms are identical at all sites because they are linearly
related (Fig. 1B). In contrast, even though the absolute value
transformation produces an identical frontal asymmetry
(Fig. 1C), the difference waveforms vary across the
topography because the linear, spatial dependency of the
original waveforms is lost (Fig. 1D). Similar properties may
be shown for power (i.e. squared amplitude), and are also
preserved in the frequency domain (i.e. power spectra).
Acknowledging these problems, some investigators
routinely compare findings using two or more reference
schemes (e.g. Bruder et al., 1997; Henriques and Davidson,
1990; Reid et al., 1998; Shankman et al., 2005), based on the
implicit rationale that findings are more likely to be valid if
results are consistent for various reference schemes.
However, there is no a priori assurance that a replication
based on any equally arbitrary reference will improve the
validity and/or interpretability of the reported findings.
1.3.3. Spectral analysis of CSD waveforms
Power spectra computed from CSD waveforms provide a
reference-free representation of the current generators
underlying the EEG, as well as a concise description of EEG
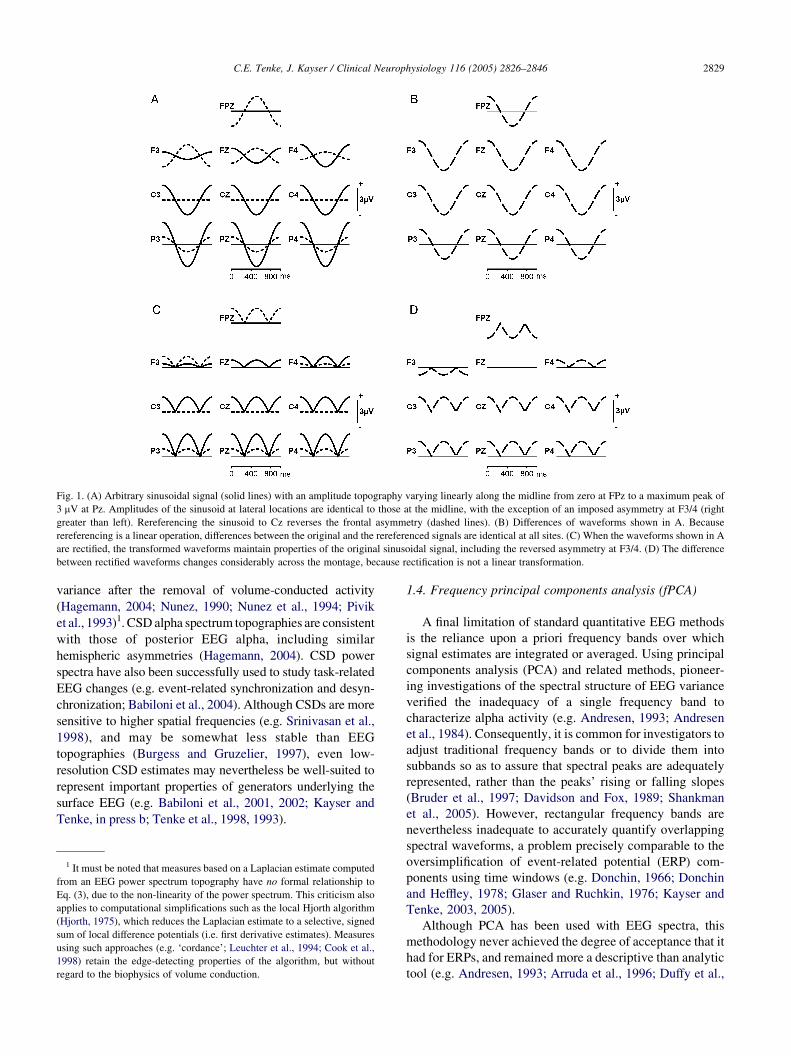
Fig. 1. (A) Arbitrary sinusoidal signal (solid lines) with an amplitude topography varying linearly along the midline from zero at FPz to a maximum peak of
3 mV at Pz. Amplitudes of the sinusoid at lateral locations are identical to those at the midline, with the exception of an imposed asymmetry at F3/4 (right
greater than left). Rereferencing the sinusoid to Cz reverses the frontal asymmetry (dashed lines). (B) Differences of waveforms shown in A. Because
rereferencing is a linear operation, differences between the original and the rereferenced signals are identical at all sites. (C) When the waveforms shown in A
are rectified, the transformed waveforms maintain properties of the original sinusoidal signal, including the reversed asymmetry at F3/4. (D) The difference
between rectified waveforms changes considerably across the montage, because rectification is not a linear transformation.
C.E. Tenke, J. Kayser / Clinical Neurophysiology 116 (2005) 2826–2846 2829
variance after the removal of volume-conducted activity
(Hagemann, 2004; Nunez, 1990; Nunez et al., 1994; Pivik
et al., 1993)1. CSD alpha spectrum topographies are consistent
with those of posterior EEG alpha, including similar
hemispheric asymmetries (Hagemann, 2004). CSD power
spectra have also been successfully used to study task-related
EEG changes (e.g. event-related synchronization and desyn-
chronization; Babiloni et al., 2004). Although CSDs are more
sensitive to higher spatial frequencies (e.g. Srinivasan et al.,
1998), and may be somewhat less stable than EEG
topographies (Burgess and Gruzelier, 1997), even low-
resolution CSD estimates may nevertheless be well-suited to
represent important properties of generators underlying the
surface EEG (e.g. Babiloni et al., 2001, 2002; Kayser and
Tenke, in press b; Tenke et al., 1998, 1993).
1 It must be noted that measures based on a Laplacian estimate computed
from an EEG power spectrum topography have no formal relationship to
Eq. (3), due to the non-linearity of the power spectrum. This criticism also
applies to computational simplifications such as the local Hjorth algorithm
(Hjorth, 1975), which reduces the Laplacian estimate to a selective, signed
sum of local difference potentials (i.e. first derivative estimates). Measures
using such approaches (e.g. ‘cordance’; Leuchter et al., 1994; Cook et al.,
1998) retain the edge-detecting properties of the algorithm, but without
regard to the biophysics of volume conduction.
1.4. Frequency principal components analysis (fPCA)
A final limitation of standard quantitative EEG methods
is the reliance upon a priori frequency bands over which
signal estimates are integrated or averaged. Using principal
components analysis (PCA) and related methods, pioneer-
ing investigations of the spectral structure of EEG variance
verified the inadequacy of a single frequency band to
characterize alpha activity (e.g. Andresen, 1993; Andresen
et al., 1984). Consequently, it is common for investigators to
adjust traditional frequency bands or to divide them into
subbands so as to assure that spectral peaks are adequately
represented, rather than the peaks’ rising or falling slopes
(Bruder et al., 1997; Davidson and Fox, 1989; Shankman
et al., 2005). However, rectangular frequency bands are
nevertheless inadequate to accurately quantify overlapping
spectral waveforms, a problem precisely comparable to the
oversimplification of event-related potential (ERP) com-
ponents using time windows (e.g. Donchin, 1966; Donchin
and Heffley, 1978; Glaser and Ruchkin, 1976; Kayser and
Tenke, 2003, 2005).
Although PCA has been used with EEG spectra, this
methodology never achieved the degree of acceptance that it
had for ERPs, and remained more a descriptive than analytic
tool (e.g. Andresen, 1993; Arruda et al., 1996; Duffy et al.,

C.E. Tenke, J. Kayser / Clinical Neurophysiology 116 (2005) 2826–28462830
1994). Moreover, the various methodological debates
among ERP researchers about the usefulness of PCA (e.g.
Wood and McCarthy, 1984; see Kayser and Tenke, 2005,
for a brief historical overview) may have dissuaded many in
the EEG community from advocating what was viewed as
an unproven and counterintuitive technique. However, the
application of PCA to ERPs has been shaped by the
construct of an ERP ‘component’ within the time domain,
which requires an identifiable neuroanatomical origin (i.e.
characteristic topography) having a distinct time course (i.e.
temporal pattern) that can be shown to vary as function of
experimental manipulation (e.g. Kayser and Tenke, 2003,
2005; Picton et al., 2000). By analogy, a spectral
‘component’ would also require a characteristic topography
with a distinct spectral shape (i.e. frequency pattern) that
can be experimentally manipulated. Under such a definition,
the phenomenon of alpha blocking could be considered a
rudimentary spectral component (frequency specificity 8–
13 Hz, posterior topography, responsive to eyes closed/
open). In contrast, the concept of classical frequency bands
explicitly meets only one these requirements (i.e. a
frequency range), relieving qEEG researchers from the
obligation to characterize the other two (i.e. topographic
specificity and condition-dependency). In the absence of an
explicit construct to guide the use of spectral methodology,
the implications of a spatially-undersampled montage or the
lack of an experimental condition verifying the prominence
or responsivity of a given spectral measure may not appear
to be as relevant.
The recent common availability of more complete
recording montages, exceeding the 10–20 standard, and
the easy access to considerable computing power has
resulted in a renewed interest in PCA for ERPs (Kayser and
Tenke, 2005). Analogous to temporal ERP data (Kayser and
Tenke, 2003), PCA methodology can overcome the
limitations of rectangular spectral windows by defining
spectral component waveforms that conform to the
underlying data. Whereas treatment-related variance in
ERPs may be observed in the amplitude variations of
individual components, the simplest analog for resting EEG
spectra is the difference in alpha between eyes-open and
eyes-closed periods. An additional shift in emphasis from
using conventional signal variance (i.e. power spectra) to
amplitude spectra and their unique topographies may further
facilitate inferences about the neurophysiological substrate
of spectral components, if they exist. Preliminary results
with this new approach, which has been termed frequency
PCA (fPCA; Kayser et al., 2000) in analogy to the terms
temporal and spatial PCA used for ERP data analysis, have
been promising (Debener et al., 2000b; Kayser et al., 2000).
The argument that solutions based on CSD amplitude
spectra are more direct reflections of neural activity than
those based on CSD power spectra is not an empirical
finding, but rather a deduction from the following facts: (1)
the relationship between the grossly recorded EEG and its
underlying neuronal current generators may be expressed
using a linear, volume-conduction model (Eq. (1)); (2) CSD
is a linear, reference-free transformation; (3) Fourier
transformation is also a linear transformation; (4) a power
transformation is not linearly related to amplitude (i.e. its
squared amplitude); (5) PCA preserves the linear properties,
since it also represents a linear solution. Given all these
facts, amplitude measures are simply more directly
interpretable as activity from localizable neuronal
generators.
In the present study, we used fPCA to extract concise,
data-driven spectral components of relevance to the
underlying neuronal generators of the resting EEG in a
large sample of human adults. To preserve information
about the current generators underlying the EEG, reference-
free CSD fPCA solutions were computed to explore their
utility for both EEG description and artifact removal, their
relationship to standard spectral bands, their stability across
samples, and their physiological interpretability. A second-
ary goal was to directly compare CSD fPCA solutions with
nose-referenced EEG fPCA solutions based on common
spectral transformations. In accordance with convention,
Fourier spectra of EEG and CSD epochs were squared and
averaged to form power spectra, which were subsequently
simplified as root mean squared (RMS) amplitude spectra,
and converted to log power spectra as the de facto standard.
Amplitude, power, and log power spectra of CSD and EEG
data were submitted to fPCA, and solutions were evaluated
using the concept of a spectral component, with a special
emphasis on the alpha rhythm.
2. Methods
2.1. Participants
Resting EEG data collected from 145 adults, pooled
across two separate studies (73 male [50.3%]; age 18–64
years [MZ34.0; SDZ9.5]; ethnicity: 92 Caucasian, 21
African-American, 32 mixed or other ethnic background),
were reanalyzed for the current study. Participants consisted
of 51 healthy adults and 94 clinically depressed, unmedi-
cated outpatients (for screening details, see Bruder et al.,
2002). Individuals were excluded if they had a history of
neurological or substance abuse disorder, and were paid
US$30 for participation. As indicated by the Edinburgh
Handedness Inventory laterality quotient (LQ; Oldfield,
1971), participants were mixed in handedness (MZ67.1,
SDZ49.6; nZ99, strongly right-handed, LQO70; nZ13,
left-handed, LQ!0). The study was approved by the
institutional review board, and participation was voluntary.
2.2. EEG recording and preprocessing methods
Scalp EEG was recorded from 13 lateral, homologous
pairs of electrodes (FP1/2; F3/4; F7/8; FC5/6; FT9/10; C3/4;
T7/8; CP5/6; TP9/10; P3/4; P7/8; P9/10; O1/2) and from

C.E. Tenke, J. Kayser / Clinical Neurophysiology 116 (2005) 2826–2846 2831
four midline electrodes (Fz; Cz; Pz; Oz) using standard 10–
20-system placements (Pivik et al., 1993) with an electrode
cap (Electro Cap International, Inc.) and a nose reference.
Electrodes at supra- and infra-orbital sites surrounding the
right eye recorded blinks and vertical eye movements
(bipolar), while electrodes at right and left outer canthi
recorded horizontal eye movements (bipolar). All electrodes
were tin, with impedances below 5 kU. EEG was recorded
using a Grass Neurodata system at a gain of 10k (5k and
2.5k for horizontal and vertical eye channels, respectively),
with a bandpass of 0.1–30 Hz. Only recordings which were
free of electrolyte bridges between electrodes were included
(Tenke and Kayser, 2001).
Continuous EEG were collected with a PC-based EEG
acquisition system (Neuroscan) and sampled at 200 Hz
during four 2-min time periods (order of eyes-open [O] and
eyes-closed [C] were counterbalanced as OCCO or COOC
across subjects). Subjects were instructed to remain relaxed,
but awake, and to avoid eye or body movements during the
recording periods. During the eyes-open periods, subjects
were also instructed to maintain their focus on a pair of
crosshairs in the center of a computer screen. The
continuous EEG data were segmented into 1.28-s epochs
(50% overlap; 0.78 Hz frequency resolution). Epochs were
rejected if amplifiers clipped. Offset-corrected EEG epochs
contaminated by amplifier drift, blinks, lateral eye move-
ments, muscle activity or movement-related artifacts were
then excluded from analysis using a rejection criterion of C100 mV on any channel, followed by artifacting under visual
guidance using a semi-automated procedure. No additional
effort was made to reduce or eliminate residual eye and
muscle artifact by linear regression approaches.
2.3. CSD computation
Epoched CSD waveforms were computed for each
accepted epoch using the spherical spline surface Laplacian
method (lambdaZ10K5; 50 iterations; mZ4) of Perrin et al.
(1989, 1990).2 These parameters have previously been
shown to result in CSD waveforms similar to those of the
local Hjorth Laplacian for electrodes near the center of this
recording montage (Tenke et al., 1998). The reference
electrode was included in the montage at a fixed location on
the sphere to improve frontal topography, and to provide
additional opportunity to detect generators that volume-
conduct widely across the recording montage (Junghofer
et al., 1999; Kayser and Tenke, in press a).
2 CSD waveforms were computed using CSD Converter (developed by
JK), a program capable of rapidly transforming continuous, epoched, and
averaged data for any EEG montage using a spherical model. The
computational engine will be provided as generic MatLab source code in a
related report (Kayser and Tenke, in press a). All topographies and
animations were created using the same spherical spline interpolation
suggested by Perrin et al. (1989, 1990), but were expressed as mV/m2 to
produce values in the same order of magnitude as the EEG.
2.4. Spectral analysis and fPCA methods
To determine common sources of variance in the spectral
data, averaged spectra were submitted to fPCA derived from
the covariance matrix, followed by unscaled Varimax
rotation (Kayser and Tenke, 2003). For ERPs, this approach
produces distinctive, orthogonal factor loadings and
weighting coefficients, which efficiently describes the
variance contributions of temporally and spatially overlap-
ping ERP components. The number of factors extracted and
retained prior to Varimax rotation was not restricted (e.g.
using a Scree test or noise variance; cf. Cattell, 1966; Horn,
1965; Kaiser, 1960), which stabilizes meaningful com-
ponents, while identifying and removing noise-related
components (Kayser and Tenke, 2003). Although several
limitations of PCA techniques (e.g. misallocation of
variance resulting from component jitter or overlap) are
well known and require caution, peak or window-based
measures are subject to the very same limitations (e.g.
Achim and Marcantoni, 1997; Beauducel and Debener,
2003; Chapman and McCrary, 1995; Dien, 1998; Mocks
and Verleger, 1986; Wood and McCarthy, 1984). While it is
possible that an oblique rotation might provide a simpler
solution set, our choice of an orthogonal rotation is
nevertheless parsimonious, in that it preserves the overall
independence of the factors (Kayser and Tenke, 2005).
By analogy with ERP methods, fPCA factor scores can
be interpreted as weighted frequency band amplitudes if the
associated factor loadings are clustered in a narrow
frequency range and lack significant secondary loadings at
different frequencies (Debener et al., 2000b; Kayser et al.,
2000). The correspondence between known EEG rhythms
(most notably alpha) and fPCA factors, in terms of spectral
tuning, topography and treatment dependency (i.e., eyes
closed vs. eyes open), allows the identification of
physiologically-relevant factors for further analysis. The
same properties effectively define the concept of an ERP
component for temporal data (Kayser and Tenke, 2005),
which may, as some have argued, be inseparably linked to
the topography defined by its underlying neuronal gen-
erators (Spencer et al., 1999, 2001). CSD fPCA solutions are
therefore more appropriate for characterizing spectral
components, since CSD provides a more direct measure of
the underlying neuronal activity than EEG.
The power spectrum is a methodological standard for
describing the spectral variance properties of a time-series
(e.g. Bendat and Piersol, 1971). Comparisons between EEG
power spectra typically use a subsequent logarithmic
transformation as a ‘normalizing’ procedure (Pivik et al.,
1993; Tenke, 1986). However, in two independent
preliminary reports, both using nose-referenced EEG data
recorded from right-handed adults (NZ29, 30-electrode
montage, Kayser et al., 2000; NZ138, 29-electrode
montage, Debener et al., 2000b), we reasoned that
amplitude scaling would restore proportionality to the
amplitude of an underlying sinusoid (i.e. RMS amplitude),

C.E. Tenke, J. Kayser / Clinical Neurophysiology 116 (2005) 2826–28462832
while preserving standard EEG methods that rely on power
spectra (Pivik et al., 1993). For both of these two data sets,
fPCA produced interpretable solutions that separated
identifiable sources of artifact from the EEG, and included
multiple treatment-dependent alpha factors. Additional
support for focusing on CSD amplitude as a measure of
neuronal activity is provided by Logothetis et al. (2001),
who reported that the BOLD fMRI response of visual cortex
in monkeys to checkerboard stimuli is correlated with the
local field potential, which is, in turn, reflected by the
intracranial CSD (Logothetis, 2003). In the present study,
we replicated and extended these preliminary EEG findings
by comparing EEG and CSD spectra for three different
quantification procedures. Mean power spectra were
computed separately for epoched EEG and CSD data
(1.28-s epochs; 0.78 Hz resolution; 50% epoch overlap;
50% Hanning window) for each participant (145), electrode
(31), and condition (eyes open vs. eyes closed). The impact
of scaling method was then examined by applying a
logarithmic3 or amplitude (square root of power) trans-
formation to the power spectrum averages, and submitting
each to fPCA using a MatLab function (appendix of Kayser
and Tenke, 2003) that emulates the PCA algorithms used by
BMDP statistical software (program 4M; Dixon, 1992).
Mean EEG spectra (0–77.2 Hz; 100 frequency pointsZ100
variables) were submitted to unrestricted covariance-based
PCA, using electrodes (30) !conditions (2) !participants
(145) as 8700 cases, followed by unscaled Varimax rotation
(Kayser and Tenke, 2003; also see Donchin and Heffley,
1978; Glaser and Ruchkin, 1976). For CSD data, the nose
reference electrode was also included (31 electrodes!2
conditions!145 participantsZ8990 cases).4
The distinctiveness and interpretability of factor loadings
and averaged factor score topographies produced by each
scaling method were compared and contrasted (see also
footnote 1). By analogy to a temporal PCA, only
physiologically meaningful fPCA components were con-
sidered (Kayser and Tenke, 2003). Since alpha activity is
the most robust and stable physiological pattern in the
resting EEG, only the most distinctive alpha factors were
further explored in this study.
The existence of a secondary topography on the frontal
midline for one CSD alpha factor made it impossible to
3 Since a covariance-based PCA of log power spectra eliminates the
proportionality of the measure (i.e. the factor scores) at different recording
sites by removing the grand mean, differences no longer represent
logarithms of ratios. Although this consideration would be of relevance
for statistical analyses of the factor scores, it is irrelevant for the present
purpose of identifying unique variance contributions in the log-transformed
data.4 Since the logarithm of zero is undefined, the reference electrode was
excluded for all EEG fPCA solutions to allow a direct comparison of the
impact of scaling method (i.e. power, log power, and amplitude spectra).
However, a comparison of the first eight rotated factor loadings for EEG
power spectrum solutions with (31 electrodes) or without (30 electrodes)
the (zero-valued) reference were virtually identical.
confidently infer an underlying neuronal generator
configuration without additional information. For this
reason, the possibility of concurrent activity in multiple
regions was evaluated by comparing factor score
topographies for subgroups based on the prominence of
the secondary focus. Because it is not possible to
distinguish between statistically independent and phase-
locked activity in any of the spectral averages, the
association between alpha waveforms in primary and
secondary regions was directly evaluated in the time
domain. For the purposes of this preliminary report,
evidence for phase-locking was derived from individual
time epochs showing strong rhythmicity, and from the
corresponding coherence spectra.
3. Results
3.1. Comparison of averaged EEG and CSD power spectra
Nose-referenced EEG power spectra (Fig. 2A) were
characterized by a prominent, condition-dependent alpha
peak at posterior sites that was superimposed on low
frequency activity at all electrodes (the ‘peak’ at 0.8 Hz is a
result of subtracting the epoch mean). Alpha was broadly
distributed, with regional variations in peak frequency and
maximal amplitude at the parietal midline (Fig. 2C).
Condition-dependent differences paralleled the topography
of alpha (Fig. 2A), but were measurable even at the frontal
midline (Fig. 2E).
Reference-independent CSD power spectra were also
characterized by prominent, condition-dependent alpha
peaks with a posterior topography, and the shape of the
alpha peak varied considerably across the topography
(Fig. 2B and D). However, in contrast to EEG power
spectra, alpha activity identified in CSD power spectra had a
more restricted topography that was more easily dis-
tinguishable from the superimposed low frequency activity.
3.2. Comparison of EEG and CSD fPCA solutions
3.2.1. fPCA solution for EEG power spectra
Fig. 3A summarizes the fPCA solution derived from
EEG power spectra. A unique color is used for each of the
first eight factor loading waveforms. For example, the factor
with the highest loading peak is plotted as a black
waveform, and its prominent peak at approximately 10 Hz
is indicated by a black line connecting the corresponding
pair of factor score topographies to the 10-Hz value on the
frequency axis (i.e. the third pair from the right; 22.1%
variance; 10.2 Hz). Factor score topographies are arranged
according to peak frequency in order to facilitate their
correspondence to loading peaks (i.e., the sequence of maps
is identical to the sequence of waveform peaks). The inset
shows the same waveforms, but using an enhanced
frequency resolution to accentuate alpha activity. Table 1

Fig. 2. Grand average power spectra of nose-referenced EEG (A) and reference-free CSD (B) in 145 adults at all 31 recording sites (including the nose tip recording
reference) for eyes closed (black dashed lines) and eyes open (solid gray lines) at rest. Enlarged spectra directly compare EEG (C and E) and CSD (D and F) at specific
sites: Pz (dashed) and P8 (solid) for eyes closed only (C and D); site Fz for eyes closed (dashed) and eyes open (solid) conditions (E and F).
C.E. Tenke, J. Kayser / Clinical Neurophysiology 116 (2005) 2826–2846 2833
lists and identifies all eight factors. For example, the first
factor is identified as ‘alpha’, with a medial/posterior
topography that is most prominent for the eyes-closed
condition.
As summarized in Table 1, six factors accounted for over
90% of the variance of the EEG power spectra. All six were
largest (greater factor scores) for eyes-closed vs. eyes-open
recording periods, and five contributed directly to alpha
activity (Fig. 3A). Although four of the five alpha factors
showed a posterior topography, the topography of the lowest
frequency factor (7.8 Hz peak) was more anterior and
largest on the midline (i.e. from Fz-to-Pz). The remaining
factor was consistent with eye artifact (0.8 Hz peak,
frontopolar topography), despite a secondary topography
along the midline and a secondary peak in alpha (Fig. 3A,
inset of loadings showing alpha). Overall, the EEG power
spectrum fPCA yielded multiple alpha factors with similar
or identical peak frequencies, and no evidence of high
frequency activity (Fig. 3A).
3.2.2. fPCA solution for CSD power spectra
As shown in Table 1, fPCA solutions for CSD power
spectra were similar to those for EEG power spectra,
producing six factors that accounted for over 90% of the
variance of the spectra, five of which were most prominent
for eyes-closed recording periods. However, in contrast to
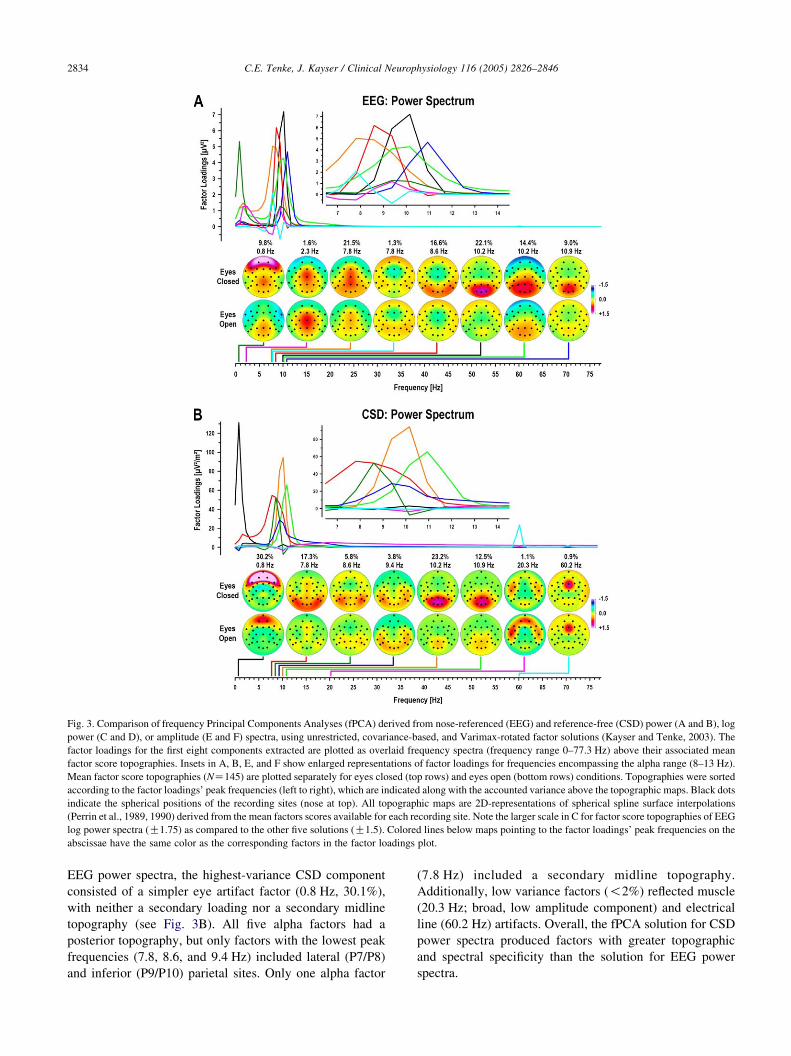
Fig. 3. Comparison of frequency Principal Components Analyses (fPCA) derived from nose-referenced (EEG) and reference-free (CSD) power (A and B), log
power (C and D), or amplitude (E and F) spectra, using unrestricted, covariance-based, and Varimax-rotated factor solutions (Kayser and Tenke, 2003). The
factor loadings for the first eight components extracted are plotted as overlaid frequency spectra (frequency range 0–77.3 Hz) above their associated mean
factor score topographies. Insets in A, B, E, and F show enlarged representations of factor loadings for frequencies encompassing the alpha range (8–13 Hz).
Mean factor score topographies (NZ145) are plotted separately for eyes closed (top rows) and eyes open (bottom rows) conditions. Topographies were sorted
according to the factor loadings’ peak frequencies (left to right), which are indicated along with the accounted variance above the topographic maps. Black dots
indicate the spherical positions of the recording sites (nose at top). All topographic maps are 2D-representations of spherical spline surface interpolations
(Perrin et al., 1989, 1990) derived from the mean factors scores available for each recording site. Note the larger scale in C for factor score topographies of EEG
log power spectra (G1.75) as compared to the other five solutions (G1.5). Colored lines below maps pointing to the factor loadings’ peak frequencies on the
abscissae have the same color as the corresponding factors in the factor loadings plot.
C.E. Tenke, J. Kayser / Clinical Neurophysiology 116 (2005) 2826–28462834
EEG power spectra, the highest-variance CSD component
consisted of a simpler eye artifact factor (0.8 Hz, 30.1%),
with neither a secondary loading nor a secondary midline
topography (see Fig. 3B). All five alpha factors had a
posterior topography, but only factors with the lowest peak
frequencies (7.8, 8.6, and 9.4 Hz) included lateral (P7/P8)
and inferior (P9/P10) parietal sites. Only one alpha factor
(7.8 Hz) included a secondary midline topography.
Additionally, low variance factors (!2%) reflected muscle
(20.3 Hz; broad, low amplitude component) and electrical
line (60.2 Hz) artifacts. Overall, the fPCA solution for CSD
power spectra produced factors with greater topographic
and spectral specificity than the solution for EEG power
spectra.

Fig. 3 (continued)
C.E. Tenke, J. Kayser / Clinical Neurophysiology 116 (2005) 2826–2846 2835
3.2.3. fPCA solution for EEG log power spectra
The EEG log power spectrum fPCA solution differed
substantially from both power spectrum solutions (Table 1;
Fig. 3C). Although five factors accounted for 90% of the
variance of these waveforms, only one represented EEG
alpha (9.4 Hz; 21.2% variance). This factor was greatest for
eyes-closed periods, and had a broad, posterior topography.
Although eye artifact was not represented by any of these
factors, the highest variance component represented muscle
artifact (75.0 Hz, 56.0%, greatest for eyes open). A beta
factor (26.6 Hz) overlapped the time course of the muscle
artifact factor and extended its topography medially (central
and frontopolar, greatest for eyes open), suggesting that it,
also, may represent muscle artifact. The remaining two
factors that accounted for more than 2.5% of the variance
represented line (60.2 Hz) and CRT (70.3 Hz) artifacts.
Thus, the EEG log power solution produced the undesirable
outcome of fewer high-variance factors, broader spectral
peaks, and greater loadings at high frequencies compared
with the EEG power spectra solution.
3.2.4. fPCA solution for CSD log power spectra
The differences between the CSD fPCA solution for log
power spectra and solutions for the other two spectra were
similar to those described for EEG fPCA. Only one of the
factors represented alpha activity (10.2 Hz; Table 1 and
Fig. 3D), and muscle artifact was reflected by a high
frequency factor (64.1 Hz, greatest for eyes-open, maximal

Fig. 3 (continued)
C.E. Tenke, J. Kayser / Clinical Neurophysiology 116 (2005) 2826–28462836
near facial musculature). A second beta factor (23.4 Hz)
was also extracted with an eyes-closed maximum that
effectively extended the peripheral topography of the
muscle artifact factor into frontal regions. Only four factors
were required to account for 90% of the variance, the last of
which was an eye artifact factor (0.8 Hz; maximum at
frontopolar and nose electrodes).
3.2.5. fPCA solution for EEG amplitude spectra
Seven factors accounted for 90% of the variance of the
EEG amplitude spectrum (Table 1, Fig. 3E). Five of these
factors contributed to alpha (i.e. see loading inset in
Fig. 3E). The three high-frequency alpha factors (9.4,
10.2, and 10.9 Hz) had posterior topographies and were
greatest for eyes-closed periods, while the lowest frequency
alpha factor (7.8 Hz) had a midline frontocentral topogra-
phy. The last of these factors also had low variance (8.6 Hz,
2.8%), a loading that included negative values within the
alpha band, no condition dependency, and a lateral
topography (Fig. 3E), suggesting that it may be a
frequency-shifting ‘correction’ factor, rather than an
independent alpha factor. The remaining two factors
represented eye (0.8 Hz, 8.2%; included a secondary alpha
loading and midline topography) and muscle artifact
(28.9 Hz, 3.7%). When compared to EEG power and EEG
log power solutions (Fig. 3A and C), the fPCA solution for
EEG amplitude spectra (Fig. 3E) was intermediate in the
density of spectral peaks (spacing of colored lines along

Tab
le1
Th
eim
pac
to
fsc
alin
gm
eth
od
on
fPC
Aso
luti
on
sfo
rE
EG
and
CS
Dsp
ectr
a
C.E. Tenke, J. Kayser / Clinical Neurophysiology 116 (2005) 2826–2846 2837

Fig. 4. Averaged topographies of the most prominent three alpha factors
derived from CSD amplitude spectra for eyes-open and eyes-closed
conditions. Topographies are shown for two separate studies (A), as well as
for healthy controls and depressed patients averaged across the studies (B).
Also shown are the mean topographies for three groups established by the
amplitude of the 8.6-Hz factor at electrode Fz for eyes closed (C). These
low, medium, and high groups differed in CSD factor amplitude not only at
midline-frontal sites, but also at posterior sites; however, despite
differences in amplitude, factor score topographies for eyes closed were
similar for all three groups. Note that although scale resolution is the same,
the absolute offset of each scale accommodates the group differences in
amplitude.
C.E. Tenke, J. Kayser / Clinical Neurophysiology 116 (2005) 2826–28462838
frequency axis) and in the number of alpha peaks
(5 vs. 6 or 4).
3.2.6.. fPCA solutions for CSD amplitude spectra
The CSD amplitude spectrum fPCA solution produced
six factors accounting for 90% of the variance (Table 1,
Fig. 3F). Three of these factors (8.6, 9.4, and 10.9 Hz) were
alpha factors, including the highest variance factor. All
three alpha factors had posterior topographies, and were
greatest for eyes-closed periods. Eye artifact (0.8 Hz,
16.6%) and muscle artifact factors (26.6 Hz, 20.0%) were
both more prominent for this fPCA solution than for either
the CSD power spectrum or the EEG amplitude spectrum.
The sixth factor was a low variance factor reflecting line
artifact (60.2 Hz, 2.0%).
Although the loading peak for the most prominent factor
was within the traditional alpha band (8.6 Hz, 26.5%), the
rising phase of the waveform included a substantial
contribution to the classical theta band (4–8 Hz, Fig. 3F).
This factor had a bilateral posterior/inferior topography that
was most prominent during eyes-closed periods, as well as a
secondary topography extending to the frontal midline, but
falling off sharply at frontocentral locations displaced from
the midline. In contrast, the high-frequency alpha factor
(10.9 Hz, 18.1%) was distinguishable by its medial parietal
topography, its steep topographic fall-off at anterior sites,
and its incomplete blockade for eyes-open periods.
Compared to the high- and low-frequency alpha factors,
the remaining alpha factor had a narrower bandwidth at an
intermediate frequency (9.4 Hz) than the other two alpha
factors (inset of Fig. 3F), with a parietal topography that was
similar to that of the high alpha factor, but less sharply
localized to sites near the midline.
3.3. fPCA alpha factors from CSD amplitude spectra:
reproducibility across groups
All three of the alpha factors from the CSD amplitude fPCA
solution showed reproducible, condition-dependent, posterior
topographies across independent samples (Fig. 4A) and
groups (healthy controls and depressed patients, Fig. 4B).
However, only the low alpha/theta factor (8.6 Hz) showed a
secondary, anterior topography, notably including the frontal
midline (electrode Fz). The consistency of these topographies
suggests that they represent a stable, physiological process,
rather than merely fortuitous variance allocation patterns.
Although the posterior alpha factor topographies are
consistent with classical descriptions of the resting alpha
rhythm, the existence of a factor straddling the alpha and
theta bands poses empirical and theoretical problems.
Specifically, it may be questioned whether the identification
of the factor as alpha (or theta) is appropriate. Instead, it
may be argued that the factor represents at least two
distinctive, but unrelated, patterns of activity that vary
across subjects, yet are sufficiently similar to be extracted as
a single (erroneous) component. In fact, task-specific theta
is known to have a midline frontal topography. Likewise, it
could be argued that the factor’s inferior/posterior topo-
graphy merely reflects the residual from a particularly broad
posterior alpha topography. Moreover, no evidence has been
shown to suggest that both topographic foci covary in
amplitude. To evaluate the feasibility of such an association,
participants were evenly divided into three groups based
exclusively on the size of the 8.6-Hz CSD amplitude
spectrum factor at electrode Fz for eyes closed, and
corresponding topographies for the high-, medium-, and
low-Fz subjects were computed (ns were 49, 48, and 48,
respectively). Despite marked quantitative differences in
factor amplitude, all three groups showed similar topo-
graphies (Fig. 4C): (1) a primary posterior/inferior
topography; (2) relatively greater amplitude at Fz than at

C.E. Tenke, J. Kayser / Clinical Neurophysiology 116 (2005) 2826–2846 2839
other (i.e. not midline) frontocentral sites; (3) markedly
greater amplitude for eyes-closed than eyes-open.
The association between the frontal and posterior foci
suggests the possibility of an even stronger association: a
direct linkage between the activity at the two widely separated
sites. One possibility is that concurrent activity at the two sites
may result from highly synchronized (coherent) processes,
such as waveforms that are precisely in-phase (0o: current
sources or sinks at the same time in both regions), out of phase
(180o: sinks in one corresponding to sources in the other), or at
another fixed phase angle. At the other extreme, it is possible
that the signals at the two sites are phase independent (i.e.
incoherent), but covary in amplitude alone. The likelihood of
one or the other of these two extremes can have major
implications for geometric, physiological, and statistical
interpretations of the underlying neuronal generators.
Although an exhaustive description of these factors is
beyond the scope of the present paper, it was reasoned that
the most restrictive linkage between waveforms (i.e.
constant phase angle) is necessary to suggest that both
foci reflect similar patterns of spectral activity. To this end,
we reviewed the epoched, filtered (15 Hz low pass) CSD
data for subjects showing the greatest factor amplitude at Fz,
adding as a further restriction that rhythmic activity should
be visible in individual CSD time epochs. Fig. 5A shows the
characteristics of a representative CSD time epoch with
these properties. The corresponding amplitude spectrum for
this epoch was sharply-tuned at 8.6 Hz, with a topography
reminiscent of the corresponding fPCA factor (Fig. 5B).
CSD alpha waveforms at midline frontal (Fz) and inferior/
posterior (P8) sites were closely time-locked and precisely
out of phase throughout this epoch (i.e. sources at Fz
correspond to sinks at P8, and visa versa).5 The wave-by-
wave topography of this linkage is also evident from
sequential series of CSD maps corresponding to successive
peaks (sinks, top series of maps) and troughs (sources,
bottom series of maps) at Fz.6 A local Hjorth Laplacian
produced the same result, indicating that the relationship
was independent of the spherical model. Thus, a common
alpha generator pattern can produce synchronized currents
at frontal and inferior foci.
4. Discussion
This study evaluated the effectiveness of frequency PCA,
which was performed on EEG amplitude, power, or log-
transformed power spectra derived from nose-referenced
5 It should be noted that for this strongly rhythmic epoch, the pairwise
coherence spectrum for Fz versus all other electrodes was also maximal at
P8, indicating a stable phase relationship between the two sites.6 An animated comparison of the corresponding EEG and CSD
topographies during this epoch (i.e. for each time point) is posted at the
following URL: http://psychophysiology.cpmc.columbia.edu/eegcsdepoch.
html
surface potentials or their reference-free CSD transformations,
to summarize and quantify EEG activity under the concept of a
‘spectral component.’ The suggested composite approach,
combining PCA and CSD methodology using amplitude
spectra, has a number of distinct advantages. First, the use of
reference-free CSD waveforms preserves a direct relationship
to the current generators that volume-conduct to produce the
scalp-recorded EEG. As such, the neuroanatomical interpret-
ations of regional findings stemming from these data are less
ambiguous than their counterparts using conventional,
reference-dependent EEG. Second, the subsequent use of an
amplitude spectrum to transform and summarize CSD
waveform topographies retains these linear properties, an
advantage that is lost for conventional power or log power
spectra. Third, instead of quantifying spectral components
with rigid, a priori rectangular frequency bands, fPCA
components adhere closely to the observed data, that is, their
variance structure. Finally, fPCA efficiently identifies and
removes artifact sources as linearly independent factors. Eye
movement artifacts are confined to a low frequency
component with a topography restricted to sites nearest the
eyes, while muscle artifacts are identifiable by a high
frequency spectrum and characteristic topography (Gonch-
arova et al., 2003; Lee and Buchsbaum, 1987).
While none of the elements of the proposed method are
new, even for EEG analyses, the suggested combination is
unique and establishes an entirely new approach for
identifying, measuring, and summarizing spectral EEG
activity. Previously, for example, other investigators have
recommended regression analysis (e.g. Davidson, 1988) or
PCA (e.g. Wallstrom et al., 2004) for removing artifact from
the resting EEG. Lagerlund et al. (2004) employed fPCA as
an interactive filter to extract, and subsequently reconstruct,
individual CSD time epochs from their complex Fourier
spectra, using amplitude spectra for display. PCA has also
been used to simplify the analysis of EEG power or log
power for data restricted to fixed, predetermined frequency
bands (Arruda et al., 1996). In contrast, the uniqueness of
the present method originates from the exploitation of the
complete spectral signature of EEG components and
artifacts using one linear method without a priori limitation,
yielding a completely ‘data-driven’ and at the same time
physiologically-meaningful approach.
4.1. Advantages of amplitude spectra
Despite a priori reasons for focusing on fPCA solutions
based on CSD amplitude spectra, the common use of log
power spectra in quantitative EEG makes it of general
interest to compare these solutions with those based on log
power spectra, as well as the power spectra from which they
are derived. The results showed that power spectrum fPCA
solutions attenuated high frequencies and produced numer-
ous alpha factors with overlapping or identical peak
frequencies, thereby severely limiting their interpretation.
On the other hand, log power spectra emphasized high

Fig. 5. (A) Representative eyes-closed CSD epoch for one participant with a high factor 8.6-Hz amplitude at Fz. Prominent CSD alpha rhythmicity at Fz and P8
tended to be precisely out of phase, with sources (sinks) at Fz being concurrent with sinks (sources) at P8. Corresponding CSD maps illustrate the linkage
between waveforms at these sites (upper row refers to Fz sinks, bottom row refers to Fz sources). Fz sinks (cold colors at mid-frontal regions, blue lines refer to
associated time point) are concurrent with inferior/posterior sources (warm colors), while Fz sources (warm colors at mid-frontal regions, red lines) frequently
correspond to inferior/posterior sinks. Note that, unlike the waveform shown, all topographies were computed after smoothing the CSD by applying a 24-db,
15-Hz low pass filter. (B) The amplitude spectrum topography of the same CSD epoch shows spectral (maximum amplitude at 8.6 Hz) and regional properties
(maxima at midline frontal and inferior/posterior sites) consistent with a prominent 8.6-Hz CSD factor (cf. Fig. 4C).
C.E. Tenke, J. Kayser / Clinical Neurophysiology 116 (2005) 2826–28462840
frequencies (including line, CRT, and muscle artifacts) and
produced few high-variance factors with broad spectral
peaks. While the latter finding could imply that log power
spectra are particularly helpful to quantify beta rather than
alpha activity, researchers should be aware that high-
frequency EEG topographies may easily be distorted by or
result from a concurrent muscle artifact. As expected,
amplitude spectra yielded solutions with the desirable
outcome of an intermediate density (number and overlap
of loadings) of alpha factors. In general, CSD fPCA
solutions were similar to those derived from nose-
referenced EEG spectra, but had the advantage of sharper
factor score topographies, and produced factor loadings
with less overlap, both in amplitude and spectral bandwidth,
thereby increasing the uniqueness of each factor.
Across scaling methods, the topographies of EEG and
CSD alpha factors varied systematically according to peak
frequency, with low frequencies (theta/low alpha) including
a midline frontocental and an inferior/posterior topography,
while higher frequencies (mid and high alpha) showed the
classic medial/posterior topography. CSD amplitude scaling
produced the simplest fPCA solution, requiring only three
spectrally- and topographically-distinct factors (i.e. minimal
overlap) to account for most of the activity in the classic
alpha band. Each of these alpha factors was present in two
independent samples of healthy adults and depressed
patients, and all were physiologically plausible (posterior
topographies, greatest for eyes closed).
Furthermore, a comparison across scaling methods using
fPCA indicates that the choice of a log power spectrum may
misrepresent the underlying data, particularly when used in
concert with predetermined frequency bands. Much of the
variance about the mean of the EEG log power spectrum
was summarized by a single alpha factor (additional alpha
factors had lower variance) with a substantial roll-off into
adjoining frequency bands (Fig. 3C), meaning that activity
representing the traditional alpha band systematically
covaries with theta and beta activity with this scaling.
This finding indicates that an 8–13 Hz frequency band
would be an arbitrary choice. Conversely, rectangular
frequency estimates of alpha will also include contributions
from spectral components outside the alpha band, most
notably including EEG theta and muscle artifact, depending
on the amount of overlap. This problem is particularly
pervasive for regions and conditions in which alpha
amplitudes are low (e.g. at frontal sites or at rest with
eyes open).
4.2. Limitations of the proposed method
Despite the empirical and theoretical elegance of CSD
methodology, a surface Laplacian estimate is restricted to
the spatial domain in which the EEG is recorded: the scalp.
Moreover, it disproportionately represents superficial
generators (Nunez, 1990; Nunez et al., 1997; Srinivasan et
al., 1998). Consequently, to the extent that EEG rhythms are
widely synchronized across the scalp (Steriade, 2000), or
are transmitted locally through cortex by wave-propagation
(Robinson, 2003), local scalp-potential gradients may be
sufficiently shallow to be poorly resolved by a surface

C.E. Tenke, J. Kayser / Clinical Neurophysiology 116 (2005) 2826–2846 2841
Laplacian. In these cases, low-resolution estimates may
actually give a better qualitative description of EEG
generators than those observed using high resolution
methods. When it is suspected that a CSD topography is
over-resolved, this descriptive information may be restored
by using a multiresolutional approach, either by varying the
spatial filter properties of the CSD algorithm itself (e.g.
using lower resolution subsets of electrodes; Tenke et al.,
1993), or by exploiting the spatial filter properties of the
different EEG measures (e.g. field potentials, CSD and
cortical image; Nunez et al., 1997).
An additional concern is that CSD estimates are model-
dependent, making it particularly important to assure that a
chosen computational algorithm behaves appropriately for
effects that have been determined to be important. However,
algorithm- or model-dependent errors can be discounted if it
can be shown that estimates based on different models
produce similar solutions (e.g. Tandonnet et al., 2005, and
Tenke et al., 1998, for similarity of local Hjorth and
spherical spline Laplacians). Likewise, CSD estimates near
the edges of the montage must always be interpreted with
caution, since they are invariably based on insufficient
sampling at these locations (i.e., there are no data for
locations outside the montage).
Even without any evidence that a surface Laplacian is an
effective method to summarize EEG spectra, the fact that it
provides a reference-independent simplification of EEG
topographies is by itself sufficient to endorse its use over
traditional qEEG measures. Although it might be argued
that more information is provided by other source imaging
methods (for a review, see Michel et al., 2004), such as
BESA (Scherg and von Cramon, 1985, 1986), which can
precisely localize equivalent dipoles within a simplified
geometric model, the solutions are non-unique and will fail
if discrete, equivalent dipoles are inadequate to describe a
particular generator. A useful alternative to fitting equival-
ent dipoles to the data is to localize the generators of Eq. (1)
as smoothed, three-dimensional equivalent ‘clouds’
(LORETA; Pascual-Marqui et al., 1994). The most obvious
shortcomings of this approach are that punctate generators
will be smeared (Grave de Peralta Menendez and Gonzalez
Andino, 2000), and the local sign (i.e. ‘dipole orientation’)
of the generators may lose a precise relationship to regional
cytoarchitecture (i.e. the degree of smoothing may be
prevent an accurate representation of the pattern of
intracortical sources and sinks, or their alignment with
cortical projection cells). However, a greater concern for the
present purposes is that the models themselves must be
conducive to developing a quantitative method. In contrast
to other methods, a surface Laplacian can be used as a
preprocessing step that does not preclude either the
production of spectral measures, or their subsequent
simplification using fPCA.
In this study of resting EEG, conventional power
spectrum averages were scaled to operationally define the
‘effective’ amplitude of a sinusoidal signal (Fourier
component) by its RMS amplitude. Although power
spectra are a methodological standard (e.g. Davidson et
al., 2000; Pivik et al., 1993), its square root, the CSD
amplitude spectrum recasts variance-related data in way
that is more directly (and intuitively) related to the
underlying volume-conductor model. Amplitude spectra
thereby provide a closer analog to conventional peak or
window measures of ERP amplitude, particularly when the
EEG shows a stable rhythm. However, it cannot be inferred
that amplitude scaling is optimal for active EEG
paradigms, in which alpha is not necessarily the dominant
physiological signal (e.g. Davidson et al., 1990; Koles et
al., 2001; Lind et al., 1999; Papousek and Schulter, 2004).
A recommendation for EEG measures in these tasks must
await empirical evaluation.
Although the approach outlined here is considerably
more powerful than similar methods in standard use, the
amplitude spectrum is limited by its lack of phase
information. For this reason, as outlined below, supplemen-
tal methods may be required to evaluate multiple generators.
An alternative approach using cross spectra retains phase
information (e.g. Lind et al., 1999; Pizzagalli et al., 2001).
However, it should be noted that cross-spectrum means do
not represent all activity, but rather all activity that is shared
(correlated) across electrodes (e.g. Bendat and Piersol,
1971). The difference is not trivial, since the two approaches
summarize a fundamentally distinct subset of activity from
that described by either CSD amplitude spectra or
conventional EEG power spectra.
The use of fPCA methodology completely avoids the
problems inherent in the use of rigidly-defined rectangular
frequency bands by matching non-rectangular templates (i.e.
components) to the variance structure of the data. Following
the approach developed for ERPs (Kayser and Tenke, 2003),
we used a covariance-based PCA with unrestricted factor
extraction and Varimax rotation of the unscaled (covariance)
loadings. Using this approach, ERP factors were more directly
interpretable (i.e. more useful) when extracted using a
covariance rather than correlation association matrix, and
the components were better defined and more stable using
unrestricted solutions rather than solutions employing factor
retention criteria (e.g. a Scree test). High-variance factors
tended to improve rapidly as successive factors were
extracted, reflecting, at least in part, the removal of noise
from overlapping waveforms of interest. However, low-
variance factors required cautious consideration, and were
regarded as interpretable when, and only when, the shape of
the loadings and the topography of the factor scores were both
consistent with an independently-verified physiological
component (Kayser and Tenke, 2003). These cautions apply
even more strongly to fPCA, since the properties of spectral
waveforms are not as well understood. However, it was
previously shown that the general principles of an unrestricted,
covariance-based Varimax-PCA detailed for ERP data
(Kayser and Tenke, 2003) also apply to nose-referenced
EEG spectra (Kayser et al., 2000).

C.E. Tenke, J. Kayser / Clinical Neurophysiology 116 (2005) 2826–28462842
For the temporal PCA used with ERP data, the
prestimulus period provides appreciable information about
the quality of a baseline-corrected ERP recording, as well as
about the interpretability of a PCA factor solution (Kayser
and Tenke, 2003). The variance is small near the onset of the
stimulus, and large near the end of the recording epoch, and
at treatment-dependent ERP component peaks (Kayser and
Tenke, 2003; Lehmann and Skrandies, 1980; van Boxtel,
1998). For spectral data, the highest signal variance is
generally observed at the lowest frequencies (i.e. the
beginning of the spectral epoch), while an identifiable
‘zero’ at high frequencies can serve a comparable function
for fPCA solutions. Since large amplitude loadings at high
frequencies are likely to represent or include artifact, such
factors should be interpreted only after a critical evaluation
of factor score topographies. As with ERP data, negative-
valued regions of a fPCA topography must also be
interpreted with caution, as the sign of the factor scores
reflect variations around the grand mean that has been
removed by factoring the covariance matrix. Since
amplitude spectra are exclusively positive-valued, the
numerical zero used as a reference point has a different
meaning than it does for a temporal PCA derived from
baseline-corrected ERP data.7 As a final limitation, the
impact of additional parametric variations should also be
explored (e.g. epoch duration, which is inversely related to
the frequency resolution of the FFT), as the present study
conveniently applied PCA methodology optimized for ERP
data (Kayser and Tenke, 2003).
4.3. Identification of spectral components of the EEG
The topography and symmetry of EEG alpha figures
prominently in recent models of brain function and
psychopathology, with a particular emphasis on frontal
alpha (Bruder et al., 1997; Davidson, 1998; Hagemann,
2004; Heller et al., 1995; Shankman et al., 2005).
However, the stability and asymmetry of the alpha
topography may vary, depending on the electrode site
and the recording reference (cf. Fig. 1; Allen et al., 2004a,
b; Debener et al., 2000a; Hagemann et al., 2001; Reid
et al., 1998). Inasmuch as the CSD fPCA detailed here
offers a reliable, reference-independent approach that
summarizes the distribution of the underlying current
generators, it could provide a much-needed standard for
this difficult field.
Alpha rhythmicity in the resting EEG has a well-
documented posterior topography. The fPCA solutions all
support this classic property for high-frequency alpha
(peaksO10 Hz). However, additional low-frequency alpha
7 All values of the grand mean amplitude spectra waveform are positive-
valued (i.e. equal to or greater than zero). In contrast, the values of a grand
mean ERP waveform can have either sign. In both cases, however, the sign
of the factor scores must be interpreted with respect to the corresponding
loading interval of the grand mean waveform for a given factor.
factors were also extracted in most solutions, characterized by
inferior/posterior and midline anterior topographies. Although
fPCA solutions for EEG and CSD differed in the number and
prominence of alpha factors, the solution for reference-free
CSD amplitude spectra was the most simple, separating a low
alpha factor from a high alpha factor, as well as an additional
intermediate alpha factor. The latter alpha factor had a sharper
and more symmetric loading waveform than the other alpha
factors, with a midline posterior topography that was similar
to, but shallower than that of the high-alpha factor. In contrast,
low alpha was maximal at inferior locations. By virtue of the
CSD transformation, it can be concluded that the generators of
all factors were localizable to posterior brain regions, which is
consistent with previous surface Laplacian descriptions
(Nunez et al., 1997; Srinivasan et al., 1998). In further
accordance with the concept of a spectral component, all three
alpha factors showed a condition-related dependency (i.e.
greater amplitude with eyes closed), and were reproducible
across groups and studies. Rhythmicity in motor regions
attributable to mu rhythm was not observed among the high-
variance factors (i.e. the first 10 extracted) in our sample of
resting EEG, suggesting that this phenomenon does not
account for or contribute to the alpha topographies observed
on a group level. Similarly, and notably, no factor suggested
generators on the dorsal surface of the frontal lobes. The lack
of evidence for additional frontal generators in such a large
sample is problematical for existing models of resting EEG
asymmetries.
The rising slope of the low alpha loading spectrum
includes a prominent theta contribution, with a topography
that includes a secondary focus on the frontal midline.
Interestingly, task-dependent theta has a similar midline-
frontal topography (Gevins and Smith, 2000; Gevins
et al., 1997; McEvoy et al., 2001). By submitting cross-
spectra (i.e. unscaled coherent activity) to LORETA,
Pizzagalli et al. (2001) localized the effective generators of
task-related theta to anterior cingulate cortex. Luu et al. (2004)
found evidence for a midfrontal theta contribution to the error-
related negativity. Using Parallel Factor Analysis and PCA,
Miwakeichi et al. (2004) reported a comparable localization of
scalp- and intracranially-recorded theta during arithmetic
tasks. Moreover, theta during working memory tasks is
synchronized between prefrontal and posterior association
regions (Sarnthein et al., 1998), and can be recorded from
extrastriate visual cortex (monkeys; Lee et al., 2005).
Although caution must be used when comparing the spectral
properties of the resting and task-related EEG (as well as
ERP), it is tempting to suggest a common anatomical and
physiological origin (i.e. the ‘low alpha’ factor reported here
represents activity in the theta band), particularly considering
the report of an anterior-midline, lorazepam-resistant, resting
EEG alpha (LORETA; Connemann et al., 2005).
Although the scalp-recorded EEG represents volume-
conducted activity, local intracranial cancellation (i.e.
partial field closure) can have a measurable impact on a
topography. Such properties may take the form of abrupt

C.E. Tenke, J. Kayser / Clinical Neurophysiology 116 (2005) 2826–2846 2843
transitions or discontinuities in an otherwise regular
topography. One model-dependent implication of these
irregularities is the occasional localization of a physiologi-
cally implausible generator, such as a radially-oriented
dipole aligned within the frontal midline. A physiologically
plausible generator must represent both the location and the
organization of the tissue, so that the dipole-equivalent to a
laminar pattern of sources and sinks must be oriented
normal to the cortical surface (‘cortical dipole’ of Lorente
de No, 1947; also see Mitzdorf, 1985; Tenke et al., 1993).
However, bilateral activation of homologous regions in both
hemispheres must be resolved as a pair of tangentially-
oriented dipoles in direct opposition to each, reflecting a
local field that is largely, but incompletely, cancelled, to
leave a small, sharply-localized residual at the midline (cf.
Fig. 3 of Tenke et al., 1993).
The secondary midline frontal focus illustrates both the
strengths and the limitations of the composite fPCA
approach based on CSD amplitude spectra. The sharply-
localized topography along the frontal midline is
consistent with an effective midline generator, resulting
from the synchronized, bilateral activation of symmetric
cortical regions on both surfaces within the longitudinal
fissure. However, a CSD topography produced by bilateral
generators confined to the walls of the fissure would either
be displaced to the lateral surface of the frontal lobes
(analogous to the displacement of auditory N1 CSD
topography from the Sylvian fissue; cf. Fig. 2 of Tenke et
al., 1998), or else would produce field closure artifacts at
nearby electrodes (e.g. sinks at Fz surrounded by smaller
sources at F3 and F4; Tenke et al., 1993, and unpublished
observations of surface Laplacian topographies for
simulated closed fields). These distinctive properties
should be clearest in individual cases and records, where
there is no possibility of smearing across subjects or
states.
The representative example given in Fig. 5 argues
strongly against a bilateral, sulcal generator based on two
observations: (1) CSD sources and sinks were not strictly
confined to midline electrodes; (2) midline sources and
sinks were not coupled with misallocated complements (i.e.
sinks and sources, respectively) at midfrontal sites (i.e.
F3/4). Moreover, a deeper pair of sulcal generators (e.g.
bilateral cingulate cortex), if their activity could indeed be
recorded at scalp, is more likely to produce a bilateral CSD
topography that is displaced from the midline. This is due
both to the extensive cancellation of the opposing effective
dipoles at a (tangential) distance and to the reinforcement of
the field potential orthogonal to the lamination of the cortex
(i.e. in the direction of the underlying white matter). Given
these considerations, we conclude that the high-amplitude,
8 A precise model of the properties of putative midline generators could
only be produced from the laminar pattern of CSD sources and sinks
obtained from intracranial recordings.
midline-frontal alpha observed here originated from
generators distributed over cortex within and adjacent to
the longitudinal fissure (i.e. near the convexity), rather than
from deep within the fissure (e.g. cingulate cortex).8
It may be argued that the fPCA of the CSD amplitude
spectrum provided an oversimplified solution, statistically
combining the contributions of inferior/posterior low alpha
with an independent midline theta that has a similar
spectrum. Although we cannot universally refute the
possibility, the present findings do indicate that the
activity of the midline-frontal generator is associated
with the activity at posterior/inferior sites. The prominence
of the frontal focus varies across subjects in direct relation
to the amplitude of the larger, posterior alpha generator
(Fig. 4C). Consistently, the sample epoch illustrated in
Fig. 5 indicates a precise inversion of frontal midline and
posterior/inferior CSD waveforms. This pattern is not a
result of the spherical Laplacian model, because the same
relationship was verified using a planar local Hjorth
Laplacian. The close association between regions was
further supported by examining pairwise coherences with
Fz between electrodes, which were similar to the power
spectrum shown in Fig. 5.
Finally, one could suggest that a single pair of posterior
generators can account for the entire topography.
Specifically, frontal alpha activity may merely reflect the
intersection of the underside of posterior dipoles.
However, this degree of symmetry and focus is unlikely
for a CSD feature recorded at such a distance from its
underlying generator. Moreover, a single pair of posterior
generators cannot account for all cases, most notably the
pattern illustrated in Fig. 5, because midline and posterior
CSD amplitudes are comparable, and posterior activity is
asymmetric. Therefore, we conclude that the midline
frontal CSD focus reflects a distinct neuronal generator
that may, at times, synchronize with activity at posterior
sites.
Acknowledgements
This work was supported in part by grant MH36295 from
the National Institute of Mental Health (NIMH).
We greatly appreciate the assistance of Nil Bhattacharya,
Carlye Griggs, Paul Leite, Mia Sage, Stewart Shankman,
and Barbara Stuart with data collection, storage, and
preprocessing.
Waveform plotting software was written by Charles L.
Brown, III, who also provided helpful insights during the
implementation of the spherical spline algorithm, benefit-
ting from gracious advice given earlier by Patrick Berg.
A preliminary summary of this report has been presented
at the 43rd Annual Meeting of the Society for Psychophy-
siological Research (SPR), October 2003, Chicago, IL.

C.E. Tenke, J. Kayser / Clinical Neurophysiology 116 (2005) 2826–28462844
References
Achim A, Marcantoni W. Principal component analysis of event-related
potentials: misallocation of variance revisited. Psychophysiology 1997;
34(5):597–606.
Allen JJ, Kline JP. Frontal EEG asymmetry, emotion, and psycho-
pathology: the first, and the next 25 years. Biol Psychol 2004;
67(1–2):1–5.
Allen JJ, Coan JA, Nazarian M. Issues and assumptions on the road from
raw signals to metrics of frontal EEG asymmetry in emotion. Biol
Psychol 2004a;67(1–2):183–218.
Allen JJ, Urry HL, Hitt SK, Coan JA. The stability of resting frontal
electroencephalographic asymmetry in depression. Psychophysiology
2004b;41(2):269–80.
Andresen B. Multivariate statistical methods and their capability to
demarcate psychophysiologically and neurophysiologically sound
frequency components of human scalp EEG. In: Zschocke S,
Speckmann E-J, editors. Basic mechanisms of the EEG. Boston, MT:
Birkhauser; 1993. p. 317–52.
Andresen B, Stemmler G, Thom E, Irrgang E. Methodological conditions of
congruent factors—a comparison of EEG frequency structure between
hemispheres. Multivar Behav Res 1984;19(1):3–32.
Arruda JE, Weiler MD, Valentino D, Willis WG, Rossi JS, Stern RA,
Gold SM, Costa L. A guide for applying principal-components analysis
and confirmatory factor analysis to quantitative electroencephalogram
data. Int J Psychophysiol 1996;23(1–2):63–81.
Babiloni F, Cincotti F, Bianchi L, Pirri G, del R Millan J, Mourino J,
Salinari S, Marciani MG. Recognition of imagined hand movements
with low resolution surface Laplacian and linear classifiers. Med Eng
Phys 2001;23(5):323–8.
Babiloni C, Babiloni F, Carducci F, Cincotti F, Rosciarelli F, Arendt
Nielsen L, Chen AC, Rossini PM. Human brain oscillatory activity
phase-locked to painful electrical stimulations: a multi-channel EEG
study. Hum Brain Mapp 2002;15(2):112–23.
Babiloni C, Babiloni F, Carducci F, Cappa SF, Cincotti F, Del Percio C,
Miniussi C, Moretti DV, Rossi S, Sosta K, Rossini PM. Human cortical
responses during one-bit short-term memory. A high-resolution EEG
study on delayed choice reaction time tasks. Clin Neurophysiol 2004;
115(1):161–70.
Basar E. Towards a renaissance of ‘alphas’. Int J Psychophysiol 1997;
26(1–3):1–3.
Beauducel A, Debener S. Misallocation of variance in event-related
potentials: simulation studies on the effects of test power, topography,
and baseline-to-peak versus principal component quantifications.
J Neurosci Methods 2003;124(1):103–12.
Bendat JS, Piersol AG. Random data: analysis and measurement
procedures. New York, NY: Wiley-Interscience; 1971.
Bruder GE, Fong R, Tenke CE, Leite P, Towey JP, Stewart JE, McGrath PJ,
Quitkin FM. Regional brain asymmetries in major depression with or
without an anxiety disorder: a quantitative electroencephalographic
study. Biol Psychiatry 1997;41(9):939–48.
Bruder GE, Kayser J, Tenke CE, Leite P, Schneier FR, Stewart JW,
Quitkin FM. Cognitive ERPs in depressive and anxiety disorders during
tonal and phonetic oddball tasks. Clin Electroencephalogr 2002;33(3):
119–24.
Burgess AP, Gruzelier J. How reproducible is the topographical distribution
of EEG amplitude? Int J Psychophysiol 1997;26(1–3):113–9.
Buzsaki G. The thalamic clock: emergent network properties. Neuroscience
1991;41(2–3):351–64.
Buzsaki G, Czopf J, Kondakor I, Kellenyi L. Laminar distribution of
hippocampal rhythmic slow activity (RSA) in the behaving rat: current-
source density analysis, effects of urethane and atropine. Brain Res
1986;365(1):125–37.
Cattell RB. Scree test for number of factors. Multivar Behav Res 1966;1(2):
245–76.
Chapman RM, McCrary JW. EP component identification and measure-
ment by principal components analysis. Brain Cogn 1995;27(3):
288–310.
Cincotti F, Mattia D, Babiloni C, Carducci F, Salinari S, Bianchi L,
Marciani MG, Babiloni F. The use of EEG modifications due to motor
imagery for brain–computer interfaces. IEEE Trans Neural Syst
Rehabil Eng 2003;11(2):131–3.
Connemann BJ, Mann K, Lange Asschenfeldt C, Ruchsow M,
Schreckenberger M, Bartenstein P, Grunder G. Anterior limbic alpha-
like activity: a low resolution electromagnetic tomography study with
lorazepam challenge. Clin Neurophysiol 2005;116(4):886–94.
Cook IA, O’Hara R, Uijtdehaage SH, Mandelkern M, Leuchter AF.
Assessing the accuracy of topographic EEG mapping for determining
local brain function. Electroencephalogr Clin Neurophysiol 1998;
107(6):408–14.
Davidson RJ. EEG measures of cerebral asymmetry: conceptual and
methodological issues. Int J Neurosci 1988;39(1–2):71–89.
Davidson RJ. Affective style and affective disorders: perspectives from
affective neuroscience. Cognition Emotion 1998;12(3):307–30.
Davidson RJ, Fox NA. Frontal brain asymmetry predicts infants’ response
to maternal separation. J Abnorm Psychol 1989;98(2):127–31.
Davidson RJ, Chapman JP, Chapman LJ, Henriques JB. Asymmetrical
brain electrical activity discriminates between psychometrically-
matched verbal and spatial cognitive tasks. Psychophysiology 1990;
27(5):528–43.
Davidson RJ, Jackson DC, Larson CL. Human electroencephalography. In:
Cacioppo JT, Tassinary LG, Bernston GG, editors. Handbook of
psychophysiology. 2nd ed. Cambridge: Cambridge University Press;
2000. p. 27–52.
Debener S, Beauducel A, Brocke B, Kayser J. Resting anterior EEG alpha
asymmetry and affective style: effects of electrode location and
reference. J Psychophysiol 2000a;14(1):62.
Debener S, Kayser J, Tenke CE, Beauducel A. Principal components
analysis (PCA) as a tool for identifying EEG frequency bands: II.
Dissociation of resting alpha asymmetries. Psychophysiology 2000b;
37:S35.
Dien J. Addressing misallocation of variance in principal components
analysis of event-related potentials. Brain Topogr 1998;11(1):43–55.
Dixon WJ, editor. BMDP statistical software manual: to accompany the 7.0
software release. Berkeley, CA: University of California Press; 1992.
Donchin E. A multivariate approach to the analysis of average evoked
potentials. IEEE Trans Biomed Eng 1966;13(3):131–9.
Donchin E, Heffley EF. Multivariate analysis of event-related potential
data: a tutorial review. In: Otto DA, editor. Multidisciplinary
perspectives in event-related brain potential research. Proceedings of
the fourth international congress on event-related slow potentials of the
brain (EPIC IV), Hendersonville, NC, April 4–10, 1976. Washington,
DC: The Office; 1978. p. 555–72.
Duffy FH, Bartels PH, Burchfiel JL. Significance probability mapping: an
aid in the topographic analysis of brain electrical activity. Electro-
encephalogr Clin Neurophysiol 1981;51(5):455–62.
Duffy FH, Hughes JR, Miranda F, Bernad P, Cook P. Status of quantitative
EEG (QEEG) in clinical practice. Clin Electroencephalogr 1994;25(4):
VI–XXII.
Gasser T, Molinari L. The analysis of the EEG. Stat Methods Med Res
1996;5(1):67–99.
Gevins A, Smith ME. Neurophysiological measures of working memory
and individual differences in cognitive ability and cognitive style. Cereb
Cortex 2000;10(9):829–39.
Gevins A, Smith ME, McEvoy L, Yu D. High-resolution EEG mapping of
cortical activation related to working memory: effects of task difficulty,
type of processing, and practice. Cereb Cortex 1997;7(4):374–85.
Glaser EM, Ruchkin DS. Principles of neurobiological signal analysis. New
York: Academic Press; 1976.
Gloor P. Hans Berger and the discovery of the electroencephalogram.
Electroencephalogr Clin Neurophysiol Suppl 1969;28:1–36.

C.E. Tenke, J. Kayser / Clinical Neurophysiology 116 (2005) 2826–2846 2845
Goncharova II, McFarland DJ, Vaughan TM, Wolpaw JR. EMG
contamination of EEG: spectral and topographical characteristics.
Clin Neurophysiol 2003;114(9):1580–93.
Gratton G, Coles MGH, Donchin E. A new method for off-line removal of
ocular artifact. Electroencephalogr Clin Neurophysiol 1983;55(4):
468–84.
Grave de Peralta Menendez R, Gonzalez Andino SL. Discussing the
capabilities of Laplacian minimization. Brain Topogr 2000;13(2):
97–104.
Hagemann D. Individual differences in anterior EEG asymmetry:
methodological problems and solutions. Biol Psychol 2004;67(1–2):
157–82.
Hagemann D, Naumann E, Thayer JF. The quest for the EEG reference
revisited: a glance from brain asymmetry research. Psychophysiology
2001;38(5):847–57.
Heller W, Etienne MA, Miller GA. Patterns of perceptual asymmetry in
depression and anxiety: implications for neuropsychological models of
emotion and psychopathology. J Abnorm Psychol 1995;104(2):327–33.
Henriques JB, Davidson RJ. Regional brain electrical asymmetries
discriminate between previously depressed and healthy control
subjects. J Abnorm Psychol 1990;99(1):22–31.
Henriques JB, Davidson RJ. Brain electrical asymmetries during cognitive
task performance in depressed and nondepressed subjects. Biol
Psychiatry 1997;42(11):1039–50.
Hjorth B. An on-line transformation of EEG scalp potentials into
orthogonal source derivations. Electroencephalogr Clin Neurophysiol
Suppl 1975;39(5):526–30.
Holsheimer J. Electrical conductivity of the hippocampal CA1 layers and
application to current-source-density analysis. Exp Brain Res 1987;
67(2):402–10.
Horn JL. A rationale and test for the number of factors in factor-analysis.
Psychometrika 1965;30(2):179–85.
Ishii R, Dziewas R, Chau W, Soros P, Okamoto H, Gunji A, Pantev C.
Current source density distribution of sleep spindles in humans as found
by synthetic aperture magnetometry. Neurosci Lett 2003;340(1):25–8.
Junghofer M, Elbert T, Tucker DM, Braun C. The polar average reference
effect: a bias in estimating the head surface integral in EEG recording.
Clin Neurophysiol 1999;110(6):1149–55.
Kaiser HF. The application of electronic computers to factor analysis. Educ
Psychol Meas 1960;20:141–51.
Kayser J, Tenke CE. Optimizing PCA methodology for ERP component
identification and measurement: theoretical rationale and empirical
evaluation. Clin Neurophysiol 2003;114(12):2307–25.
Kayser J, Tenke CE. Trusting in or breaking with convention: towards a
renaissance of principal components analysis in electrophysiology. Clin
Neurophysiol 2005;116(8):1747–53.
Kayser J, Tenke CE. Principal components analysis of Laplacian
waveforms as a generic method for identifying ERP generator patterns:
I. Evaluation with auditory oddball tasks. Clin Neurophysiol, in press a.
Kayser J, Tenke CE. Principal components analysis of Laplacian
waveforms as a generic method for identifying ERP generator patterns:
II. Adequacy of low-density estimates. Clin Neurophysiol, in press b.
Kayser J, Tenke CE, Debener S. Principal components analysis (PCA) as a
tool for identifying EEG frequency bands: I. Methodological
considerations and preliminary findings. Psychophysiology 2000;37:
S54.
Koles ZJ, Flor Henry P, Lind JC. Low-resolution electrical tomography of
the brain during psychometrically matched verbal and spatial cognitive
tasks. Hum Brain Mapp 2001;12(3):144–56.
Kraut MA, Arezzo JC, Vaughan Jr HG. Intracortical generators of the flash
VEP in monkeys. Electroencephalogr Clin Neurophysiol 1985;62(4):
300–12.
Lagerlund TD, Sharbrough FW, Busacker NE. Use of principal component
analysis in the frequency domain for mapping electroencephalographic
activities: comparison with phase-encoded Fourier spectral analysis.
Brain Topogr 2004;17(2):73–84.
Lee S, Buchsbaum MS. Topographic mapping of EEG artifacts. Clin
Electroencephalogr 1987;18(2):61–7.
Lee H, Simpson GV, Logothetis NK, Rainer G. Phase locking of single
neuron activity to theta oscillations during working memory in monkey
extrastriate visual cortex. Neuron 2005;45:147–56.
Lehmann D, Skrandies W. Reference-free identification of components of
checkerboard-evoked multichannel potential fields. Electroencephalogr
Clin Neurophysiol 1980;48(6):609–21.
Leuchter AF, Cook IA, Lufkin RB, Dunkin J, Newton TF, Cummings JL,
Mackey JK, Walter DO. Cordance: a new method for assessment of
cerebral perfusion and metabolism using quantitative electroencepha-
lography. Neuroimage 1994;1(3):208–19.
Lind JC, Flor Henry P, Koles ZJ. Discriminant analysis and equivalent
source localization of the EEG related to cognitive functions. Brain
Topogr 1999;11(4):265–78.
Logothetis NK. The underpinnings of the BOLD functional magnetic
resonance imaging signal. J Neurosci 2003;23(10):3963–71.
Logothetis NK, Pauls J, Augath M, Trinath T, Oeltermann A. Neurophy-
siological investigation of the basis of the fMRI signal. Nature 2001;
412(6843):150–7.
Lopes da Silva F. Neural mechanisms underlying brain waves: from neural
membranes to networks. Electroencephalogr Clin Neurophysiol 1991;
79(2):81–93.
Lorente de No RA. A study of nerve physiology (Rockefeller Institute for
Medical Research, study 132). New York: Rockefeller Institute; 1947
p. 389–477.
Luu P, Tucker DM, Makeig S. Frontal midline theta and the error-related
negativity: neurophysiological mechanisms of action regulation. Clin
Neurophysiol 2004;115(8):1821–35.
McEvoy LK, Pellouchoud E, Smith ME, Gevins A. Neurophysiological
signals of working memory in normal aging. Brain Res Cogn Brain Res
2001;11(3):363–76.
Michel CM, Murray MM, Lantz G, Gonzalez S, Spinelli L, Grave de
Peralta R. EEG source imaging. Clin Neurophysiol 2004;115(10):
2195–222.
Mitzdorf U. Current source-density method and application in cat cerebral
cortex: investigation of evoked potentials and EEG phenomena. Physiol
Rev 1985;65(1):37–100.
Miwakeichi F, Martinez Montes E, Valdes Sosa PA, Nishiyama N,
Mizuhara H, Yamaguchi Y. Decomposing EEG data into space-time-
frequency components using parallel factor analysis. Neuroimage 2004;
22(3):1035–45.
Mocks J, Verleger R. Principal component analysis of event-related
potentials: a note on misallocation of variance. Electroencephalogr Clin
Neurophysiol 1986;65(5):393–8.
Naatanen R, Picton TW. The N1 wave of the human electric and magnetic
response to sound: a review and an analysis of the component structure.
Psychophysiology 1987;24(4):375–425.
Nicholson C. Theoretical analysis of field potentials in anisotropic
ensembles of neuronal elements. IEEE Trans Biomed Eng 1973;
20(4):278–88.
Nicholson C, Freeman JA. Theory of current source-density analysis and
determination of conductivity tensor for anuran cerebellum.
J Neurophysiol 1975;38(2):356–68.
Niedermeyer E. The normal EEG in the waking adult. In: Niedermeyer E,
Lopes da Silva F, editors. Electroencephalography: basic principles,
clinical applications and related fields. 2nd ed. Baltimore, MD: Urban &
Schwarzenberg; 1987. p. 97–117.
Niedermeyer E. Alpha rhythms as physiological and abnormal phenomena.
Int J Psychophysiol 1997;26(1–3):31–49.
Nunez PL. Localization of brain activity with electroencephalography. Adv
Neurol 1990;54:39–65.
Nunez PL, Silberstein RB, Cadusch PJ, Wijesinghe RS, Westdorp AF,
Srinivasan R. A theroretical and experimental study of high resolution
EEG based on surface Laplacians and cortical imaging. Electroence-
phalogr Clin Neurophysiol 1994;90:40–57.

C.E. Tenke, J. Kayser / Clinical Neurophysiology 116 (2005) 2826–28462846
Nunez PL, Srinivasan R, Westdorp AF, Wijesinghe RS, Tucker DM,
Silberstein RB, Cadusch PJ. EEG coherency. I: statistics, reference
electrode, volume conduction, Laplacians, cortical imaging, and
interpretation at multiple scales. Electroencephalogr Clin Neurophysiol
1997;103(5):499–515.
Oldfield RC. The assessment and analysis of handedness: the Edinburgh
inventory. Neuropsychologia 1971;9(1):97–113.
Oostendorp TF, van Oosterom A. The surface Laplacian of the potential:
theory and application. IEEE Trans Biomed Eng 1996;43(4):394–405.
Papousek I, Schulter G. Manipulation of frontal brain asymmetry by
cognitive tasks. Brain Cogn 2004;54(1):43–51.
Pascual-Marqui RD, Michel CM, Lehmann D. Low resolution electromag-
netic tomography: a new method for localizing electrical activity in the
brain. Int J Psychophysiol 1994;18(1):49–65.
Pernier J, Perrin F, Bertrand O. Scalp current density fields: concept and
properties. Electroencephalogr Clin Neurophysiol 1988;69(4):385–9.
Perrin F, Pernier J, Bertrand O, Echallier JF. Spherical splines for scalp
potential and current density mapping. Electroencephalogr Clin
Neurophysiol 1989;72(2):184–7 [Corrigenda EEG 02274, Clin Neuro-
physiol, 1990, 76, 565].
Perrin F, Pernier J, Bertrand O, Echallier JF. Corrigenda EEG 02274.
Electroencephalogr Clin Neurophysiol 1990;76:565.
Pfurtscheller G. Induced oscillations in the alpha band: functional meaning.
Epilepsia 2003;4412(Suppl. 12):2–8.
Picton TW, Bentin S, Berg P, Donchin E, Hillyard SA, Johnson Jr R,
Miller GA, Ritter W, Ruchkin DS, Rugg MD, Taylor MJ. Guidelines for
using human event-related potentials to study cognition: recording
standards and publication criteria. Psychophysiology 2000;37(2):
127–52.
Pineda JA, Silverman DS, Vankov A, Hestenes J. Learning to control brain
rhythms: making a brain–computer interface possible. IEEE Trans
Neural Syst Rehabil Eng 2003;11(2):181–4.
Pivik RT, Broughton RJ, Coppola R, Davidson RJ, Fox N, Nuwer MR.
Guidelines for the recording and quantitative analysis of electro-
encephalographic activity in research contexts. Psychophysiology
1993;30(6):547–58.
Pizzagalli D, Pascual Marqui RD, Nitschke JB, Oakes TR, Larson CL,
Abercrombie HC, Schaefer SM, Koger JV, Benca RM, Davidson RJ.
Anterior cingulate activity as a predictor of degree of treatment
response in major depression: evidence from brain electrical
tomography analysis. Am J Psychiatry 2001;158(3):405–15.
Pollock VE, Schneider LS, Lyness SA. Reliability of topographic
quantitative EEG amplitude in healthy late-middle-aged and elderly
subjects. Electroencephalogr Clin Neurophysiol 1991;79(1):20–6.
Reid SA, Duke LM, Allen JJ. Resting frontal electroencephalographic
asymmetry in depression: inconsistencies suggest the need to identify
mediating factors. Psychophysiology 1998;35(4):389–404.
Robinson PA. Neurophysical theory of coherence and correlations of
electroencephalographic and electrocorticographic signals. J Theor Biol
2003;222(2):163–75.
Sarnthein J, Petsche H, Rappelsberger P, Shaw GL, von Stein A.
Synchronization between prefrontal and posterior association cortex
during human working memory. Proc Natl Acad Sci USA 1998;95:
7092–6.
Scherg M, von Cramon D. Two bilateral sources of the late AEP as
identified by a spatio-temporal dipole model. Electroencephalogr Clin
Neurophysiol 1985;62(1):32–44.
Scherg M, von Cramon D. Evoked dipole source potentials of the human
auditory cortex. Electroencephalogr Clin Neurophysiol 1986;65(5):
344–60.
Schroeder CE, Tenke CE, Givre SJ. Subcortical contributions to the
surface-recorded flash-VEP in the awake macaque. Electroencephalogr
Clin Neurophysiol 1992;84:219–31.
Semlitsch HV, Anderer P, Schuster P, Presslich O. A solution for reliable
and valid reduction of ocular artifacts, applied to the P300 ERP.
Psychophysiology 1986;23(6):695–703.
Shankman SA, Tenke CE, Bruder GE, Durbin CE, Hayden EP, Klein DN.
Low positive emotionality and EEG asymmetry. Dev Psychopathol
2005;17:85–98.
Simson R, Vaughan Jr HG, Ritter W. The scalp topography of potentials
associated with missing visual or auditory stimuli. Electroencephalogr
Clin Neurophysiol 1976;40(1):33–42.
Spencer KM, Dien J, Donchin E. A componential analysis of the ERP
elicited by novel events using a dense electrode array. Psychophysiol-
ogy 1999;36(3):409–14.
Spencer KM, Dien J, Donchin E. Spatiotemporal analysis of the late ERP
responses to deviant stimuli. Psychophysiology 2001;38(2):343–58.
Srinivasan R, Nunez PL, Silberstein RB. Spatial filtering and neocortical
dynamics: estimates of EEG coherence. IEEE Trans Biomed Eng 1998;
45(7):814–26.
Steriade M. Corticothalamic resonance, states of vigilance and mentation.
Neuroscience 2000;101(2):243–76.
Steriade M, McCormick DA, Sejnowski TJ. Thalamocortical oscillations in
the sleeping and aroused brain. Science 1993;262(5134):679–85.
Tandonnet C, Burle B, Hasbroucq T, Vidal F. Spatial enhancement of EEG
traces by surface Laplacian estimation: comparison between local and
global methods. Clin Neurophysiol 2005;116(1):18–24.
Tenke CE. Statistical characterization of the EEG: the use of the power
spectrum as a measure of ergodicity. Electroencephalogr Clin
Neurophysiol 1986;63(5):488–93.
Tenke CE, Kayser J. A convenient method for detecting electrolyte bridges
in multichannel electroencephalogram and event-related potential
recordings. Clin Neurophysiol 2001;112(3):545–50.
Tenke CE, Kayser J, Fong R, Leite P, Towey JP, Bruder GE. Response- and
stimulus-related ERP asymmetries in a tonal oddball task: a Laplacian
analysis. Brain Topogr 1998;10(3):201–10.
Tenke CE, Schroeder CE, Arezzo JC, Vaughan Jr HG. Interpretation of
high-resolution current source density profiles: a simulation of
sublaminar contributions to the visual evoked potential. Exp Brain
Res 1993;94(2):183–92.
Timofeev I, Grenier F, Bazhenov M, Houweling AR, Sejnowski TJ,
Steriade M. Short- and medium-term plasticity associated with
augmenting responses in cortical slabs and spindles in intact cortex of
cats in vivo. J Physiol 2002;542(2):583–98.
van Boxtel GJM. Computational and statistical methods for analyzing
event-related potential data. Behav Res Methods Instrum Comput 1998;
30(1):87–102.
Wallstrom GL, Kass RE, Miller A, Cohn JF, Fox NA. Automatic correction
of ocular artifacts in the EEG: a comparison of regression-based and
component-based methods. Int J Psychophysiol 2004;53(2):105–19.
Woestenburg JC, Verbaten MN, Slangen JL. Stimulus information and
habituation of the visual event related potential and the skin
conductance reaction under task-relevance conditions. Biol Psychol
1983;16:225–40.
Wolpaw JR, McFarland DJ. Multichannel EEG-based brain-computer
communication. Electroencephalogr Clin Neurophysiol 1994;90(6):
444–9.
Wood CC, McCarthy G. Principal component analysis of event-related
potentials: simulation studies demonstrate misallocation of variance
across components.. Electroencephalogr Clin Neurophysiol 1984;59(3):
249–60.
Yao D. The theoretical relation of scalp Laplacian and scalp current
density of a spherical shell head model. Phys Med Biol 2002;
47(12):2179–85.