Reference Case - Ascension Publishing · Richard Newell, SAIS, December 14, 2009. 1. ... Richard...
24
The Paul H. Nitze School of Advanced International Studies December 14, 2009 Washington, DC Richard Newell, Administrator Annual Energy Outlook 2010 Reference Case
Transcript of Reference Case - Ascension Publishing · Richard Newell, SAIS, December 14, 2009. 1. ... Richard...
Richard Newell, SAIS, December 14, 2009 1
The Paul H. Nitze School of Advanced International Studies December 14, 2009
Washington, DC
Richard Newell, Administrator
Annual Energy Outlook 2010Reference Case

Richard Newell, SAIS, December 14, 2009 2
• Generally assumes current laws and regulations– provisions sunset if specified (e.g., renewable tax credits expire) – excludes potential future laws and regulations (e.g., proposed
greenhouse gas legislation is not included)– some grey areas
• adopts proposed regulations that are not yet final, in order to inform the likely implementation of a statute
• adds a premium to the capital cost of CO2 -intensive technologies to reflect market behavior regarding possible CO2 regulation
• assumes implementation of existing regulations that enable building new energy infrastructure and resource extraction
• Includes technologies that are commercial or reasonably expected to become commercial in the next decade or so– includes cost and efficiency improvements from learning, but not
revolutionary or breakthrough technologies
How does the AEO2010 reference case handle public policy and technology?

Richard Newell, SAIS, December 14, 2009 3
• Extended projection period to 2035• Changes in Federal and State laws and regulations
– revised handling of fuel economy standards to reflect the proposal for light-duty vehicles in model years 2012-2016
– assumes permission will be granted to extend nuclear power unit operating licenses beyond 60 years; no retirements through 2035
• Revised capital costs for capital-intensive projects– overnight costs for nuclear and coal power up 10-20%
• Changes to assumptions about oil and gas resource base– updated characterization of natural gas shales, reflecting evolution
of shale gas resources and technology– new lower-48 onshore oil and gas supply submodule
Key updates included in the AEO2010 reference case
Richard Newell, SAIS, December 14, 2009 4
0
25
50
75
100
125
150
175
200
225
1980 1985 1990 1995 2000 2005 2010 2015 2020 2025 2030 2035
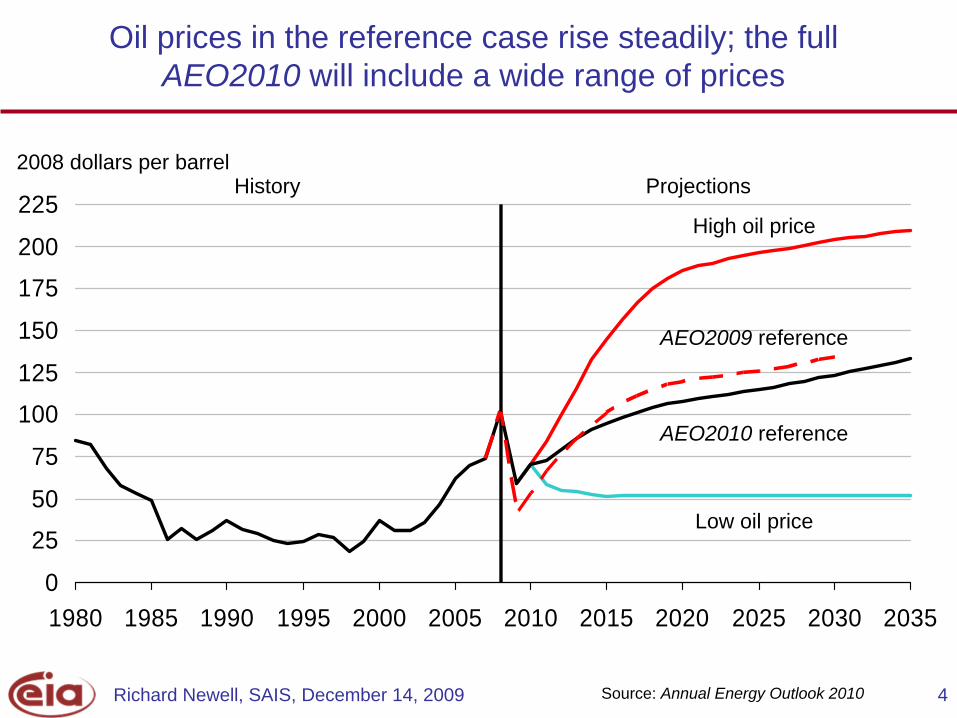
Oil prices in the reference case rise steadily; the full AEO2010 will include a wide range of prices
2008 dollars per barrel
Source: Annual Energy Outlook 2010
High oil price
Low oil price
AEO2010 reference
ProjectionsHistory
AEO2009 reference

Richard Newell, SAIS, December 14, 2009 5
0
1
2
3
4
5
1990 1995 2000 2005 2010 2015 2020 2025 2030 2035
Oil to natural gas price ratio remains high over the projection
ProjectionsHistory
0
5
10
15
20
25
1990 1995 2000 2005 2010 2015 2020 2025 2030 2035
Oil and natural gas prices
Source: Annual Energy Outlook 2010
Crude oil
U.S. natural gas wellhead
Ratio of oil price to natural gas price 2008 dollars per million Btu
Richard Newell, SAIS, December 14, 2009 6
0
20
40
60
80
100
120
1980 1985 1990 1995 2000 2005 2010 2015 2020 2025 2030 2035
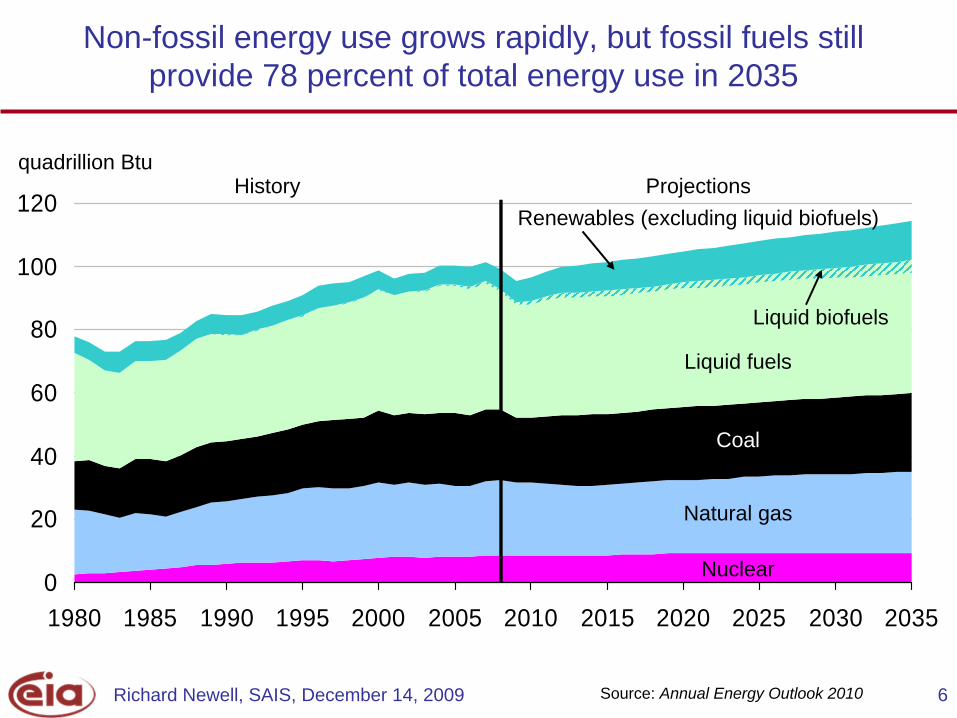
Non-fossil energy use grows rapidly, but fossil fuels still provide 78 percent of total energy use in 2035
quadrillion Btu
Coal
Liquid fuels
Natural gas
ProjectionsHistory
Nuclear
Liquid biofuels
Renewables (excluding liquid biofuels)
Source: Annual Energy Outlook 2010

Richard Newell, SAIS, December 14, 2009 7
0.00
0.25
0.50
0.75
1.00
1.25
1.50
1.75
1980 1985 1990 1995 2000 2005 2010 2015 2020 2025 2030 2035
Energy and CO2 per dollar GDP continue to decline; per capita energy use also declines
index, 2005=1
Energy per capita
Energy per dollar GDP
ProjectionsHistory
CO2 per dollar GDP
Source: Annual Energy Outlook 2010

Richard Newell, SAIS, December 14, 2009 8
0
50
100
150
200
2005 2010 2015 2020 2025 2030 2035
Energy efficiency gains reduce consumption 15% from where it would otherwise be; structural change is even larger
Constant efficiency
Constant intensity
Efficiency change
Structural change
AEO2010 reference case
192
133
115
quadrillion Btu
Source: Annual Energy Outlook 2010

Richard Newell, SAIS, December 14, 2009 9
0
5
10
15
20
25
1970 1975 1980 1985 1990 1995 2000 2005 2010 2015 2020 2025 2030 2035
U.S. reliance on imported liquid fuels is reduced by increased domestic production and greater fuel efficiency
million barrels per day
Consumption
Production
Net imports
ProjectionsHistory
AEO2010 reference caseUpdated AEO2009 reference case
40% 45%
57%60%
Source: Annual Energy Outlook 2010

Richard Newell, SAIS, December 14, 2009 10
0
5
10
15
20
25
1970 1975 1980 1985 1990 1995 2000 2005 2010 2015 2020 2025 2030 2035
Biofuels meet most of the growth in liquid fuels supply
million barrels per dayProjectionsHistory
Natural gas plant liquids
Biofuels including imports
Petroleum supply
Net petroleum imports
Source: Annual Energy Outlook 2010

Richard Newell, SAIS, December 14, 2009 11
billion gallon-equivalents
0
5
10
15
20
25
30
35
40
45
2008 2022 2022 inAEO2009
2035
Biofuels grow, but fall short of the 36 billion gallon RFS target in 2022, exceed it in 2035
Legislated RFS in 2022
RFS with adjustments under CAA Sec.211(o)(7) Biodiesel
Other feedstocks
Biomass-to- liquids
Net ethanol imports
Cellulosic ethanol
Corn ethanol
Renewable diesel
Source: Annual Energy Outlook 2010

Richard Newell, SAIS, December 14, 2009 12
0
5
10
15
20
25
30
35
40
45
2000 2005 2010 2015 2020 2025 2030 2035
HistoryAEO2010Updated
New light duty vehicle efficiency reaches 40 mpg by 2035
miles per gallon
AEO2009 reference case
Source: Annual Energy Outlook 2010

Richard Newell, SAIS, December 14, 2009 13
millions
0123456789
10
2000 2008 2015 2020 2025 2030 2035
Electric/fuel cellPlug-in hybrid electricHybrid electricMild hybrid electricGaseousFlex fuelDiesel
Mild and full hybrid systems dominate new light-duty vehicle sales by 2035
ProjectionsHistory
Source: Annual Energy Outlook 2010
Richard Newell, SAIS, December 14, 2009 14
0
2
4
6
8
10
1980 1985 1990 1995 2000 2005 2010 2015 2020 2025 2030 2035
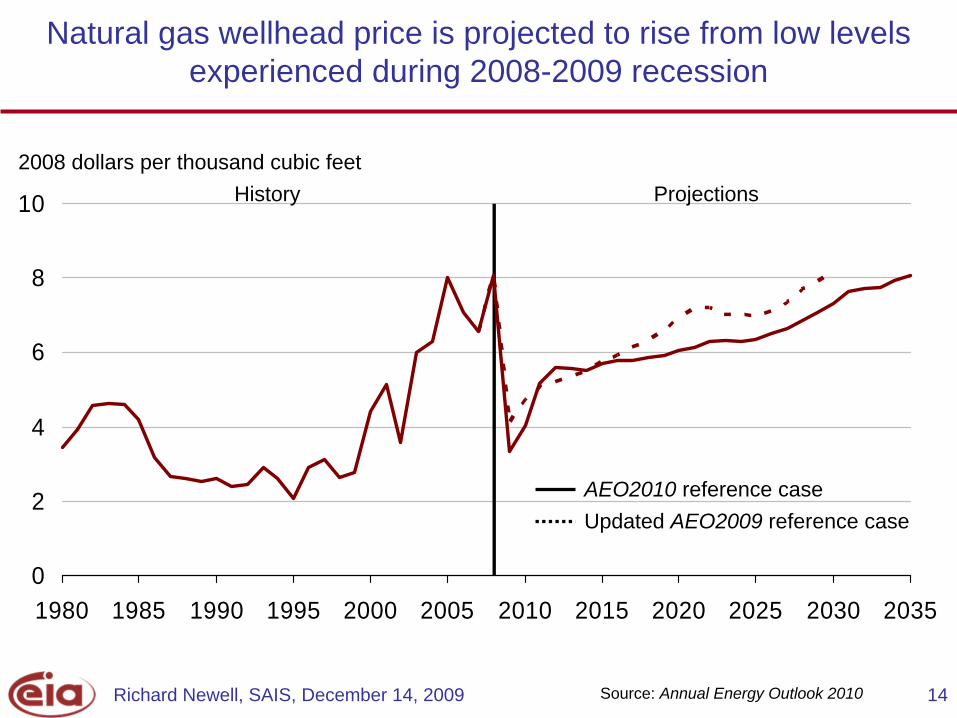
Natural gas wellhead price is projected to rise from low levels experienced during 2008-2009 recession
2008 dollars per thousand cubic feetProjectionsHistory
AEO2010 reference caseUpdated AEO2009 reference case
Source: Annual Energy Outlook 2010

Richard Newell, SAIS, December 14, 2009 15
10
15
20
25
30
1990 1995 2000 2005 2010 2015 2020 2025 2030 2035
Import share of natural gas supply declines as domestic supply grows
trillion cubic feet
Consumption
Domestic supply
Net imports
ProjectionsHistory
AEO2010 reference caseUpdated AEO2009 reference case
2%6%
13%
Source: Annual Energy Outlook 2010

Richard Newell, SAIS, December 14, 2009 16
Shale gas has been the primary source of recent growth in U.S. technically recoverable natural gas resources
0
250
500
750
1000
1250
1500
1750
2000
2250
1999 2000 2001 2002 2003 2004 2005 2006 2007 2008 2009 2010
AEO edition
Source: U.S. Geological Service, Mineral Management Service, private data, and EIA.
trillion cubic feet
Unproved shale gas &other unconventional
Unproved conventional(including Alaska*)
Proved reserves(all types & locations)
* Alaska resource estimates prior to AEO2009 reflect resources from the North Slope that were not included in previously published documentation.
Richard Newell, SAIS, December 14, 2009 17
0
5
10
15
20
25
1990 1995 2000 2005 2010 2015 2020 2025 2030 2035
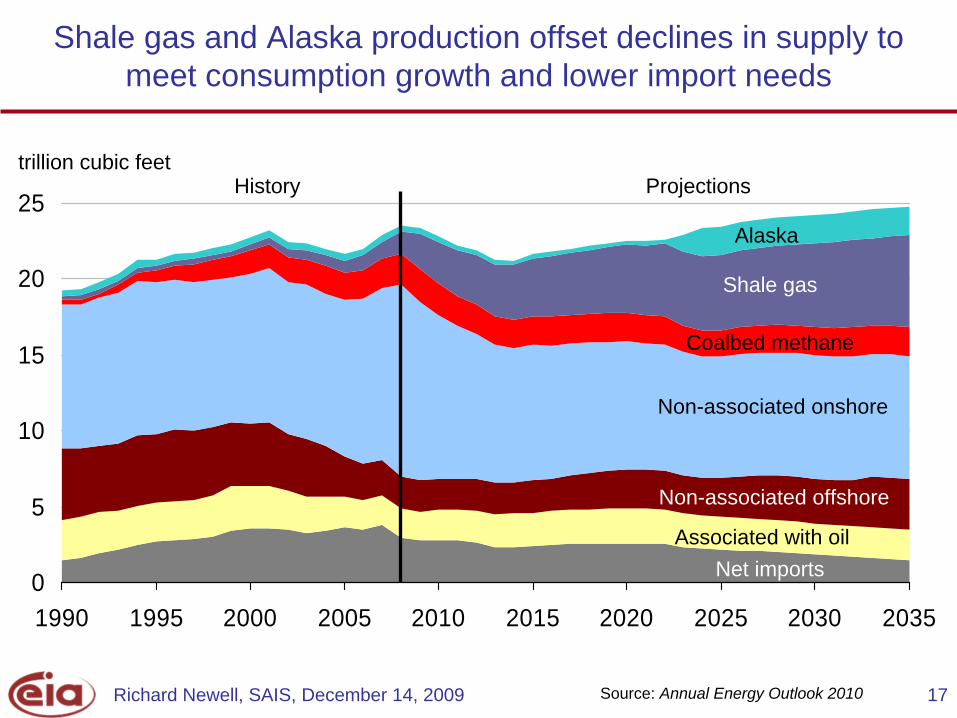
Shale gas and Alaska production offset declines in supply to meet consumption growth and lower import needs
trillion cubic feet
Alaska
Non-associated offshore
ProjectionsHistory
Associated with oil
Coalbed methane
Net imports
Non-associated onshore
Shale gas
Source: Annual Energy Outlook 2010

Richard Newell, SAIS, December 14, 2009 18
-2
0
2
4
6
8
10
12
14
1950 1960 1970 1980 1990 2000 2010 2020 2030
Growth in electricity use continues to slow
3-year rolling average percent growth
Projections
HistoryPeriod Annual Growth1950s 9.81960s 7.31970s 4.71980s 2.91990s 2.42000-2008 0.92008-2035 1.0
Structural Change in Economy - Higher prices - Standards - Improved efficiency
Source: Annual Energy Outlook 2010

Richard Newell, SAIS, December 14, 2009 19
Natural gas and renewables account for the majority of capacity additions from 2008 to 2035
Coal312 (31%)
Natural gas338 (33%)
Hydropower*99 (10%)
Nuclear101 (10%)
Other renewables
40 (4%)
Other119 (12%)
* Includes pumped storage
Coal31 (12%)
Natural gas116 (46%)
Hydropower*1 (0.4%)
Nuclear8 (3%)
Other renewables92 (37%)
Other2 (1%)
2008 capacity Capacity additions 2008 to 2035
1,008gigawatts
250gigawatts
Source: Annual Energy Outlook 2010
Richard Newell, SAIS, December 14, 2009 20
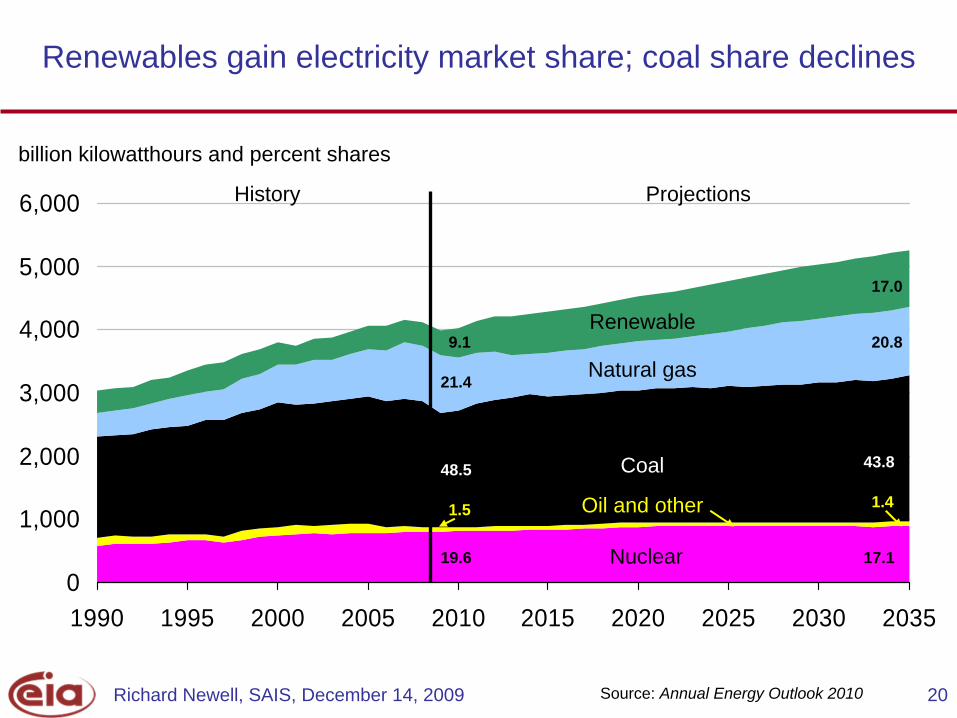
Renewables gain electricity market share; coal share declines
0
1,000
2,000
3,000
4,000
5,000
6,000
1990 1995 2000 2005 2010 2015 2020 2025 2030 2035
billion kilowatthours and percent shares
Natural gas
Renewable
ProjectionsHistory
Nuclear
Oil and other
Coal48.5 43.8
21.4
20.8
19.6 17.1
9.1
17.0
1.41.5
Source: Annual Energy Outlook 2010
Richard Newell, SAIS, December 14, 2009 21
0
100
200
300
400
500
600
1990 1995 2000 2005 2010 2015 2020 2025 2030 2035
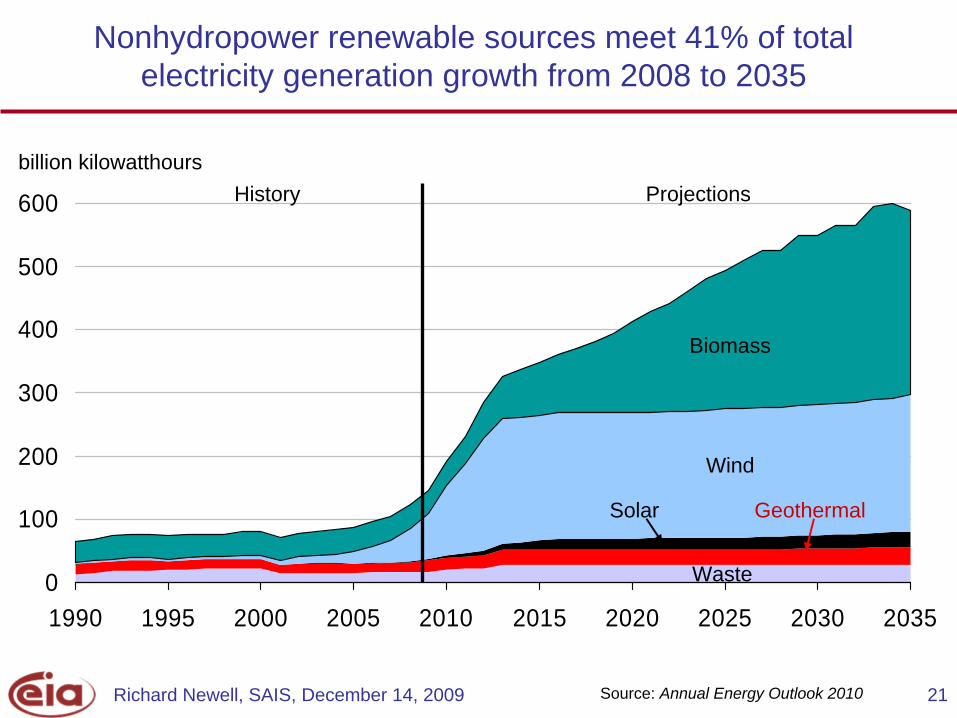
Nonhydropower renewable sources meet 41% of total electricity generation growth from 2008 to 2035
billion kilowatthours
Wind
ProjectionsHistory
Solar
Biomass
Geothermal
Waste
Source: Annual Energy Outlook 2010
Richard Newell, SAIS, December 14, 2009 22
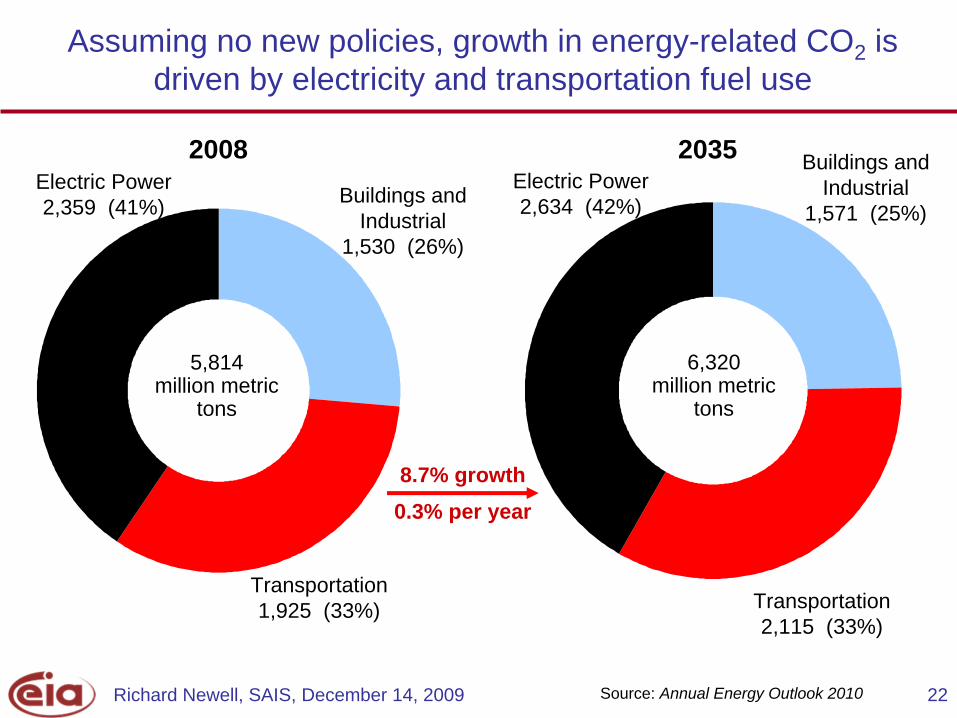
0.3% per year8.7% growth
Assuming no new policies, growth in energy-related CO2 is driven by electricity and transportation fuel use
Transportation1,925 (33%)
Buildings and Industrial
1,530 (26%)
Electric Power2,359 (41%)
2008
5,814million metric
tons
2035
6,320million metric
tons
Transportation2,115 (33%)
Buildings and Industrial
1,571 (25%)Electric Power2,634 (42%)
Source: Annual Energy Outlook 2010

Richard Newell, SAIS, December 14, 2009 23
• Recent Federal and State policies, and rising energy prices, moderate growth in energy consumption and shift it to renewable fuels
• U.S. oil use remains near its present level through 2035– growth in overall liquids demand is met by biofuels, and ethanol
accounts for >17% of gasoline consumption by 2035
– U.S. reliance on imported oil as a share of U.S. liquids use, declines to 45% over the next 25 years
• Shale gas provides the majority of growth in gas supply
• Energy-related CO2 emissions grow 0.3% per year, absent any new policies to limit emissions
Key results from the AEO2010 reference case
Richard Newell, SAIS, December 14, 2009 24
For more information
U.S. Energy Information Administration home page www.eia.gov
Short-Term Energy Outlook www.eia.gov/emeu/steo/pub/contents.html
Annual Energy Outlook www.eia.gov/oiaf/aeo/index.html
International Energy Outlook www.eia.gov/oiaf/ieo/index.html
Monthly Energy Review www.eia.gov/emeu/mer/contents.html
U.S. Energy Information Administrationwww.eia.gov