Reference 34 - University of Alaska system€¦ · 2 University of Alaska Fairbanks UAF does not...
30
Table of Contents Appendix A. Summary of Developmental Participation by MAU ........................... 1 University of Alaska Anchorage .......................................................................... 1 University of Alaska Fairbanks ....................................................... 2 University of Alaska Southeast ........................................................ 4 Appendix B. Developmental Student Success ............................................. 6 University of Alaska Anchorage ...................................................... 6 University of Alaska Fairbanks ....................................................... 7 University of Alaska Southeast ....................................................... 8 Appendix C. Developmental Student Retention and Graduation ................ 9 University of Alaska Anchorage ...................................................... 9 University of Alaska Fairbanks ..................................................... 11 University of Alaska Southeast ..................................................... 13 Appendix D. Cost of Delivering Developmental Education .......................... 15 University of Alaska Anchorage ................................................................ 15 University of Alaska Fairbanks .................................................................. 17 University of Alaska Southeast .................................................................. 25 Reference 34
Transcript of Reference 34 - University of Alaska system€¦ · 2 University of Alaska Fairbanks UAF does not...

Table of Contents
Appendix A. Summary of Developmental Participation by MAU ........................... 1
University of Alaska Anchorage .......................................................................... 1
University of Alaska Fairbanks ....................................................... 2
University of Alaska Southeast ........................................................ 4
Appendix B. Developmental Student Success ............................................. 6
University of Alaska Anchorage ...................................................... 6
University of Alaska Fairbanks ....................................................... 7
University of Alaska Southeast ....................................................... 8
Appendix C. Developmental Student Retention and Graduation ................ 9
University of Alaska Anchorage ...................................................... 9
University of Alaska Fairbanks ..................................................... 11
University of Alaska Southeast ..................................................... 13
Appendix D. Cost of Delivering Developmental Education .......................... 15
University of Alaska Anchorage ................................................................ 15
University of Alaska Fairbanks .................................................................. 17
University of Alaska Southeast .................................................................. 25
Reference 34

1
Appendix A. Summary of Developmental Participation by MAU
University of Alaska Anchorage
Recent first-time freshmen at UAA enrolled in four-year degree programs have been relatively
steady in preparatory course enrollment for those who require both math and English. Those who are
enrolled in math only and English only have increased since FY08. For recent first-time freshmen in two-
year programs, those enrolled in both math and English developmental coursework have declined while
those in math only and English only have increased.
Reference 34

2
University of Alaska Fairbanks
UAF does not have significant four-year degree seeking freshmen enrollment in preparatory
English courses. Since fall 2008, the highest proportion of four-year degree seeking, recent first-time
freshmen enrollment in English only preparatory courses was 1.8%. In comparison, in fall 2012, 25.1% of
four-year degree seeking, recent first-time freshmen were enrolled in preparatory math classes. Due to the
extremely low numbers for preparatory English enrollment, very few freshmen were enrolled in both
math and English preparatory courses.
Reference 34

3
Reference 34

4
University of Alaska Southeast
UAS has shown a strong decrease in the number of four-year degree seeking first-time freshmen
enrolled in math and English preparatory courses, going from 26.5% to 18.0% since fall 2008. English
only preparatory students have shown an even larger drop from 18.6% to 4.5%. In comparison, math only
students have increased over five years. Unlike the four-year degree seeking freshmen, a higher
proportion of recent first-time freshmen seeking a two-year degree are enrolled in preparatory math and
English, increasing from 19.7% to 30.6% since fall 2008.
Reference 34

5
Reference 34

6
Appendix B. Developmental Student Success1
University of Alaska Anchorage
Table 1. Four-Year Degree Seeking First-Time Freshmen Course Completion by
Preparatory Level
Level
2008 2009 2010 2011 2012
ENGL 1 74.6% 86.9% 71.9% 81.8% 75.3%
ENGL 2 77.1% 72.9% 79.6% 78.0% 75.4%
ENGL 3 73.4% 78.1% 70.3% 72.7% 77.7%
MATH 1 45.8% 60.8% 52.8% 51.9% 48.8%
MATH 2 61.4% 53.5% 57.9% 56.1% 57.9%
MATH 3 55.6% 51.3% 67.3% 59.1% 64.5%
Non Preparatory 73.1% 70.1% 72.1% 72.5% 71.3%
Since fall 2008, the course completion rate for four-year degree seeking, first-time freshmen in
non-preparatory courses has undergone a small decrease. Most of the levels have been relatively steady in
completion rates expect for math level three which increased significantly.
Table 2. Two-Year Degree Seeking Recent First-Time Freshmen Course
Completion by Preparatory Level
Level
2008 2009 2010 2011 2012
ENGL 1 64.7% 65.0% 40.0% 66.7% 64.5%
ENGL 2 59.6% 63.4% 75.4% 64.5% 57.3%
ENGL 3 67.7% 72.3% 68.6% 66.7% 63.4%
MATH 1 47.2% 61.5% 55.1% 55.3% 62.5%
MATH 2 48.8% 56.8% 63.8% 52.4% 62.2%
MATH 3 48.4% 52.0% 61.9% 75.0% 45.5%
Non Preparatory 62.0% 65.2% 67.0% 63.9% 63.3%
The non-preparatory course completion rate for two-year degree seeking, first-time freshmen is
significantly less than that of four-year degree seekers. With the exception of math level one, preparatory
two-year degree seeking students have lower completion rates than non-preparatory four-year degree
seeking students.
1 Two-year degrees in Appendix B and C do not include AASs, certificates, or OECs.
Reference 34

7
University of Alaska Fairbanks
Table 5. Four-Year Degree Seeking First-Time Freshmen Course Completion by
Preparatory Level2
Level 2008 2009 2010 2011 2012
ENGL 1 60.0% 100.0% 66.7% 83.3% 100.0%
ENGL 2 90.9% 63.6% 87.0% 90.0% 83.3%
ENGL 3
0.0% 55.6% 0.0%
MATH 1 73.7% 85.2% 66.7% 81.8% 92.9%
MATH 2 66.7% 67.2% 65.1% 64.1% 66.0%
MATH 3 76.2% 60.7% 70.0% 67.5% 78.8%
Non Preparatory 77.0% 78.8% 78.9% 75.8% 75.6%
The completion rates for four-year degree seeking, first-time freshmen enrolled in non-
preparatory classes has decreased slightly between fall 2008 and 2012. Course completions for English
and math level one courses increased significantly over the past five years.
Table 6. Two-Year Degree Seeking First-Time Freshmen Course Completion by
Preparatory Level
Level 2008 2009 2010 2011 2012
ENGL 1 59.5% 70.8% 52.6% 82.6% 60.0%
ENGL 2 61.9% 67.8% 65.4% 68.3% 67.8%
ENGL 3 0.0% 70.0% 66.7% 33.3%
MATH 1 53.2% 53.3% 61.2% 50.6% 54.2%
MATH 2 40.3% 45.6% 32.9% 35.3% 34.3%
MATH 3 44.4% 38.9% 47.2% 31.3% 36.6%
Non Preparatory 54.5% 55.0% 53.3% 53.8% 48.5%
The course completion rate for first-time freshmen enrolled in a two-year program is
significantly less than those students enrolled in a four-year program for each course level.
Several of the levels have shown a drop in course completion over the past five years.
2Blanks in Appendix B and C tables indicate that there were no students in that cohort, while 0 indicates that there were students in the cohort.
Reference 34

8
University of Alaska Southeast
Table 9. Four-Year Degree Seeking Recent First-Time Freshmen Course
Completion by Preparatory Level
Level 2008 2009 2010 2011 2012
ENGL 2 70.0% 33.3% 65.5% 64.0% 100.0%
ENGL 3 65.9% 61.8% 70.3% 62.5% 85.0%
MATH 1 53.3% 47.1% 68.4% 44.0% 83.3%
MATH 2 56.1% 51.6% 56.8% 46.9% 60.0%
Non Preparatory 61.5% 73.3% 74.6% 69.8% 80.4%
Course completion for non-preparatory courses has undergone a large increase from fall 2008 to
2012, going from 61.5% to 80.4%. The completion rate for each preparatory level has also increased over
the past five years.
Table 9. Two-Year Degree Seeking Recent First-Time Freshmen Course
Completion by Preparatory Level
Level 2008 2009 2010 2011 2012
ENGL 2 33.3% 60.0% 52.9% 100.0% 55.6%
ENGL 3 53.8% 71.4% 53.3% 75.0% 70.0%
MATH 1 71.4% 77.8% 55.0% 77.8% 45.5%
MATH 2 83.3% 56.3% 62.5% 53.8% 58.3%
Non Preparatory 62.5% 73.1% 69.7% 56.0% 70.5%
Course completion rates for recent first-time freshmen enrolled in a two-year program are
significantly less than those for students enrolled in a four-year program. There is a significant amount of
fluctuation in the completion rates on a year to year basis for each level.
Reference 34

9
Appendix C. Developmental Student Retention and Graduation
University of Alaska Anchorage
Table 1. First-Time Freshmen Retention3
Degree Status 2007 2008 2009 2010 2011
Two-Year Preparatory 53.3% 53.6% 54.1% 53.7% 51.1%
Non-Preparatory 42.7% 50.0% 49.6% 44.7% 54.1%
Four-Year Preparatory 67.4% 68.8% 63.8% 63.3% 64.8%
Non-Preparatory 71.5% 74.6% 72.6% 73.8% 73.7%
Grand Total
66.0% 67.9% 64.5% 64.8% 65.2%
Non-preparatory first-time freshmen are the group most likely to be retained with an overall
retention rate of 73.7% for four-year degree seekers entering in fall 2011. While the retention rates for
non-preparatory first-time freshmen have increased over the past five years, the rates for preparatory first-
time freshmen have dropped.
Table 2. Six Year Four-Year Degree Seeking Graduation Rate
Preparatory Type Level FY08 FY09 FY10 FY11 FY12
English and Math 1 *
* * *
2 12% (26) 3% (32) 5% (39) 8% (40) 0% (31)
3 15% (92) 15% (93) 10% (118) 11% (106) 12% (91)
English Only 1 * 0% (6) * * 20% (5)
2 12% (17) 22% (9) 13% (16) 15% (13) 29% (14)
3 20% (59) 35% (63) 27% (62) 16% (61) 22% (63)
Math Only 1 22% (18) 0% (20) 16% (25) 0% (17) 9% (35)
2 19% (48) 18% (50) 15% (55) 17% (46) 14% (59)
3 24% (86) 22% (82) 29% (89) 24% (99) 27% (113)
Non Preparatory
31% (427) 32% (449) 31% (495) 34% (474) 32% (552) * indicates cell suppressed due to N<5.
Students without a preparatory level are much more likely to complete a four-year degree in six
years than those enrolled in preparatory courses. Being enrolled in math and English courses significantly
decreases the chances of completing a degree. Only 12.1% of level three math and English students
graduated in the most recent cohort compared with 22.2% of English only level three students and 26.5%
of math only level three students. It is important to note that initial student cohorts with less then five
students were removed from the table above. For ‘English only’ and ‘math only’ categories, students
enrolled in level 1 preparatory courses, were the ones who did not graduate. Furthermore, while 20
students who needed help in ‘Math only’ did not graduate in FY09, only 6 students in ‘English only’
category did not succeed. That fact reaffirms the notion that students less prepared in math have a lower
chance to succeed at the university.
3Contains part-time students.
Reference 34

10
Table 3. Three Year Two-Year Degree Seeking Graduation Rate
Preparatory Type Level FY08 FY09 FY10 FY11 FY12
English and Math 1 * * * * 0% (5)
2 8% (12) 0% (18) 11% (28) 0% (14) 5% (20)
3 0% (19) 0% (20) 3% (36) 2% (48) 4% (46)
English Only 1 * * * *
2 * 13% (8) 0% (8) 0% (6) 14% (7)
3 0% (10) 9% (11) 8% (12) 12% (25) 10% (29)
Math Only 1 0% (7) 8% (12) 13% (8) 10% (10) 5% (19)
2 15% (13) 0% (10) 11% (18) 12% (26) 10% (20)
Non-Preparatory
11% (55) 7% (56) 9% (44) 8% (53) 15% (78) * indicates cell suppressed due to N<5.
Very few freshmen who enter as two-year degree seeking students complete the degree within
three years. For the most recent cohort, the group with the highest graduation rate was those without a
preparatory level, and that group had a graduation rate of only 15.4%. When analyzing the figures for
students who did not graduate, it appears that these students are showing in all three preparatory levels for
‘English and math’ and ‘English only’ categories.
Table 4. Median Time to Degree4
Degree Type FY08 FY09 FY10 FY11 FY12
Two-Year Preparatory 1.3 (27) 3.3 (27) 2.2 (52) 2.0 (46) 2.3 (69)
Non-Preparatory 1.3 (20) 2.0 (16) 1.2 (16) 18 (1.0) 1.3 (31)
Math and English 1.5 (14) 3.7 (14) 2.3 (20) 2.0 (21) 2.3 (33)
English Only * 2.3 (9) 2.3 (13) 1.7 (7) 2.3 (17)
Math Only 2.7 (10) * 1.3 (19) 2.7 (18) 2.3 (19)
Math 1 * * * * *
Math 2 2.0 (9) * 1.5 (16) 3.2 (14) 2.0 (17)
Math 3
*
Four-Year Preparatory 4.3 (227) 4.7 (253) 4.7 (234) 4.7 (267) 5.0 (263)
Non-Preparatory 4.3 (167) 4.3 (173) 4.0 (172) 4.3 (180) 4.3 (206)
Math and English 4.3 (79) 5.0 (98) 5.0 (79) 5.0 (90) 5.3 (91)
English Only 4.3 (45) 4.3 (37) 4.3 (37) 5.3 (31) 5.0 (28)
Math Only 4.3 (103) 5.0 (118) 4.3 (118) 4.3 (146) 5.0 (144)
Math 1 *
* * *
Math 2 * 3.7 (8) 4.7 (10) 6.0 (9) 4.7 (7)
Math 3 4.3 (98) 5.0 (110) 4.3 (106) 4.3 (135) 5.0 (136)
* indicates cell suppressed due to N<5.
4 Table only includes first-time freshmen and does not includee BIs.
Reference 34

11
Students not requiring development education complete degrees more quickly than those who
need preparatory courses. The median time to degree for four-year preparatory students has increased
significantly since FY08, while the median for four-year, non-preparatory students has remained stable.
University of Alaska Fairbanks
Table 5. First-Time Freshmen Retention5
Degree Status 2007 2008 2009 2010 2011
Two-Year Preparatory 47.1% 52.6% 54.8% 53.3% 53.2%
Non-Preparatory 43.7% 52.6% 44.2% 45.7% 50.0%
Four-Year Preparatory 66.9% 78.7% 75.3% 67.6% 75.4%
Non-Preparatory 78.1% 80.3% 84.0% 81.2% 81.1%
Grand Total
67.4% 68.8% 69.2% 64.8% 69.1%
Both preparatory and non-preparatory first-time freshmen at UAF have shown an increase in
retention rates over the past five years in two-year and four-year degree programs. While the non-
preparatory first-time freshmen enrolled in a four-year degree program have higher retention rates than
those who are preparatory, the reverse is true for those enrolled in two-year programs.
Table 6. Six Year Four-Year Degree Seeking Graduation Rate
Preparatory Type Level FY08 FY09 FY10 FY11 FY12
Math and English 1 *
*
2 0% (24) 9% (22) 0% (19) 6% (18) 0% (26)
3 14% (7) 13% (8) * * 0% (9)
English Only 1 * *
2 * 0% (7) 14% (7) * *
Math Only 1 33% (6) * 8% (13) 11% (9) 13% (8)
2 28% (43) 7% (42) 20% (54) 25% (76) 29% (41)
3 18% (77) 25% (100) 30% (97) 21% (82) 23% (77)
Non-Preparatory
32% (329) 40% (360) 38% (324) 37% (339) 40% (326) * indicates cell suppressed due to N<5.
Students without a preparatory level have increased their graduation rate significantly from FY08
to FY12, going from 31.9% to 39.9%. The graduation rates for preparatory students vary significantly
from year to year, but remain well below the rate for those without a preparatory level. The highest
numbers of students who did not graduate are showing in ‘Math and English’ level 2 preparatory courses.
Interestingly, a certain percentage of the initial cohorts for the ‘Math only’ category successfully
graduated compared to ‘English only’ category, where level 2 students in FY09 (7 of them) did not
graduate (note, cohorts with less than 5 students were removed from the table).
5Contains part-time students.
Reference 34

12
Table 7. Three Year Two-Year Degree Seeking Graduation Rate
Preparatory Type Level FY08 FY09 FY10 FY11 FY12
Math and English 1 *
* * *
2 0% (14) 0% (7) 0% (5) 10% (10) 10% (10)
3 * *
* *
English Only 1 * * *
2 * *
3 * *
Math Only 1 0% (8) 0% (8) 0% (3) 0% (6) 7% (15)
2 9% (22) 0% (12) 0% (7) 10% (10) 0% (10)
3 0% (13) 0% (5) 0% (1) 25% (4) 0% (8)
Non-Preparatory
0% (30) 0% (18) 0% (20) 0% (17) 0% (24) * indicates cell suppressed due to N<5.
Students at UAF rarely complete two-year degrees regardless of their preparatory status. No non-
preparatory student completed a two-year degree in the past five years.
Table 8. Median Time to Degree6
Degree Type FY08 FY09 FY10 FY11 FY12
Two-Year Preparatory 2.3 (23) 3.3 (10) 2.2 (12) 2.3 (17) 2.7 (11)
Non-Preparatory * * * * 1.3 (6)
Math and English 4.7 (8) * * 4.5 (4) 2.3 (5)
English Only *
*
Math Only 2.3 (13) 3.3 (7) 3.0 (9) 2.3 (12) 2.8 (6)
Math 1
*
*
Math 2 * * * * *
Math 3 2.3 (10) 4.2 (6) 3.0 (7) 2.3 (9) 3.0 (5)
Four-Year Preparatory 4.3 (100) 4.3 (114) 4.3 (103) 5.2 (116) 4.3 (117)
Non-Preparatory 4.3 (150) 4.3 (149) 4.3 (173) 4.3 (171) 4.3 (184)
Math and English 4.3 (11) 5.0 (17) 5.5 (16) 5.0 (9) 5.7 (17)
English Only 4.2 (8) * 6.3 (5) * 4.8 (6)
Math Only 5.0 (81) 4.3 (95) 4.3 (82) 5.3 (103) 4.3 (94)
Math 1
*
*
Math 2 7.0 (17) 5.8 (14) 4.7 (7) 6.3 (13) 5.0 (11)
Math 3 4.3 (64) 4.3 (79) 4.3 (75) 5.0 (90) 4.3 (82) * indicates cell suppressed due to N<5.
6 Table only includes first-time freshmen and does not includee BIs.
Reference 34

13
The median time to degree for four-year students is fairly similar for those who are preparatory
and those who are not. Those who need math and English preparatory courses have a much higher median time to degree than the rest of the student body. There is large difference in the median time to degree for math 2 and math 3.
University of Alaska Southeast
Table 9. First-Time Freshmen Retention7
Degree Status 2007 2008 2009 2010 2011
Two-Year Preparatory 60.0% 39.1% 56.4% 44.7% 46.4%Non-Preparatory 50.0% 50.0% 35.3% 35.0% 38.5%
Four-Year Preparatory 48.5% 59.2% 52.5% 62.7% 53.4%Non-Preparatory 62.5% 72.3% 83.9% 67.2% 68.0%
Grand Total 55.6% 59.7% 61.8% 58.0% 55.3%
The retention rates for all student groups vary significantly from year to year. For example,
baccalaureate degree seeking freshmen without a preparatory level had a rate of 75.5% in 2008 which increased to 83.3% in 2009 and then dropped down to 69.6% in 2010.
Table 10. Six Year Four-Year Degree Seeking Graduation Rate
Preparatory Type Level FY08 FY09 FY10 FY11 FY12
Math and English 1 * * 2 * * 0% (9) 0% (6) 0% (7)3 6% (16) 20% (15) 8% (13) 13% (16) 8% (13)
English Only 1 * * * 2 * * * 3 29% (21) 46% (13) 25% (16) 10% (10) 0% (10)
Math Only 1 * * * * 2 * * 20% (10) 30% (20) 13% (15)
Non-Preparatory 13% (31) 31% (32) 16% (31) 34% (41) 17% (30)* indicates cell suppressed due to N<5.
No baccalaureate degree seeking freshmen enrolled in preparatory English levels one and two
completed a degree in six years within the past five cohorts. Non-preparatory students are most likely to complete, though the rate varies a great deal from year to year. Note, the table above excludes cohorts with less than five students. As seen from the table, students taken ‘Math and English’ courses are the ones who don’t graduate the most.
7 Contains part-time students.
Reference 34

14
Table 11. Three Year Two-Year Degree Seeking Graduation Rate
Preparatory Type Level FY08 FY09 FY10 FY11 FY12
Math and English 2 6 (0%) 5 (0%) * * *
3 5 (0%) 7 (0%) 5 (20%) 0% (6) 28% (7)
English Only 2 * * *
3 * * 5 (0%) * 17% (6)
Math Only 1 * * *
2 14% (7) * 29% (7) * *
Non-Preparatory 11% (9) 0% (11) 0% (5) 25% (4) 20% (10)* indicates cell suppressed due to N<5.
No freshmen enrolled in the lowest level of any of the three preparatory groups completed an AA
or AS within three years. Those enrolled in math level 2 showed a higher graduation rate for several cohorts than those without a preparatory level. The table above shows that the groups with a 0% graduation rate have rather small cohorts of 5 to 7 people compared to 9 to 12 students in non-preparatory cohorts.
Table 12. Median Time to Degree8
Degree Type FY08 FY09 FY10 FY11 FY12
Two-Year Preparatory 2.7 (8) 3.7 (9) 2.7 (7) 2.0 (9) 2.0 (15)
Non-Preparatory * * * * *
Math and English 2.5 (6) * * * *
English Only * * *
Math Only * * * * 1.7 (7)
Math 1 *
Math 2 * * * * 1.7 (6)
Four-Year Preparatory 4.3 (26) 4.8 (20) 4.5 (20) 5.0 (18) 4.3 (12)
Non-Preparatory 4.3 (10) 4.3 (9) 4.0 (21) 5.7 (8) 3.3 (14)
Math and English 5.3 (13) 4.7 (12 ) 5.3 (8) 6.0 (7) *
English Only 4.3 (12) * 4.3 (5) *
Math Only * * 4.3 (7) 5.0 (11) 4.3 (8)
Math 1 * 4.3 (7) 5.0 (10) 4.3 (7)
Math 2 * * * ** indicates cell suppressed due to N<5.
Due to the low numbers of graduates, the median time to degree fluctuates significantly from year
to year. Students enrolled in preparatory math and English typically have a higher median time to degree than the rest of the student body.
8 Table only includes first-time freshmen and does not include BIs.
Reference 34

15
Appendix D. Cost of Delivering Developmental Education
COST - UAA
From Yuan – “College level MATH classes are slightly more expensive than the Dev MATH
across almost all UAA campuses. The English is at the opposite for UAA as a whole and for
Anchorage Campus, with rest in a mix. The net in Anchorage campus is close to UAA average,
because of its size. Higher net revenue per SCH has been observed in Kenai College, as
compared it to others. Kodiak and PWSCC are two had "net cost" per SCH in some level ENGL
and MATH.”
Reference 34

16
Reference 34

17
UAF Costs
Revenue per Credit Hour
Revenue per credit hour increased steadily for the comparison group fall 2008 to fall
2012. Tuition covered the cost in all cases except for ENGL 2.
Revenue per credit hour also increased steadily for the developmental math group, but
more steeply than for the comparison group. In fall 2008 revenue per credit hour for the
developmental math group was lower, but by fall 2012 was slighter higher, than the comparison
group.
Revenue per credit hour was variable for the developmental English group, but increased
fall 2008 to fall 2012. In fall 2008, fall 2010, and fall 2012, revenue per credit hour was higher
9 All UAF non-developmental lower-level courses except self-support courses and courses without instructor employment information
Table 1. Revenue Per Credit Hour: Developmental English, Developmental Math, and
Other Developmental Courses
Comparison Group9
Dev
English
Dev
Math
Term
Fall 2008 $90.90 $94.53 $62.25
Fall 2009 $94.75 $73.86 $64.80
Fall 2010 $99.37 $128.18 $87.30
Fall 2011 $111.36 $48.50 $101.16
Fall 2012 $113.47 $122.02 $116.01
$0.00
$20.00
$40.00
$60.00
$80.00
$100.00
$120.00
$140.00
Fall 2008 Fall 2009 Fall 2010 Fall 2011 Fall 2012
Revenue Per Credit Hour: Developmental
English, Math, & Other Developmental
Comparison Group
Dev English
Dev Math
Reference 34

18
for the developmental English group, but in fall 2009 and fall 2011 was lower than the
comparison group.
Revenue per credit hour for the MATH 1 group increased steadily and more steeply than
the comparison group. In fall 2008 revenue per credit hour for MATH 1 was lower, but by fall
2011 was higher, than the comparison group.
Revenue per credit hour for the MATH 2 group increased steadily from fall 2009 to fall
2012, and except for a drop from fall 2008 to fall 2009, increased more steeply than the
comparison group, surpassing revenue per credit hour for the comparison group by fall 2012.
Revenue per credit hour for the MATH 3 group increased steadily from fall 2008 to fall
2012, more steeply than either MATH groups or the comparison group, but was lower than the
comparison group for all fall term.
$0.00
$20.00
$40.00
$60.00
$80.00
$100.00
$120.00
$140.00
Fall 2008 Fall 2009 Fall 2010 Fall 2011 Fall 2012
Revenue Per Credit Hour:
Developmental Math Levels
Comparison Group
Dev Math - MATH 1
Dev Math - MATH 2
Dev Math - MATH 3
-$50.00
$0.00
$50.00
$100.00
$150.00
$200.00
$250.00
$300.00
$350.00
Fall 2008 Fall 2009 Fall 2010 Fall 2011 Fall 2012
Revenue Per Credit Hour: Developmental
English Levels
Comparison Group
Dev English - ENGL 1
Dev English - ENGL 2
Dev English - ENGL 3
Reference 34
19
Note: this chart has a different scale than the previous two charts.
Revenue per credit hour was more variable for the developmental English groups than for
the comparison group, particularly for the ENGL 1 and ENGL 2 groups which did not increase
from fall 2008 to fall 2012.
Revenue per credit hour for ENGL 1 was higher in fall 2008 and fall 2010, but lower in
fall 2009, fall 2011, and fall 2012 than the comparison group.
Revenue per credit hour for ENGL 2 was lower than the comparison group for all fall
terms and was negative (positive for cost) in fall 2012.
Revenue per credit hour for ENGL 3 increased from fall 2008 to fall 2012 and was higher
than the comparison group for all fall terms except fall 2011. The increase in revenue per credit
hour for ENGL 3 from fall 2011 to fall 2012 was especially steep.
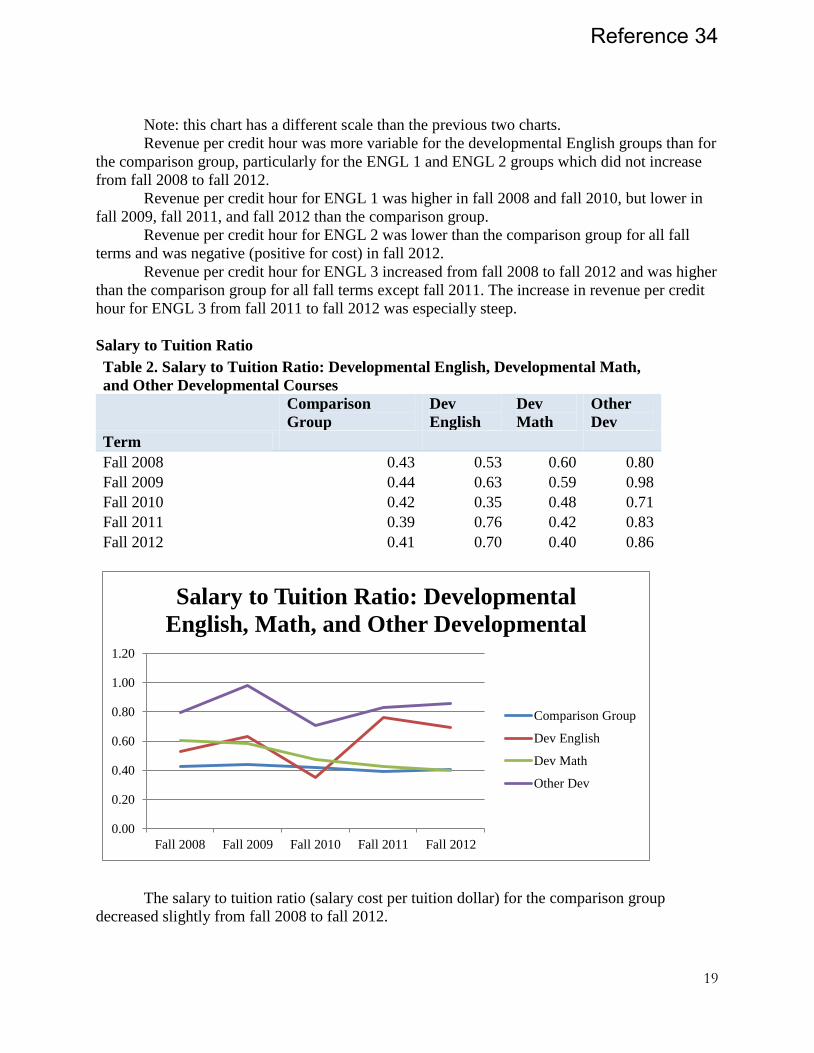
Salary to Tuition Ratio
Table 2. Salary to Tuition Ratio: Developmental English, Developmental Math,
and Other Developmental Courses
Comparison
Group
Dev
English
Dev
Math
Other
Dev
Term
Fall 2008 0.43 0.53 0.60 0.80
Fall 2009 0.44 0.63 0.59 0.98
Fall 2010 0.42 0.35 0.48 0.71
Fall 2011 0.39 0.76 0.42 0.83
Fall 2012 0.41 0.70 0.40 0.86
The salary to tuition ratio (salary cost per tuition dollar) for the comparison group
decreased slightly from fall 2008 to fall 2012.
0.00
0.20
0.40
0.60
0.80
1.00
1.20
Fall 2008 Fall 2009 Fall 2010 Fall 2011 Fall 2012
Salary to Tuition Ratio: Developmental
English, Math, and Other Developmental
Comparison Group
Dev English
Dev Math
Other Dev
Reference 34
20
The salary to tuition ratio also decreased, but more steeply, for the developmental math
group. In fall 2008 the salary to tuition ratio for the developmental math group was higher, but
by fall 2012 it was slightly lower than the comparison group.
The salary to tuition ratio was variable for the developmental English group but in
general it increased from fall 2008 to fall 2012. The salary to tuition ratio for the developmental
English group was higher than the comparison group in all fall terms except fall 2010 and the
spread between the two groups increased from fall 2008 to fall 2012.
The salary to tuition ratio was highest for the “Other Developmental” group but increased
only slightly from fall 2008 to fall 2012.
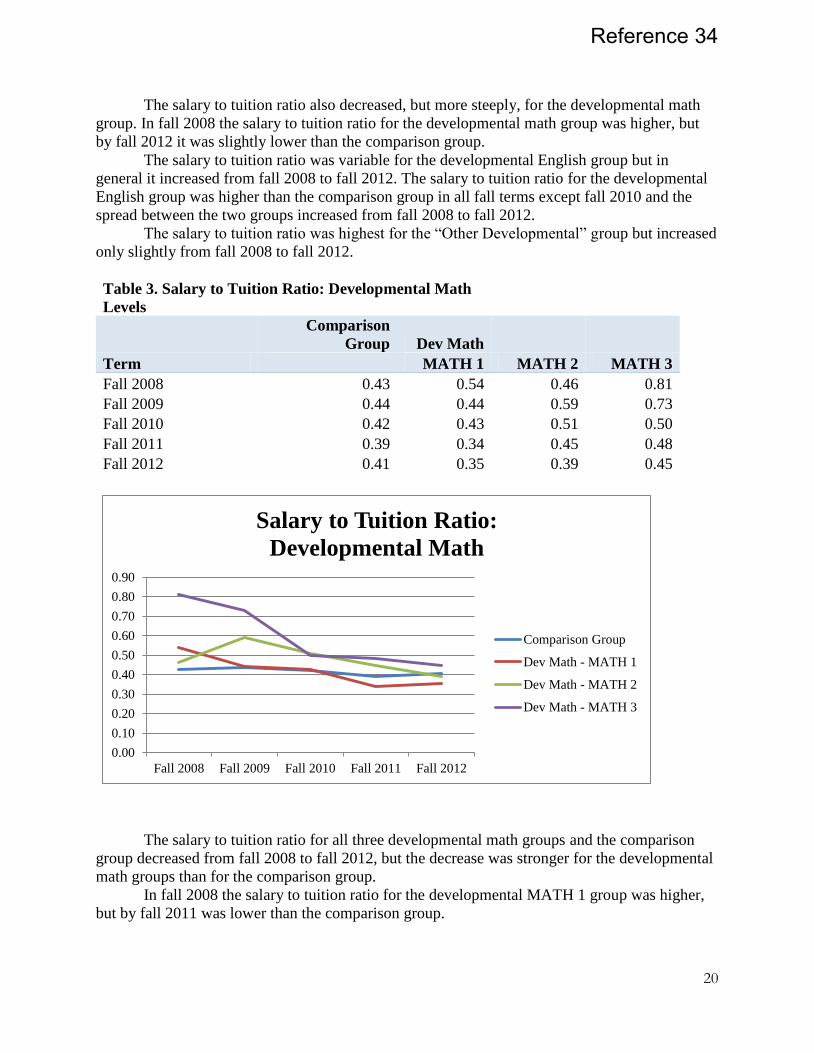
Table 3. Salary to Tuition Ratio: Developmental Math
Levels
Comparison
Group Dev Math
Term
MATH 1 MATH 2 MATH 3
Fall 2008 0.43 0.54 0.46 0.81
Fall 2009 0.44 0.44 0.59 0.73
Fall 2010 0.42 0.43 0.51 0.50
Fall 2011 0.39 0.34 0.45 0.48
Fall 2012 0.41 0.35 0.39 0.45
The salary to tuition ratio for all three developmental math groups and the comparison
group decreased from fall 2008 to fall 2012, but the decrease was stronger for the developmental
math groups than for the comparison group.
In fall 2008 the salary to tuition ratio for the developmental MATH 1 group was higher,
but by fall 2011 was lower than the comparison group.
0.00
0.10
0.20
0.30
0.40
0.50
0.60
0.70
0.80
0.90
Fall 2008 Fall 2009 Fall 2010 Fall 2011 Fall 2012
Salary to Tuition Ratio:
Developmental Math
Comparison Group
Dev Math - MATH 1
Dev Math - MATH 2
Dev Math - MATH 3
Reference 34
21
The salary to tuition ratio was higher for the developmental MATH 2 group fall 2008 to
fall 2011, but by fall 2012, it was slightly lower than the comparison group.
The salary to tuition ratio for the developmental MATH 3 group was higher than the
other developmental math groups and the comparison group, but it decreased steeply from fall
2008 to fall 2012, so that by fall 2012 it was higher than the other groups by a much narrower
margin than in fall 2008
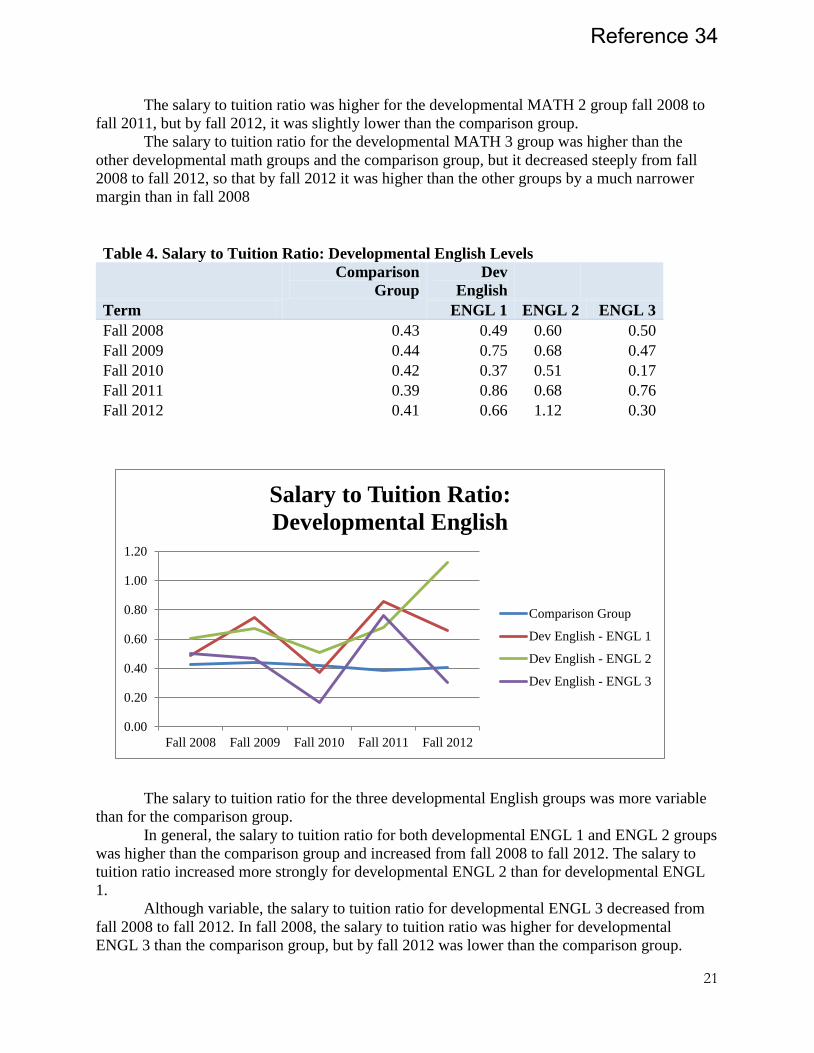
Table 4. Salary to Tuition Ratio: Developmental English Levels
Comparison
Group
Dev
English
Term
ENGL 1 ENGL 2 ENGL 3
Fall 2008 0.43 0.49 0.60 0.50
Fall 2009 0.44 0.75 0.68 0.47
Fall 2010 0.42 0.37 0.51 0.17
Fall 2011 0.39 0.86 0.68 0.76
Fall 2012 0.41 0.66 1.12 0.30
The salary to tuition ratio for the three developmental English groups was more variable
than for the comparison group.
In general, the salary to tuition ratio for both developmental ENGL 1 and ENGL 2 groups
was higher than the comparison group and increased from fall 2008 to fall 2012. The salary to
tuition ratio increased more strongly for developmental ENGL 2 than for developmental ENGL
1.
Although variable, the salary to tuition ratio for developmental ENGL 3 decreased from
fall 2008 to fall 2012. In fall 2008, the salary to tuition ratio was higher for developmental
ENGL 3 than the comparison group, but by fall 2012 was lower than the comparison group.
0.00
0.20
0.40
0.60
0.80
1.00
1.20
Fall 2008 Fall 2009 Fall 2010 Fall 2011 Fall 2012
Salary to Tuition Ratio:
Developmental English
Comparison Group
Dev English - ENGL 1
Dev English - ENGL 2
Dev English - ENGL 3
Reference 34
22
Summary and Discussion
Salary cost, tuition rate, and the number of students enrolled in courses all affect the cost
of course delivery. Per credit tuition rates for all groups compared here were the same (lower-
level tuition) and changed at the same rate over time. Except where proportions of non-resident
to resident enrollment might have differed between groups, we don’t expect the tuition rate to
explain differences between groups. Therefore, salary cost and enrollment are the explanatory
variables. Of these two, we don’t expect salary cost to change dramatically over time (except
possibly where the number of instructors is small), but we do expect that there might be
differences between groups.
We know that tuition per credit increased from fall 2008 to fall 2012 and enrollment also
increased for UAF overall. As we might expect, revenue per credit hour increased fall 2008 to
fall 2012 and the salary to tuition ratio decreased slightly for the comparison group.
Revenue per credit hour increased more steeply and the salary to tuition ratio decreased
more strongly for the developmental math group than for the comparison group (which
decreased only slightly in salary to tuition ratio), suggesting that enrollment increased more
rapidly for this group than for non-developmental, lower-level courses in general. Among the
developmental math course levels, MATH 3 increased in revenue per credit and decreased in
salary to tuition ratio the most strongly, followed by MATH 2, and then MATH 1, suggesting
that enrollment increased most strongly for the MATH 3 group, followed by MATH 2, and then
MATH 1.
The behavior of the developmental English group was more variable, but comparing fall
2008 to fall 2012, revenue per credit hour increased slightly more for developmental English
than for the comparison group. However the salary to tuition ratio decreased for developmental
English. Among the developmental English course levels, only ENGL 3 increased in revenue
per credit and decreased in salary to tuition ratio. ENGL 1 and ENGL 2 did not increase or
decrease in revenue per credit, but increased in salary to tuition ratio, with the strongest increase
occurring for ENGL 2. Salary cost may have increased and/or enrollment decreased for ENGL 1
and ENGL2. The opposite is true for ENGL 3: enrollment appears to have increased and/or
salary decreased, as least moderately, for ENGL 3. In general, the total number of credit hours
that are generated by developmental English courses is smaller than for developmental math
courses. We expect more variability in revenue per credit and salary to tuition ratio for
developmental English.
By fall 2012, revenue per credit hour was higher for both developmental math and
developmental English than for the comparison group. This means that class size and/or salary
for developmental math and developmental English were more favorable, by fall 2012, than for
the comparison group.
The salary per tuition ratio decreased over time for the developmental math group so that
by fall 2012 it was comparable to the comparison group. However, the salary to tuition ratio
remained higher for developmental English as a group than for the comparison group.
Of the three developmental math groups, by fall 2012 MATH 3 remained a little more
expensive, while MATH 1 and 2 a little less expensive, than the comparison group. Of the three
developmental English groups, ENGL 3 was less expensive than the comparison group, but
ENGL 1 and especially ENGL 2 appeared to be more expensive than the comparison group, by
fall 2012.
The “Other Developmental” group was lower in revenue per credit and had a higher
salary to tuition ratio (and thus was more expensive) than developmental math or English, or the
Reference 34
23
comparison group. It’s not clear that this group substantially increased or decreased in either
metric over the five year span.
Methods
Tuition and revenue were calculated for UAF for-credit semester courses delivered fall
terms, fall 2008 through fall 2012. Course fees were not included.
Self-support courses were removed. Course sections that were missing instructor
information were also removed. These included 1,163 course sections, or 8.9 percent of the total.
Developmental courses are listed below by level. The comparison group included all non-
developmental lower-level courses.
Lower-level tuition was calculated for students enrolled in the courses on the basis of
their residency status and total UA-system credit load for the term. If a non-resident student was
enrolled in 4 or fewer credits system-wide, they were considered a resident. Tuition for non-
resident students attending under the WUE program was calculated as 150 percent of the resident
rate.
Credit hours for student residency, and revenue-per-credit-hour calculations, include
audits. Credit hours were summed for all students enrolled in course sections.
Fall salary was calculated for instructors as the biweekly salary times 9.75, unless the
total pay periods associated with the salary were 10 or less, in which case the “annual salary”
was used. (The employee records were associated to course instructors by term and ID, so if the
pay periods were less than 10, these would be for the term in question.)
Salaries associated with primary positions were first adjusted by the instruction workload
percentage.
If an instructor taught developmental and non-developmental courses, or developmental
courses at different levels in the same term, the proportion of his/her credit workload attributed
to each of these was calculated and the salary for each level was calculated as the total salary
times the fraction of that type of course taught.
The total credit load for instructor is affected by the courses that are missing this
information.
For instructors who have secondary or overload positions it was not possible to tell which
positions (primary, secondary, or overload) were associated with particular courses taught.
However, only salaries associated with instruction were included (based on a NCHEMS value of
‘INSTRUCTION’, or where the employee group was “faculty extra service” or “adjunct”).
Multiple salaries that met the criteria above or any multiple salaries within job type were
summed. The total salary was then attributed proportionally to course types based on the
workload fraction of those course types.
Revenue per credit hour is the total revenue in tuition minus the total salary cost, divided
by the total credit hours generated by courses in the group.
The salary to tuition ratio is the total salary cost divided by total tuition revenue for
courses in the group.
Cost was negative except for one course level of developmental English in one term, and
so is reported as revenue.
Reference 34

24
Developmental courses by level:
ENGL 1: DEVE F060, DEVE F068
ENGL 2: DEVE F070, DEVE F093
ENGL 3: DEVE F109, DEVE F193, ABUS F170, PRPE A108
MATH 1: DEVM F050, DEVM F051, DEVM F056, ABUS F155
MATH 2: DEVM F060, DEVM F062, DEVM F065, DEVM F066, DEVM F093, TTCH
F131
MATH 3: DEVM F105, DEVM F106, MATH A105
OTHER: ABUS F271, ANS F100, CTT F104, CTT F106, DEVS F052, DEVS F058,
DEVS F101, DEVS F102, DEVS F104, DEVS F105, DEVS F108, DEVS F110, DEVS
F150, DEVS F160, DEVS F185, DEVS F193, ECE F117, HLTH F116, HUMS F117,
RD F100
Reference 34
25
Cost of Delivering Developmental Education at UAS
INTRODUCTION
The Alaska Advisory Task Force on Higher Education & Career Readiness10
emphasizes the importance
of understanding the costs of delivering remedial education (p. 13):
Without coordinated longitudinal reporting to document outcomes as students progress
(or fail to progress) through and beyond Alaska’s education system, Alaska cannot know
that state education spending results in any specific benefit, much less understand the
return on investment or be able to determine what cost efficiencies may be possible.
Institutions in a number of states are now reporting costs of delivering developmental education (see cited
state reports, including Nevada11
and Arkansas12
). Unfortunately, cost comparisons to other course levels
aren’t available in these reports, so the UA system may need to rely on MAU comparisons of the relative
costs of delivering developmental and collegiate level courses.
COSTS OF DEVELOPMENTAL EDUCATION AT UAS
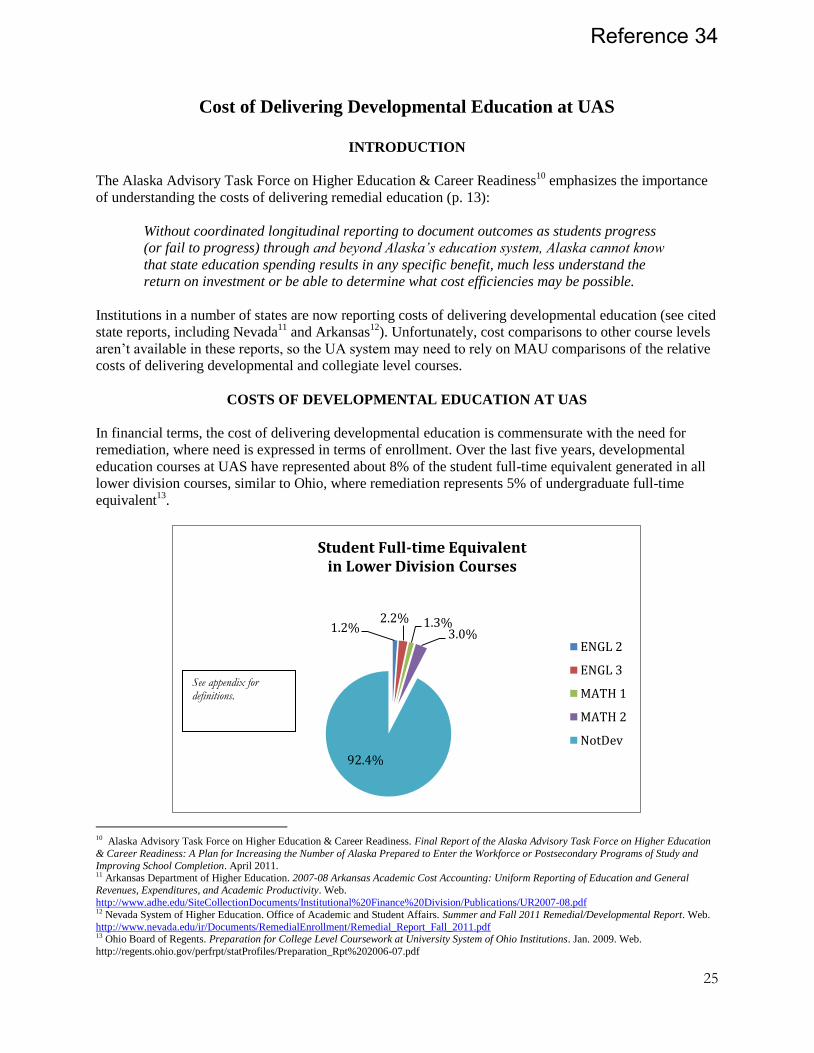
In financial terms, the cost of delivering developmental education is commensurate with the need for
remediation, where need is expressed in terms of enrollment. Over the last five years, developmental
education courses at UAS have represented about 8% of the student full-time equivalent generated in all
lower division courses, similar to Ohio, where remediation represents 5% of undergraduate full-time
equivalent13
.
10 Alaska Advisory Task Force on Higher Education & Career Readiness. Final Report of the Alaska Advisory Task Force on Higher Education
& Career Readiness: A Plan for Increasing the Number of Alaska Prepared to Enter the Workforce or Postsecondary Programs of Study and
Improving School Completion. April 2011. 11 Arkansas Department of Higher Education. 2007-08 Arkansas Academic Cost Accounting: Uniform Reporting of Education and General
Revenues, Expenditures, and Academic Productivity. Web.
http://www.adhe.edu/SiteCollectionDocuments/Institutional%20Finance%20Division/Publications/UR2007-08.pdf 12 Nevada System of Higher Education. Office of Academic and Student Affairs. Summer and Fall 2011 Remedial/Developmental Report. Web.
http://www.nevada.edu/ir/Documents/RemedialEnrollment/Remedial_Report_Fall_2011.pdf 13 Ohio Board of Regents. Preparation for College Level Coursework at University System of Ohio Institutions. Jan. 2009. Web.
http://regents.ohio.gov/perfrpt/statProfiles/Preparation_Rpt%202006-07.pdf
1.2% 2.2% 1.3%
3.0%
92.4%
Student Full-time Equivalent in Lower Division Courses
ENGL 2
ENGL 3
MATH 1
MATH 2
NotDev
See appendix for definitions.
Reference 34
26
Consequently, most of the revenue generated from lower division courses is from non-preparatory course
enrollment. Net revenue (the revenue from tuition less the costs of faculty salaries) from 2009 – 2013 in
developmental education represented 16.9% ($542,007) of the total net revenue in in all lower division
courses ($3,214,131). Similarly, the Maryland Higher Education Commission14
reported that cost
attributed to developmental education was less than 10% of their total budget (in 2009).
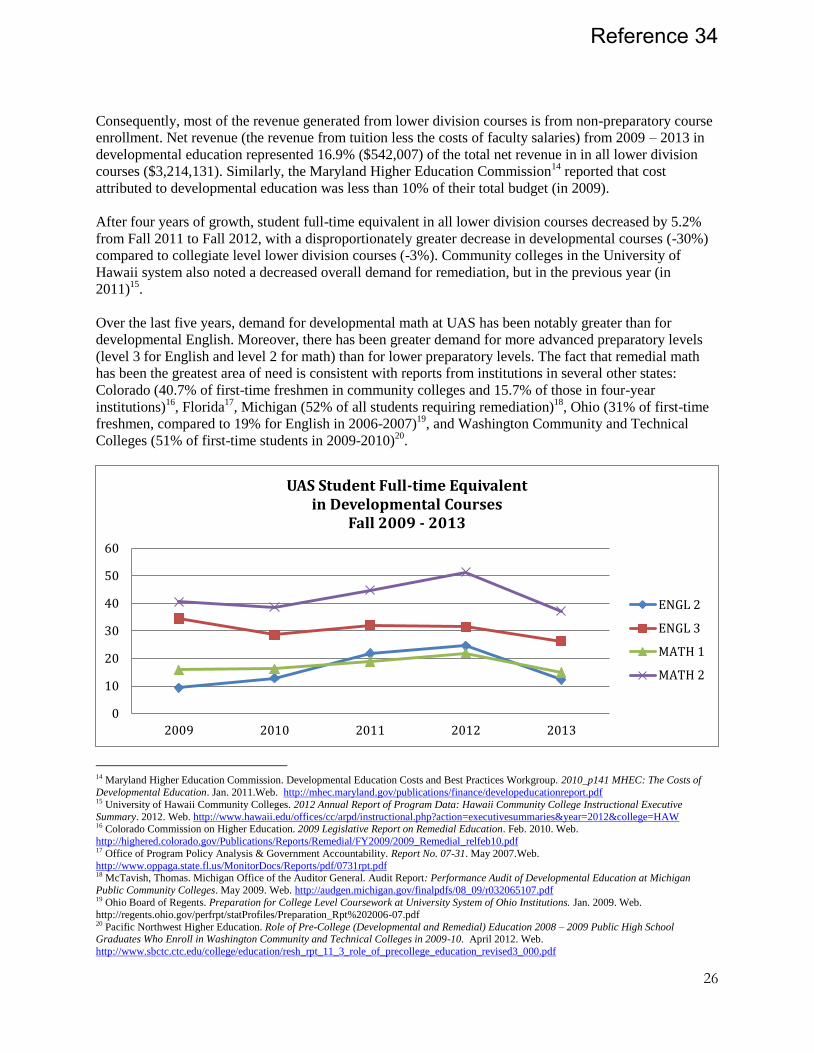
After four years of growth, student full-time equivalent in all lower division courses decreased by 5.2%
from Fall 2011 to Fall 2012, with a disproportionately greater decrease in developmental courses (-30%)
compared to collegiate level lower division courses (-3%). Community colleges in the University of
Hawaii system also noted a decreased overall demand for remediation, but in the previous year (in
2011)15
.
Over the last five years, demand for developmental math at UAS has been notably greater than for
developmental English. Moreover, there has been greater demand for more advanced preparatory levels
(level 3 for English and level 2 for math) than for lower preparatory levels. The fact that remedial math
has been the greatest area of need is consistent with reports from institutions in several other states:
Colorado (40.7% of first-time freshmen in community colleges and 15.7% of those in four-year
institutions)16
, Florida17
, Michigan (52% of all students requiring remediation)18
, Ohio (31% of first-time
freshmen, compared to 19% for English in 2006-2007)19
, and Washington Community and Technical
Colleges (51% of first-time students in 2009-2010)20
.
14 Maryland Higher Education Commission. Developmental Education Costs and Best Practices Workgroup. 2010_p141 MHEC: The Costs of
Developmental Education. Jan. 2011.Web. http://mhec.maryland.gov/publications/finance/developeducationreport.pdf 15 University of Hawaii Community Colleges. 2012 Annual Report of Program Data: Hawaii Community College Instructional Executive
Summary. 2012. Web. http://www.hawaii.edu/offices/cc/arpd/instructional.php?action=executivesummaries&year=2012&college=HAW 16 Colorado Commission on Higher Education. 2009 Legislative Report on Remedial Education. Feb. 2010. Web.
http://highered.colorado.gov/Publications/Reports/Remedial/FY2009/2009_Remedial_relfeb10.pdf 17 Office of Program Policy Analysis & Government Accountability. Report No. 07-31. May 2007.Web.
http://www.oppaga.state.fl.us/MonitorDocs/Reports/pdf/0731rpt.pdf 18 McTavish, Thomas. Michigan Office of the Auditor General. Audit Report: Performance Audit of Developmental Education at Michigan
Public Community Colleges. May 2009. Web. http://audgen.michigan.gov/finalpdfs/08_09/r032065107.pdf 19 Ohio Board of Regents. Preparation for College Level Coursework at University System of Ohio Institutions. Jan. 2009. Web.
http://regents.ohio.gov/perfrpt/statProfiles/Preparation_Rpt%202006-07.pdf 20 Pacific Northwest Higher Education. Role of Pre-College (Developmental and Remedial) Education 2008 – 2009 Public High School Graduates Who Enroll in Washington Community and Technical Colleges in 2009-10. April 2012. Web.
http://www.sbctc.ctc.edu/college/education/resh_rpt_11_3_role_of_precollege_education_revised3_000.pdf
0
10
20
30
40
50
60
2009 2010 2011 2012 2013
UAS Student Full-time Equivalent in Developmental Courses
Fall 2009 - 2013
ENGL 2
ENGL 3
MATH 1
MATH 2
Reference 34

27
Given the disparity in the number of course offerings and student enrollment in developmental education
compared to collegiate-level lower division courses, salary to tuition ratios (salary cost per tuition dollar)
were calculated to determine cost recovery by lower division course levels and subjects. Decreasing
revenues in developmental education last fall correspond with the decreased demand in these courses.
Except for 2011, the ratios have been similar considering all preparatory levels for developmental courses
in English and math. Lower ratios over the last two years correspond with the decreased demand in these
courses.
In general, lower ratios for developmental courses are due to the adjuncts and term faculty teaching these
courses at less cost to the university in salaries. The average adjunct and term faculty salary per credit
taught over the last five years was $1,189, compared to $3,120 for regular instruction faculty.
Cost recovery in level 2 preparatory math has generally been better than for non-preparatory lower
division math courses. The salary to tuition ratios have been similar for both levels of preparatory math
for the last two years.
Greater salary to tuition ratios have been observed over the last five years or the level 3 preparatory
English course, with a steeper increase over the last two years than other English courses.
0.00
0.20
0.40
0.60
0.80
1.00
1.20
2009 2010 2011 2012 2013
Salary to Tuition Ratio Developmental English, Math
ENGL
MATH
0.00
0.20
0.40
0.60
0.80
1.00
1.20
2009 2010 2011 2012 2013
Salary to Tuition Ratio Developmental Math
MATH 1
MATH 2
NotDev
Reference 34

28
0.00
0.50
1.00
1.50
2.00
2.50
2009 2010 2011 2012 2013
Salary to Tuition Ratio Developmental English
ENGL 2
ENGL 3
NotDev
Reference 34

29
Appendix
Definitions
All calculations were based on courses delivered during the fall terms of the last five academic years, by course.
Summaries are referred to by academic year; for example, “2009” refers to Fall 2008. Data source: UA Decision Support
Database (DSD), compiled by UAS Institutional Effectiveness from closing extracts.
Net revenues for a course is the sum of revenue generated from tuition – the cost of faculty salaries.
Average net revenue per credit for a course was calculated as the (sum of revenues - the cost of faculty salaries) / the
number of student credit hours generated by students in the course. Net revenue per developmental education credit
excludes the revenues and salaries in courses taught by instructors also teaching collegiate level courses. The net revenue
for development courses in such cases is included in the comparison group, “other lower division courses”.
Revenues were calculated from the resident tuition rate associated with a course, if any, and estimated resident or Western
Undergraduate Exchange (WUE) surcharges associated with the students enrolled a course. Tuition is not collected for
sponsored courses, which are taught by instructors not employed by the university. Course fees were excluded from the
calculation. Non-resident and WUE surcharges were applied according to a student’s residency status and admission status
for students in more than four credits for the semester in courses offered through the Juneau campus, averaged by the total
number of credits for a student, and multiplied by the number of section credits for a given course.
The cost of faculty salaries was determined for the primary position of regular instructional faculty by applying half of
the annual salary (equivalent to 9.75 pay periods x the biweekly salary), pro-rating that amount by the proportion of
instructional workload assigned to the position, averaging the result by the total number of credits taught by an instructor,
and multiplying by the number of section credits for a course. 100% of the salaries for instructors having an overload or
secondary positions was applied to instruction, in proportion to the length of time a fall course was taught.
Student credit hours were calculated by multiplying the course enrollment by the number of section credits. Enrollment
counts include auditors, who pay tuition.
Full-time Equivalent (FTE) was calculated from the sum of student credits generated for a course / 15 credits.
Developmental education levels are designated according to preparatory levels and subject.
ENGL 2: an intermediate preparatory level; corresponds to ENGL S092, Improving Writing Skills, 4 credits.
ENGL 3: refers to ENGL S110, Introduction to College Writing, 4 credits. The course does not count towards
degree requirements.
MATH 1: MATH S054, Preparatory Mathematics, 3 credits.
MATH 2: MATH S055, Fundamentals of Algebra, 3 credits.
UAS does not offer a level 1 developmental English course or a level 3 developmental math course. MATH S105 satisfies
the minimum general education requirement for associate degrees, and counts as elective credit toward baccalaureate
degrees.
Reference 34