REEVES COUNTY - Pecos-Barstow-Toyah ISD _ 2010 Texas School Survey of Drug and Alcohol Use
99
Pecos-Barstow-Toyah SPRING 2010 Texas School Survey of Drug and Alcohol Use 2010 Pecos-Barstow-Toyah ISD Part I: District Results Secondary ©Copyright 2010, Texas A&M University All rights reserved. Secondary Report-Page 1 of 99 1
-
Upload
texasschoolsurvey2010 -
Category
Documents
-
view
216 -
download
0
Transcript of REEVES COUNTY - Pecos-Barstow-Toyah ISD _ 2010 Texas School Survey of Drug and Alcohol Use

8/7/2019 REEVES COUNTY - Pecos-Barstow-Toyah ISD _ 2010 Texas School Survey of Drug and Alcohol Use
http://slidepdf.com/reader/full/reeves-county-pecos-barstow-toyah-isd-2010-texas-school-survey-of-drug 1/99

8/7/2019 REEVES COUNTY - Pecos-Barstow-Toyah ISD _ 2010 Texas School Survey of Drug and Alcohol Use
http://slidepdf.com/reader/full/reeves-county-pecos-barstow-toyah-isd-2010-texas-school-survey-of-drug 2/99
Pecos-Barstow-ToyahSPRING 2010
©Copyright 2010, Texas A&M UniversityAll rights reserved.
Secondary Report-Page 2 of 99

8/7/2019 REEVES COUNTY - Pecos-Barstow-Toyah ISD _ 2010 Texas School Survey of Drug and Alcohol Use
http://slidepdf.com/reader/full/reeves-county-pecos-barstow-toyah-isd-2010-texas-school-survey-of-drug 3/99
Pecos-Barstow-ToyahSPRING 2010
Part I: District ResultsSecondary (7-12)
Table of Contents
General Substance Tables 5-36
TobaccoAlcoholDrugsInhalantsMiscellaneous
Prevalence Tables 37-66
Selected Substances:
Table B1: All StudentsTable B2: Male StudentsTable B3: Female StudentsTable B4: White StudentsTable B5: African/American StudentsTable B6: Mexican/American StudentsTable B7: Students Reporting A GradesTable B8: Students Reporting Grades Lower Than an ATable B9: Students Living With 2 ParentsTable B10: Students Not Living With 2 ParentsTable B11: Students who would seek help from adults
Table B12: Students who wouldn’t seek help from adultsTable B13 Students Living in Town More Than 3 YearsTable B14: Students Living in Town 3 Years or Less
Margin Tables 67-85
©Copyright 2010, Texas A&M UniversityAll rights reserved.
Secondary Report-Page 3 of 99

8/7/2019 REEVES COUNTY - Pecos-Barstow-Toyah ISD _ 2010 Texas School Survey of Drug and Alcohol Use
http://slidepdf.com/reader/full/reeves-county-pecos-barstow-toyah-isd-2010-texas-school-survey-of-drug 4/99
Pecos-Barstow-ToyahSPRING 2010
©Copyright 2010, Texas A&M UniversityAll rights reserved.
Secondary Report-Page 4 of 99

8/7/2019 REEVES COUNTY - Pecos-Barstow-Toyah ISD _ 2010 Texas School Survey of Drug and Alcohol Use
http://slidepdf.com/reader/full/reeves-county-pecos-barstow-toyah-isd-2010-texas-school-survey-of-drug 5/99
Pecos-Barstow-ToyahSPRING 2010
1. General Substance Tables
©Copyright 2010, Texas A&M UniversityAll rights reserved.
Secondary Report-Page 5 of 99

8/7/2019 REEVES COUNTY - Pecos-Barstow-Toyah ISD _ 2010 Texas School Survey of Drug and Alcohol Use
http://slidepdf.com/reader/full/reeves-county-pecos-barstow-toyah-isd-2010-texas-school-survey-of-drug 6/99
Pecos-Barstow-ToyahSPRING 2010
©Copyright 2010, Texas A&M UniversityAll rights reserved.
Secondary Report-Page 6 of 99

8/7/2019 REEVES COUNTY - Pecos-Barstow-Toyah ISD _ 2010 Texas School Survey of Drug and Alcohol Use
http://slidepdf.com/reader/full/reeves-county-pecos-barstow-toyah-isd-2010-texas-school-survey-of-drug 7/99
Pecos-Barstow-ToyahSPRING 2010
Table T-1: How recently, if ever, have you used ..
PastMonth
SchoolYear
EverUsed
NeverUsed
Any tobacco product?All 16.5% 22.7% 41.0% 59.0%
Grades 7-8 8.9% 11.8% 22.7% 77.3%Grades 9-12 20.2% 28.2% 50.1% 49.9%
Cigarettes?All 15.0% 20.5% 38.0% 62.0%
Grades 7-8 8.1% 11.0% 21.2% 78.8%Grades 9-12 18.5% 25.3% 46.4% 53.6%
Smokeless tobacco?All 3.2% 5.8% 13.8% 86.2%
Grades 7-8 1.7% 1.7% 4.7% 95.3%Grades 9-12 4.0% 7.9% 18.4% 81.6%
Table T-2: How often do you normally use ..
NeverUsed
EveryDay
SeveralTimes a
Week
SeveralTimes a
Month
AboutOnce aMonth
AboutOnce a
Year
Less thanOnce a
YearAny tobacco product?
All 63.0% 6.1% 3.7% 6.7% 6.7% 5.2% 8.6%Grades 7-8 78.1% 2.6% 6.5% 3.7% 2.2% 3.5% 3.5%
Grades 9-12 55.7% 7.8% 2.4% 8.2% 8.9% 6.0% 11.1%Cigarettes?
All 66.2% 4.3% 3.8% 5.8% 7.2% 5.2% 7.6%Grades 7-8 79.6% 1.8% 6.6% 3.7% 2.2% 3.5% 2.6%
Grades 9-12 59.8% 5.5% 2.4% 6.7% 9.6% 6.0% 10.0%Smokeless tobacco?
All 86.6% 2.1% 0.9% 1.8% 2.7% 1.6% 4.4%Grades 7-8 95.3% 0.9% 0.7% 0.0% 0.7% 0.7% 1.8%
Grades 9-12 82.5% 2.6% 1.0% 2.7% 3.6% 2.0% 5.6%
Table T-3: Average age of first use of:
grade1 grade2Cigarettes
11.5 13.5Smokeless tobacco12.2 14.2
Any Tobacco11.6 13.5
©Copyright 2010, Texas A&M UniversityAll rights reserved.
Secondary Report-Page 7 of 99

8/7/2019 REEVES COUNTY - Pecos-Barstow-Toyah ISD _ 2010 Texas School Survey of Drug and Alcohol Use
http://slidepdf.com/reader/full/reeves-county-pecos-barstow-toyah-isd-2010-texas-school-survey-of-drug 8/99
Pecos-Barstow-ToyahSPRING 2010
Table T-4: If you wanted some, how difficult would it be to get...
NeverHeard Of Impossible
VeryDifficult
SomewhatDifficult
SomewhatEasy Very Easy
Any tobacco product?All 21.7% 14.7% 5.6% 5.3% 14.7% 38.0%
Grades 7-8 27.5% 23.9% 7.4% 5.6% 11.5% 24.1%
Grades 9-12 19.0% 10.3% 4.8% 5.1% 16.2% 44.6%Cigarettes?
All 21.7% 15.7% 5.9% 5.9% 15.2% 35.6%Grades 7-8 27.0% 25.6% 8.8% 5.7% 8.6% 24.3%
Grades 9-12 19.3% 11.0% 4.5% 5.9% 18.3% 41.0%Smokeless Tobacco?
All 36.5% 17.5% 5.5% 6.2% 11.5% 22.9%Grades 7-8 48.2% 27.1% 6.1% 8.2% 5.0% 5.5%
Grades 9-12 30.9% 13.0% 5.2% 5.2% 14.5% 31.2%
Table T-5: About how many of your close friends...
None A Few Some Most ALLUse any tobacco product?
All 36.0% 29.8% 18.6% 12.7% 2.9%Grades 7-8 59.7% 22.1% 9.6% 5.4% 3.1%
Grades 9-12 24.0% 33.6% 23.1% 16.4% 2.8%Smoke cigarettes?
All 38.9% 31.9% 14.6% 12.2% 2.5%Grades 7-8 60.5% 22.8% 9.0% 5.4% 2.3%
Grades 9-12 27.9% 36.5% 17.5% 15.6% 2.5%Use a smokeless tobacco product?
All 60.6% 22.4% 12.4% 3.7% 1.0%Grades 7-8 84.5% 9.0% 4.4% 0.6% 1.5%
Grades 9-12 48.4% 29.3% 16.4% 5.2% 0.7%
©Copyright 2010, Texas A&M UniversityAll rights reserved.
Secondary Report-Page 8 of 99

8/7/2019 REEVES COUNTY - Pecos-Barstow-Toyah ISD _ 2010 Texas School Survey of Drug and Alcohol Use
http://slidepdf.com/reader/full/reeves-county-pecos-barstow-toyah-isd-2010-texas-school-survey-of-drug 9/99
Pecos-Barstow-ToyahSPRING 2010
Table T-6: How do your parents feel about kids your age using tobacco?
StronglyDisapprove
MildlyDisapprove Neither
MildlyApprove
StronglyApprove Don't know
All 69.6% 9.7% 8.1% 2.3% 0.9% 9.3%Grades 7-8 75.3% 6.0% 3.7% 0.7% 1.8% 12.5%
Grades 9-12 66.9% 11.5% 10.2% 3.1% 0.5% 7.9%
Table T-7: How dangerous do you think it is for kids your age to use tobacco?
VeryDangerous
SomewhatDangerous
Not veryDangerous
Not at AllDangerous Do Not Know
All 51.4% 24.6% 10.5% 3.6% 9.9%Grades 7-8 61.1% 21.8% 3.6% 2.7% 10.9%
Grades 9-12 46.8% 26.0% 13.9% 4.0% 9.4%
©Copyright 2010, Texas A&M UniversityAll rights reserved.
Secondary Report-Page 9 of 99

8/7/2019 REEVES COUNTY - Pecos-Barstow-Toyah ISD _ 2010 Texas School Survey of Drug and Alcohol Use
http://slidepdf.com/reader/full/reeves-county-pecos-barstow-toyah-isd-2010-texas-school-survey-of-drug 10/99
Pecos-Barstow-ToyahSPRING 2010
Table A-1: How recently, if ever, have you used...
PastMonth
SchoolYear
EverUsed
NeverUsed
Any alcohol product?All 34.2% 48.2% 72.9% 27.1%
Grades 7-8 24.3% 36.1% 57.1% 42.9%
Grades 9-12 39.2% 54.3% 80.8% 19.2%Beer?
All 28.0% 42.7% 64.1% 35.9%Grades 7-8 17.2% 30.2% 45.5% 54.5%
Grades 9-12 33.3% 48.9% 73.2% 26.8%Wine coolers?
All 21.0% 32.2% 50.9% 49.1%Grades 7-8 15.7% 24.3% 34.9% 65.1%
Grades 9-12 23.7% 36.2% 59.1% 40.9%Wine?
All 12.5% 21.5% 42.1% 57.9%Grades 7-8 11.5% 18.4% 34.9% 65.1%
Grades 9-12 12.9% 23.0% 45.7% 54.3%Liquor?
All 21.8% 34.4% 55.8% 44.2%Grades 7-8 13.9% 20.3% 36.9% 63.1%
Grades 9-12 25.7% 41.5% 65.1% 34.9%
©Copyright 2010, Texas A&M UniversityAll rights reserved.
Secondary Report-Page 10 of 99

8/7/2019 REEVES COUNTY - Pecos-Barstow-Toyah ISD _ 2010 Texas School Survey of Drug and Alcohol Use
http://slidepdf.com/reader/full/reeves-county-pecos-barstow-toyah-isd-2010-texas-school-survey-of-drug 11/99
Pecos-Barstow-ToyahSPRING 2010
Table A-2: How often do you normally use...
NeverUsed
EveryDay
SeveralTimes a
Week
SeveralTimes a
Month
AboutOnce aMonth
AboutOnce a
Year
Less thanOnce a
YearAny alcohol product?
All 32.6% 1.5% 9.1% 17.6% 18.0% 10.9% 10.2%
Grades 7-8 50.2% 0.9% 8.5% 8.3% 13.0% 8.7% 10.4%Grades 9-12 24.1% 1.9% 9.5% 22.2% 20.4% 12.0% 10.0%
Beer?All 38.6% 1.2% 8.0% 15.1% 18.2% 9.4% 9.5%
Grades 7-8 55.8% 0.9% 6.5% 6.1% 13.9% 7.0% 9.9%Grades 9-12 30.4% 1.3% 8.7% 19.5% 20.3% 10.5% 9.3%
Wine coolers?All 52.1% 0.6% 4.8% 11.4% 14.0% 7.9% 9.4%
Grades 7-8 66.4% 0.0% 4.9% 7.3% 7.7% 7.1% 6.6%Grades 9-12 45.2% 0.8% 4.7% 13.3% 17.0% 8.2% 10.7%
Wine?All 59.6% 0.0% 2.7% 6.2% 9.2% 10.1% 12.3%
Grades 7-8 68.4% 0.0% 4.1% 4.1% 6.3% 9.7% 7.5%Grades 9-12 55.4% 0.0% 2.0% 7.2% 10.5% 10.2% 14.6%
Liquor?All 46.3% 0.2% 6.3% 13.5% 16.4% 8.8% 8.5%
Grades 7-8 64.2% 0.0% 5.5% 7.1% 9.1% 7.1% 7.1%Grades 9-12 37.6% 0.2% 6.6% 16.7% 20.0% 9.7% 9.2%
©Copyright 2010, Texas A&M UniversityAll rights reserved.
Secondary Report-Page 11 of 99

8/7/2019 REEVES COUNTY - Pecos-Barstow-Toyah ISD _ 2010 Texas School Survey of Drug and Alcohol Use
http://slidepdf.com/reader/full/reeves-county-pecos-barstow-toyah-isd-2010-texas-school-survey-of-drug 12/99
Pecos-Barstow-ToyahSPRING 2010
Table A-3: When you drink the following alcoholic beverages, how many drinks doyou usually have at one time, on average?
Never Ever Used 5 or More 1 to 4 Less than 1Beer
All 35.5% 64.5% 28.4% 27.4% 8.6%Grades 7-8 51.3% 48.7% 13.6% 25.1% 10.0%
Grades 9-12 27.8% 72.2% 35.7% 28.6% 8.0%Wine Coolers
All 48.1% 51.9% 16.9% 27.9% 7.1%Grades 7-8 60.3% 39.7% 7.6% 24.0% 8.1%
Grades 9-12 42.1% 57.9% 21.5% 29.8% 6.6%Wine
All 55.7% 44.3% 6.8% 22.9% 14.5%Grades 7-8 64.2% 35.8% 7.0% 19.7% 9.2%
Grades 9-12 51.5% 48.5% 6.8% 24.5% 17.2%Liquor
All 42.9% 57.1% 20.2% 26.1% 10.8%Grades 7-8 62.4% 37.6% 11.0% 18.0% 8.6%
Grades 9-12 33.5% 66.5% 24.7% 30.0% 11.8%
Table A-4: During the past 30 days, on how many days have you had five or moredrinks of alcohol at one time?
Never/None 1 day 2 days 3 to 5 days 6 to 9 days10 or
more daysAlcohol
All 67.2% 10.3% 7.7% 6.3% 2.2% 6.3%Grades 7-8 80.0% 8.7% 6.9% 3.8% 0.0% 0.7%
Grades 9-12 61.1% 11.1% 8.1% 7.5% 3.3% 9.0%
Table A-5: Average age of first use of:
grade1 grade2Beer
11.1 13.5Wine Coolers
11.5 13.5Wine
11.4 13.4
Liquor11.8 14.0
Any Alcohol11.0 13.2
©Copyright 2010, Texas A&M UniversityAll rights reserved.
Secondary Report-Page 12 of 99

8/7/2019 REEVES COUNTY - Pecos-Barstow-Toyah ISD _ 2010 Texas School Survey of Drug and Alcohol Use
http://slidepdf.com/reader/full/reeves-county-pecos-barstow-toyah-isd-2010-texas-school-survey-of-drug 13/99
Pecos-Barstow-ToyahSPRING 2010
Table A-6: If you wanted some, how difficult would it be to get...
NeverHeard Of Impossible
VeryDifficult
SomewhatDifficult
SomewhatEasy Very Easy
Beer?All 15.5% 8.6% 5.7% 13.2% 20.7% 36.2%
Grades 7-8 22.5% 16.2% 5.4% 12.2% 14.1% 29.7%
Grades 9-12 12.3% 5.2% 5.8% 13.7% 23.8% 39.2%Wine coolers?
All 21.0% 11.3% 7.0% 11.8% 17.9% 31.1%Grades 7-8 25.2% 20.8% 10.3% 12.1% 8.2% 23.3%
Grades 9-12 19.0% 6.8% 5.5% 11.6% 22.4% 34.7%Wine?
All 24.3% 13.7% 7.2% 12.2% 16.0% 26.5%Grades 7-8 26.5% 20.7% 10.9% 8.8% 8.6% 24.4%
Grades 9-12 23.3% 10.5% 5.5% 13.8% 19.5% 27.5%Liquor?
All 17.9% 12.7% 8.1% 10.1% 18.5% 32.6%Grades 7-8 24.2% 22.8% 9.8% 8.4% 9.1% 25.6%
Grades 9-12 15.0% 8.0% 7.3% 10.9% 22.9% 35.9%Any alcohol product?
All 14.3% 7.7% 5.6% 12.7% 18.5% 41.2%Grades 7-8 20.9% 12.6% 7.4% 12.8% 12.4% 33.8%
Grades 9-12 11.2% 5.3% 4.8% 12.6% 21.4% 44.7%
©Copyright 2010, Texas A&M UniversityAll rights reserved.
Secondary Report-Page 13 of 99

8/7/2019 REEVES COUNTY - Pecos-Barstow-Toyah ISD _ 2010 Texas School Survey of Drug and Alcohol Use
http://slidepdf.com/reader/full/reeves-county-pecos-barstow-toyah-isd-2010-texas-school-survey-of-drug 14/99
Pecos-Barstow-ToyahSPRING 2010
Table A-7: Since school began in the fall, on how many days (if any) have you...
None 1-3 Times 4-9 Times 10+ TimesAttended class while drunk on alcohol?
All 89.9% 6.9% 1.4% 1.8%Grades 7-8 88.0% 9.3% 0.9% 1.8%
Grades 9-12 90.9% 5.7% 1.6% 1.8%
Gotten into trouble with teachers because of your drinking?All 98.0% 1.5% 0.2% 0.4%
Grades 7-8 98.2% 0.9% 0.0% 0.9%Grades 9-12 97.9% 1.7% 0.2% 0.2%
Table A-8: School year use of alcohol by absences and conduct problems:
Average days absent due toillness or other reasons
Alcohol Users: 5.5
Alcohol Non-use 4.3
Average days conduct problemsreported
Alcohol Users: 2.1Alcohol Non-use 0.9
Table A-9: During the past twelve months, how many times have you...
None 1-3 Times 4-9 Times 10+ Times
Driven a car when you've had a good bit to drink?All 79.9% 15.3% 2.1% 2.7%
Grades 9-12 79.9% 15.3% 2.1% 2.7%Gotten into trouble with the police because of drinking?
All 92.8% 6.1% 0.9% 0.1%Grades 7-8 94.1% 4.1% 1.8% 0.0%
Grades 9-12 92.2% 7.1% 0.5% 0.2%
©Copyright 2010, Texas A&M UniversityAll rights reserved.
Secondary Report-Page 14 of 99

8/7/2019 REEVES COUNTY - Pecos-Barstow-Toyah ISD _ 2010 Texas School Survey of Drug and Alcohol Use
http://slidepdf.com/reader/full/reeves-county-pecos-barstow-toyah-isd-2010-texas-school-survey-of-drug 15/99
Pecos-Barstow-ToyahSPRING 2010
Table A-10: About how many of your close friends use...
None A Few Some Most ALLAny alcohol product?
All 20.1% 18.5% 16.7% 27.2% 17.6%Grades 7-8 37.2% 29.6% 9.5% 13.9% 9.9%
Grades 9-12 11.4% 12.9% 20.3% 33.9% 21.5%
Beer?All 21.3% 19.4% 16.6% 27.3% 15.4%
Grades 7-8 40.5% 28.0% 9.3% 13.6% 8.6%Grades 9-12 11.8% 15.1% 20.3% 34.1% 18.7%
Wine coolers?All 38.9% 18.0% 17.1% 16.7% 9.3%
Grades 7-8 57.3% 19.3% 6.9% 10.3% 6.2%Grades 9-12 29.7% 17.4% 22.2% 19.8% 10.9%
Wine?All 54.5% 22.4% 11.8% 6.2% 5.0%
Grades 7-8 60.1% 18.9% 9.3% 6.9% 4.8%Grades 9-12 51.8% 24.1% 13.0% 5.9% 5.2%
Liquor?All 33.1% 16.5% 16.1% 21.1% 13.1%
Grades 7-8 56.0% 17.7% 7.8% 10.8% 7.8%Grades 9-12 21.7% 16.0% 20.3% 26.3% 15.8%
Table A-11: During the past twelve months, how many times have you...
None 1-3 Times 4-9 Times 10+ TimesHad difficulties of any kind with your friends because of your drinking?
All 89.4% 9.6% 0.7% 0.3%Grades 7-8 92.7% 5.7% 0.7% 0.9%
Grades 9-12 87.9% 11.4% 0.7% 0.0%Been criticized by someone you were dating because of drinking?
All 88.8% 9.2% 1.1% 0.9%Grades 7-8 93.0% 6.1% 0.9% 0.0%
Grades 9-12 86.9% 10.6% 1.2% 1.3%
©Copyright 2010, Texas A&M UniversityAll rights reserved.
Secondary Report-Page 15 of 99

8/7/2019 REEVES COUNTY - Pecos-Barstow-Toyah ISD _ 2010 Texas School Survey of Drug and Alcohol Use
http://slidepdf.com/reader/full/reeves-county-pecos-barstow-toyah-isd-2010-texas-school-survey-of-drug 16/99
Pecos-Barstow-ToyahSPRING 2010
Table A-12: Thinking of parties you attended this school year, how often wasalcohol used?
Never SeldomHalf
the TimeMost
of the Time Always Don't knowDidn'tattend
All 28.7% 8.6% 8.3% 11.6% 27.1% 3.1% 12.6%Grades 7-8 51.9% 12.2% 6.5% 4.5% 6.1% 4.7% 14.0%
Grades 9-12 17.8% 6.9% 9.2% 14.9% 37.0% 2.3% 11.9%
Table A-13: How often, if ever, do you get alcoholic beverages from..
Do Not Drink Never SeldomMost of
the Time AlwaysAt home?
All 35.5% 40.0% 17.8% 5.1% 1.6%Grades 7-8 45.3% 31.8% 13.7% 6.8% 2.5%
Grades 9-12 30.9% 43.8% 19.7% 4.3% 1.2%From friends?
All 29.6% 14.3% 18.0% 27.9% 10.1%Grades 7-8 42.9% 21.6% 12.6% 16.2% 6.7%
Grades 9-12 23.4% 10.9% 20.6% 33.4% 11.7%From a store?
All 33.3% 47.0% 9.9% 7.5% 2.3%Grades 7-8 42.0% 45.5% 5.6% 6.2% 0.7%
Grades 9-12 29.1% 47.7% 12.0% 8.1% 3.2%At parties?
All 29.8% 14.0% 12.1% 20.3% 23.8%Grades 7-8 42.2% 24.1% 9.6% 12.7% 11.4%
Grades 9-12 24.0% 9.2% 13.3% 23.9% 29.7%Other source?
All 33.4% 24.3% 15.8% 13.6% 12.9%Grades 7-8 44.5% 31.6% 8.4% 5.3% 10.2%
Grades 9-12 28.0% 20.8% 19.4% 17.6% 14.2%
©Copyright 2010, Texas A&M UniversityAll rights reserved.
Secondary Report-Page 16 of 99

8/7/2019 REEVES COUNTY - Pecos-Barstow-Toyah ISD _ 2010 Texas School Survey of Drug and Alcohol Use
http://slidepdf.com/reader/full/reeves-county-pecos-barstow-toyah-isd-2010-texas-school-survey-of-drug 17/99
Pecos-Barstow-ToyahSPRING 2010
Table A-14: How do your parents feel about kids your age drinking alcohol?
StronglyDisapprove
MildlyDisapprove Neither
MildlyApprove
StronglyApprove Don't know
All 58.0% 13.4% 11.3% 5.4% 2.0% 9.9%Grades 7-8 63.9% 9.3% 6.8% 5.6% 1.9% 12.6%
Grades 9-12 55.3% 15.2% 13.4% 5.4% 2.0% 8.7%
Table A-15: How dangerous do you think it is for kids your age to use alcohol?
VeryDangerous
SomewhatDangerous
Not veryDangerous
Not at AllDangerous Do Not Know
All 41.5% 30.0% 15.0% 6.3% 7.1%Grades 7-8 43.5% 22.8% 18.5% 8.0% 7.3%
Grades 9-12 40.6% 33.5% 13.4% 5.5% 7.1%
©Copyright 2010, Texas A&M UniversityAll rights reserved.
Secondary Report-Page 17 of 99

8/7/2019 REEVES COUNTY - Pecos-Barstow-Toyah ISD _ 2010 Texas School Survey of Drug and Alcohol Use
http://slidepdf.com/reader/full/reeves-county-pecos-barstow-toyah-isd-2010-texas-school-survey-of-drug 18/99
Pecos-Barstow-ToyahSPRING 2010
Table D-1: How recently, if ever, have you used...
PastMonth
SchoolYear
EverUsed
NeverUsed
Marijuana?All 9.5% 15.8% 29.0% 71.0%
Grades 7-8 8.1% 8.8% 12.1% 87.9%
Grades 9-12 10.2% 19.3% 37.5% 62.5%Cocaine?
All 3.6% 5.2% 11.9% 88.1%Grades 7-8 1.7% 1.7% 3.4% 96.6%
Grades 9-12 4.6% 7.0% 16.1% 83.9%Crack?
All 0.2% 0.7% 2.5% 97.5%Grades 7-8 0.0% 0.0% 0.9% 99.1%
Grades 9-12 0.3% 1.0% 3.4% 96.6%Hallucinogens?
All 1.3% 1.9% 4.1% 95.9%Grades 7-8 1.5% 1.5% 2.4% 97.6%
Grades 9-12 1.2% 2.0% 4.9% 95.1%Uppers?
All 1.5% 1.8% 2.9% 97.1%Grades 7-8 0.9% 0.9% 1.7% 98.3%
Grades 9-12 1.8% 2.3% 3.4% 96.6%Downers?
All 3.0% 3.9% 4.8% 95.2%Grades 7-8 0.9% 1.5% 1.5% 98.5%
Grades 9-12 4.0% 5.0% 6.4% 93.6%Rohypnol?
All 1.2% 1.2% 1.8% 98.2%Grades 7-8 2.5% 3.7% 3.7% 96.3%
Grades 9-12 0.5% 4.2% 5.2% 94.8%
Steroids?All 0.7% 1.0% 2.3% 97.7%
Grades 7-8 0.0% 0.8% 1.5% 98.5%Grades 9-12 1.1% 1.1% 2.7% 97.3%
Ecstasy?All 2.1% 2.6% 5.4% 94.6%
Grades 7-8 2.5% 3.4% 3.4% 96.6%Grades 9-12 1.9% 2.2% 6.4% 93.6%
Heroin?All 0.4% 0.4% 0.8% 99.2%
Grades 7-8 0.8% 1.3% 1.3% 98.7%Grades 9-12 0.2% 1.5% 2.1% 97.9%
©Copyright 2010, Texas A&M UniversityAll rights reserved.
Secondary Report-Page 18 of 99

8/7/2019 REEVES COUNTY - Pecos-Barstow-Toyah ISD _ 2010 Texas School Survey of Drug and Alcohol Use
http://slidepdf.com/reader/full/reeves-county-pecos-barstow-toyah-isd-2010-texas-school-survey-of-drug 19/99
Pecos-Barstow-ToyahSPRING 2010
Table D-2: How often do you normally use...
NeverUsed
EveryDay
SeveralTimes a
Week
SeveralTimes a
Month
AboutOnce aMonth
AboutOnce a
Year
Less thanOnce a
YearMarijuana?
All 74.7% 3.2% 2.8% 3.8% 5.1% 5.1% 5.5%
Grades 7-8 88.7% 2.7% 1.4% 2.5% 1.6% 2.3% 0.9%Grades 9-12 68.0% 3.4% 3.4% 4.4% 6.7% 6.4% 7.6%
Cocaine?All 90.5% 0.2% 1.1% 1.9% 2.5% 1.3% 2.5%
Grades 7-8 96.4% 0.0% 0.9% 0.9% 0.9% 0.0% 0.9%Grades 9-12 87.8% 0.2% 1.2% 2.3% 3.3% 2.0% 3.2%
Crack?All 97.6% 0.0% 0.0% 0.3% 0.5% 0.3% 1.2%
Grades 7-8 99.1% 0.0% 0.0% 0.0% 0.0% 0.0% 0.9%Grades 9-12 96.9% 0.0% 0.0% 0.4% 0.8% 0.4% 1.4%
Hallucinogens?All 98.1% 0.0% 0.0% 0.5% 0.7% 0.2% 0.5%
Grades 7-8 100.0% 0.0% 0.0% 0.0% 0.0% 0.0% 0.0%Grades 9-12 97.3% 0.0% 0.0% 0.7% 1.0% 0.2% 0.8%
Uppers?All 97.0% 0.3% 0.7% 0.4% 0.8% 0.2% 0.5%
Grades 7-8 95.7% 0.9% 1.8% 0.9% 0.7% 0.0% 0.0%Grades 9-12 97.6% 0.0% 0.2% 0.2% 0.9% 0.3% 0.7%
Downers?All 96.0% 0.0% 0.7% 1.0% 1.7% 0.4% 0.1%
Grades 7-8 96.6% 0.0% 1.8% 0.9% 0.7% 0.0% 0.0%Grades 9-12 95.7% 0.0% 0.2% 1.0% 2.2% 0.6% 0.2%
Rohypnol?All 98.4% 0.3% 0.5% 0.2% 0.5% 0.0% 0.1%
Grades 7-8 98.2% 0.9% 0.9% 0.0% 0.0% 0.0% 0.0%
Grades 9-12 98.5% 0.0% 0.2% 0.2% 0.8% 0.0% 0.2%Steroids?
All 98.7% 0.0% 0.0% 0.6% 0.0% 0.2% 0.5%Grades 7-8 99.1% 0.0% 0.0% 0.9% 0.0% 0.0% 0.0%
Grades 9-12 98.5% 0.0% 0.0% 0.5% 0.0% 0.2% 0.8%Ecstasy?
All 95.5% 0.0% 0.9% 0.7% 0.6% 0.5% 1.7%Grades 7-8 96.3% 0.0% 1.9% 0.0% 0.9% 0.0% 0.9%
Grades 9-12 95.2% 0.0% 0.5% 1.0% 0.4% 0.7% 2.1%Heroin?
All 99.7% 0.0% 0.0% 0.0% 0.0% 0.0% 0.3%Grades 7-8 100.0% 0.0% 0.0% 0.0% 0.0% 0.0% 0.0%
Grades 9-12 99.5% 0.0% 0.0% 0.0% 0.0% 0.0% 0.5%
©Copyright 2010, Texas A&M UniversityAll rights reserved.
Secondary Report-Page 19 of 99

8/7/2019 REEVES COUNTY - Pecos-Barstow-Toyah ISD _ 2010 Texas School Survey of Drug and Alcohol Use
http://slidepdf.com/reader/full/reeves-county-pecos-barstow-toyah-isd-2010-texas-school-survey-of-drug 20/99
Pecos-Barstow-ToyahSPRING 2010
Table D-3: Average age of first use of:
grade1 grade2Marijuana
11.9 13.7Cocaine
12.0 14.8
Crack * 14.2
Hallucinogens* 12.5
Uppers11.5 14.3
Downers12.2 14.5
Rohypnol* 14.9
Steroids* 13.3
Ecstasy* 13.8
Heroin* *
Table D-4: Age of first use of marijuana by family situation:
Never 9/Under 10 to 11 12 to 13 14 to 15 16 to 17 Over 17Two parent family
All 76.0% 0.9% 1.6% 7.5% 8.6% 4.3% 1.1%Grades 7-8 94.8% 0.0% 1.1% 1.1% 2.9% 0.0% 0.0%
Grades 9-12 67.1% 1.3% 1.9% 10.5% 11.2% 6.3% 1.7%Other family situation
All 63.1% 2.9% 5.7% 11.3% 14.5% 1.9% 0.6%Grades 7-8 76.6% 3.3% 9.2% 10.9% 0.0% 0.0% 0.0%
Grades 9-12 56.2% 2.7% 3.9% 11.5% 21.9% 2.9% 0.9%
©Copyright 2010, Texas A&M UniversityAll rights reserved.
Secondary Report-Page 20 of 99

8/7/2019 REEVES COUNTY - Pecos-Barstow-Toyah ISD _ 2010 Texas School Survey of Drug and Alcohol Use
http://slidepdf.com/reader/full/reeves-county-pecos-barstow-toyah-isd-2010-texas-school-survey-of-drug 21/99
Pecos-Barstow-ToyahSPRING 2010
Table D-5: If you wanted some, how difficult would it be to get..
NeverHeard Of Impossible
VeryDifficult
SomewhatDifficult
SomewhatEasy Very Easy
Marijuana?All 28.7% 20.1% 6.8% 10.6% 11.2% 22.7%
Grades 7-8 35.6% 31.2% 7.3% 5.9% 5.4% 14.8%
Grades 9-12 25.5% 15.0% 6.5% 12.7% 13.9% 26.3%Cocaine?
All 36.4% 25.4% 7.5% 8.1% 9.7% 12.9%Grades 7-8 39.2% 38.9% 5.1% 5.1% 7.0% 4.7%
Grades 9-12 35.1% 19.2% 8.5% 9.4% 11.0% 16.8%Crack?
All 40.0% 27.3% 10.8% 7.7% 7.1% 7.1%Grades 7-8 44.0% 37.2% 7.7% 3.9% 5.0% 2.3%
Grades 9-12 38.1% 22.5% 12.3% 9.5% 8.1% 9.4%Hallucinogens?
All 52.7% 23.3% 7.5% 6.8% 3.9% 5.9%Grades 7-8 55.5% 27.7% 4.4% 6.7% 1.6% 4.1%
Grades 9-12 51.4% 21.2% 8.9% 6.9% 5.0% 6.6%Uppers?
All 62.3% 16.9% 5.1% 3.2% 5.0% 7.5%Grades 7-8 58.6% 23.4% 4.2% 2.6% 5.1% 6.1%
Grades 9-12 64.1% 13.8% 5.5% 3.5% 5.0% 8.2%Downers?
All 61.5% 17.2% 5.0% 3.0% 5.2% 8.0%Grades 7-8 58.1% 24.9% 4.2% 2.6% 4.4% 5.8%
Grades 9-12 63.1% 13.7% 5.4% 3.2% 5.6% 9.0%Rohypnol?
All 59.7% 19.8% 7.1% 4.5% 3.5% 5.4%Grades 7-8 60.4% 24.6% 4.0% 3.3% 2.8% 4.9%
Grades 9-12 59.4% 17.6% 8.5% 5.0% 3.9% 5.6%
Steroids?All 42.4% 30.6% 9.3% 7.7% 4.1% 5.8%
Grades 7-8 40.6% 40.6% 6.0% 4.4% 2.1% 6.5%Grades 9-12 43.3% 25.9% 10.9% 9.2% 5.1% 5.5%
Ecstasy?All 46.8% 23.5% 8.8% 7.5% 5.1% 8.3%
Grades 7-8 56.8% 27.6% 3.0% 2.8% 1.6% 8.1%Grades 9-12 42.1% 21.6% 11.5% 9.7% 6.7% 8.4%
Heroin?All 47.6% 28.5% 9.6% 5.5% 3.7% 5.1%
Grades 7-8 51.3% 33.6% 4.9% 4.6% 2.3% 3.2%Grades 9-12 45.9% 26.1% 11.7% 5.9% 4.4% 6.0%
©Copyright 2010, Texas A&M UniversityAll rights reserved.
Secondary Report-Page 21 of 99

8/7/2019 REEVES COUNTY - Pecos-Barstow-Toyah ISD _ 2010 Texas School Survey of Drug and Alcohol Use
http://slidepdf.com/reader/full/reeves-county-pecos-barstow-toyah-isd-2010-texas-school-survey-of-drug 22/99
Pecos-Barstow-ToyahSPRING 2010
Table D-6: Since school began in the fall, on how many days (if any) have you..
None 1-3 Times 4-9 Times 10+ TimesAttended class while high from marijuana use?
All 91.8% 5.7% 1.4% 1.1%Grades 7-8 93.3% 4.0% 1.8% 0.9%
Grades 9-12 91.0% 6.5% 1.2% 1.3%
Attended class while high from use of some other drug?All 92.9% 5.2% 0.7% 1.2%
Grades 7-8 93.9% 3.6% 0.7% 1.8%Grades 9-12 92.4% 5.9% 0.7% 1.0%
Gotten into trouble with teachers because of your drug use?All 98.1% 1.2% 0.6% 0.1%
Grades 7-8 98.4% 0.7% 0.9% 0.0%Grades 9-12 97.9% 1.4% 0.4% 0.2%
Table D-7: School year use of marijuana by absences and conduct problems:
Average days absent due toillness or other reasons
Marijuana Users: 5.7Marijuana Non-use 4.7
Average days conduct problemsreported
Marijuana Users: 3.3Marijuana Non-use 1.1
Table D-8: During the past twelve months, how many times have you..
None 1-3 Times 4-9 Times 10+ TimesDriven a car when you've felt high from drugs?
All 87.6% 8.5% 1.7% 2.2%Grades 9-12 87.6% 8.5% 1.7% 2.2%
Gotten into trouble with the police because of drug use?All 97.7% 1.6% 0.2% 0.4%
Grades 7-8 96.8% 3.2% 0.0% 0.0%Grades 9-12 98.2% 0.9% 0.3% 0.6%
©Copyright 2010, Texas A&M UniversityAll rights reserved.
Secondary Report-Page 22 of 99

8/7/2019 REEVES COUNTY - Pecos-Barstow-Toyah ISD _ 2010 Texas School Survey of Drug and Alcohol Use
http://slidepdf.com/reader/full/reeves-county-pecos-barstow-toyah-isd-2010-texas-school-survey-of-drug 23/99
Pecos-Barstow-ToyahSPRING 2010
Table D-9: About how many of your close friends use marijuana?
None A Few Some Most ALL
All 49.5% 21.4% 12.3% 12.0% 4.9%Grades 7-8 65.0% 19.2% 4.9% 6.6% 4.3%
Grades 9-12 41.7% 22.4% 15.9% 14.7% 5.2%
Table D-10: During the past twelve months, how many times have you..
None 1-3 Times 4-9 Times 10+ TimesHad difficulties of any kind with your friends because of your drug use?
All 93.2% 5.8% 0.8% 0.2%Grades 7-8 93.3% 5.8% 0.9% 0.0%
Grades 9-12 93.2% 5.8% 0.8% 0.2%Been criticized by someone you were dating because of drug use?
All 93.8% 4.8% 0.6% 0.8%
Grades 7-8 94.7% 4.6% 0.7% 0.0%Grades 9-12 93.3% 4.9% 0.6% 1.2%
©Copyright 2010, Texas A&M UniversityAll rights reserved.
Secondary Report-Page 23 of 99

8/7/2019 REEVES COUNTY - Pecos-Barstow-Toyah ISD _ 2010 Texas School Survey of Drug and Alcohol Use
http://slidepdf.com/reader/full/reeves-county-pecos-barstow-toyah-isd-2010-texas-school-survey-of-drug 24/99
Pecos-Barstow-ToyahSPRING 2010
Table D-11: Thinking of parties you attended this school year, how often weremarijuana and/or other drugs used?
Never SeldomHalf
the TimeMost
of the Time Always Don't knowDidn'tattend
All 45.4% 11.3% 8.4% 8.0% 6.9% 6.5% 13.5%Grades 7-8 65.3% 3.8% 4.7% 3.8% 4.0% 3.6% 14.8%
Grades 9-12 36.0% 14.8% 10.1% 10.0% 8.2% 7.9% 13.0%
Table D-12: How often, if ever, do you smoke marijuana in..
CATEGORY Never SeldomHalf
the TimeMost of
the Time Always Don't knowJoints? All 77.7% 6.9% 5.5% 3.8% 4.4% 1.6%
Grades 7-8 88.9% 3.2% 3.9% 1.6% 2.5% 0.0%Grades 9-12 72.5% 8.6% 6.2% 4.9% 5.3% 2.4%
Blunts? All 77.6% 7.8% 5.3% 3.9% 3.7% 1.7%Grades 7-8 86.4% 3.9% 4.8% 1.4% 2.5% 0.9%
Grades 9-12 73.5% 9.7% 5.5% 5.1% 4.3% 2.1%Bongs or water pipes? All 81.1% 7.1% 3.6% 2.2% 4.0% 1.9%
Grades 7-8 86.4% 4.5% 2.5% 2.3% 3.4% 0.9%Grades 9-12 78.6% 8.3% 4.2% 2.2% 4.3% 2.4%
Pipes? All 78.5% 6.5% 3.8% 4.6% 5.4% 1.3%Grades 7-8 87.3% 4.5% 1.8% 2.0% 4.3% 0.0%
Grades 9-12 74.3% 7.4% 4.8% 5.8% 6.0% 1.9%Some other way? All 84.3% 6.6% 1.5% 1.0% 2.2% 4.4%
Grades 7-8 90.9% 4.8% 0.0% 0.7% 1.8% 1.8%Grades 9-12 81.2% 7.5% 2.1% 1.2% 2.3% 5.6%
©Copyright 2010, Texas A&M UniversityAll rights reserved.
Secondary Report-Page 24 of 99
8/7/2019 REEVES COUNTY - Pecos-Barstow-Toyah ISD _ 2010 Texas School Survey of Drug and Alcohol Use
http://slidepdf.com/reader/full/reeves-county-pecos-barstow-toyah-isd-2010-texas-school-survey-of-drug 25/99
Pecos-Barstow-ToyahSPRING 2010
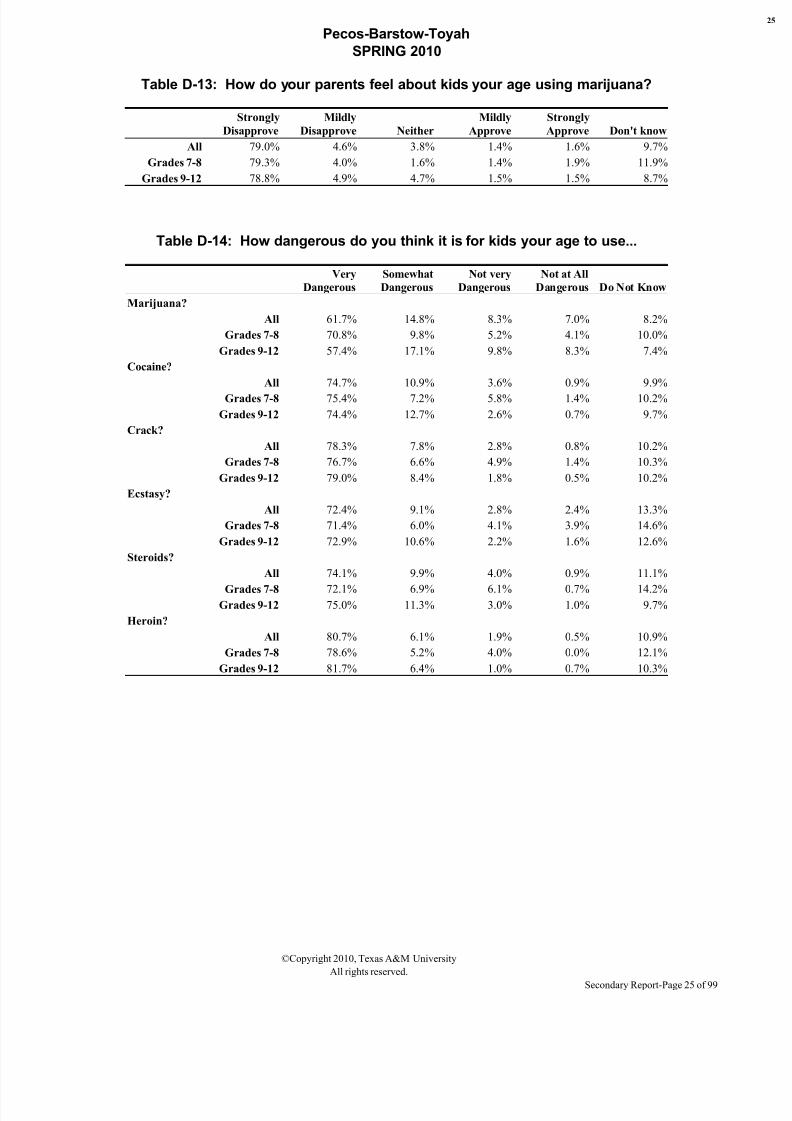
Table D-13: How do your parents feel about kids your age using marijuana?
StronglyDisapprove
MildlyDisapprove Neither
MildlyApprove
StronglyApprove Don't know
All 79.0% 4.6% 3.8% 1.4% 1.6% 9.7%Grades 7-8 79.3% 4.0% 1.6% 1.4% 1.9% 11.9%
Grades 9-12 78.8% 4.9% 4.7% 1.5% 1.5% 8.7%
Table D-14: How dangerous do you think it is for kids your age to use...
VeryDangerous
SomewhatDangerous
Not veryDangerous
Not at AllDangerous Do Not Know
Marijuana?All 61.7% 14.8% 8.3% 7.0% 8.2%
Grades 7-8 70.8% 9.8% 5.2% 4.1% 10.0%Grades 9-12 57.4% 17.1% 9.8% 8.3% 7.4%
Cocaine?All 74.7% 10.9% 3.6% 0.9% 9.9%
Grades 7-8 75.4% 7.2% 5.8% 1.4% 10.2%Grades 9-12 74.4% 12.7% 2.6% 0.7% 9.7%
Crack?All 78.3% 7.8% 2.8% 0.8% 10.2%
Grades 7-8 76.7% 6.6% 4.9% 1.4% 10.3%Grades 9-12 79.0% 8.4% 1.8% 0.5% 10.2%
Ecstasy?All 72.4% 9.1% 2.8% 2.4% 13.3%
Grades 7-8 71.4% 6.0% 4.1% 3.9% 14.6%Grades 9-12 72.9% 10.6% 2.2% 1.6% 12.6%
Steroids?All 74.1% 9.9% 4.0% 0.9% 11.1%
Grades 7-8 72.1% 6.9% 6.1% 0.7% 14.2%Grades 9-12 75.0% 11.3% 3.0% 1.0% 9.7%
Heroin?All 80.7% 6.1% 1.9% 0.5% 10.9%
Grades 7-8 78.6% 5.2% 4.0% 0.0% 12.1%Grades 9-12 81.7% 6.4% 1.0% 0.7% 10.3%
©Copyright 2010, Texas A&M UniversityAll rights reserved.
Secondary Report-Page 25 of 99

8/7/2019 REEVES COUNTY - Pecos-Barstow-Toyah ISD _ 2010 Texas School Survey of Drug and Alcohol Use
http://slidepdf.com/reader/full/reeves-county-pecos-barstow-toyah-isd-2010-texas-school-survey-of-drug 26/99
Pecos-Barstow-ToyahSPRING 2010
Table D-15: How recently, if ever, have you taken...
PastMonth
SchoolYear
EverUsed
NeverUsed
Methamphetamine?All 1.3% 1.3% 2.7% 97.3%
Grades 7-8 0.9% 0.9% 0.9% 99.1%
Grades 9-12 1.5% 1.5% 3.6% 96.4%
Table D-16: How recently, if ever, have you taken the following PRESCRIPTION DRUGS...
PastMonth
SchoolYear
EverUsed
NeverUsed
Codeine?All 11.8% 16.7% 26.1% 73.9%
Grades 7-8 10.9% 11.6% 13.2% 86.8%Grades 9-12 12.3% 19.2% 32.3% 67.7%
Oxycontin, Percodan or Percocet?All 1.6% 1.8% 3.8% 96.2%
Grades 7-8 0.9% 0.9% 0.9% 99.1%Grades 9-12 1.9% 2.2% 5.1% 94.9%
Vicodin, Lortab or Lorcet?All 3.2% 5.0% 7.4% 92.6%
Grades 7-8 3.6% 3.6% 3.6% 96.4%Grades 9-12 3.1% 5.7% 9.1% 90.9%
Valium or Diazepam?All 0.9% 1.2% 2.0% 98.0%
Grades 7-8 0.0% 0.0% 0.0% 100.0%Grades 9-12 1.4% 1.7% 2.9% 97.1%
Xanax or Alprazolam?
All 1.5% 2.3% 3.6% 96.4%Grades 7-8 0.9% 0.9% 1.6% 98.4%
Grades 9-12 1.8% 3.0% 4.5% 95.5%
Table D-17: How recently, if ever, have you taken the following OVER-THE COUNTER drugs...
PastMonth
SchoolYear
EverUsed
NeverUsed
DXM, Triple C?All 3.7% 6.2% 12.0% 88.0%
Grades 7-8 1.6% 1.6% 2.5% 97.5%Grades 9-12 4.7% 8.3% 16.5% 83.5%
©Copyright 2010, Texas A&M UniversityAll rights reserved.
Secondary Report-Page 26 of 99

8/7/2019 REEVES COUNTY - Pecos-Barstow-Toyah ISD _ 2010 Texas School Survey of Drug and Alcohol Use
http://slidepdf.com/reader/full/reeves-county-pecos-barstow-toyah-isd-2010-texas-school-survey-of-drug 27/99
Pecos-Barstow-ToyahSPRING 2010
Table I-1: How recently, if ever, have you used...
PastMonth
SchoolYear
EverUsed
NeverUsed
Spray paint?All 1.6% 2.6% 8.8% 91.2%
Grades 7-8 2.8% 4.8% 10.7% 89.3%
Grades 9-12 0.9% 1.4% 7.8% 92.2%Whiteout,correction fld?
All 2.9% 4.8% 11.9% 88.1%Grades 7-8 6.1% 8.1% 12.3% 87.7%
Grades 9-12 1.2% 3.1% 11.6% 88.4%Computer dusting sprays?
All 3.2% 4.8% 11.0% 89.0%Grades 7-8 4.8% 6.0% 8.3% 91.7%
Grades 9-12 2.4% 4.2% 12.4% 87.6%Helium,butane,propane,whippets,freon?
All 2.8% 4.6% 9.3% 90.7%Grades 7-8 3.1% 4.5% 8.6% 91.4%
Grades 9-12 2.6% 4.6% 9.6% 90.4%Glue?
All 0.4% 0.6% 2.0% 98.0%Grades 7-8 1.2% 1.9% 3.1% 96.9%
Grades 9-12 0.0% 0.0% 1.4% 98.6%Toluene,paint thinner,other solvents?
All 1.0% 1.3% 2.8% 97.2%Grades 7-8 2.0% 2.0% 3.7% 96.3%
Grades 9-12 0.5% 0.9% 2.4% 97.6%Gasoline,octane booster,carburetor cleaner?
All 2.0% 3.0% 8.9% 91.1%Grades 7-8 3.1% 3.7% 7.5% 92.5%
Grades 9-12 1.4% 2.6% 9.6% 90.4%
Other aerosols/sprays?All 1.9% 2.5% 5.1% 94.9%
Grades 7-8 3.0% 5.1% 7.1% 92.9%Grades 9-12 1.3% 1.3% 4.0% 96.0%
Any inhalant?All 7.5% 13.2% 26.1% 73.9%
Grades 7-8 10.0% 15.7% 24.3% 75.7%Grades 9-12 6.1% 11.9% 27.0% 73.0%
Table I-2: How often do you normally use inhalants?
NeverUsed
EveryDay
SeveralTimes a
Week
SeveralTimes a
Month
AboutOnce aMonth
AboutOnce a
Year
Less thanOnce a
Year
All 88.2% 0.0% 1.5% 1.0% 2.3% 2.6% 4.4%Grades 7-8 87.5% 0.0% 3.1% 1.6% 1.8% 3.1% 2.9%
Grades 9-12 88.5% 0.0% 0.7% 0.8% 2.5% 2.3% 5.2%
©Copyright 2010, Texas A&M UniversityAll rights reserved.
Secondary Report-Page 27 of 99

8/7/2019 REEVES COUNTY - Pecos-Barstow-Toyah ISD _ 2010 Texas School Survey of Drug and Alcohol Use
http://slidepdf.com/reader/full/reeves-county-pecos-barstow-toyah-isd-2010-texas-school-survey-of-drug 28/99
Pecos-Barstow-ToyahSPRING 2010
I-3: Number of different kinds of inhalants used
None One Two to Three Four PlusAll 74.2% 10.6% 10.3% 4.9%
Grades 7-8 76.3% 10.0% 7.3% 6.5%Grades 9-12 73.2% 10.9% 11.8% 4.1%
©Copyright 2010, Texas A&M UniversityAll rights reserved.
Secondary Report-Page 28 of 99

8/7/2019 REEVES COUNTY - Pecos-Barstow-Toyah ISD _ 2010 Texas School Survey of Drug and Alcohol Use
http://slidepdf.com/reader/full/reeves-county-pecos-barstow-toyah-isd-2010-texas-school-survey-of-drug 29/99
Pecos-Barstow-ToyahSPRING 2010
Table I-4: Average age of first use of:
grade1 grade2Inhalants
11.5 13.5
Table I-5: Since school began in the fall, on how many days (if any) have youattended class while high from inhalant use?
None 1-3 Times 4-9 Times 10+ Times
All 97.0% 1.8% 0.8% 0.3%Grades 7-8 95.7% 2.7% 1.6% 0.0%
Grades 9-12 97.7% 1.4% 0.5% 0.5%
©Copyright 2010, Texas A&M UniversityAll rights reserved.
Secondary Report-Page 29 of 99

8/7/2019 REEVES COUNTY - Pecos-Barstow-Toyah ISD _ 2010 Texas School Survey of Drug and Alcohol Use
http://slidepdf.com/reader/full/reeves-county-pecos-barstow-toyah-isd-2010-texas-school-survey-of-drug 30/99
Pecos-Barstow-ToyahSPRING 2010
Table I-6: School year use of inhalants by absences and conduct problems:
Average days absent due toillness or other reasons
Inhalants Users: 5.5Inhalants Non-use 4.8
Average days conduct problemsreported
Inhalants Users: 2.6Inhalants Non-use 1.3
Table I-7: About how many of your close friends use inhalants?
None A Few Some Most ALL
All 72.0% 16.9% 8.4% 2.1% 0.6%Grades 7-8 74.2% 14.2% 8.0% 2.8% 0.9%
Grades 9-12 70.9% 18.3% 8.6% 1.7% 0.5%
Table I-8: How dangerous do you think it is for kids your age to use inhalants?
VeryDangerous
SomewhatDangerous
Not veryDangerous
Not at AllDangerous Do Not Know
All 69.7% 15.4% 4.8% 0.8% 9.3%Grades 7-8 66.1% 17.3% 7.8% 0.0% 8.8%
Grades 9-12 71.3% 14.5% 3.4% 1.1% 9.6%
©Copyright 2010, Texas A&M UniversityAll rights reserved.
Secondary Report-Page 30 of 99

8/7/2019 REEVES COUNTY - Pecos-Barstow-Toyah ISD _ 2010 Texas School Survey of Drug and Alcohol Use
http://slidepdf.com/reader/full/reeves-county-pecos-barstow-toyah-isd-2010-texas-school-survey-of-drug 31/99
Pecos-Barstow-ToyahSPRING 2010
Table I-9: If you wanted some, how difficult would it be to get..
NeverHeard Of Impossible
VeryDifficult
SomewhatDifficult
SomewhatEasy Very Easy
Inhalants?All 34.9% 16.6% 3.6% 3.9% 10.1% 30.9%
Grades 7-8 36.1% 23.5% 2.7% 5.0% 6.9% 25.8%
Grades 9-12 34.4% 13.4% 4.0% 3.3% 11.7% 33.2%
©Copyright 2010, Texas A&M UniversityAll rights reserved.
Secondary Report-Page 31 of 99

8/7/2019 REEVES COUNTY - Pecos-Barstow-Toyah ISD _ 2010 Texas School Survey of Drug and Alcohol Use
http://slidepdf.com/reader/full/reeves-county-pecos-barstow-toyah-isd-2010-texas-school-survey-of-drug 32/99
Pecos-Barstow-ToyahSPRING 2010
Table X-1: Since school began in the fall, have you gotten any informationon drugs or alcohol from the following sources?
CATEGORY YesA school health class All 55.0%
Grades 7-8 51.9%Grades 9-12 56.4%
An assembly program All 74.6%Grades 7-8 63.0%
Grades 9-12 79.7%Guidance counselor All 29.9%
Grades 7-8 25.9%Grades 9-12 31.6%
Science class All 30.1%Grades 7-8 30.0%
Grades 9-12 30.2%Social studies class All 14.4%
Grades 7-8 13.3%Grades 9-12 14.9%
Student group session All 17.8%Grades 7-8 9.9%
Grades 9-12 21.3%An invited school guest All 56.1%
Grades 7-8 44.4%Grades 9-12 61.4%
Another source at school All 34.3%Grades 7-8 26.0%
Grades 9-12 37.9%Any school source All 68.5%
Grades 7-8 55.1%Grades 9-12 75.5%
©Copyright 2010, Texas A&M UniversityAll rights reserved.
Secondary Report-Page 32 of 99

8/7/2019 REEVES COUNTY - Pecos-Barstow-Toyah ISD _ 2010 Texas School Survey of Drug and Alcohol Use
http://slidepdf.com/reader/full/reeves-county-pecos-barstow-toyah-isd-2010-texas-school-survey-of-drug 33/99
Pecos-Barstow-ToyahSPRING 2010
Table X-2: If you had a drug or alcohol problem and needed help, who would you go to?
CATEGORY YesCounselor/program in-school All 34.7%
Grades 7-8 40.9%Grades 9-12 31.8%
Another adult in school All 32.9%
Grades 7-8 37.5%Grades 9-12 30.8%
Counselor/program outside-school All 37.5%Grades 7-8 40.8%
Grades 9-12 36.0%Your parents All 60.4%
Grades 7-8 71.9%Grades 9-12 55.3%
A medical doctor All 37.7%Grades 7-8 47.7%
Grades 9-12 33.2%Your friends All 66.3%
Grades 7-8 67.5%Grades 9-12 65.7%
Another adult All 65.1%Grades 7-8 68.3%
Grades 9-12 63.6%
Table X-3: Since school began in the fall, have you sought help, other thanfrom family or friends, for problems in any way connected with your use of alcohol, marijuana, or other drugs?
CATEGORY YesSeek Help All 11.7%
Grades 7-8 13.6%Grades 9-12 10.9%
©Copyright 2010, Texas A&M UniversityAll rights reserved.
Secondary Report-Page 33 of 99

8/7/2019 REEVES COUNTY - Pecos-Barstow-Toyah ISD _ 2010 Texas School Survey of Drug and Alcohol Use
http://slidepdf.com/reader/full/reeves-county-pecos-barstow-toyah-isd-2010-texas-school-survey-of-drug 34/99

8/7/2019 REEVES COUNTY - Pecos-Barstow-Toyah ISD _ 2010 Texas School Survey of Drug and Alcohol Use
http://slidepdf.com/reader/full/reeves-county-pecos-barstow-toyah-isd-2010-texas-school-survey-of-drug 35/99
Pecos-Barstow-ToyahSPRING 2010
Table X-5: How safe do you feel when you are:
Very SafeSomewhat
SafeNot Very
SafeNot Safe at
AllDon'tKnow
In your home?All 82.0% 14.1% 1.2% 1.0% 1.7%
Grades 7-8 82.7% 11.9% 1.6% 2.2% 1.6%
Grades 9-12 81.6% 15.2% 1.0% 0.4% 1.8%Out in your neighborhood?
All 40.0% 47.3% 4.5% 3.6% 4.6%Grades 7-8 35.9% 49.2% 4.8% 5.6% 4.4%
Grades 9-12 42.1% 46.2% 4.4% 2.6% 4.7%At school?
All 39.5% 44.6% 6.5% 4.7% 4.8%Grades 7-8 36.4% 48.3% 5.7% 5.5% 4.2%
Grades 9-12 41.1% 42.6% 6.9% 4.3% 5.1%
©Copyright 2010, Texas A&M UniversityAll rights reserved.
Secondary Report-Page 35 of 99

8/7/2019 REEVES COUNTY - Pecos-Barstow-Toyah ISD _ 2010 Texas School Survey of Drug and Alcohol Use
http://slidepdf.com/reader/full/reeves-county-pecos-barstow-toyah-isd-2010-texas-school-survey-of-drug 36/99
Pecos-Barstow-ToyahSPRING 2010
©Copyright 2010, Texas A&M UniversityAll rights reserved.
Secondary Report-Page 36 of 99

8/7/2019 REEVES COUNTY - Pecos-Barstow-Toyah ISD _ 2010 Texas School Survey of Drug and Alcohol Use
http://slidepdf.com/reader/full/reeves-county-pecos-barstow-toyah-isd-2010-texas-school-survey-of-drug 37/99
Pecos-Barstow-ToyahSPRING 2010
2. Prevalence Tables
©Copyright 2010, Texas A&M UniversityAll rights reserved.
Secondary Report-Page 37 of 99

8/7/2019 REEVES COUNTY - Pecos-Barstow-Toyah ISD _ 2010 Texas School Survey of Drug and Alcohol Use
http://slidepdf.com/reader/full/reeves-county-pecos-barstow-toyah-isd-2010-texas-school-survey-of-drug 38/99
Pecos-Barstow-ToyahSPRING 2010
©Copyright 2010, Texas A&M UniversityAll rights reserved.
Secondary Report-Page 38 of 99

8/7/2019 REEVES COUNTY - Pecos-Barstow-Toyah ISD _ 2010 Texas School Survey of Drug and Alcohol Use
http://slidepdf.com/reader/full/reeves-county-pecos-barstow-toyah-isd-2010-texas-school-survey-of-drug 39/99
Pecos-Barstow-ToyahSPRING 2010
Table B1: Prevalence and recency of use of selected substances by gradeAll students
PastMonth
SchoolYear
EverUsed
NeverUsed
TobaccoAll 16.5% 22.7% 41.0% 59.0%
Grades 7-8 8.9% 11.8% 22.7% 77.3%Grades 9-12 20.2% 28.2% 50.1% 49.9%
AlcoholAll 34.2% 48.2% 72.9% 27.1%
Grades 7-8 24.3% 36.1% 57.1% 42.9%Grades 9-12 39.2% 54.3% 80.8% 19.2%
InhalantsAll 7.5% 13.2% 26.1% 73.9%
Grades 7-8 10.0% 15.7% 24.3% 75.7%Grades 9-12 6.1% 11.9% 27.0% 73.0%
Any Illicit DrugAll 12.9% 18.8% 31.3% 68.7%
Grades 7-8 9.4% 10.8% 14.0% 86.0%Grades 9-12 14.7% 22.8% 40.1% 59.9%
MarijuanaAll 9.5% 15.8% 29.0% 71.0%
Grades 7-8 8.1% 8.8% 12.1% 87.9%Grades 9-12 10.2% 19.3% 37.5% 62.5%
Marijuana OnlyAll 5.1% 8.2% 15.1% 84.9%
Grades 7-8 4.7% 4.7% 6.3% 93.7%Grades 9-12 5.3% 10.1% 19.8% 80.2%
Cocaine or Crack All 3.6% 5.2% 11.9% 88.1%
Grades 7-8 1.7% 1.7% 3.4% 96.6%
Grades 9-12 4.6% 7.0% 16.1% 83.9%Cocaine
All 3.6% 5.2% 11.9% 88.1%Grades 7-8 1.7% 1.7% 3.4% 96.6%
Grades 9-12 4.6% 7.0% 16.1% 83.9%Crack
All 0.2% 0.7% 2.5% 97.5%Grades 7-8 0.0% 0.0% 0.9% 99.1%
Grades 9-12 0.3% 1.0% 3.4% 96.6%Hallucinogens
All 1.3% 1.9% 4.1% 95.9%Grades 7-8 1.5% 1.5% 2.4% 97.6%
Grades 9-12 1.2% 2.0% 4.9% 95.1%Uppers
All 1.5% 1.8% 2.9% 97.1%Grades 7-8 0.9% 0.9% 1.7% 98.3%
Grades 9-12 1.8% 2.3% 3.4% 96.6%Downers
All 3.0% 3.9% 4.8% 95.2%Grades 7-8 0.9% 1.5% 1.5% 98.5%
Grades 9-12 4.0% 5.0% 6.4% 93.6%
©Copyright 2010, Texas A&M UniversityAll rights reserved.
Secondary Report-Page 39 of 99
8/7/2019 REEVES COUNTY - Pecos-Barstow-Toyah ISD _ 2010 Texas School Survey of Drug and Alcohol Use
http://slidepdf.com/reader/full/reeves-county-pecos-barstow-toyah-isd-2010-texas-school-survey-of-drug 40/99
Pecos-Barstow-ToyahSPRING 2010
©Copyright 2010, Texas A&M UniversityAll rights reserved.
Secondary Report-Page 40 of 99

8/7/2019 REEVES COUNTY - Pecos-Barstow-Toyah ISD _ 2010 Texas School Survey of Drug and Alcohol Use
http://slidepdf.com/reader/full/reeves-county-pecos-barstow-toyah-isd-2010-texas-school-survey-of-drug 41/99
Pecos-Barstow-ToyahSPRING 2010
Table B1: Prevalence and recency of use of selected substances by gradeAll students(Continued)
PastMonth
SchoolYear
EverUsed
NeverUsed
RohypnolAll 1.2% 1.2% 1.8% 98.2%
Grades 7-8 2.5% 2.5% 2.5% 97.5%Grades 9-12 0.5% 0.5% 1.5% 98.5%
SteroidsAll 0.7% 1.0% 2.3% 97.7%
Grades 7-8 0.0% 0.8% 1.5% 98.5%Grades 9-12 1.1% 1.1% 2.7% 97.3%
EcstasyAll 2.1% 2.6% 5.4% 94.6%
Grades 7-8 2.5% 3.4% 3.4% 96.6%Grades 9-12 1.9% 2.2% 6.4% 93.6%
HeroinAll 0.4% 0.4% 0.8% 99.2%
Grades 7-8 0.8% 0.8% 0.8% 99.2%Grades 9-12 0.2% 0.2% 0.8% 99.2%
©Copyright 2010, Texas A&M UniversityAll rights reserved.
Secondary Report-Page 41 of 99

8/7/2019 REEVES COUNTY - Pecos-Barstow-Toyah ISD _ 2010 Texas School Survey of Drug and Alcohol Use
http://slidepdf.com/reader/full/reeves-county-pecos-barstow-toyah-isd-2010-texas-school-survey-of-drug 42/99
Pecos-Barstow-ToyahSPRING 2010
Table B2: Prevalence and recency of use of selected substances by gradeMale students
PastMonth
SchoolYear
EverUsed
NeverUsed
TobaccoAll 20.6% 27.5% 48.6% 51.4%
Grades 7-8 8.4% 8.4% 22.8% 77.2%Grades 9-12 26.5% 36.7% 61.1% 38.9%
AlcoholAll 31.8% 46.2% 70.2% 29.8%
Grades 7-8 18.1% 27.5% 51.6% 48.4%Grades 9-12 38.3% 55.3% 79.2% 20.8%
InhalantsAll 5.9% 11.3% 23.6% 76.4%
Grades 7-8 4.8% 6.1% 12.7% 87.3%Grades 9-12 6.4% 14.0% 29.1% 70.9%
Any Illicit DrugAll 13.8% 20.7% 33.2% 66.8%
Grades 7-8 7.9% 7.9% 9.6% 90.4%Grades 9-12 16.8% 27.2% 45.1% 54.9%
MarijuanaAll 8.5% 16.1% 31.6% 68.4%
Grades 7-8 6.5% 6.5% 10.2% 89.8%Grades 9-12 9.4% 20.8% 42.0% 58.0%
Marijuana OnlyAll 5.5% 9.9% 15.9% 84.1%
Grades 7-8 6.0% 6.0% 7.8% 92.2%Grades 9-12 5.3% 11.9% 20.1% 79.9%
Cocaine or Crack All 3.5% 4.7% 12.6% 87.4%
Grades 7-8 0.0% 0.0% 0.0% 100.0%
Grades 9-12 5.2% 6.9% 18.7% 81.3%Cocaine
All 3.5% 4.7% 12.6% 87.4%Grades 7-8 0.0% 0.0% 0.0% 100.0%
Grades 9-12 5.2% 6.9% 18.7% 81.3%Crack
All 0.0% 0.3% 2.4% 97.6%Grades 7-8 0.0% 0.0% 0.0% 100.0%
Grades 9-12 0.0% 0.5% 3.5% 96.5%Hallucinogens
All 1.0% 1.8% 5.2% 94.8%Grades 7-8 0.0% 0.0% 0.0% 100.0%
Grades 9-12 1.5% 2.7% 7.6% 92.4%Uppers
All 1.1% 1.9% 3.8% 96.2%Grades 7-8 0.0% 0.0% 2.0% 98.0%
Grades 9-12 1.6% 2.8% 4.7% 95.3%Downers
All 3.5% 4.6% 6.7% 93.3%Grades 7-8 0.0% 0.0% 0.0% 100.0%
Grades 9-12 5.2% 6.9% 10.0% 90.0%
©Copyright 2010, Texas A&M UniversityAll rights reserved.
Secondary Report-Page 42 of 99

8/7/2019 REEVES COUNTY - Pecos-Barstow-Toyah ISD _ 2010 Texas School Survey of Drug and Alcohol Use
http://slidepdf.com/reader/full/reeves-county-pecos-barstow-toyah-isd-2010-texas-school-survey-of-drug 43/99
Pecos-Barstow-ToyahSPRING 2010
©Copyright 2010, Texas A&M UniversityAll rights reserved.
Secondary Report-Page 43 of 99

8/7/2019 REEVES COUNTY - Pecos-Barstow-Toyah ISD _ 2010 Texas School Survey of Drug and Alcohol Use
http://slidepdf.com/reader/full/reeves-county-pecos-barstow-toyah-isd-2010-texas-school-survey-of-drug 44/99
Pecos-Barstow-ToyahSPRING 2010
Table B2: Prevalence and recency of use of selected substances by gradeMale students(Continued)
PastMonth
SchoolYear
EverUsed
NeverUsed
RohypnolAll 0.6% 0.6% 1.6% 98.4%
Grades 7-8 1.9% 1.9% 1.9% 98.1%Grades 9-12 0.0% 0.0% 1.4% 98.6%
SteroidsAll 1.6% 2.2% 3.8% 96.2%
Grades 7-8 0.0% 1.9% 3.3% 96.7%Grades 9-12 2.3% 2.3% 4.0% 96.0%
EcstasyAll 2.1% 2.5% 6.7% 93.3%
Grades 7-8 0.0% 0.0% 0.0% 100.0%Grades 9-12 3.1% 3.7% 10.0% 90.0%
HeroinAll 0.0% 0.0% 0.5% 99.5%
Grades 7-8 0.0% 0.0% 0.0% 100.0%Grades 9-12 0.0% 0.0% 0.7% 99.3%
©Copyright 2010, Texas A&M UniversityAll rights reserved.
Secondary Report-Page 44 of 99

8/7/2019 REEVES COUNTY - Pecos-Barstow-Toyah ISD _ 2010 Texas School Survey of Drug and Alcohol Use
http://slidepdf.com/reader/full/reeves-county-pecos-barstow-toyah-isd-2010-texas-school-survey-of-drug 45/99
Pecos-Barstow-ToyahSPRING 2010
Table B3: Prevalence and recency of use of selected substances by gradeFemale students
PastMonth
SchoolYear
EverUsed
NeverUsed
TobaccoAll 12.6% 18.5% 34.2% 65.8%
Grades 7-8 8.1% 13.5% 21.6% 78.4%Grades 9-12 14.9% 21.0% 40.6% 59.4%
AlcoholAll 36.1% 49.8% 75.1% 24.9%
Grades 7-8 28.5% 42.6% 61.6% 38.4%Grades 9-12 40.0% 53.5% 82.1% 17.9%
InhalantsAll 9.0% 15.0% 28.2% 71.8%
Grades 7-8 14.8% 24.3% 33.5% 66.5%Grades 9-12 6.0% 10.1% 25.4% 74.6%
Any Illicit DrugAll 11.9% 16.8% 29.5% 70.5%
Grades 7-8 9.5% 12.2% 16.7% 83.3%Grades 9-12 13.1% 19.2% 36.1% 63.9%
MarijuanaAll 10.0% 15.2% 26.6% 73.4%
Grades 7-8 8.2% 9.3% 12.4% 87.6%Grades 9-12 11.0% 18.1% 33.9% 66.1%
Marijuana OnlyAll 4.8% 6.8% 14.7% 85.3%
Grades 7-8 3.7% 3.7% 5.2% 94.8%Grades 9-12 5.4% 8.5% 19.7% 80.3%
Cocaine or Crack All 3.7% 5.8% 11.4% 88.6%
Grades 7-8 3.1% 3.1% 6.2% 93.8%
Grades 9-12 4.0% 7.1% 14.0% 86.0%Cocaine
All 3.7% 5.8% 11.4% 88.6%Grades 7-8 3.1% 3.1% 6.2% 93.8%
Grades 9-12 4.1% 7.1% 14.1% 85.9%Crack
All 0.4% 1.0% 2.7% 97.3%Grades 7-8 0.0% 0.0% 1.6% 98.4%
Grades 9-12 0.6% 1.5% 3.3% 96.7%Hallucinogens
All 1.5% 1.9% 3.1% 96.9%Grades 7-8 2.8% 2.8% 4.3% 95.7%
Grades 9-12 0.9% 1.5% 2.5% 97.5%Uppers
All 1.8% 1.8% 2.1% 97.9%Grades 7-8 1.6% 1.6% 1.6% 98.4%
Grades 9-12 1.9% 1.9% 2.4% 97.6%Downers
All 2.5% 3.2% 3.2% 96.8%Grades 7-8 1.6% 2.8% 2.8% 97.2%
Grades 9-12 3.0% 3.4% 3.4% 96.6%
©Copyright 2010, Texas A&M UniversityAll rights reserved.
Secondary Report-Page 45 of 99

8/7/2019 REEVES COUNTY - Pecos-Barstow-Toyah ISD _ 2010 Texas School Survey of Drug and Alcohol Use
http://slidepdf.com/reader/full/reeves-county-pecos-barstow-toyah-isd-2010-texas-school-survey-of-drug 46/99

8/7/2019 REEVES COUNTY - Pecos-Barstow-Toyah ISD _ 2010 Texas School Survey of Drug and Alcohol Use
http://slidepdf.com/reader/full/reeves-county-pecos-barstow-toyah-isd-2010-texas-school-survey-of-drug 47/99
Pecos-Barstow-ToyahSPRING 2010
Table B3: Prevalence and recency of use of selected substances by gradeFemale students(Continued)
PastMonth
SchoolYear
EverUsed
NeverUsed
RohypnolAll 1.1% 1.1% 1.5% 98.5%
Grades 7-8 1.6% 1.6% 1.6% 98.4%Grades 9-12 0.9% 0.9% 1.5% 98.5%
SteroidsAll 0.0% 0.0% 1.0% 99.0%
Grades 7-8 0.0% 0.0% 0.0% 100.0%Grades 9-12 0.0% 0.0% 1.5% 98.5%
EcstasyAll 2.2% 2.7% 4.2% 95.8%
Grades 7-8 4.7% 6.2% 6.2% 93.8%Grades 9-12 0.9% 0.9% 3.2% 96.8%
HeroinAll 0.3% 0.3% 0.6% 99.4%
Grades 7-8 0.0% 0.0% 0.0% 100.0%Grades 9-12 0.5% 0.5% 0.9% 99.1%
©Copyright 2010, Texas A&M UniversityAll rights reserved.
Secondary Report-Page 47 of 99

8/7/2019 REEVES COUNTY - Pecos-Barstow-Toyah ISD _ 2010 Texas School Survey of Drug and Alcohol Use
http://slidepdf.com/reader/full/reeves-county-pecos-barstow-toyah-isd-2010-texas-school-survey-of-drug 48/99

8/7/2019 REEVES COUNTY - Pecos-Barstow-Toyah ISD _ 2010 Texas School Survey of Drug and Alcohol Use
http://slidepdf.com/reader/full/reeves-county-pecos-barstow-toyah-isd-2010-texas-school-survey-of-drug 49/99
Pecos-Barstow-ToyahSPRING 2010
©Copyright 2010, Texas A&M UniversityAll rights reserved.
Secondary Report-Page 49 of 99

8/7/2019 REEVES COUNTY - Pecos-Barstow-Toyah ISD _ 2010 Texas School Survey of Drug and Alcohol Use
http://slidepdf.com/reader/full/reeves-county-pecos-barstow-toyah-isd-2010-texas-school-survey-of-drug 50/99
Pecos-Barstow-ToyahSPRING 2010
Table B4: Prevalence and recency of use of selected substances by gradeWhite students(Continued)
PastMonth
SchoolYear
EverUsed
NeverUsed
RohypnolAll 0.0% 0.0% 2.8% 97.2%
Grades 7-8 0.0% 0.0% 0.0% 100.0%Grades 9-12 0.0% 0.0% 3.7% 96.3%
SteroidsAll 0.0% 0.0% 2.8% 97.2%
Grades 7-8 0.0% 0.0% 0.0% 100.0%Grades 9-12 0.0% 0.0% 3.6% 96.4%
EcstasyAll 0.0% 0.0% 2.7% 97.3%
Grades 7-8 0.0% 0.0% 0.0% 100.0%Grades 9-12 0.0% 0.0% 3.5% 96.5%
HeroinAll 0.0% 0.0% 0.0% 100.0%
Grades 7-8 0.0% 0.0% 0.0% 100.0%Grades 9-12 0.0% 0.0% 0.0% 100.0%
©Copyright 2010, Texas A&M UniversityAll rights reserved.
Secondary Report-Page 50 of 99

8/7/2019 REEVES COUNTY - Pecos-Barstow-Toyah ISD _ 2010 Texas School Survey of Drug and Alcohol Use
http://slidepdf.com/reader/full/reeves-county-pecos-barstow-toyah-isd-2010-texas-school-survey-of-drug 51/99
Pecos-Barstow-ToyahSPRING 2010
Table B5: Prevalence and recency of use of selected substances by gradeBlack students
PastMonth
SchoolYear
EverUsed
NeverUsed
TobaccoAll * * * *
Grades 7-8 * * * *Grades 9-12 * * * *
AlcoholAll 39.4% 39.4% 55.4% 44.6%
Grades 7-8 * * * *Grades 9-12 * * * *
InhalantsAll 0.0% 8.5% 23.3% 76.7%
Grades 7-8 * * * *Grades 9-12 * * * *
Any Illicit DrugAll 15.0% 40.6% 40.6% 59.4%
Grades 7-8 0.0% 0.0% 0.0% 100.0%Grades 9-12 * * * *
MarijuanaAll 7.5% 33.1% 33.1% 66.9%
Grades 7-8 0.0% 0.0% 0.0% 100.0%Grades 9-12 * * * *
Marijuana OnlyAll 0.0% 17.1% 17.1% 82.9%
Grades 7-8 0.0% 0.0% 0.0% 100.0%Grades 9-12 * * * *
Cocaine or Crack All 15.0% 15.0% 23.6% 76.4%
Grades 7-8 0.0% 0.0% 0.0% 100.0%
Grades 9-12 * * * *Cocaine
All 15.0% 15.0% 23.6% 76.4%Grades 7-8 0.0% 0.0% 0.0% 100.0%
Grades 9-12 * * * *Crack
All 0.0% 0.0% 0.0% 100.0%Grades 7-8 0.0% 0.0% 0.0% 100.0%
Grades 9-12 0.0% 0.0% 0.0% 100.0%Hallucinogens
All 0.0% 0.0% 0.0% 100.0%Grades 7-8 0.0% 0.0% 0.0% 100.0%
Grades 9-12 0.0% 0.0% 0.0% 100.0%Uppers
All 0.0% 0.0% 0.0% 100.0%Grades 7-8 0.0% 0.0% 0.0% 100.0%
Grades 9-12 0.0% 0.0% 0.0% 100.0%Downers
All 0.0% 0.0% 0.0% 100.0%Grades 7-8 0.0% 0.0% 0.0% 100.0%
Grades 9-12 0.0% 0.0% 0.0% 100.0%
©Copyright 2010, Texas A&M UniversityAll rights reserved.
Secondary Report-Page 51 of 99

8/7/2019 REEVES COUNTY - Pecos-Barstow-Toyah ISD _ 2010 Texas School Survey of Drug and Alcohol Use
http://slidepdf.com/reader/full/reeves-county-pecos-barstow-toyah-isd-2010-texas-school-survey-of-drug 52/99
Pecos-Barstow-ToyahSPRING 2010
©Copyright 2010, Texas A&M UniversityAll rights reserved.
Secondary Report-Page 52 of 99

8/7/2019 REEVES COUNTY - Pecos-Barstow-Toyah ISD _ 2010 Texas School Survey of Drug and Alcohol Use
http://slidepdf.com/reader/full/reeves-county-pecos-barstow-toyah-isd-2010-texas-school-survey-of-drug 53/99
Pecos-Barstow-ToyahSPRING 2010
Table B5: Prevalence and recency of use of selected substances by gradeBlack students(Continued)
PastMonth
SchoolYear
EverUsed
NeverUsed
RohypnolAll 0.0% 0.0% 0.0% 100.0%
Grades 7-8 0.0% 0.0% 0.0% 100.0%Grades 9-12 0.0% 0.0% 0.0% 100.0%
SteroidsAll 0.0% 14.8% 14.8% 85.2%
Grades 7-8 * * * *Grades 9-12 0.0% 0.0% 0.0% 100.0%
EcstasyAll 0.0% 8.5% 8.5% 91.5%
Grades 7-8 0.0% 0.0% 0.0% 100.0%Grades 9-12 * * * *
HeroinAll 0.0% 0.0% 0.0% 100.0%
Grades 7-8 0.0% 0.0% 0.0% 100.0%Grades 9-12 0.0% 0.0% 0.0% 100.0%
©Copyright 2010, Texas A&M UniversityAll rights reserved.
Secondary Report-Page 53 of 99

8/7/2019 REEVES COUNTY - Pecos-Barstow-Toyah ISD _ 2010 Texas School Survey of Drug and Alcohol Use
http://slidepdf.com/reader/full/reeves-county-pecos-barstow-toyah-isd-2010-texas-school-survey-of-drug 54/99
Pecos-Barstow-ToyahSPRING 2010
Table B6: Prevalence and recency of use of selected substances by gradeMexican/American students
PastMonth
SchoolYear
EverUsed
NeverUsed
TobaccoAll 16.9% 23.2% 43.1% 56.9%
Grades 7-8 8.4% 12.3% 24.5% 75.5%Grades 9-12 20.7% 28.3% 51.5% 48.5%
AlcoholAll 35.9% 50.5% 74.7% 25.3%
Grades 7-8 24.0% 37.9% 57.8% 42.2%Grades 9-12 41.4% 56.3% 82.5% 17.5%
InhalantsAll 7.8% 13.2% 26.6% 73.4%
Grades 7-8 10.1% 16.4% 24.7% 75.3%Grades 9-12 6.7% 11.6% 27.5% 72.5%
Any Illicit DrugAll 13.8% 19.9% 33.8% 66.2%
Grades 7-8 9.3% 11.1% 15.4% 84.6%Grades 9-12 15.8% 24.0% 42.4% 57.6%
MarijuanaAll 10.3% 17.0% 31.6% 68.4%
Grades 7-8 7.5% 8.4% 12.8% 87.2%Grades 9-12 11.5% 20.8% 40.1% 59.9%
Marijuana OnlyAll 6.0% 9.3% 16.8% 83.2%
Grades 7-8 5.1% 5.1% 7.2% 92.8%Grades 9-12 6.4% 11.2% 21.5% 78.5%
Cocaine or Crack All 3.2% 4.9% 12.6% 87.4%
Grades 7-8 0.0% 0.0% 2.3% 97.7%
Grades 9-12 4.6% 7.1% 17.2% 82.8%Cocaine
All 3.2% 4.9% 12.6% 87.4%Grades 7-8 0.0% 0.0% 2.3% 97.7%
Grades 9-12 4.7% 7.2% 17.3% 82.7%Crack
All 0.3% 0.8% 2.8% 97.2%Grades 7-8 0.0% 0.0% 0.0% 100.0%
Grades 9-12 0.4% 1.2% 4.0% 96.0%Hallucinogens
All 1.0% 1.5% 3.6% 96.4%Grades 7-8 0.9% 0.9% 2.0% 98.0%
Grades 9-12 1.1% 1.7% 4.4% 95.6%Uppers
All 1.2% 1.6% 2.9% 97.1%Grades 7-8 0.0% 0.0% 1.2% 98.8%
Grades 9-12 1.7% 2.4% 3.7% 96.3%Downers
All 3.0% 4.1% 5.1% 94.9%Grades 7-8 0.0% 0.9% 0.9% 99.1%
Grades 9-12 4.4% 5.6% 7.0% 93.0%
©Copyright 2010, Texas A&M UniversityAll rights reserved.
Secondary Report-Page 54 of 99

8/7/2019 REEVES COUNTY - Pecos-Barstow-Toyah ISD _ 2010 Texas School Survey of Drug and Alcohol Use
http://slidepdf.com/reader/full/reeves-county-pecos-barstow-toyah-isd-2010-texas-school-survey-of-drug 55/99
Pecos-Barstow-ToyahSPRING 2010
©Copyright 2010, Texas A&M UniversityAll rights reserved.
Secondary Report-Page 55 of 99

8/7/2019 REEVES COUNTY - Pecos-Barstow-Toyah ISD _ 2010 Texas School Survey of Drug and Alcohol Use
http://slidepdf.com/reader/full/reeves-county-pecos-barstow-toyah-isd-2010-texas-school-survey-of-drug 56/99
Pecos-Barstow-ToyahSPRING 2010
Table B6: Prevalence and recency of use of selected substances by gradeMexican/American students(Continued)
PastMonth
SchoolYear
EverUsed
NeverUsed
RohypnolAll 1.1% 1.1% 1.6% 98.4%
Grades 7-8 2.3% 2.3% 2.3% 97.7%Grades 9-12 0.6% 0.6% 1.3% 98.7%
SteroidsAll 0.7% 0.7% 2.0% 98.0%
Grades 7-8 0.0% 0.0% 0.8% 99.2%Grades 9-12 1.0% 1.0% 2.5% 97.5%
EcstasyAll 1.7% 2.1% 5.3% 94.7%
Grades 7-8 1.1% 2.3% 2.3% 97.7%Grades 9-12 2.0% 2.0% 6.6% 93.4%
HeroinAll 0.5% 0.5% 1.0% 99.0%
Grades 7-8 1.1% 1.1% 1.1% 98.9%Grades 9-12 0.3% 0.3% 1.0% 99.0%
©Copyright 2010, Texas A&M UniversityAll rights reserved.
Secondary Report-Page 56 of 99

8/7/2019 REEVES COUNTY - Pecos-Barstow-Toyah ISD _ 2010 Texas School Survey of Drug and Alcohol Use
http://slidepdf.com/reader/full/reeves-county-pecos-barstow-toyah-isd-2010-texas-school-survey-of-drug 57/99
Pecos-Barstow-ToyahSPRING 2010
Table B7: Prevalence and recency of use of selected substances by gradeStudents reporting A grades
PastMonth
SchoolYear
EverUsed
NeverUsed
TobaccoAll 8.5% 12.9% 25.9% 74.1%
Grades 7-8 2.9% 2.9% 5.8% 94.2%Grades 9-12 12.2% 19.6% 39.3% 60.7%
AlcoholAll 21.2% 35.3% 62.7% 37.3%
Grades 7-8 18.3% 24.1% 50.0% 50.0%Grades 9-12 23.1% 42.7% 71.1% 28.9%
InhalantsAll 5.2% 8.7% 17.9% 82.1%
Grades 7-8 6.7% 6.7% 12.5% 87.5%Grades 9-12 4.2% 9.9% 21.5% 78.5%
Any Illicit DrugAll 4.8% 6.5% 13.0% 87.0%
Grades 7-8 0.0% 0.0% 0.0% 100.0%Grades 9-12 8.0% 10.8% 21.7% 78.3%
MarijuanaAll 0.8% 2.5% 9.9% 90.1%
Grades 7-8 0.0% 0.0% 0.0% 100.0%Grades 9-12 1.3% 4.1% 16.5% 83.5%
Marijuana OnlyAll 0.0% 1.7% 5.8% 94.2%
Grades 7-8 0.0% 0.0% 0.0% 100.0%Grades 9-12 0.0% 2.8% 9.7% 90.3%
Cocaine or Crack All 1.7% 1.7% 4.1% 95.9%
Grades 7-8 0.0% 0.0% 0.0% 100.0%
Grades 9-12 2.8% 2.8% 6.8% 93.2%Cocaine
All 1.7% 1.7% 4.2% 95.8%Grades 7-8 0.0% 0.0% 0.0% 100.0%
Grades 9-12 2.8% 2.8% 6.9% 93.1%Crack
All 0.0% 0.8% 0.8% 99.2%Grades 7-8 0.0% 0.0% 0.0% 100.0%
Grades 9-12 0.0% 1.3% 1.3% 98.7%Hallucinogens
All 0.9% 2.1% 2.1% 97.9%Grades 7-8 0.0% 0.0% 0.0% 100.0%
Grades 9-12 1.5% 3.5% 3.5% 96.5%Uppers
All 1.2% 1.2% 1.2% 98.8%Grades 7-8 0.0% 0.0% 0.0% 100.0%
Grades 9-12 2.0% 2.0% 2.0% 98.0%Downers
All 3.2% 3.2% 4.0% 96.0%Grades 7-8 0.0% 0.0% 0.0% 100.0%
Grades 9-12 5.3% 5.3% 6.7% 93.3%
©Copyright 2010, Texas A&M UniversityAll rights reserved.
Secondary Report-Page 57 of 99

8/7/2019 REEVES COUNTY - Pecos-Barstow-Toyah ISD _ 2010 Texas School Survey of Drug and Alcohol Use
http://slidepdf.com/reader/full/reeves-county-pecos-barstow-toyah-isd-2010-texas-school-survey-of-drug 58/99
Pecos-Barstow-ToyahSPRING 2010
©Copyright 2010, Texas A&M UniversityAll rights reserved.
Secondary Report-Page 58 of 99
8/7/2019 REEVES COUNTY - Pecos-Barstow-Toyah ISD _ 2010 Texas School Survey of Drug and Alcohol Use
http://slidepdf.com/reader/full/reeves-county-pecos-barstow-toyah-isd-2010-texas-school-survey-of-drug 59/99
Pecos-Barstow-ToyahSPRING 2010
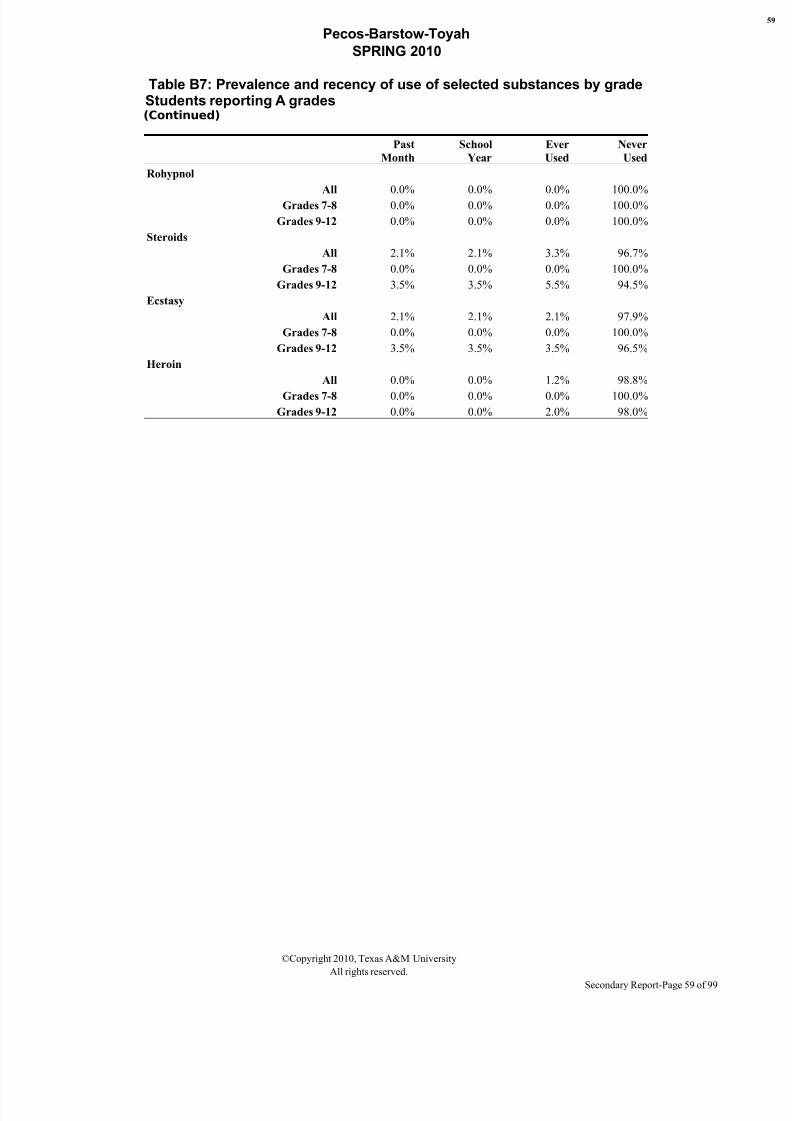
Table B7: Prevalence and recency of use of selected substances by gradeStudents reporting A grades(Continued)
PastMonth
SchoolYear
EverUsed
NeverUsed
RohypnolAll 0.0% 0.0% 0.0% 100.0%
Grades 7-8 0.0% 0.0% 0.0% 100.0%Grades 9-12 0.0% 0.0% 0.0% 100.0%
SteroidsAll 2.1% 2.1% 3.3% 96.7%
Grades 7-8 0.0% 0.0% 0.0% 100.0%Grades 9-12 3.5% 3.5% 5.5% 94.5%
EcstasyAll 2.1% 2.1% 2.1% 97.9%
Grades 7-8 0.0% 0.0% 0.0% 100.0%Grades 9-12 3.5% 3.5% 3.5% 96.5%
HeroinAll 0.0% 0.0% 1.2% 98.8%
Grades 7-8 0.0% 0.0% 0.0% 100.0%Grades 9-12 0.0% 0.0% 2.0% 98.0%
©Copyright 2010, Texas A&M UniversityAll rights reserved.
Secondary Report-Page 59 of 99

8/7/2019 REEVES COUNTY - Pecos-Barstow-Toyah ISD _ 2010 Texas School Survey of Drug and Alcohol Use
http://slidepdf.com/reader/full/reeves-county-pecos-barstow-toyah-isd-2010-texas-school-survey-of-drug 60/99
Pecos-Barstow-ToyahSPRING 2010
Table B8: Prevalence and recency of use of selected substances by gradeStudents reporting grades lower than A
PastMonth
SchoolYear
EverUsed
NeverUsed
TobaccoAll 18.3% 25.0% 44.5% 55.5%
Grades 7-8 10.8% 14.6% 27.8% 72.2%Grades 9-12 21.7% 29.9% 52.2% 47.8%
AlcoholAll 36.7% 50.8% 75.2% 24.8%
Grades 7-8 25.7% 39.3% 59.4% 40.6%Grades 9-12 41.9% 56.2% 82.6% 17.4%
InhalantsAll 8.1% 14.3% 28.2% 71.8%
Grades 7-8 11.1% 18.3% 27.9% 72.1%Grades 9-12 6.6% 12.4% 28.4% 71.6%
Any Illicit DrugAll 14.7% 21.5% 35.3% 64.7%
Grades 7-8 12.3% 14.1% 18.3% 81.7%Grades 9-12 15.8% 25.0% 43.5% 56.5%
MarijuanaAll 11.6% 18.9% 33.5% 66.5%
Grades 7-8 10.6% 11.4% 15.8% 84.2%Grades 9-12 12.1% 22.5% 41.7% 58.3%
Marijuana OnlyAll 6.3% 9.8% 17.2% 82.8%
Grades 7-8 6.1% 6.1% 8.1% 91.9%Grades 9-12 6.4% 11.6% 21.7% 78.3%
Cocaine or Crack All 4.1% 6.0% 13.7% 86.3%
Grades 7-8 2.2% 2.2% 4.3% 95.7%
Grades 9-12 4.9% 7.8% 18.0% 82.0%Cocaine
All 4.1% 6.0% 13.7% 86.3%Grades 7-8 2.2% 2.2% 4.3% 95.7%
Grades 9-12 4.9% 7.8% 18.0% 82.0%Crack
All 0.3% 0.6% 2.9% 97.1%Grades 7-8 0.0% 0.0% 1.1% 98.9%
Grades 9-12 0.4% 0.9% 3.8% 96.2%Hallucinogens
All 1.4% 1.8% 4.5% 95.5%Grades 7-8 2.0% 2.0% 3.1% 96.9%
Grades 9-12 1.1% 1.8% 5.2% 94.8%Uppers
All 1.6% 2.0% 3.3% 96.7%Grades 7-8 1.1% 1.1% 2.3% 97.7%
Grades 9-12 1.7% 2.4% 3.7% 96.3%Downers
All 2.7% 3.8% 4.8% 95.2%Grades 7-8 1.1% 2.0% 2.0% 98.0%
Grades 9-12 3.4% 4.6% 6.1% 93.9%
©Copyright 2010, Texas A&M UniversityAll rights reserved.
Secondary Report-Page 60 of 99

8/7/2019 REEVES COUNTY - Pecos-Barstow-Toyah ISD _ 2010 Texas School Survey of Drug and Alcohol Use
http://slidepdf.com/reader/full/reeves-county-pecos-barstow-toyah-isd-2010-texas-school-survey-of-drug 61/99
Pecos-Barstow-ToyahSPRING 2010
©Copyright 2010, Texas A&M UniversityAll rights reserved.
Secondary Report-Page 61 of 99

8/7/2019 REEVES COUNTY - Pecos-Barstow-Toyah ISD _ 2010 Texas School Survey of Drug and Alcohol Use
http://slidepdf.com/reader/full/reeves-county-pecos-barstow-toyah-isd-2010-texas-school-survey-of-drug 62/99
Pecos-Barstow-ToyahSPRING 2010
Table B8: Prevalence and recency of use of selected substances by gradeStudents reporting grades lower than A
(Continued)
PastMonth
SchoolYear
EverUsed
NeverUsed
RohypnolAll 1.4% 1.4% 2.2% 97.8%
Grades 7-8 3.3% 3.3% 3.3% 96.7%Grades 9-12 0.6% 0.6% 1.8% 98.2%
SteroidsAll 0.4% 0.8% 2.1% 97.9%
Grades 7-8 0.0% 1.1% 1.9% 98.1%Grades 9-12 0.6% 0.6% 2.1% 97.9%
EcstasyAll 2.1% 2.7% 6.1% 93.9%
Grades 7-8 3.3% 4.3% 4.3% 95.7%Grades 9-12 1.6% 1.9% 7.0% 93.0%
HeroinAll 0.5% 0.5% 0.7% 99.3%
Grades 7-8 1.1% 1.1% 1.1% 98.9%Grades 9-12 0.3% 0.3% 0.6% 99.4%
©Copyright 2010, Texas A&M UniversityAll rights reserved.
Secondary Report-Page 62 of 99

8/7/2019 REEVES COUNTY - Pecos-Barstow-Toyah ISD _ 2010 Texas School Survey of Drug and Alcohol Use
http://slidepdf.com/reader/full/reeves-county-pecos-barstow-toyah-isd-2010-texas-school-survey-of-drug 63/99
Pecos-Barstow-ToyahSPRING 2010
Table B9: Prevalence and recency of use of selected substances by gradeStudents living with two parents
PastMonth
SchoolYear
EverUsed
NeverUsed
TobaccoAll 15.0% 20.2% 37.1% 62.9%
Grades 7-8 6.3% 8.7% 16.0% 84.0%Grades 9-12 19.2% 25.7% 47.4% 52.6%
AlcoholAll 27.3% 43.4% 68.4% 31.6%
Grades 7-8 15.7% 27.2% 46.7% 53.3%Grades 9-12 33.1% 51.4% 79.1% 20.9%
InhalantsAll 7.1% 12.4% 21.4% 78.6%
Grades 7-8 6.0% 9.7% 13.0% 87.0%Grades 9-12 7.7% 13.8% 25.6% 74.4%
Any Illicit DrugAll 10.3% 15.2% 27.9% 72.1%
Grades 7-8 3.7% 6.1% 10.1% 89.9%Grades 9-12 13.7% 19.8% 36.9% 63.1%
MarijuanaAll 7.5% 12.5% 25.4% 74.6%
Grades 7-8 2.5% 3.6% 6.4% 93.6%Grades 9-12 9.9% 16.9% 34.7% 65.3%
Marijuana OnlyAll 3.9% 6.8% 14.7% 85.3%
Grades 7-8 2.3% 2.3% 4.9% 95.1%Grades 9-12 4.8% 9.2% 19.9% 80.1%
Cocaine or Crack All 2.8% 3.7% 9.9% 90.1%
Grades 7-8 0.0% 0.0% 1.4% 98.6%
Grades 9-12 4.1% 5.4% 14.0% 86.0%Cocaine
All 2.8% 3.7% 9.9% 90.1%Grades 7-8 0.0% 0.0% 1.4% 98.6%
Grades 9-12 4.1% 5.4% 14.0% 86.0%Crack
All 0.4% 0.8% 1.9% 98.1%Grades 7-8 0.0% 0.0% 0.0% 100.0%
Grades 9-12 0.5% 1.2% 2.9% 97.1%Hallucinogens
All 0.8% 0.8% 2.9% 97.1%Grades 7-8 0.0% 0.0% 1.4% 98.6%
Grades 9-12 1.2% 1.2% 3.6% 96.4%Uppers
All 1.0% 1.6% 2.0% 98.0%Grades 7-8 0.0% 0.0% 0.0% 100.0%
Grades 9-12 1.5% 2.4% 2.9% 97.1%Downers
All 1.9% 2.8% 3.4% 96.6%Grades 7-8 0.0% 1.1% 1.1% 98.9%
Grades 9-12 2.8% 3.7% 4.6% 95.4%
©Copyright 2010, Texas A&M UniversityAll rights reserved.
Secondary Report-Page 63 of 99

8/7/2019 REEVES COUNTY - Pecos-Barstow-Toyah ISD _ 2010 Texas School Survey of Drug and Alcohol Use
http://slidepdf.com/reader/full/reeves-county-pecos-barstow-toyah-isd-2010-texas-school-survey-of-drug 64/99
Pecos-Barstow-ToyahSPRING 2010
©Copyright 2010, Texas A&M UniversityAll rights reserved.
Secondary Report-Page 64 of 99

8/7/2019 REEVES COUNTY - Pecos-Barstow-Toyah ISD _ 2010 Texas School Survey of Drug and Alcohol Use
http://slidepdf.com/reader/full/reeves-county-pecos-barstow-toyah-isd-2010-texas-school-survey-of-drug 65/99
8/7/2019 REEVES COUNTY - Pecos-Barstow-Toyah ISD _ 2010 Texas School Survey of Drug and Alcohol Use
http://slidepdf.com/reader/full/reeves-county-pecos-barstow-toyah-isd-2010-texas-school-survey-of-drug 66/99
Pecos-Barstow-ToyahSPRING 2010
Table B10: Prevalence and recency of use of selected substances by gradeStudents not living with two parents
PastMonth
SchoolYear
EverUsed
NeverUsed
TobaccoAll 19.4% 27.7% 48.3% 51.7%
Grades 7-8 13.6% 17.4% 34.2% 65.8%Grades 9-12 22.4% 33.0% 55.6% 44.4%
AlcoholAll 45.9% 57.0% 80.5% 19.5%
Grades 7-8 37.2% 50.0% 74.5% 25.5%Grades 9-12 50.4% 60.6% 83.7% 16.3%
InhalantsAll 8.3% 14.9% 34.3% 65.7%
Grades 7-8 17.0% 26.1% 43.6% 56.4%Grades 9-12 3.8% 9.2% 29.5% 70.5%
Any Illicit DrugAll 17.5% 25.1% 37.8% 62.2%
Grades 7-8 18.7% 18.7% 20.8% 79.2%Grades 9-12 16.9% 28.5% 46.6% 53.4%
MarijuanaAll 13.0% 21.4% 35.5% 64.5%
Grades 7-8 17.0% 17.0% 21.3% 78.7%Grades 9-12 10.9% 23.6% 43.0% 57.0%
Marijuana OnlyAll 7.2% 10.7% 16.4% 83.6%
Grades 7-8 8.9% 8.9% 8.9% 91.1%Grades 9-12 6.3% 11.7% 20.3% 79.7%
Cocaine or Crack All 5.0% 7.8% 15.4% 84.6%
Grades 7-8 4.3% 4.3% 6.5% 93.5%
Grades 9-12 5.3% 9.6% 19.9% 80.1%Cocaine
All 5.0% 7.9% 15.4% 84.6%Grades 7-8 4.3% 4.3% 6.5% 93.5%
Grades 9-12 5.4% 9.7% 20.0% 80.0%Crack
All 0.0% 0.4% 3.6% 96.4%Grades 7-8 0.0% 0.0% 2.2% 97.8%
Grades 9-12 0.0% 0.6% 4.3% 95.7%Hallucinogens
All 2.1% 3.6% 6.0% 94.0%Grades 7-8 4.0% 4.0% 4.0% 96.0%
Grades 9-12 1.2% 3.5% 7.0% 93.0%Uppers
All 2.3% 2.3% 4.5% 95.5%Grades 7-8 2.3% 2.3% 4.6% 95.4%
Grades 9-12 2.3% 2.3% 4.4% 95.6%Downers
All 4.8% 5.7% 7.2% 92.8%Grades 7-8 2.3% 2.3% 2.3% 97.7%
Grades 9-12 6.1% 7.3% 9.6% 90.4%
©Copyright 2010, Texas A&M UniversityAll rights reserved.
Secondary Report-Page 66 of 99

8/7/2019 REEVES COUNTY - Pecos-Barstow-Toyah ISD _ 2010 Texas School Survey of Drug and Alcohol Use
http://slidepdf.com/reader/full/reeves-county-pecos-barstow-toyah-isd-2010-texas-school-survey-of-drug 67/99
Pecos-Barstow-ToyahSPRING 2010
©Copyright 2010, Texas A&M UniversityAll rights reserved.
Secondary Report-Page 67 of 99

8/7/2019 REEVES COUNTY - Pecos-Barstow-Toyah ISD _ 2010 Texas School Survey of Drug and Alcohol Use
http://slidepdf.com/reader/full/reeves-county-pecos-barstow-toyah-isd-2010-texas-school-survey-of-drug 68/99
Pecos-Barstow-ToyahSPRING 2010
Table B10: Prevalence and recency of use of selected substances by gradeStudents not living with two parents
(Continued)
PastMonth
SchoolYear
EverUsed
NeverUsed
RohypnolAll 2.2% 2.2% 2.6% 97.4%
Grades 7-8 6.7% 6.7% 6.7% 93.3%Grades 9-12 0.0% 0.0% 0.6% 99.4%
SteroidsAll 1.0% 1.0% 2.0% 98.0%
Grades 7-8 0.0% 0.0% 0.0% 100.0%Grades 9-12 1.5% 1.5% 3.0% 97.0%
EcstasyAll 3.2% 3.2% 6.0% 94.0%
Grades 7-8 4.3% 4.3% 4.3% 95.7%Grades 9-12 2.7% 2.7% 6.8% 93.2%
HeroinAll 0.7% 0.7% 1.7% 98.3%
Grades 7-8 2.2% 2.2% 2.2% 97.8%Grades 9-12 0.0% 0.0% 1.5% 98.5%
©Copyright 2010, Texas A&M UniversityAll rights reserved.
Secondary Report-Page 68 of 99
8/7/2019 REEVES COUNTY - Pecos-Barstow-Toyah ISD _ 2010 Texas School Survey of Drug and Alcohol Use
http://slidepdf.com/reader/full/reeves-county-pecos-barstow-toyah-isd-2010-texas-school-survey-of-drug 69/99
Pecos-Barstow-ToyahSPRING 2010
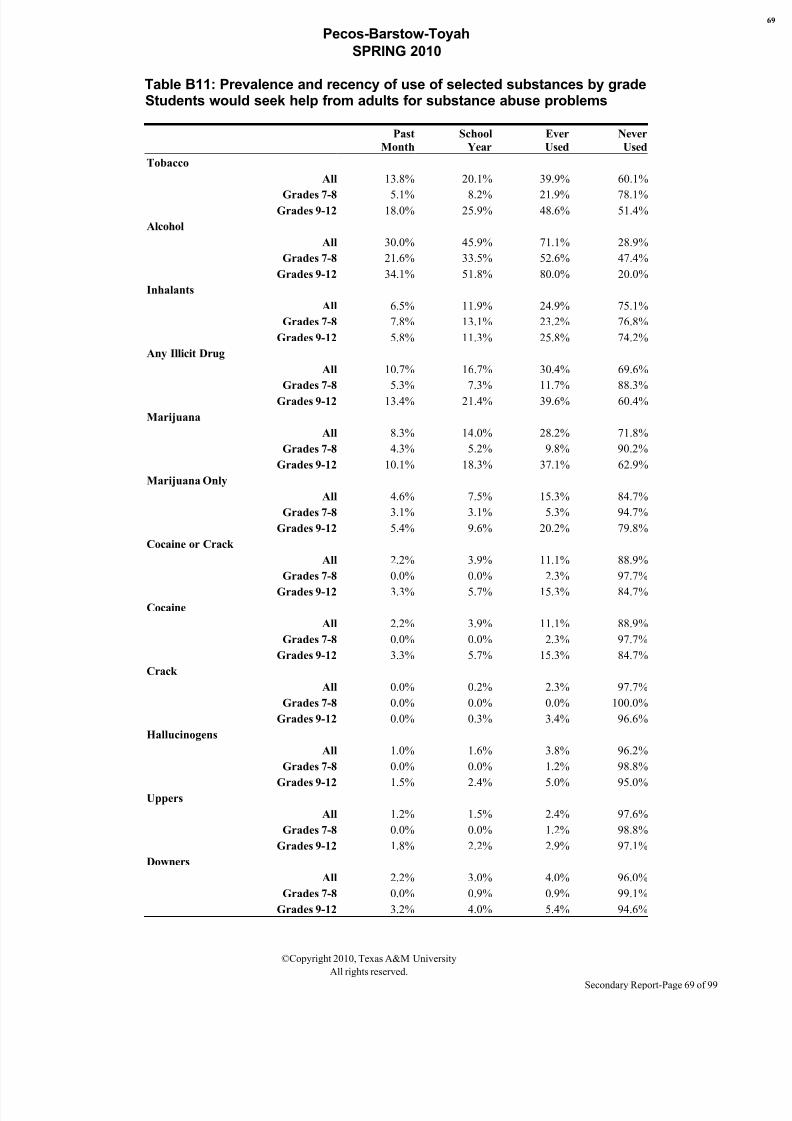
Table B11: Prevalence and recency of use of selected substances by gradeStudents would seek help from adults for substance abuse problems
PastMonth
SchoolYear
EverUsed
NeverUsed
TobaccoAll 13.8% 20.1% 39.9% 60.1%
Grades 7-8 5.1% 8.2% 21.9% 78.1%Grades 9-12 18.0% 25.9% 48.6% 51.4%
AlcoholAll 30.0% 45.9% 71.1% 28.9%
Grades 7-8 21.6% 33.5% 52.6% 47.4%Grades 9-12 34.1% 51.8% 80.0% 20.0%
InhalantsAll 6.5% 11.9% 24.9% 75.1%
Grades 7-8 7.8% 13.1% 23.2% 76.8%Grades 9-12 5.8% 11.3% 25.8% 74.2%
Any Illicit DrugAll 10.7% 16.7% 30.4% 69.6%
Grades 7-8 5.3% 7.3% 11.7% 88.3%Grades 9-12 13.4% 21.4% 39.6% 60.4%
MarijuanaAll 8.3% 14.0% 28.2% 71.8%
Grades 7-8 4.3% 5.2% 9.8% 90.2%Grades 9-12 10.1% 18.3% 37.1% 62.9%
Marijuana OnlyAll 4.6% 7.5% 15.3% 84.7%
Grades 7-8 3.1% 3.1% 5.3% 94.7%Grades 9-12 5.4% 9.6% 20.2% 79.8%
Cocaine or Crack All 2.2% 3.9% 11.1% 88.9%
Grades 7-8 0.0% 0.0% 2.3% 97.7%
Grades 9-12 3.3% 5.7% 15.3% 84.7%Cocaine
All 2.2% 3.9% 11.1% 88.9%Grades 7-8 0.0% 0.0% 2.3% 97.7%
Grades 9-12 3.3% 5.7% 15.3% 84.7%Crack
All 0.0% 0.2% 2.3% 97.7%Grades 7-8 0.0% 0.0% 0.0% 100.0%
Grades 9-12 0.0% 0.3% 3.4% 96.6%Hallucinogens
All 1.0% 1.6% 3.8% 96.2%Grades 7-8 0.0% 0.0% 1.2% 98.8%
Grades 9-12 1.5% 2.4% 5.0% 95.0%Uppers
All 1.2% 1.5% 2.4% 97.6%Grades 7-8 0.0% 0.0% 1.2% 98.8%
Grades 9-12 1.8% 2.2% 2.9% 97.1%Downers
All 2.2% 3.0% 4.0% 96.0%Grades 7-8 0.0% 0.9% 0.9% 99.1%
Grades 9-12 3.2% 4.0% 5.4% 94.6%
©Copyright 2010, Texas A&M UniversityAll rights reserved.
Secondary Report-Page 69 of 99

8/7/2019 REEVES COUNTY - Pecos-Barstow-Toyah ISD _ 2010 Texas School Survey of Drug and Alcohol Use
http://slidepdf.com/reader/full/reeves-county-pecos-barstow-toyah-isd-2010-texas-school-survey-of-drug 70/99
Pecos-Barstow-ToyahSPRING 2010
©Copyright 2010, Texas A&M UniversityAll rights reserved.
Secondary Report-Page 70 of 99

8/7/2019 REEVES COUNTY - Pecos-Barstow-Toyah ISD _ 2010 Texas School Survey of Drug and Alcohol Use
http://slidepdf.com/reader/full/reeves-county-pecos-barstow-toyah-isd-2010-texas-school-survey-of-drug 71/99
Pecos-Barstow-ToyahSPRING 2010
Table B11: Prevalence and recency of use of selected substances by gradeStudents would seek help from adults for substance abuse problems
(Continued)
PastMonth
SchoolYear
EverUsed
NeverUsed
RohypnolAll 1.0% 1.0% 1.7% 98.3%
Grades 7-8 2.3% 2.3% 2.3% 97.7%Grades 9-12 0.3% 0.3% 1.3% 98.7%
SteroidsAll 0.7% 0.7% 2.2% 97.8%
Grades 7-8 0.0% 0.0% 0.9% 99.1%Grades 9-12 1.0% 1.0% 2.8% 97.2%
EcstasyAll 1.0% 1.6% 5.1% 94.9%
Grades 7-8 0.0% 1.2% 1.2% 98.8%Grades 9-12 1.5% 1.8% 6.9% 93.1%
HeroinAll 0.6% 0.6% 0.8% 99.2%
Grades 7-8 1.2% 1.2% 1.2% 98.8%Grades 9-12 0.3% 0.3% 0.6% 99.4%
©Copyright 2010, Texas A&M UniversityAll rights reserved.
Secondary Report-Page 71 of 99

8/7/2019 REEVES COUNTY - Pecos-Barstow-Toyah ISD _ 2010 Texas School Survey of Drug and Alcohol Use
http://slidepdf.com/reader/full/reeves-county-pecos-barstow-toyah-isd-2010-texas-school-survey-of-drug 72/99
Pecos-Barstow-ToyahSPRING 2010
Table B12: Prevalence and recency of use of selected substances by gradeStudents would not seek help from adults for substance abuse problems
PastMonth
SchoolYear
EverUsed
NeverUsed
TobaccoAll 24.3% 32.9% 46.7% 53.3%
Grades 7-8 15.4% 20.0% 26.2% 73.8%Grades 9-12 27.3% 37.2% 53.7% 46.3%
AlcoholAll 50.1% 60.6% 82.0% 18.0%
Grades 7-8 34.8% 52.2% 84.1% 15.9%Grades 9-12 55.5% 63.6% 81.3% 18.7%
InhalantsAll 11.6% 19.0% 31.1% 68.9%
Grades 7-8 20.3% 29.0% 33.3% 66.7%Grades 9-12 8.5% 15.4% 30.3% 69.7%
Any Illicit DrugAll 18.6% 26.0% 36.1% 63.9%
Grades 7-8 23.3% 23.3% 23.3% 76.7%Grades 9-12 16.8% 27.0% 40.8% 59.2%
MarijuanaAll 14.1% 23.9% 33.6% 66.4%
Grades 7-8 25.8% 25.8% 25.8% 74.2%Grades 9-12 10.1% 23.3% 36.2% 63.8%
Marijuana OnlyAll 9.3% 14.8% 19.1% 80.9%
Grades 7-8 17.8% 17.8% 17.8% 82.2%Grades 9-12 6.2% 13.7% 19.6% 80.4%
Cocaine or Crack All 6.8% 8.0% 14.1% 85.9%
Grades 7-8 6.1% 6.1% 6.1% 93.9%
Grades 9-12 7.1% 8.7% 16.9% 83.1%Cocaine
All 6.8% 8.0% 14.1% 85.9%Grades 7-8 6.1% 6.1% 6.1% 93.9%
Grades 9-12 7.1% 8.7% 16.9% 83.1%Crack
All 1.2% 3.0% 3.0% 97.0%Grades 7-8 0.0% 0.0% 0.0% 100.0%
Grades 9-12 1.6% 3.9% 3.9% 96.1%Hallucinogens
All 0.0% 0.0% 1.6% 98.4%Grades 7-8 0.0% 0.0% 0.0% 100.0%
Grades 9-12 0.0% 0.0% 2.2% 97.8%Uppers
All 0.8% 1.6% 2.9% 97.1%Grades 7-8 0.0% 0.0% 0.0% 100.0%
Grades 9-12 1.1% 2.1% 3.7% 96.3%Downers
All 3.8% 4.6% 5.8% 94.2%Grades 7-8 0.0% 0.0% 0.0% 100.0%
Grades 9-12 5.0% 6.1% 7.8% 92.2%
©Copyright 2010, Texas A&M UniversityAll rights reserved.
Secondary Report-Page 72 of 99

8/7/2019 REEVES COUNTY - Pecos-Barstow-Toyah ISD _ 2010 Texas School Survey of Drug and Alcohol Use
http://slidepdf.com/reader/full/reeves-county-pecos-barstow-toyah-isd-2010-texas-school-survey-of-drug 73/99
Pecos-Barstow-ToyahSPRING 2010
©Copyright 2010, Texas A&M UniversityAll rights reserved.
Secondary Report-Page 73 of 99

8/7/2019 REEVES COUNTY - Pecos-Barstow-Toyah ISD _ 2010 Texas School Survey of Drug and Alcohol Use
http://slidepdf.com/reader/full/reeves-county-pecos-barstow-toyah-isd-2010-texas-school-survey-of-drug 74/99

8/7/2019 REEVES COUNTY - Pecos-Barstow-Toyah ISD _ 2010 Texas School Survey of Drug and Alcohol Use
http://slidepdf.com/reader/full/reeves-county-pecos-barstow-toyah-isd-2010-texas-school-survey-of-drug 75/99
Pecos-Barstow-ToyahSPRING 2010
Table B13: Prevalence and recency of use of selected substances by gradeStudents living in town three years or less
PastMonth
SchoolYear
EverUsed
NeverUsed
TobaccoAll 20.1% 31.5% 55.8% 44.2%
Grades 7-8 15.7% 27.0% 51.7% 48.3%Grades 9-12 21.8% 33.2% 57.3% 42.7%
AlcoholAll 40.1% 53.8% 77.7% 22.3%
Grades 7-8 37.6% 55.9% 74.2% 25.8%Grades 9-12 41.1% 53.0% 79.0% 21.0%
InhalantsAll 13.1% 20.1% 32.5% 67.5%
Grades 7-8 18.7% 29.2% 33.3% 66.7%Grades 9-12 10.8% 16.3% 32.2% 67.8%
Any Illicit DrugAll 21.0% 27.5% 47.5% 52.5%
Grades 7-8 21.9% 26.0% 34.4% 65.6%Grades 9-12 20.7% 28.0% 52.9% 47.1%
MarijuanaAll 16.9% 23.1% 44.1% 55.9%
Grades 7-8 22.6% 22.6% 26.9% 73.1%Grades 9-12 14.5% 23.3% 51.1% 48.9%
Marijuana OnlyAll 7.7% 9.7% 21.7% 78.3%
Grades 7-8 10.4% 10.4% 14.6% 85.4%Grades 9-12 6.6% 9.4% 24.7% 75.3%
Cocaine or Crack All 6.1% 8.0% 15.8% 84.2%
Grades 7-8 8.6% 8.6% 12.9% 87.1%
Grades 9-12 5.1% 7.8% 16.9% 83.1%Cocaine
All 6.1% 8.0% 15.8% 84.2%Grades 7-8 8.6% 8.6% 12.9% 87.1%
Grades 9-12 5.1% 7.8% 16.9% 83.1%Crack
All 1.0% 1.0% 5.6% 94.4%Grades 7-8 0.0% 0.0% 4.5% 95.5%
Grades 9-12 1.4% 1.4% 6.0% 94.0%Hallucinogens
All 3.6% 4.5% 10.0% 90.0%Grades 7-8 7.9% 7.9% 12.4% 87.6%
Grades 9-12 1.9% 3.2% 9.1% 90.9%Uppers
All 4.6% 4.6% 5.2% 94.8%Grades 7-8 4.5% 4.5% 4.5% 95.5%
Grades 9-12 4.6% 4.6% 5.5% 94.5%Downers
All 7.3% 7.3% 7.3% 92.7%Grades 7-8 4.5% 4.5% 4.5% 95.5%
Grades 9-12 8.4% 8.4% 8.4% 91.6%
©Copyright 2010, Texas A&M UniversityAll rights reserved.
Secondary Report-Page 75 of 99

8/7/2019 REEVES COUNTY - Pecos-Barstow-Toyah ISD _ 2010 Texas School Survey of Drug and Alcohol Use
http://slidepdf.com/reader/full/reeves-county-pecos-barstow-toyah-isd-2010-texas-school-survey-of-drug 76/99
Pecos-Barstow-ToyahSPRING 2010
©Copyright 2010, Texas A&M UniversityAll rights reserved.
Secondary Report-Page 76 of 99

8/7/2019 REEVES COUNTY - Pecos-Barstow-Toyah ISD _ 2010 Texas School Survey of Drug and Alcohol Use
http://slidepdf.com/reader/full/reeves-county-pecos-barstow-toyah-isd-2010-texas-school-survey-of-drug 77/99
Pecos-Barstow-ToyahSPRING 2010
Table B13: Prevalence and recency of use of selected substances by gradeStudents living in town three years or less
(Continued)
PastMonth
SchoolYear
EverUsed
NeverUsed
RohypnolAll 2.7% 2.7% 2.7% 97.3%
Grades 7-8 4.5% 4.5% 4.5% 95.5%Grades 9-12 2.0% 2.0% 2.0% 98.0%
SteroidsAll 0.0% 0.0% 2.4% 97.6%
Grades 7-8 0.0% 0.0% 0.0% 100.0%Grades 9-12 0.0% 0.0% 3.4% 96.6%
EcstasyAll 4.5% 6.4% 12.3% 87.7%
Grades 7-8 8.6% 12.9% 12.9% 87.1%Grades 9-12 2.8% 3.8% 12.0% 88.0%
HeroinAll 0.7% 0.7% 0.7% 99.3%
Grades 7-8 0.0% 0.0% 0.0% 100.0%Grades 9-12 1.0% 1.0% 1.0% 99.0%
©Copyright 2010, Texas A&M UniversityAll rights reserved.
Secondary Report-Page 77 of 99

8/7/2019 REEVES COUNTY - Pecos-Barstow-Toyah ISD _ 2010 Texas School Survey of Drug and Alcohol Use
http://slidepdf.com/reader/full/reeves-county-pecos-barstow-toyah-isd-2010-texas-school-survey-of-drug 78/99
Pecos-Barstow-ToyahSPRING 2010
Table B14: Prevalence and recency of use of selected substances by gradeStudents living in town more than three years
PastMonth
SchoolYear
EverUsed
NeverUsed
TobaccoAll 14.9% 19.9% 36.1% 63.9%
Grades 7-8 6.8% 7.9% 16.1% 83.9%Grades 9-12 19.0% 26.1% 46.5% 53.5%
AlcoholAll 32.3% 46.2% 71.8% 28.2%
Grades 7-8 20.7% 30.8% 54.0% 46.0%Grades 9-12 38.3% 54.1% 80.9% 19.1%
InhalantsAll 5.3% 10.7% 23.6% 76.4%
Grades 7-8 7.4% 12.2% 22.5% 77.5%Grades 9-12 4.2% 9.8% 24.1% 75.9%
Any Illicit DrugAll 10.3% 16.2% 27.1% 72.9%
Grades 7-8 5.9% 6.7% 8.8% 91.2%Grades 9-12 12.6% 21.2% 36.6% 63.4%
MarijuanaAll 7.2% 13.7% 25.1% 74.9%
Grades 7-8 4.9% 5.8% 9.1% 90.9%Grades 9-12 8.4% 17.9% 33.4% 66.6%
Marijuana OnlyAll 4.4% 8.0% 13.7% 86.3%
Grades 7-8 3.7% 3.7% 4.7% 95.3%Grades 9-12 4.8% 10.3% 18.5% 81.5%
Cocaine or Crack All 2.8% 4.4% 10.9% 89.1%
Grades 7-8 0.0% 0.0% 1.1% 98.9%
Grades 9-12 4.2% 6.6% 15.9% 84.1%Cocaine
All 2.8% 4.4% 10.9% 89.1%Grades 7-8 0.0% 0.0% 1.1% 98.9%
Grades 9-12 4.2% 6.6% 16.0% 84.0%Crack
All 0.0% 0.6% 1.7% 98.3%Grades 7-8 0.0% 0.0% 0.0% 100.0%
Grades 9-12 0.0% 0.9% 2.6% 97.4%Hallucinogens
All 0.6% 1.1% 2.4% 97.6%Grades 7-8 0.0% 0.0% 0.0% 100.0%
Grades 9-12 1.0% 1.7% 3.6% 96.4%Uppers
All 0.6% 1.1% 2.3% 97.7%Grades 7-8 0.0% 0.0% 1.1% 98.9%
Grades 9-12 0.9% 1.6% 2.8% 97.2%Downers
All 1.6% 2.8% 4.1% 95.9%Grades 7-8 0.0% 0.9% 0.9% 99.1%
Grades 9-12 2.4% 3.8% 5.7% 94.3%
©Copyright 2010, Texas A&M UniversityAll rights reserved.
Secondary Report-Page 78 of 99

8/7/2019 REEVES COUNTY - Pecos-Barstow-Toyah ISD _ 2010 Texas School Survey of Drug and Alcohol Use
http://slidepdf.com/reader/full/reeves-county-pecos-barstow-toyah-isd-2010-texas-school-survey-of-drug 79/99
Pecos-Barstow-ToyahSPRING 2010
©Copyright 2010, Texas A&M UniversityAll rights reserved.
Secondary Report-Page 79 of 99

8/7/2019 REEVES COUNTY - Pecos-Barstow-Toyah ISD _ 2010 Texas School Survey of Drug and Alcohol Use
http://slidepdf.com/reader/full/reeves-county-pecos-barstow-toyah-isd-2010-texas-school-survey-of-drug 80/99
Pecos-Barstow-ToyahSPRING 2010
Table B14: Prevalence and recency of use of selected substances by gradeStudents living in town more than three years
(Continued)
PastMonth
SchoolYear
EverUsed
NeverUsed
RohypnolAll 0.8% 0.8% 1.6% 98.4%
Grades 7-8 2.2% 2.2% 2.2% 97.8%Grades 9-12 0.0% 0.0% 1.3% 98.7%
SteroidsAll 0.9% 1.3% 2.3% 97.7%
Grades 7-8 0.0% 1.1% 1.9% 98.1%Grades 9-12 1.4% 1.4% 2.5% 97.5%
EcstasyAll 0.9% 0.9% 2.9% 97.1%
Grades 7-8 0.0% 0.0% 0.0% 100.0%Grades 9-12 1.4% 1.4% 4.3% 95.7%
HeroinAll 0.4% 0.4% 0.9% 99.1%
Grades 7-8 1.1% 1.1% 1.1% 98.9%Grades 9-12 0.0% 0.0% 0.8% 99.2%
©Copyright 2010, Texas A&M UniversityAll rights reserved.
Secondary Report-Page 80 of 99

8/7/2019 REEVES COUNTY - Pecos-Barstow-Toyah ISD _ 2010 Texas School Survey of Drug and Alcohol Use
http://slidepdf.com/reader/full/reeves-county-pecos-barstow-toyah-isd-2010-texas-school-survey-of-drug 81/99
Pecos-Barstow-ToyahSPRING 2010
3. Margin Tables
©Copyright 2010, Texas A&M UniversityAll rights reserved.
Secondary Report-Page 81 of 99

8/7/2019 REEVES COUNTY - Pecos-Barstow-Toyah ISD _ 2010 Texas School Survey of Drug and Alcohol Use
http://slidepdf.com/reader/full/reeves-county-pecos-barstow-toyah-isd-2010-texas-school-survey-of-drug 82/99
Pecos-Barstow-ToyahSPRING 2010
©Copyright 2010, Texas A&M UniversityAll rights reserved.
Secondary Report-Page 82 of 99

8/7/2019 REEVES COUNTY - Pecos-Barstow-Toyah ISD _ 2010 Texas School Survey of Drug and Alcohol Use
http://slidepdf.com/reader/full/reeves-county-pecos-barstow-toyah-isd-2010-texas-school-survey-of-drug 83/99
Pecos-Barstow-ToyahSpring 2010
The FREQ Procedure
GENDER q1 Frequency PercentFemale 296 53.32Male 259 46.68
Frequency Missing = 4.288441112
GRADEq2 Frequency Percent
Grade 7 93 16.65Grade 8 100 17.83Grade 9 101 18.05
Grade 10 100 17.83Grade 11 99 17.72Grade 12 67 11.92
LIVE WITH BOTHPARENTS
q3 Frequency PercentNo 212 38.41Yes 340 61.59
Frequency Missing = 7.8411466366
AGEq4 Frequency Percent
12 31 5.5013 92 16.5414 90 16.0515 101 18.1416 111 19.9417 81 14.5118 45 8.13
19 or older 7 1.19
Frequency Missing = 1.5348716619
ETHNICITYq5 Frequency PercentAfrican/American 10 1.86Asian/American 6 1.12Mexican/American 454 82.48Native/American 3 0.55Other 33 6.05
White 44 7.95
Frequency Missing = 9.6479665654
ON AVERAGE WHATGRADES DO YOU GET
q6 Frequency PercentMostly A's 99 17.87Mostly B's 333 60.13Mostly C's 100 18.13Mostly D's 18 3.32
Mostly F's 3 0.55
Frequency Missing = 6.9030346765
LENGTH OF TIME INTHIS DISTRICT
q7 Frequency Percent<1 year 51 9.48
2-3 years 73 13.52>4 years 416 77.00
Frequency Missing = 20.088039492
DO YOU HAVE AJOB
q8 Frequency PercentNo 461 82.97Yes 95 17.03
Frequency Missing = 4.5606178456
DO YOU GET ANALLOWANCE
q9 Frequency PercentNo 380 68.99Yes 171 31.01
Frequency Missing = 9.8788508446
EITHER PARENT COLLEGEGRADUATE
q10 Frequency PercentDon't Know 121 21.91No 278 50.29Yes 154 27.81
Frequency Missing = 6.6371892387
QUALIFY FOR FREE/REDUCED PRICE
LUNCHq11 Frequency PercentDon't Know 85 15.68No 175 32.40
Yes 281 51.91
Frequency Missing = 18.428795107
PARTICIPATE INSCHOOL ATHLETICS
q12a Frequency PercentNo 191 36.84Yes 327 63.16
Frequency Missing = 42.802375313
PARTICIPATE INSCHOOL
BAND/ORCHESTRAq12b Frequency PercentNo 383 83.17Yes 78 16.83
Frequency Missing = 99.226772369
PARTICIPATE INSCHOOL CHOIR
q12c Frequency PercentNo 440 99.66Yes 2 0.34
The frequencies have been weighted so that the analysis reflectsthe distribution of students by grade level in the district
©Copyright 2010, Texas A&M UniversityAll rights reserved.
Page 83 of 99

8/7/2019 REEVES COUNTY - Pecos-Barstow-Toyah ISD _ 2010 Texas School Survey of Drug and Alcohol Use
http://slidepdf.com/reader/full/reeves-county-pecos-barstow-toyah-isd-2010-texas-school-survey-of-drug 84/99
Pecos-Barstow-ToyahSpring 2010
Frequency Missing = 118.30933786
PARTICIPATE INDRAMA/SPEECH/ART
CLUBSq12d Frequency Percent
No 393 87.41Yes 57 12.59
Frequency Missing = 110.67552759
PARTICIPATE IN DRILLTEAM/CHEERLEADING
q12e Frequency PercentNo 423 94.46Yes 25 5.54
Frequency Missing = 112.21144276
PARTICIPATE INSTUDENT
GOVERNMENTq12f Frequency PercentNo 434 96.61Yes 15 3.39
Frequency Missing = 110.78777337
PARTICIPATE IN SCHOOLNEWSPAPER/YEARBOOK
q12g Frequency PercentNo 418 92.53Yes 34 7.47
Frequency Missing = 108.72067519
PARTICIPATE INACADEMIC
CLUBS/SOCIETIESq12h Frequency PercentNo 403 89.28Yes 48 10.72
Frequency Missing = 108.20601274
PARTICIPATE INACADEMIC
COMPETITIONGROUPS
q12i Frequency PercentNo 392 84.88Yes 70 15.12
Frequency Missing = 98.050581423
PARTICIPATE INSCHOOL SERVICE
CLUBSq12j Frequency PercentNo 443 98.09Yes 9 1.91
Frequency Missing = 108.67086418
PARTICIPATE INOTHER SCHOOL
CLUBS OR GROUPSq12k Frequency PercentNo 392 85.18Yes 68 14.82
Frequency Missing = 100.34162538
PARTICIPATE INATHLETIC TEAMS
OUTSIDE OF SCHOOLq12l Frequency PercentNo 325 68.55Yes 149 31.45
Frequency Missing = 85.370257961
PARTICIPATE IN
OTHER CLUBS OR GROUPS OUTSIDE OFSCHOOL
q12m Frequency PercentNo 385 83.17Yes 78 16.83
Frequency Missing = 97.603553255
DO YOU FEEL SAFE IN YOUR HOM
q13a Frequency PercentVery Safe 455 81.9
Somewhat Safe 78 14.0Not Very Safe 7 1.
Not Safe At All 6 1.0Don't Know 10 1.7
Frequency Missing = 5.3658567493
DO YOU FEEL SAFE IN YOUR NEIGHBORHOOD
q13b Frequency PercentVery Safe 221 39.9
Somewhat Safe 261 47.2Not Very Safe 25 4.5
Not Safe At All 20 3.6Don't Know 26 4.6
Frequency Missing = 7.2411158821
DO YOU FEEL SAFE ATSCHOOL
q13c Frequency PercentVery Safe 218 39.5
Somewhat Safe 245 44.5Not Very Safe 36 6.4
Not Safe At All 26 4.6Don't Know 27 4.8
Frequency Missing = 9.1455405265
FRIENDS FEELINGCLOSE TO THEIR
PARENTSq14a Frequency Percent
None 36 6.64A Few 154 28.07Some 145 26.37Most 152 27.70
All 62 11.22
The frequencies have been weighted so that the analysis reflectsthe distribution of students by grade level in the district
©Copyright 2010, Texas A&M UniversityAll rights reserved.
Page 84 of 99

8/7/2019 REEVES COUNTY - Pecos-Barstow-Toyah ISD _ 2010 Texas School Survey of Drug and Alcohol Use
http://slidepdf.com/reader/full/reeves-county-pecos-barstow-toyah-isd-2010-texas-school-survey-of-drug 85/99
Pecos-Barstow-ToyahSpring 2010
Frequency Missing = 11.131674146
HOW MANY FRIENDSCARRY WEAPONS
q14b Frequency PercentNone 389 72.59
A Few 85 15.91Some 39 7.32Most 14 2.54
All 9 1.64
Frequency Missing = 24.635466283
HOW MANY FRIENDSCARE ABOUT GOOD
GRADESq14c Frequency Percent
None 23 4.35A Few 94 18.20Some 89 17.24Most 192 37.12
All 120 23.08
Frequency Missing = 41.646458281
HOW MANY FRIENDSBELONG TO A GANG
q14d Frequency Percent
None 431 79.15A Few 75 13.77Some 22 3.98Most 6 1.04
All 11 2.05
Frequency Missing = 15.119001479
FRIENDS WISHING TODROP OUT OF
SCHOOLq14e Frequency PercentNone 302 55.30
A Few 134 24.49Some 61 11.13
Most 30 5.45All 20 3.64
Frequency Missing = 13.973375104
PARENTS ATTENDPTA/SCHOOL OPEN
HOUSESq15 Frequency PercentNo 258 53.11Yes 227 46.89
Frequency Missing = 74.941950529
RECENT INHALANT USE - SPRAYPAINT
Q16A Frequency PercentNever Heard/Used 501 91.19
In Your Lifetime 34 6.25Since School Began 5 0.99
In the Past Month 9 1.57
Frequency Missing = 10.054486975
RECENT INHALANT USE -WHITEOUT, CORRECTION FLUID,
MAGIC MARKERSQ16B Frequency Percent
Never Heard/Used 481 88.15In Your Lifetime 39 7.06
Since School Began 11 1.94In the Past Month 16 2.85
Frequency Missing = 13.990512998
RECENT INHALANT USE -COMPUTER DUSTING SPRAYS
Q16C Frequency PercentNever Heard/Used 484 8
In Your Lifetime 34 Since School Began 9
In the Past Month 17
Frequency Missing = 16.528167026
RECENT INHALANT USE - HELIUM,BUTANE, PROPANE, WHIPPETS,
REFRIGERANTS/FREONQ16D Frequency Percen
Never Heard/Used 492 9In Your Lifetime 25
Since School Began 10 In the Past Month 15
Frequency Missing = 17.496915117
RECENT INHALANT USE - GLUEQ16E Frequency Percent
Never Heard/Used 530 9In Your Lifetime 7
Since School Began 1 In the Past Month 2
Frequency Missing = 18.906080664
RECENT INHALANT USE -TOLUENE, PAINT THINNER,
OTHER SOLVENTSQ16F Frequency Percent
Never Heard/Used 529 9In Your Lifetime 8
Since School Began 2 In the Past Month 6
Frequency Missing = 15.541189163
The frequencies have been weighted so that the analysis reflectsthe distribution of students by grade level in the district
©Copyright 2010, Texas A&M UniversityAll rights reserved.
Page 85 of 99

8/7/2019 REEVES COUNTY - Pecos-Barstow-Toyah ISD _ 2010 Texas School Survey of Drug and Alcohol Use
http://slidepdf.com/reader/full/reeves-county-pecos-barstow-toyah-isd-2010-texas-school-survey-of-drug 86/99
Pecos-Barstow-ToyahSpring 2010
RECENT INHALANT USE -GASOLINE, OCTANE BOOSTER,
CARBURETOR CLEANER Q16G Frequency Percent
Never Heard/Used 494 91.10In Your Lifetime 32 5.92
Since School Began 5 1.00
In the Past Month 11 1.99
Frequency Missing = 18.270453777
RECENT INHALANT USE - OTHER AEROSOLS/SPRAYS
Q16H Frequency PercentNever Heard/Used 521 94.93
In Your Lifetime 14 2.52Since School Began 4 0.69
In the Past Month 10 1.86
Frequency Missing = 11.560193125
RECENT CIGARETTE USEQ17A Frequency Percent
Never Heard/Used 338 61.98In Your Lifetime 95 17.49
Since School Began 30 5.52In the Past Month 82 15.01
Frequency Missing = 14.148782768
RECENT SMOKELESS TOBACCOUSE
Q17B Frequency PercentNever Heard/Used 463 86.19
In Your Lifetime 43 7.98Since School Began 14 2.59
In the Past Month 17 3.24
Frequency Missing = 23.081948204
RECENT BEER USEQ17C Frequency Percent
Never Heard/Used 192 35.89In Your Lifetime 115 21.38
Since School Began 79 14.70In the Past Month 150 28.04
Frequency Missing = 24.455616944
RECENT WINE COOLER USEQ17D Frequency Percent
Never Heard/Used 263 49.07In Your Lifetime 101 18.77
Since School Began 60 11.13In the Past Month 113 21.03
Frequency Missing = 23.313896595
RECENT WINE USEQ17E Frequency Percent
Never Heard/Used 312 57.93In Your Lifetime 111 20.60
Since School Began 49 9.01In the Past Month 67 12.46
Frequency Missing = 21.807126333
RECENT LIQUOR USEQ17F Frequency Percent
Never Heard/Used 239 44.23In Your Lifetime 115 21.34
Since School Began 68 12.64In the Past Month 118 21.78
Frequency Missing = 19.346170329
RECENT INHALANT USEQ17G Frequency Percent
Never Heard/Used 480 87.89In Your Lifetime 43 7.80
Since School Began 13 2.35In the Past Month 11 1.96
Frequency Missing = 14.10001619
RECENT MARIJUANA USEQ18A Frequency Percen
Never Heard/Used 383 7In Your Lifetime 71 1
Since School Began 34
In the Past Month 51
Frequency Missing = 20.028100621
RECENT COCAINE USEQ18B Frequency Percen
Never Heard/Used 475 8In Your Lifetime 36
Since School Began 9 In the Past Month 19
Frequency Missing = 21.50317064
RECENT CRACK USEQ18C Frequency Percent
Never Heard/Used 520 9In Your Lifetime 10
Since School Began 2 In the Past Month 1
Frequency Missing = 26.035687086
RECENT HALLUCINOGEN USEQ18E Frequency Percent
Never Heard/Used 514 9In Your Lifetime 12
Since School Began 3 In the Past Month 7
Frequency Missing = 24.131033975
RECENT UPPER USEQ18F Frequency Percent
Never Heard/Used 517 9In Your Lifetime 6
Since School Began 2 In the Past Month 8
The frequencies have been weighted so that the analysis reflectsthe distribution of students by grade level in the district
©Copyright 2010, Texas A&M UniversityAll rights reserved.
Page 86 of 99

8/7/2019 REEVES COUNTY - Pecos-Barstow-Toyah ISD _ 2010 Texas School Survey of Drug and Alcohol Use
http://slidepdf.com/reader/full/reeves-county-pecos-barstow-toyah-isd-2010-texas-school-survey-of-drug 87/99
Pecos-Barstow-ToyahSpring 2010
Frequency Missing = 27.178778729
RECENT DOWNER USEQ18G Frequency Percent
Never Heard/Used 506 95.19In Your Lifetime 5 0.96
Since School Began 5 0.89In the Past Month 16 2.96
Frequency Missing = 28.80639443
RECENT ROHYPNOL USEQ18H Frequency Percent
Never Heard/Used 526 98.18In Your Lifetime 3 0.65
In the Past Month 6 1.17
Frequency Missing = 24.221471749
RECENT STEROID USEQ18I Frequency Percent
Never Heard/Used 522 97.74In Your Lifetime 7 1.27
Since School Began 2 0.28In the Past Month 4 0.71
Frequency Missing = 25.795210597
RECENT ECSTASY USEQ18J Frequency Percent
Never Heard/Used 509 94.65In Your Lifetime 15 2.79
Since School Began 2 0.44In the Past Month 11 2.12
Frequency Missing = 22.280308145
RECENT HEROIN USEQ18K Frequency Percent
Never Heard/Used 532 99.18In Your Lifetime 2 0.38
In the Past Month 2 0.44
Frequency Missing = 23.416232846
TOBACCO USE IN PAST MONTHq19a Frequency Percent
Never Heard/Used 452 83.131-2 times 43 7.97
3-10 times 19 3.5211+ times 29 5.39
Frequency Missing = 15.880106014
ALCOHOL USE IN PAST MONTHq19b Frequency Percent
Never Heard/Used 302 55.791-2 times 118 21.82
3-10 times 72 13.2611+ times 49 9.12
Frequency Missing = 18.677809833
INHALANT USE IN PAST MONTHq19c Frequency Percent
Never Heard/Used 514 94.141-2 times 19 3.51
3-10 times 9 1.6411+ times 4 0.71
Frequency Missing = 13.940413029
MARIJUANA USE IN PASTMONTH
q19d Frequency PercentNever Heard/Used 453 83.40
1-2 times 45 8.233-10 times 19 3.4411+ times 27 4.93
Frequency Missing = 16.291258633
COCAINE USE IN PAST MONTHq19e Frequency Percent
Never Heard/Used 515 931-2 times 19 3
3-10 times 9 11+ times 5
Frequency Missing = 11.871008577
CRACK USE IN PAST MONTHq19f Frequency Percent
Never Heard/Used 542 981-2 times 3
3-10 times 3
Frequency Missing = 12.306694499
CLOSE FRIENDS USECIGARETTE
q20a Frequency PercentNever heard/None 210 38
A few 172 31Some 79 14Most 66 12
All 13 2
Frequency Missing = 20.899688407
CLOSE FRIENDS USESMOKELESS TOBACCO
q20b Frequency PercentNever heard/None 323 60
A few 120 22Some 66 12Most 20 3
All 5 0
Frequency Missing = 26.053170066
The frequencies have been weighted so that the analysis reflectsthe distribution of students by grade level in the district
©Copyright 2010, Texas A&M UniversityAll rights reserved.
Page 87 of 99

8/7/2019 REEVES COUNTY - Pecos-Barstow-Toyah ISD _ 2010 Texas School Survey of Drug and Alcohol Use
http://slidepdf.com/reader/full/reeves-county-pecos-barstow-toyah-isd-2010-texas-school-survey-of-drug 88/99
Pecos-Barstow-ToyahSpring 2010
CLOSE FRIENDS USE BEER q20c Frequency Percent
Never heard/None 113 21.30A few 103 19.40Some 88 16.63Most 145 27.33
All 82 15.35
Frequency Missing = 28.783598118
CLOSE FRIENDS USE WINECOOLERS
q20d Frequency PercentNever heard/None 206 38.88
A few 96 18.01Some 91 17.11Most 89 16.66
All 50 9.35
Frequency Missing = 28.893271263
CLOSE FRIENDS USE WINEq20e Frequency Percent
Never heard/None 287 54.55A few 118 22.38Some 62 11.80Most 33 6.25
All 26 5.02
Frequency Missing = 33.418620768
CLOSE FRIENDS USE LIQUOR q20f Frequency Percent
Never heard/None 176 33.06A few 88 16.54Some 86 16.14Most 112 21.14
All 70 13.13
Frequency Missing = 28.84950259
CLOSE FRIENDS USE INHALANTSq20g Frequency Percent
Never heard/None 382 71.98A few 90 16.95Some 45 8.41Most 11 2.06
All 3 0.60
Frequency Missing = 29.603440183
CLOSE FRIENDS USEMARIJUANA
q20h Frequency PercentNever heard/None 264 49.46
A few 114 21.35Some 66 12.27Most 64 12.03
All 26 4.88
Frequency Missing = 26.155506316
DIFFICULT TO GETCIGARETTES
q21a Frequency PercentNever heard of 113 21.74
Impossible 82 15.66Very difficult 31 5.92
Somewhat diff 31 5.86Somewhat easy 79 15.17
Very easy 186 35.65
Frequency Missing = 38.661913314
DIFFICULT TO GETSMOKELESS TOBACCO
q21b Frequency PercentNever heard of 189 36.46
Impossible 91 17.50Very difficult 29 5.52
Somewhat diff 32 6.17
Somewhat easy 59 11.45Very easy 119 22.90
Frequency Missing = 41.340105085
DIFFICULT TO GET BEER q21c Frequency Percent
Never heard of 80 15.5Impossible 44 8.6
Very difficult 29 5.6Somewhat diff 68 13.2
Somewhat easy 106 20.7
Very easy 186 36.1
Frequency Missing = 47.233934861
DIFFICULT TO GET WINECOOLERS
q21d Frequency PercentNever heard of 109 20.9
Impossible 59 11.3Very difficult 36 7.0
Somewhat diff 61 11.7
Somewhat easy 92 17.8Very easy 161 31.0
Frequency Missing = 42.213554726
DIFFICULT TO GET WINEq21e Frequency Percent
Never heard of 124 24.3Impossible 70 13.7
Very difficult 37 7.2Somewhat diff 62 12.1
Somewhat easy 82 16.0Very easy 136 26.5
Frequency Missing = 49.204492444
DIFFICULT TO GET LIQUOR q21f Frequency Percent
Never heard of 93 17.9Impossible 66 12.7
Very difficult 42 8.Somewhat diff 53 10.1
Somewhat easy 96 18.5Very easy 170 32.6
Frequency Missing = 39.059567695
The frequencies have been weighted so that the analysis reflectsthe distribution of students by grade level in the district
©Copyright 2010, Texas A&M UniversityAll rights reserved.
Page 88 of 99

8/7/2019 REEVES COUNTY - Pecos-Barstow-Toyah ISD _ 2010 Texas School Survey of Drug and Alcohol Use
http://slidepdf.com/reader/full/reeves-county-pecos-barstow-toyah-isd-2010-texas-school-survey-of-drug 89/99
Pecos-Barstow-ToyahSpring 2010
DIFFICULT TO GETINHALANTS
q21g Frequency PercentNever heard of 181 34.90
Impossible 86 16.64Very difficult 19 3.62
Somewhat diff 20 3.86
Somewhat easy 52 10.12Very easy 160 30.85
Frequency Missing = 41.733962903
DIFFICULT TO GETMARIJUANA
q21h Frequency PercentNever heard of 147 28.66
Impossible 103 20.11Very difficult 35 6.77
Somewhat diff 54 10.57Somewhat easy 57 11.22
Very easy 116 22.66
Frequency Missing = 47.535277107
DIFFICULT TO GET COCAINEq21i Frequency Percent
Never heard of 187 36.41Impossible 131 25.42
Very difficult 38 7.45
Somewhat diff 41 8.06Somewhat easy 50 9.72
Very easy 67 12.94
Frequency Missing = 45.940832269
DIFFICULT TO GET CRACK q21j Frequency Percent
Never heard of 207 40.02Impossible 141 27.27
Very difficult 56 10.84
Somewhat diff 40 7.68Somewhat easy 37 7.07
Very easy 37 7.11
Frequency Missing = 43.248207289
DIFFICULT TO GETHALLUCINOGENS
q21l Frequency PercentNever heard of 273 52.70
Impossible 120 23.26Very difficult 39 7.47
Somewhat diff 35 6.82Somewhat easy 20 3.90
Very easy 30 5.85
Frequency Missing = 42.441597091
DIFFICULT TO GET UPPERSq21m Frequency Percent
Never heard of 320 62.34Impossible 86 16.85
Very difficult 26 5.10
Somewhat diff 16 3.18Somewhat easy 26 5.02
Very easy 38 7.50
Frequency Missing = 47.300903446
DIFFICULT TO GET DOWNERSq21n Frequency Percent
Never heard of 315 61.51Impossible 88 17.25
Very difficult 26 5.03
Somewhat diff 16 3.03Somewhat easy 27 5.22
Very easy 41 7.97
Frequency Missing = 47.674481459
DIFFICULT TO GETROHYPNOL
q21o Frequency PercentNever heard of 306 59.73
Impossible 101 19.78
Very difficult 36 7.10Somewhat diff 23 4.49
Somewhat easy 18 3.55Very easy 27 5.36
Frequency Missing = 47.676787724
DIFFICULT TO GET STEROIDSq21p Frequency Percent
Never heard of 217 42.4Impossible 157 30.6
Very difficult 48 9.3
Somewhat diff 39 7.6Somewhat easy 21 4.
Very easy 30 5.8
Frequency Missing = 48.266281159
DIFFICULT TO GET ECSTASYq21q Frequency Percent
Never heard of 241 46.7Impossible 121 23.4
Very difficult 45 8.8
Somewhat diff 39 7.4Somewhat easy 26 5.0
Very easy 43 8.3
Frequency Missing = 45.594113502
DIFFICULT TO GET HEROINq21r Frequency Percent
Never heard of 244 47.6Impossible 146 28.4
Very difficult 49 9.5
Somewhat diff 28 5.5Somewhat easy 19 3.7
Very easy 26 5.0
Frequency Missing = 46.672671967
The frequencies have been weighted so that the analysis reflectsthe distribution of students by grade level in the district
©Copyright 2010, Texas A&M UniversityAll rights reserved.
Page 89 of 99

8/7/2019 REEVES COUNTY - Pecos-Barstow-Toyah ISD _ 2010 Texas School Survey of Drug and Alcohol Use
http://slidepdf.com/reader/full/reeves-county-pecos-barstow-toyah-isd-2010-texas-school-survey-of-drug 90/99
Pecos-Barstow-ToyahSpring 2010
AGE WHEN FIRST USEDCIGARETTES
q22a Frequency Percent9 or younger 24 11.8310 years old 17 8.1411 years old 12 5.7112 years old 21 10.25
13 years old 45 21.5814 years old 21 10.0715 years old 26 12.4216 years old 27 13.0717 years old 10 5.0218 or older 4 1.91
Frequency Missing = 353.27656338
AGE WHEN FIRST USEDSMOKELESS TOBACCO
q22b Frequency Percent9 or younger 4 4.9910 years old 1 1.0511 years old 7 8.8312 years old 7 7.9113 years old 9 10.9114 years old 14 16.5315 years old 25 29.9716 years old 10 12.2117 years old 5 5.6218 or older 2 1.98
Frequency Missing = 477.41057814
AGE WHEN FIRST USEDBEER
q22c Frequency Percent9 or younger 44 13.0610 years old 27 8.1111 years old 16 4.8312 years old 46 13.5413 years old 54 15.9014 years old 57 16.9215 years old 60 17.8016 years old 20 5.8317 years old 10 2.9918 or older 3 1.03
Frequency Missing = 222.37745972
AGE WHEN FIRST USEDWINE COOLERS
q22d Frequency Percent9 or younger 27 9.5210 years old 19 6.7311 years old 17 6.0612 years old 39 14.0613 years old 47 16.8714 years old 42 15.1615 years old 65 23.3316 years old 13 4.5117 years old 10 3.4818 or older 1 0.28
Frequency Missing = 281.50216908
AGE WHEN FIRST USEDWINEq22e Frequency Percent
9 or younger 26 11.5210 years old 15 6.4311 years old 18 7.6712 years old 37 16.3413 years old 37 16.0414 years old 28 12.4115 years old 41 17.8616 years old 15 6.6517 years old 10 4.2418 or older 2 0.84
Frequency Missing = 330.78620645
AGE WHEN FIRST USEDLIQUOR
q22f Frequency Percent9 or younger 12 4.1810 years old 9 3.0611 years old 28 9.3512 years old 37 12.3613 years old 56 18.66
14 years old 47 15.8915 years old 62 20.6916 years old 33 11.0017 years old 10 3.5118 or older 4 1.30
Frequency Missing = 262.16896849
AGE WHEN FIRST USEDINHALANTS
q22g Frequency Percent9 or younger 10 13.3410 years old 2 3.1911 years old 7 9.6712 years old 11 15.4213 years old 16 21.5414 years old 8 10.7815 years old 13 17.3916 years old 4 5.4217 years old 2 3.24
Frequency Missing = 487.86776268
AGE WHEN FIRST USEDMARIJUANA
q22h Frequency Percent9 or younger 9 5.7710 years old 9 5.7511 years old 8 5.3312 years old 16 10.3913 years old 31 20.5514 years old 32 20.8015 years old 25 16.7016 years old 16 10.3317 years old 2 1.27
18 or older 5 3.12
Frequency Missing = 407.99470134
The frequencies have been weighted so that the analysis reflectsthe distribution of students by grade level in the district
©Copyright 2010, Texas A&M UniversityAll rights reserved.
Page 90 of 99

8/7/2019 REEVES COUNTY - Pecos-Barstow-Toyah ISD _ 2010 Texas School Survey of Drug and Alcohol Use
http://slidepdf.com/reader/full/reeves-county-pecos-barstow-toyah-isd-2010-texas-school-survey-of-drug 91/99
Pecos-Barstow-ToyahSpring 2010
AGE WHEN FIRST USEDCOCAINE
q22i Frequency Percent9 or younger 2 3.8210 years old 1 1.9211 years old 1 1.3312 years old 4 6.91
13 years old 7 11.1514 years old 11 18.7015 years old 15 24.7516 years old 12 20.4717 years old 4 6.9818 or older 2 3.97
Frequency Missing = 499.33394752
AGE WHEN FIRST USEDCRACK
q22j Frequency Percent9 or younger 1 5.4610 years old 1 5.9111 years old 1 7.9212 years old 2 10.2614 years old 3 17.7215 years old 2 13.1216 years old 6 39.62
Frequency Missing = 545.25164338
AGE WHEN FIRST USEDHALLUCINOGENS
q22l Frequency Percent9 or younger 3 16.2910 years old 2 9.6011 years old 1 6.5112 years old 1 6.6913 years old 3 18.3714 years old 5 29.3516 years old 2 13.19
Frequency Missing = 542.54197983
AGE WHEN FIRST USEDUPPERS
q22m Frequency Percent9 or younger 3 15.2411 years old 2 8.4513 years old 5 27.4914 years old 3 17.37
15 years old 3 15.6316 years old 2 9.9418 or older 1 5.88
Frequency Missing = 540.1506971
AGE WHEN FIRST USEDDOWNERS
q22n Frequency Percent10 years old 3 11.2811 years old 2 10.03
12 years old 1 3.3913 years old 3 14.3814 years old 4 18.1815 years old 6 24.7516 years old 2 9.8317 years old 1 3.2318 or older 1 4.91
Frequency Missing = 536.24277248
AGE WHEN FIRST USED
ROHYPNOLq22o Frequency Percent
10 years old 2 16.0811 years old 1 9.2612 years old 2 16.0813 years old 2 17.4216 years old 3 28.7318 or older 1 12.41
Frequency Missing = 550.59440968
AGE WHEN FIRST USEDSTEROIDS
q22p Frequency Percent9 or younger 1 12.6913 years old 1 11.7314 years old 4 51.7215 years old 2 23.86
Frequency Missing = 553.1333971
AGE WHEN FIRST USEDECSTASY
q22q Frequency Percent9 or younger 1 3.6310 years old 1 4.8712 years old 3 13.1313 years old 3 14.5214 years old 5 19.39
15 years old 8 34.4416 years old 2 10.03
Frequency Missing = 535.99986058
AGE WHEN FIRST USEDHEROIN
q22r Frequency Percent14 years old 2 100.00
Frequency Missing = 558.25771325
HOW OFTEN NORMALLY USECIGARETTE
q23a Frequency PercentEvery day 23 4
Several times/wk 20 3Several times/mo 31 5
About once/month 38 7About once/year 28 5
< once/year 40 7Never used 352 66
Frequency Missing = 28.400011249
The frequencies have been weighted so that the analysis reflectsthe distribution of students by grade level in the district
©Copyright 2010, Texas A&M UniversityAll rights reserved.
Page 91 of 99

8/7/2019 REEVES COUNTY - Pecos-Barstow-Toyah ISD _ 2010 Texas School Survey of Drug and Alcohol Use
http://slidepdf.com/reader/full/reeves-county-pecos-barstow-toyah-isd-2010-texas-school-survey-of-drug 92/99
Pecos-Barstow-ToyahSpring 2010
HOW OFTEN NORMALLY USESMOKELESS TOBACCO
q23b Frequency PercentEvery day 11 2.05
Several times/wk 5 0.89Several times/mo 10 1.85
About once/month 14 2.68
About once/year 8 1.57< once/year 23 4.35Never used 453 86.60
Frequency Missing = 37.378146699
HOW OFTEN NORMALLY USEBEER
q23c Frequency PercentEvery day 6 1.18
Several times/wk 42 8.00
Several times/mo 79 15.15About once/month 95 18.23
About once/year 49 9.37< once/year 50 9.48Never used 202 38.59
Frequency Missing = 36.344865431
HOW OFTEN NORMALLY USEWINE COOLERS
q23d Frequency Percent
Every day 3 0.55Several times/wk 25 4.77Several times/mo 60 11.36
About once/month 74 13.99About once/year 41 7.86
< once/year 49 9.37Never used 274 52.09
Frequency Missing = 33.082538646
HOW OFTEN NORMALLY USEWINE
q23e Frequency PercentSeveral times/wk 14 2.68Several times/mo 32 6.22
About once/month 48 9.18About once/year 53 10.07
< once/year 64 12.29Never used 311 59.56
Frequency Missing = 37.664926595
HOW OFTEN NORMALLY USELIQUOR
q23f Frequency PercentEvery day 1 0.17
Several times/wk 33 6.27Several times/mo 71 13.54
About once/month 86 16.40About once/year 46 8.83
< once/year 45 8.51Never used 244 46.29
Frequency Missing = 33.21434759
HOW OFTEN NORMALLY USEINHALANTS
q23g Frequency PercentSeveral times/wk 8 1.49
Several times/mo 5 1.03About once/month 12 2.28
About once/year 14 2.60< once/year 23 4.43Never used 463 88.17
Frequency Missing = 34.589080442
HOW OFTEN NORMALLY USEMARIJUAN
q23h Frequency PercentEvery day 17 3
Several times/wk 14 2Several times/mo 20 3
About once/month 26 5
About once/year 26 5< once/year 28 5Never used 389 74
Frequency Missing = 39.684231077
HOW OFTEN NORMALLY USECOCAIN
q23i Frequency PercentEvery day 1 0
Several times/wk 6
Several times/mo 10 1About once/month 13 2
About once/year 7 < once/year 13 2Never used 477 90
Frequency Missing = 32.992100872
HOW OFTEN NORMALLY USECRAC
q23j Frequency Percent
Several times/mo 2 0About once/month 3 0
About once/year 2 0< once/year 6 Never used 510 97
Frequency Missing = 37.230304786
HOW OFTEN NORMALLY USEHALLUCINOGENS
q23l Frequency Percent
Several times/mo 2 0About once/month 4 0About once/year 1 0
< once/year 3 0Never used 515 98
The frequencies have been weighted so that the analysis reflectsthe distribution of students by grade level in the district
©Copyright 2010, Texas A&M UniversityAll rights reserved.
Page 92 of 99
8/7/2019 REEVES COUNTY - Pecos-Barstow-Toyah ISD _ 2010 Texas School Survey of Drug and Alcohol Use
http://slidepdf.com/reader/full/reeves-county-pecos-barstow-toyah-isd-2010-texas-school-survey-of-drug 93/99
Pecos-Barstow-ToyahSpring 2010
Frequency Missing = 34.817122807
HOW OFTEN NORMALLY USEUPPERS
q23m Frequency PercentEvery day 2 0.29
Several times/wk 4 0.75Several times/mo 2 0.44
About once/month 4 0.82About once/year 1 0.22
< once/year 2 0.47Never used 506 97.01
Frequency Missing = 38.404261027
HOW OFTEN NORMALLY USEDOWNERS
q23n Frequency PercentSeveral times/wk 4 0.75Several times/mo 5 0.97
About once/month 9 1.74About once/year 2 0.38
< once/year 1 0.15Never used 502 96.02
Frequency Missing = 37.023196879
HOW OFTEN NORMALLY USEROHYPNOL
q23o Frequency PercentEvery day 2 0.29
Several times/wk 2 0.45Several times/mo 1 0.17
About once/month 3 0.53< once/year 1 0.15Never used 517 98.41
Frequency Missing = 35.000233061
HOW OFTEN NORMALLY USESTEROIDS
q23p Frequency PercentSeveral times/mo 3 0.62About once/year 1 0.17
< once/year 3 0.54Never used 514 98.67
Frequency Missing = 39.125164985
HOW OFTEN NORMALLY USEECSTASY
q23q Frequency PercentSeveral times/wk 5 0.93Several times/mo 4 0.71
About once/month 3 0.60About once/year 2 0.48
< once/year 9 1.73
Never used 492 95.55
Frequency Missing = 45.026618637
HOW OFTEN NORMALLYUSE HEROIN
q23r Frequency Percent< once/year 2 0.33Never used 520 99.67
Frequency Missing = 38.127452083
AMOUNT OF BEER AT ONETIME
q24a Frequency PercentNever drink this 188 35.54
12+ drinks 64 12.029-11 drinks 34 6.37
5-8 drinks 53 10.003-4 drinks 66 12.40
2 drinks 52 9.881 drink 27 5.16
< 1 drink 46 8.64
Frequency Missing = 31.333392135
AMOUNT OF WINE COOLERSAT ONE TIME
q24b Frequency PercentNever drink this 254 48.
12+ drinks 32 5.9-11 drinks 21 3.
5-8 drinks 37 7.
3-4 drinks 63 11.2 drinks 43 8.1 drink 41 7.
< 1 drink 38 7.
Frequency Missing = 31.665142045
AMOUNT OF WINE AT ONETIM
q24c Frequency PercentNever drink this 293 55.
12+ drinks 16 2.9-11 drinks 9 1
5-8 drinks 12 2.3-4 drinks 29 5.
2 drinks 33 6.1 drink 59 11.
< 1 drink 76 14.
Frequency Missing = 34.376276213
AMOUNT OF LIQUOR AT ONE
TIMq24d Frequency Percent
Never drink this 226 42.12+ drinks 38 7.
9-11 drinks 24 4.5-8 drinks 45 8.3-4 drinks 51 9.
2 drinks 49 9.1 drink 38 7.
< 1 drink 57 10.
Frequency Missing = 33.243919609
The frequencies have been weighted so that the analysis reflectsthe distribution of students by grade level in the district
©Copyright 2010, Texas A&M UniversityAll rights reserved.
Page 93 of 99

8/7/2019 REEVES COUNTY - Pecos-Barstow-Toyah ISD _ 2010 Texas School Survey of Drug and Alcohol Use
http://slidepdf.com/reader/full/reeves-county-pecos-barstow-toyah-isd-2010-texas-school-survey-of-drug 94/99
Pecos-Barstow-ToyahSpring 2010
HOW MANY 5+ DRINKS IN PAST30 DAYS
q25 Frequency PercentNever 5+ at time 169 31.62
None 189 35.551 day 55 10.30
2 days 41 7.70
3 to 5 days 34 6.296 to 9 days 12 2.22
10 or more days 34 6.32
Frequency Missing = 27.081311242
GET ALCOHOLIC BEVERAGESFROM HOME
q26a Frequency PercentDo not Drink 187 35.50
Never 211 39.98
Seldom 94 17.82Most of the Time 27 5.09
Always 8 1.61
Frequency Missing = 33.447387859
GET ALCOHOLIC BEVERAGESFROM FRIENDS
q26b Frequency PercentDo not Drink 156 29.64
Never 75 14.31
Seldom 94 18.01Most of the Time 146 27.90
Always 53 10.14
Frequency Missing = 35.43485487
GET ALCOHOLIC BEVERAGESFROM A STORE
q26c Frequency PercentDo not Drink 173 33.28
Never 244 47.00
Seldom 51 9.90Most of the Time 39 7.48Always 12 2.35
Frequency Missing = 40.583704319
GET ALCOHOLIC BEVERAGESAT PARTIES
q26d Frequency PercentDo not Drink 157 29.83
Never 74 14.00Seldom 64 12.09
Most of the Time 107 20.28Always 125 23.80
Frequency Missing = 32.76785507
GET ALCOHOLIC BEVERAGESFROM OTHER SOURCES
q26e Frequency PercentDo not Drink 175 33.41
Never 127 24.32Seldom 83 15.83
Most of the Time 71 13.58Always 67 12.86
Frequency Missing = 36.942996427
USE MARIJUANA AS JOINTSq27a Frequency Percent
Never 407 77.74Seldom 36 6.90
Half the time 29 5.46Most of the time 20 3.85
Always 23 4.44Don't know 8 1.62
Frequency Missing = 36.119248335
USE MARIJUANA AS BLUNTSq27b Frequency Percent
Never 402 77.57Seldom 41 7.84
Half the time 27 5.28Most of the time 20 3.90
Always 19 3.71Don't know 9 1.70
Frequency Missing = 41.278832822
USE MARIJUANA IN BONGS OR WATER PIPES
q27c Frequency PercentNever 422 81.
Seldom 37 7.Half the time 19 3.
Most of the time 11 2.
Always 21 4.Don't know 10 1.
Frequency Missing = 39.537917366
USE MARIJUANA IN PIPESq27d Frequency Percent
Never 407 78.Seldom 33 6.
Half the time 20 3.Most of the time 24 4.
Always 28 5.Don't know 7 1
Frequency Missing = 41.1105921
USE MARIJUANA OTHER WAYSq27e Frequency Percent
Never 441 84.Seldom 35 6.
Half the time 8 1Most of the time 5 1
Always 11 2.Don't know 23 4.
Frequency Missing = 36.952588638
USED METHAMPHETAMINE EVENONE TI
q28 Frequency PerceNever heard/used 523 9
At least once/month 7 At least once/life 8
Frequency Missing = 22.469620553
The frequencies have been weighted so that the analysis reflectsthe distribution of students by grade level in the district
©Copyright 2010, Texas A&M UniversityAll rights reserved.
Page 94 of 99

8/7/2019 REEVES COUNTY - Pecos-Barstow-Toyah ISD _ 2010 Texas School Survey of Drug and Alcohol Use
http://slidepdf.com/reader/full/reeves-county-pecos-barstow-toyah-isd-2010-texas-school-survey-of-drug 95/99
Pecos-Barstow-ToyahSpring 2010
RECENT PRECRIPTION DRUG USE- CODEINE
q29a Frequency PercentNever heard/used 389 73.88
At least once/month 62 11.84At least once/year 26 4.89
At least once/life 49 9.39
Frequency Missing = 33.323015136
RECENT PRECRIPTION DRUG USE- OXYCONTIN ETC
q29b Frequency PercentNever heard/used 496 96.19
At least once/month 8 1.60At least once/year 1 0.23
At least once/life 10 1.98
Frequency Missing = 44.404817779
RECENT PRECRIPTION DRUG USE- VICODIN ETC
q29c Frequency PercentNever heard/used 480 92.64
At least once/month 17 3.24At least once/year 9 1.77
At least once/life 12 2.36
Frequency Missing = 41.557183945
RECENT PRECRIPTION DRUG USE- VALIUM ETC
q29d Frequency PercentNever heard/used 501 98.00
At least once/month 5 0.93At least once/year 1 0.23
At least once/life 4 0.84
Frequency Missing = 48.41528651
RECENT PRECRIPTION DRUG USE- XANAX ETC
q29e Frequency PercentNever heard/used 497 96.41
At least once/month 8 1.54At least once/year 4 0.76
At least once/life 7 1.29
Frequency Missing = 43.985334781
TAKE DXM, TRIPLE CS, ETC. TOGET HIGH
q30 Frequency PercentNever heard/used 459 87.97
At least once/month 19 3.70At least once/year 13 2.48
At least once/life 31 5.85
Frequency Missing = 38.091048071
DANGEROUS FOR KIDS TOUSE TOBACCO
q31a Frequency PercentVery 271 51.39
Somewhat 130 24.63Not very 56 10.53
Not at all 19 3.55Don't know 52 9.90
Frequency Missing = 32.561910601
DANGEROUS FOR KIDS TOUSE ALCOHOL
q31b Frequency PercentVery 216 41.55
Somewhat 156 30.05Not very 78 14.99
Not at all 33 6.29Don't know 37 7.13
Frequency Missing = 40.736277767
DANGEROUS FOR KIDS TOUSE INHALANTS
q31c Frequency PercentVery 358 69.68
Somewhat 79 15.39Not very 25 4.81
Not at all 4 0.79
Don't know 48 9.33
Frequency Missing = 46.772801277
DANGEROUS FOR KIDS TOUSE MARIJUANA
q31d Frequency PercentVery 318 61.70
Somewhat 76 14.76Not very 43 8.34
Not at all 36 6.97
Don't know 42 8.23
Frequency Missing = 44.031737511
DANGEROUS FOR KIDS TOUSE COCAINE
q31e Frequency PercentVery 384 74.68
Somewhat 56 10.95Not very 18 3.58
Not at all 5 0.92
Don't know 51 9.88
Frequency Missing = 45.512503852
DANGEROUS FOR KIDS TOUSE CRACK
q31f Frequency PercentVery 398 78.31
Somewhat 40 7.85Not very 14 2.83
Not at all 4 0.77
Don't know 52 10.25
Frequency Missing = 51.878986977
The frequencies have been weighted so that the analysis reflectsthe distribution of students by grade level in the district
©Copyright 2010, Texas A&M UniversityAll rights reserved.
Page 95 of 99

8/7/2019 REEVES COUNTY - Pecos-Barstow-Toyah ISD _ 2010 Texas School Survey of Drug and Alcohol Use
http://slidepdf.com/reader/full/reeves-county-pecos-barstow-toyah-isd-2010-texas-school-survey-of-drug 96/99
Pecos-Barstow-ToyahSpring 2010
DANGEROUS FOR KIDS TOUSE ECSTASY
q31g Frequency PercentVery 372 72.43
Somewhat 47 9.12Not very 14 2.82
Not at all 12 2.35
Don't know 68 13.28
Frequency Missing = 45.73475057
DANGEROUS FOR KIDS TOUSE STEROIDS
q31h Frequency PercentVery 378 74.12
Somewhat 50 9.90Not very 20 3.96
Not at all 5 0.93
Don't know 57 11.10
Frequency Missing = 50.26703855
DANGEROUS FOR KIDS TOUSE HEROIN
q31i Frequency PercentVery 409 80.69
Somewhat 31 6.05Not very 10 1.92
Not at all 2 0.48
Don't know 55 10.86
Frequency Missing = 53.339088139
DANGEROUS FOR KIDS TOUSE METHAMPHETAMINE
q31j Frequency PercentVery 407 78.53
Somewhat 28 5.44Not very 13 2.48
Not at all 2 0.32
Don't know 68 13.23
Frequency Missing = 42.271149428
DAYS SKIPPED SINCESEPTEMBER
q32a Frequency PercentNone 446 85.02
1-3 days 64 12.124-9 days 11 2.12
10+ days 4 0.75
Frequency Missing = 35.9657101
DAYS ILL SINCESEPTEMBER
q32b Frequency PercentNone 121 22.93
1-3 days 266 50.504-9 days 113 21.39
10+ days 27 5.18
Frequency Missing = 32.93363262
OTHER REASON FOR DAYS MISSED SINCE
SEPTEMBER q32c Frequency PercentNone 167 32.06
1-3 days 267 51.154-9 days 63 12.07
10+ days 25 4.72
Frequency Missing = 38.590175291
SENT TOPRINCIPAL/DEAN SINCE
SEPTEMBER q32d Frequency PercentNone 441 83.36
1-3 days 65 12.214-9 days 14 2.73
10+ days 9 1.70
Frequency Missing = 31.035539271
SOMEONE CALLEDHOME SINCESEPTEMBER
q32e Frequency PercentNone 473 89.53
1-3 days 43 8.234-9 days 8 1.42
10+ days 4 0.82
Frequency Missing = 32.238432557
IN TROUBLE FOR DRINKING SINCE
SEPTEMBER q32f Frequency Percent
None 510 97.951-3 days 8 1.454-9 days 1 0.15
10+ days 2 0.44
Frequency Missing = 39.790363891
IN TROUBLE FOR DRUGUSE SINCE SEPTEMBER
q32g Frequency PercentNone 511 98.09
1-3 days 6 1.174-9 days 3 0.59
10+ days 1 0.15
Frequency Missing = 39.524518453
TROUBLE WITH FRIENDSBECAUSE OF DRINKING
q33a Frequency PercentNone 463 89.45
1-3 times 50 9.564-9 times 4 0.7010+ times 2 0.29
Frequency Missing = 41.931597603
The frequencies have been weighted so that the analysis reflectsthe distribution of students by grade level in the district
©Copyright 2010, Texas A&M UniversityAll rights reserved.
Page 96 of 99

8/7/2019 REEVES COUNTY - Pecos-Barstow-Toyah ISD _ 2010 Texas School Survey of Drug and Alcohol Use
http://slidepdf.com/reader/full/reeves-county-pecos-barstow-toyah-isd-2010-texas-school-survey-of-drug 97/99
Pecos-Barstow-ToyahSpring 2010
DRIVEN A CAR AFTER AGOOD BIT TO DRINK
q33b Frequency PercentNone 440 85.07
1-3 times 60 11.664-9 times 7 1.44
10+ times 9 1.83
Frequency Missing = 42.663765094
CRITICIZED BY DATEBECAUSE OF DRINKING
q33c Frequency PercentNone 460 88.85
1-3 times 47 9.164-9 times 6 1.14
10+ times 4 0.86
Frequency Missing = 42.362422848
TROUBLE WITH POLICEBECAUSE OF DRINKING
q33d Frequency PercentNone 477 92.83
1-3 times 31 6.094-9 times 5 0.93
10+ times 1 0.15
Frequency Missing = 45.940923507
TROUBLE WITH FRIENDSBECAUSE OF DRUG USE
q33e Frequency PercentNone 477 93.24
1-3 times 30 5.774-9 times 4 0.82
10+ times 1 0.17
Frequency Missing = 48.164801164
DRIVEN A CAR WHILEHIGH FROM DRUGS
q33f Frequency PercentNone 458 90.65
1-3 times 32 6.424-9 times 6 1.15
10+ times 9 1.78
Frequency Missing = 54.339308007
CRITICIZED BY DATEBECAUSE OF DRUG USE
q33g Frequency PercentNone 480 93.76
1-3 times 25 4.804-9 times 3 0.60
10+ times 4 0.83
Frequency Missing = 48.255010472
TROUBLE WITH POLICEBECAUSE OF DRUG USE
q33h Frequency PercentNone 500 97.75
1-3 times 8 1.644-9 times 1 0.23
10+ times 2 0.38
Frequency Missing = 48.993509258
CLASS DAYS DRUNK ONALCOHOL SINCE SEPT
q34a Frequency PercentNone 473 89.94
1-3 days 36 6.884-9 days 7 1.37
10+ days 10 1.82
Frequency Missing = 34.460232416
CLASS DAYS HIGH ONMARIJUANA SINCE SEPT
q34b Frequency PercentNone 480 91.78
1-3 days 30 5.674-9 days 7 1.42
10+ days 6 1.14
Frequency Missing = 37.235800436
CLASS DAYS HIGH ONINHALANTS SINCE SEPT
q34c Frequency PercentNone 507 97.03
1-3 days 9 1.814-9 days 4 0.82
10+ days 2 0.33
Frequency Missing = 37.877530152
CLASS DAYS HIGH ONOTHER DRUG(S)
q34d Frequency PercentNone 485 92.91
1-3 days 27 5.194-9 days 4 0.68
10+ days 6 1.23
Frequency Missing = 37.877530152
ALCOHOL USE AT PARTIESTHIS SCHOOL YEAR
q35a Frequency PercentNever 150 28.
Seldom 45 8.Half the time 44 8.
Most of the time 61 11.Always 141 27.
Don't know 16 3.Didn't attend 66 12.
Frequency Missing = 37.222439427
The frequencies have been weighted so that the analysis reflectsthe distribution of students by grade level in the district
©Copyright 2010, Texas A&M UniversityAll rights reserved.
Page 97 of 99

8/7/2019 REEVES COUNTY - Pecos-Barstow-Toyah ISD _ 2010 Texas School Survey of Drug and Alcohol Use
http://slidepdf.com/reader/full/reeves-county-pecos-barstow-toyah-isd-2010-texas-school-survey-of-drug 98/99

8/7/2019 REEVES COUNTY - Pecos-Barstow-Toyah ISD _ 2010 Texas School Survey of Drug and Alcohol Use
http://slidepdf.com/reader/full/reeves-county-pecos-barstow-toyah-isd-2010-texas-school-survey-of-drug 99/99
Pecos-Barstow-ToyahSpring 2010
DRUG/ALCOHOLINFO--SOCIAL
STUDIES CLASSq38e Frequency PercentNo 386 85.55Yes 65 14.45
Frequency Missing = 108.62437774
DRUG/ALCOHOLINFO--SCHOOL
STUDENT GROUP OR CLUB
q38f Frequency PercentNo 371 82.15Yes 81 17.85
Frequency Missing = 107.92671451
DRUG/ALCOHOLINFO--INVITED
SCHOOL GUESTq38g Frequency PercentNo 199 43.85Yes 255 56.15
Frequency Missing = 105.9121517
DRUG/ALCOHOLINFO--ANOTHER
SCHOOL SOURCEq38h Frequency PercentNo 298 65.71Yes 156 34.29
Frequency Missing = 106.01448795
PARENTS FEEL ABOUT KIDSSMOKING CIGARETTES
q39a Frequency PercentStrong disapprove 362 69.58
Mild disapprove 51 9.74Neither 42 8.14
Mildly approve 12 2.31
Strongly approve 5 0.89Don't know 49 9.35
Frequency Missing = 39.945372746
PARENTS FEEL ABOUT KIDSDRINKING BEER
q39b Frequency PercentStrong disapprove 300 57.97
Mild disapprove 69 13.38Neither 59 11.35
Mildly approve 28 5.43Strongly approve 10 1.98
Don't know 51 9.89
Frequency Missing = 42.225681669
PARENTS FEEL ABOUT KIDSUSING MARIJUANA
q39c Frequency PercentStrong disapprove 410 78.96
Mild disapprove 24 4.58
Neither 19 3.75Mildly approve 8 1.45
Strongly approve 8 1.58Don't know 50 9.68
Frequency Missing = 40.978654015