REDWOODS COMMUNITY COLLEGE DISTRICT of Education Protection Account Expenditures 43 Combining...
75
REDWOODS COMMUNITY COLLEGE DISTRICT Eureka, California FINANCIAL STATEMENTS AND SUPPLEMENTARY INFORMATION WITH INDEPENDENT AUDITORS’ REPORTS June 30, 2014
Transcript of REDWOODS COMMUNITY COLLEGE DISTRICT of Education Protection Account Expenditures 43 Combining...
REDWOODS COMMUNITY COLLEGE DISTRICT
Eureka, California
FINANCIAL STATEMENTS AND SUPPLEMENTARY INFORMATION WITH INDEPENDENT AUDITORS’ REPORTS
June 30, 2014
TABLE OF CONTENTS June 30, 2014
Redwoods CommunityCollege District
PageNumber
Independent Auditors’ Report 1
MANAGEMENT’S DISCUSSION AND ANALYSIS (Required Supplementary Information) 4
FINANCIAL SECTION
Statement of Net Position 12
Statement of Revenues, Expenses, and Changes in Net Position 13
Statement of Cash Flows 14
Notes to the Financial Statements 16
SUPPLEMENTARY INFORMATION SECTION
Organization Structure 35
Schedule of Workload Measures for State General Apportionment 36
Schedule of Expenditures of Federal Awards 37
Schedule of Expenditures of State Awards 38
Reconciliation of Annual Financial and Budget Report (Form CCFS-311) With Audited Financial Statements 39
Reconciliation of 50% Law Calculation 41
Reconciliation of Education Protection Account Expenditures 43
Combining Balance Sheet – District Funds Included in the Reporting Entity 44
Combining Statement of Revenues, Expenditures/Expenses, and Changes in Fund Equity – District Funds Included in the Reporting Entity 48
Reconciliation of Fund Equity to Net Position 52
Reconciliation of Change in Fund Equity to Change in Net Position 53
Notes to the Supplementary Information 54
TABLE OF CONTENTS June 30, 2014
Redwoods CommunityCollege District
PageNumber
OTHER REPORTS SECTION
Independent Auditors’ Report on Internal Control Over Financial Reporting and on Compliance and Other Matters Based on an Audit of Financial Statements Performed in Accordance With Government Auditing Standards 57
Independent Auditors’ Report on Compliance For Each Major Federal Program and on Internal Control Over Compliance Required by OMB Circular A-133 59
Independent Auditors’ Report on State Compliance 61
SCHEDULE OF FINDINGS AND QUESTIONED COSTS SECTION
Schedule of Findings and Questioned Costs 65
Corrective Action Plan 69
Summary Schedule of Prior Audit Findings 70
1
INDEPENDENT AUDITORS’ REPORT
To the Board of Trustees Redwoods Community College District Eureka, California
Report on the Financial Statements
We have audited the accompanying financial statements of the business-type activities and the discretely presented component unit of Redwoods Community College District (the District), as of and for the year ended June 30, 2014, and the related notes to the financial statements, which collectively comprise the District’s basic financial statements as listed in the table of contents.
Management’s Responsibility for the Financial Statements
The District’s management is responsible for the preparation and fair presentation of these financial statements in accordance with accounting principles generally accepted in the United States of America; this includes the design, implementation, and maintenance of internal control relevant to the preparation and fair presentation of financial statements that are free from material misstatement, whether due to fraud or error.
Auditors’ Responsibility
Our responsibility is to express opinions on these financial statements based on our audit. We conducted our audit in accordance with auditing standards generally accepted in the United States of America and the standards applicable to financial audits contained in Government Auditing Standards, issued by the Comptroller General of the United States. Those standards require that we plan and perform the audit to obtain reasonable assurance about whether the financial statements are free of material misstatement.
An audit involves performing procedures to obtain audit evidence about the amounts and disclosures in the financial statements. The procedures selected depend on the auditors’ judgment, including the assessment of the risks of material misstatement of the financial statements, whether due to fraud or error. In making those risk assessments, the auditor considers internal control relevant to the District’s preparation and fair presentation of the financial statements in order to design audit procedures that are appropriate in the circumstances, but not for the purpose of expressing an opinion on the effectiveness of the District’s internal control. Accordingly, we express no such opinion. An audit also includes evaluating the appropriateness of accounting policies used and the reasonableness of significant accounting estimates made by management, as well as evaluating the overall presentation of the financial statements.
We believe that the audit evidence we have obtained is sufficient and appropriate to provide a basis for our audit opinions.
Opinion
In our opinion, the financial statements referred to above present fairly, in all material respects, the respective financial position of the business-type activities and the discretely presented component unit of the District as of June 30, 2014, and the respective changes in financial position and cash flows thereof for the year then ended in accordance with accounting principles generally accepted in the United States of America.
2
INDEPENDENT AUDITORS’ REPORT Continued
Other Matters
Required Supplementary Information
Accounting principles generally accepted in the United States of America require that the management’s discussion and analysis on pages 4 through 10 be presented to supplement the basic financial statements. Such information, although not a part of the basic financial statements, is required by the Governmental Accounting Standards Board who considers it to be an essential part of financial reporting for placing the basic financial statements in an appropriate operational, economic, or historical context. We have applied certain limited procedures to the required supplementary information in accordance with auditing standards generally accepted in the United States of America, which consisted of inquiries of management about the methods of preparing the information and comparing the information for consistency with management’s responses to our inquiries, the basic financial statements, and other knowledge we obtained during our audit of the basic financial statements. We do not express an opinion or provide any assurance on the information because the limited procedures do not provide us with sufficient evidence to express an opinion or provide any assurance.
Other Information
Our audit was conducted for the purpose of forming opinions on the financial statements that collectively comprise the District’s basic financial statements. The accompanying supplementary information listed as supplementary information in the table of contents and the schedule of expenditures of federal awards, as required by the U.S. Office of Management and Budget Circular A-133, Audits of States, Local Governments, and Non-Profit Organizations, are presented for purposes of additional analysis and are not a required part of the basic financial statements.
The supplementary information and the schedule of expenditures of federal awards are the responsibility of management and were derived from and relate directly to the underlying accounting and other records used to prepare the basic financial statements. Such information has been subjected to the auditing procedures applied in the audit of the basic financial statements and certain additional procedures, including comparing and reconciling such information directly to the underlying accounting and other records used to prepare the basic financial statements or to the basic financial statements themselves, and other additional procedures in accordance with auditing standards generally accepted in the United States of America. In our opinion, the supplementary information and the schedule of expenditures of federal awards are fairly stated, in all material respects, in relation to the financial statements as a whole.
Other Reporting Required by Government Auditing Standards
In accordance with Government Auditing Standards, we have also issued our report dated December 30, 2014, on our consideration of the District’s internal control over financial reporting and on our tests of its compliance with certain provisions of laws, regulations, contracts, grant agreements, and other matters. The purpose of that report is to describe the scope of our testing of internal control over financial reporting and compliance and the results of that testing, and not to provide an opinion on internal control over financial reporting or on compliance. That report is an integral part of an audit performed in accordance with Government Auditing Standards in considering the District’s internal control over financial reporting and compliance.
December 30, 2014 Redding, California

MANAGEMENT’S DISCUSSION AND ANALYSIS (Required Supplementary Information)

MANAGEMENT’S DISCUSSION AND ANALYSIS June 30, 2014
Redwoods CommunityCollege District
4
INTRODUCTION
As required by accounting principles, the annual report consists of three basic financial statements that provide information on Redwoods Community College District (the District) as a whole: the statement of net position; the statement of revenues, expenses, and changes in net position; and the statement of cash flows. The information provided in the management’s discussion and analysis includes all funds except the College of the Redwoods Foundation. Each statement will be discussed separately.
Under the business-type activities model of financial reporting, a single entity-wide statement is required to report financial activity for all funds of the District. As this is a variance from the previous fund-type presentation, the following information is provided to help with the understanding of the financial statements.
ATTENDANCE HIGHLIGHTS
The District’s resident Full-Time Equivalent Students (FTES) for Fiscal Year 2013-14 stood at 3,774. The Chancellor’s Office set the District’s resident funded FTES cap at 4,383 for Fiscal Year 2013-14. The Chancellor’s Office provided stability funding in Fiscal Year 2013-14 for the 609 FTES shortfall.
Academic Year
ResidentNon-
ResidentTotal Resident
Non-Resident
Total
2007-08 4,744 179 4,923 5.8% 31.6% 6.6%2008-09 5,273 210 5,483 11.2% 17.3% 11.4%2009-10 5,542 231 5,773 5.1% 10.0% 5.3%2010-11 5,220 233 5,453 -5.8% 0.9% -5.5%2011-12 4,535 198 4,733 -13.1% -15.0% -13.2%2012-13 4,383 176 4,559 -3.4% -11.1% -3.7%2013-14 3,774 174 3,948 -13.9% -1.1% -13.4%
Credit/Non-credit Resident and Non-resident Students
Percentage Change
2007-08 2008-09 2009-10 2010-11 2011-12 2012-13 2013-14
Non-Resident 179 210 231 233 198 176 174
Resident 4,744 5,273 5,542 5,220 4,535 4,383 3,774
-
1,000
2,000
3,000
4,000
5,000
6,000
7,000
FTES
Annual FTESResident and Non‐resident Students
MANAGEMENT’S DISCUSSION AND ANALYSIS June 30, 2014
Redwoods CommunityCollege District
5
STATEMENT OF NET POSITION
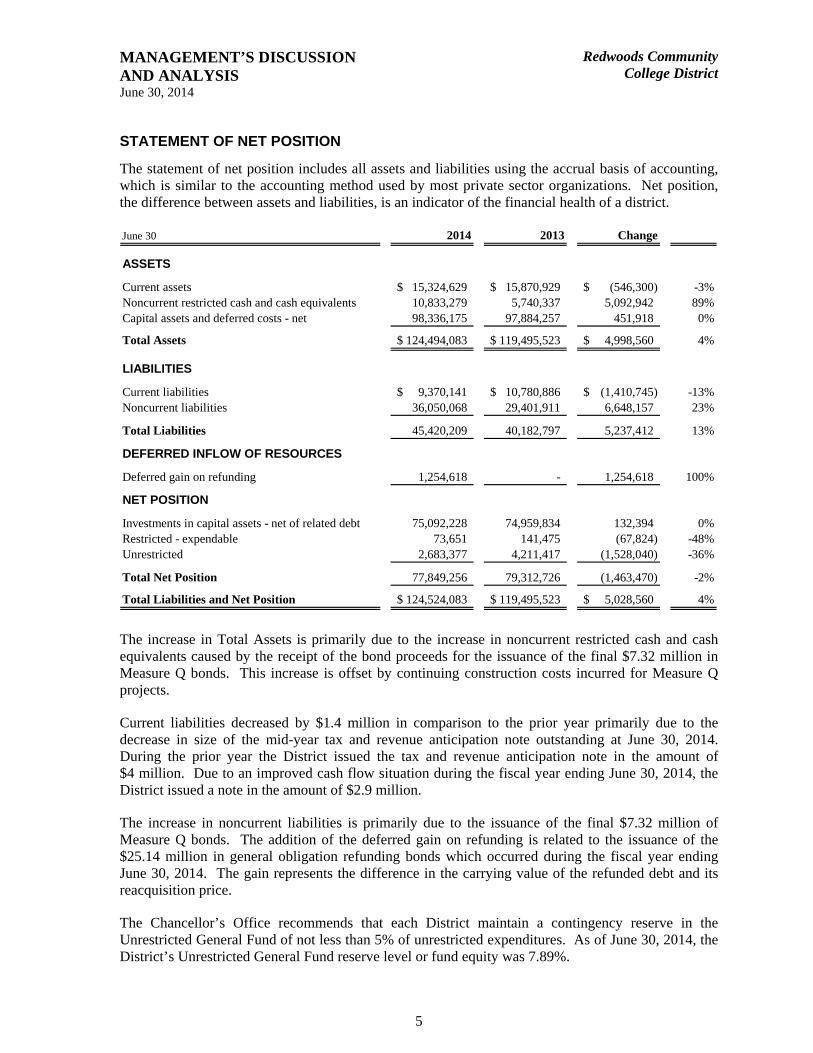
The statement of net position includes all assets and liabilities using the accrual basis of accounting, which is similar to the accounting method used by most private sector organizations. Net position, the difference between assets and liabilities, is an indicator of the financial health of a district.
June 30 2014 2013 Change
ASSETS
Current assets 15,324,629$ 15,870,929$ (546,300)$ -3%Noncurrent restricted cash and cash equivalents 10,833,279 5,740,337 5,092,942 89%Capital assets and deferred costs - net 98,336,175 97,884,257 451,918 0%
Total Assets 124,494,083$ 119,495,523$ 4,998,560$ 4%
LIABILITIES
Current liabilities 9,370,141$ 10,780,886$ (1,410,745)$ -13%Noncurrent liabilities 36,050,068 29,401,911 6,648,157 23%
Total Liabilities 45,420,209 40,182,797 5,237,412 13%
DEFERRED INFLOW OF RESOURCES
Deferred gain on refunding 1,254,618 - 1,254,618 100%
NET POSITION
Investments in capital assets - net of related debt 75,092,228 74,959,834 132,394 0%Restricted - expendable 73,651 141,475 (67,824) -48%Unrestricted 2,683,377 4,211,417 (1,528,040) -36%
Total Net Position 77,849,256 79,312,726 (1,463,470) -2%
Total Liabilities and Net Position 124,524,083$ 119,495,523$ 5,028,560$ 4%
The increase in Total Assets is primarily due to the increase in noncurrent restricted cash and cash equivalents caused by the receipt of the bond proceeds for the issuance of the final $7.32 million in Measure Q bonds. This increase is offset by continuing construction costs incurred for Measure Q projects.
Current liabilities decreased by $1.4 million in comparison to the prior year primarily due to the decrease in size of the mid-year tax and revenue anticipation note outstanding at June 30, 2014. During the prior year the District issued the tax and revenue anticipation note in the amount of $4 million. Due to an improved cash flow situation during the fiscal year ending June 30, 2014, the District issued a note in the amount of $2.9 million.
The increase in noncurrent liabilities is primarily due to the issuance of the final $7.32 million of Measure Q bonds. The addition of the deferred gain on refunding is related to the issuance of the $25.14 million in general obligation refunding bonds which occurred during the fiscal year ending June 30, 2014. The gain represents the difference in the carrying value of the refunded debt and its reacquisition price.
The Chancellor’s Office recommends that each District maintain a contingency reserve in the Unrestricted General Fund of not less than 5% of unrestricted expenditures. As of June 30, 2014, the District’s Unrestricted General Fund reserve level or fund equity was 7.89%.
MANAGEMENT’S DISCUSSION AND ANALYSIS June 30, 2014
Redwoods CommunityCollege District
6
The District has elected to record its actuarially determined annual liability for postemployment health benefits according to GASB 45. Through changes in board policy and collective bargaining contracts, newly hired employees will no longer participate in this program. For eligible plan participants, the District funds the current service liability, and may make annual contributions for its prior service liability. The District intends to continue to set funds aside to meet its unfunded accrued liability. The most recent actuarial study of retiree health liabilities was as of October 16, 2013. The unfunded liability is estimated to be $6.4 million. The funds set aside to pay future benefits stood at $1.9 million at June 30, 2014.
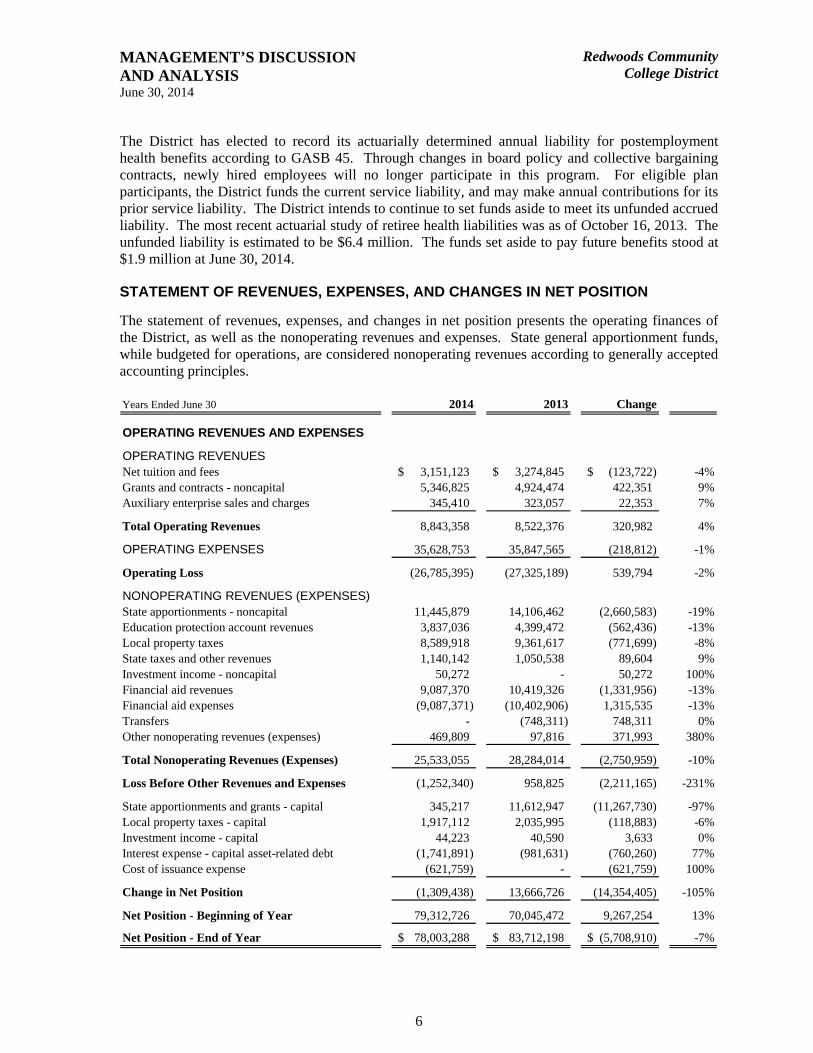
STATEMENT OF REVENUES, EXPENSES, AND CHANGES IN NET POSITION
The statement of revenues, expenses, and changes in net position presents the operating finances of the District, as well as the nonoperating revenues and expenses. State general apportionment funds, while budgeted for operations, are considered nonoperating revenues according to generally accepted accounting principles.
Years Ended June 30 2014 2013 Change
OPERATING REVENUES AND EXPENSES
OPERATING REVENUES Net tuition and fees 3,151,123$ 3,274,845$ (123,722)$ -4%Grants and contracts - noncapital 5,346,825 4,924,474 422,351 9%Auxiliary enterprise sales and charges 345,410 323,057 22,353 7%
Total Operating Revenues 8,843,358 8,522,376 320,982 4%
OPERATING EXPENSES 35,628,753 35,847,565 (218,812) -1%
Operating Loss (26,785,395) (27,325,189) 539,794 -2%
NONOPERATING REVENUES (EXPENSES)State apportionments - noncapital 11,445,879 14,106,462 (2,660,583) -19%Education protection account revenues 3,837,036 4,399,472 (562,436) -13%Local property taxes 8,589,918 9,361,617 (771,699) -8%State taxes and other revenues 1,140,142 1,050,538 89,604 9%Investment income - noncapital 50,272 - 50,272 100%Financial aid revenues 9,087,370 10,419,326 (1,331,956) -13%Financial aid expenses (9,087,371) (10,402,906) 1,315,535 -13%Transfers - (748,311) 748,311 0%Other nonoperating revenues (expenses) 469,809 97,816 371,993 380%
Total Nonoperating Revenues (Expenses) 25,533,055 28,284,014 (2,750,959) -10%
Loss Before Other Revenues and Expenses (1,252,340) 958,825 (2,211,165) -231%
State apportionments and grants - capital 345,217 11,612,947 (11,267,730) -97%Local property taxes - capital 1,917,112 2,035,995 (118,883) -6%Investment income - capital 44,223 40,590 3,633 0%Interest expense - capital asset-related debt (1,741,891) (981,631) (760,260) 77%Cost of issuance expense (621,759) - (621,759) 100%
Change in Net Position (1,309,438) 13,666,726 (14,354,405) -105%
Net Position - Beginning of Year 79,312,726 70,045,472 9,267,254 13%
Net Position - End of Year 78,003,288$ 83,712,198$ (5,708,910)$ -7%
MANAGEMENT’S DISCUSSION AND ANALYSIS June 30, 2014
Redwoods CommunityCollege District
7
Operating revenues decreased by approximately $320 thousand in Fiscal Year 2014. This is due to an increase in state categorical funding including the restoration of both instructional equipment and scheduled maintenance funding along with an increase in student success program funding. Operating expenses have decreased which is discussed in more detail in the Operating Expenses portion of this report.
The transfer of $748,311 in the prior year represented the transfer of bookstore and residence hall operations from the District to the Foundation. There are no transfers in the current fiscal year. The 502% increase in other nonoperating revenues is attributable to rental income and reimbursement by Follett for District staff working at the Bookstore. The 97% decrease in State apportionments and grants, capital is due to the completion of the new academic building and the student services, administration and theater state bond construction projects. This line item will increase once we begin receiving state reimbursements for the utility infrastructure project.
The State’s SB361 funding formula allocates apportionment funding to 72 community college districts through two calculations. For Fiscal Year 2013-14, the District’s total apportionment was $25.1 million. First, basic funding is provided to each District and approved center at a scheduled rate, with additional funding provided to rural districts. For Fiscal Year 2013-14, the District received $4.7 million in basic funding, comprised of $3.3 million for the District, $830 thousand for the Mendocino and Del Norte centers and $554 thousand for rural district support.
Second, the Chancellor’s Office caps each district’s level of funded full-time equivalent students or FTES (One FTES equals 30 credits per year). The SB361 formula calculates funding for the Chancellor’s Office’s FTES cap at a statewide rate of $4,564 per credit FTES in Fiscal Year 2013-14, or $ 20 million for the District’s 4,383 FTES cap.
Then the formula offsets the state’s apportionment liability by all enrollment fees assessed, including enrollment fees paid by students in excess of the Chancellor’s FTES cap and all non-residents, as well as all eligible property taxes received by the District. The District’s enrollment revenue was $1.2 million and property taxes were $8.8 million. Finally, in years when the Chancellor’s Office experiences a statewide funding shortfall, the Chancellor reduces all of the FTES-based apportionment funding on a pro-rata basis across all but the smallest community college districts, referred to as a deficit coefficient. As a result of a funding shortfall in Fiscal Year 2013-14, the Chancellor’s deficit coefficient reduced the District’s funding by $275 thousand to balance the statewide apportionment funding model. State funding is then provided for any apportionment needed after all offsets and deficit coefficients have been applied, which amounted to $10.9 million for the District in Fiscal Year 2013-14.
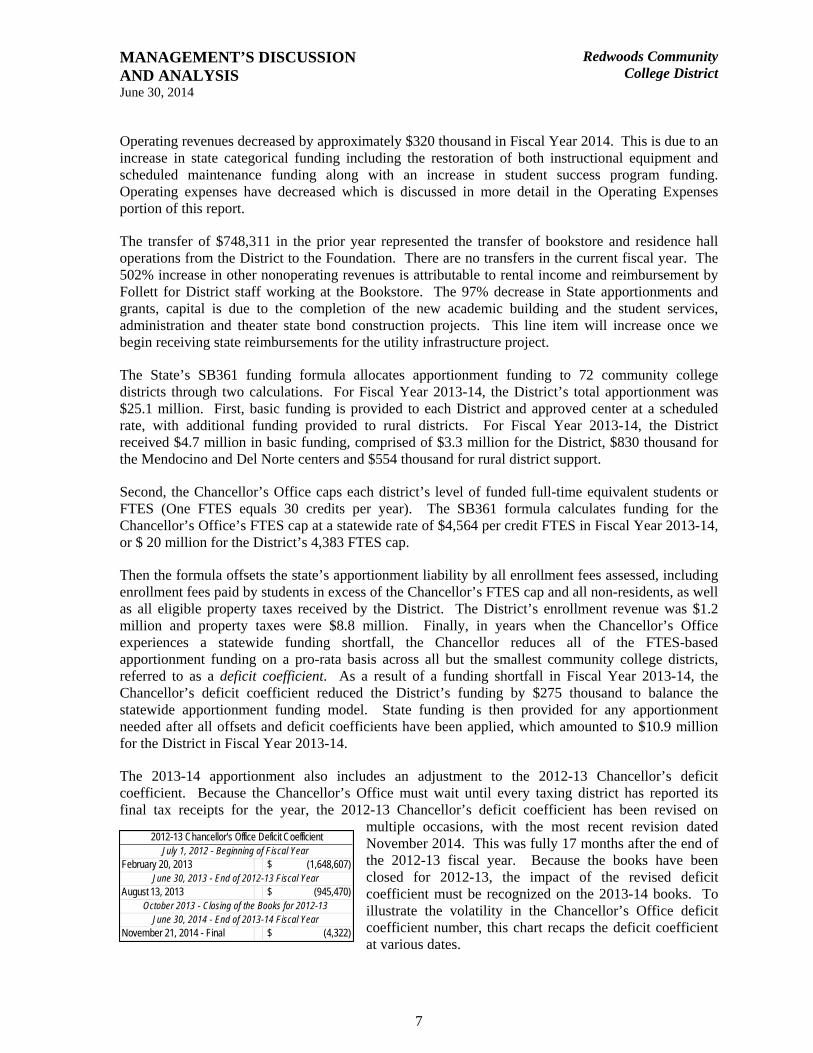
The 2013-14 apportionment also includes an adjustment to the 2012-13 Chancellor’s deficit coefficient. Because the Chancellor’s Office must wait until every taxing district has reported its final tax receipts for the year, the 2012-13 Chancellor’s deficit coefficient has been revised on
multiple occasions, with the most recent revision dated November 2014. This was fully 17 months after the end of the 2012-13 fiscal year. Because the books have been closed for 2012-13, the impact of the revised deficit coefficient must be recognized on the 2013-14 books. To illustrate the volatility in the Chancellor’s Office deficit coefficient number, this chart recaps the deficit coefficient at various dates.
February 20, 2013 (1,648,607)$
August 13, 2013 (945,470)$
November 21, 2014 - Final (4,322)$
June 30, 2013 - End of 2012-13 Fiscal Year
July 1, 2012 - Beginning of Fiscal Year
October 2013 - Closing of the Books for 2012-13
2012-13 Chancellor's Office Deficit Coefficient
June 30, 2014 - End of 2013-14 Fiscal Year
MANAGEMENT’S DISCUSSION AND ANALYSIS June 30, 2014
Redwoods CommunityCollege District
8
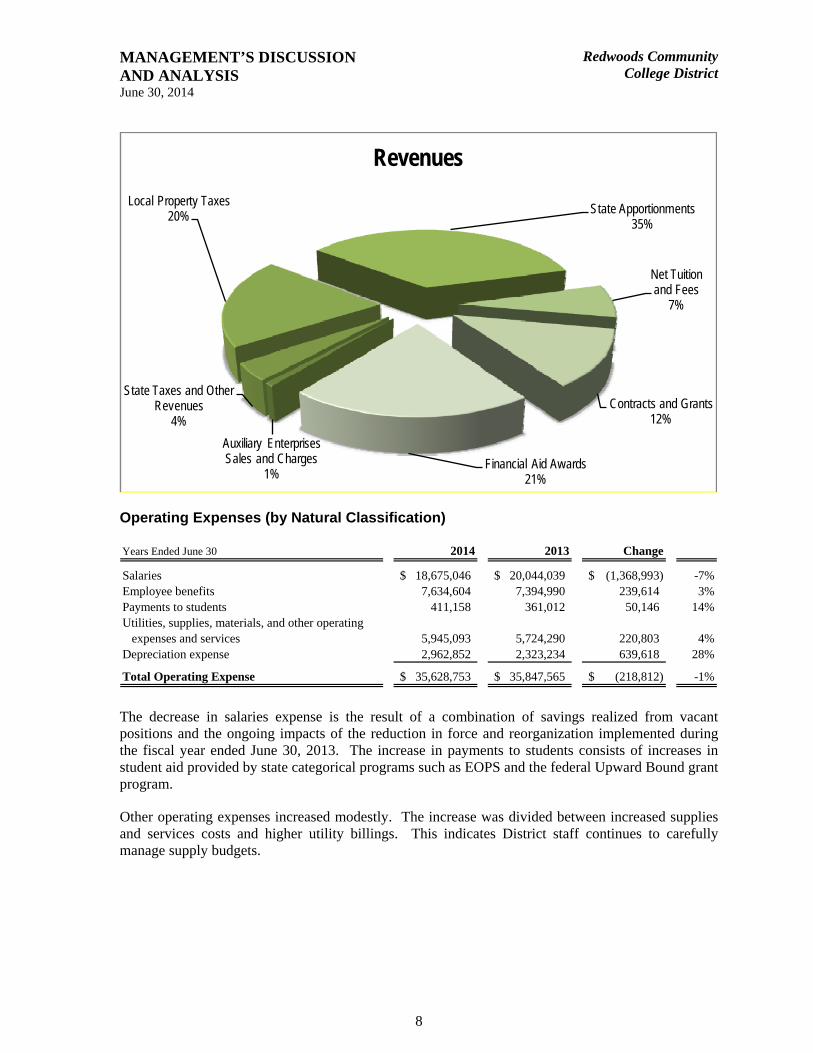
Auxiliary Enterprises Sales and Charges
1%
State Taxes and Other Revenues
4%
Local Property Taxes20% State Apportionments
35%
Net Tuition and Fees
7%
Contracts and Grants12%
Financial Aid Awards21%
Revenues
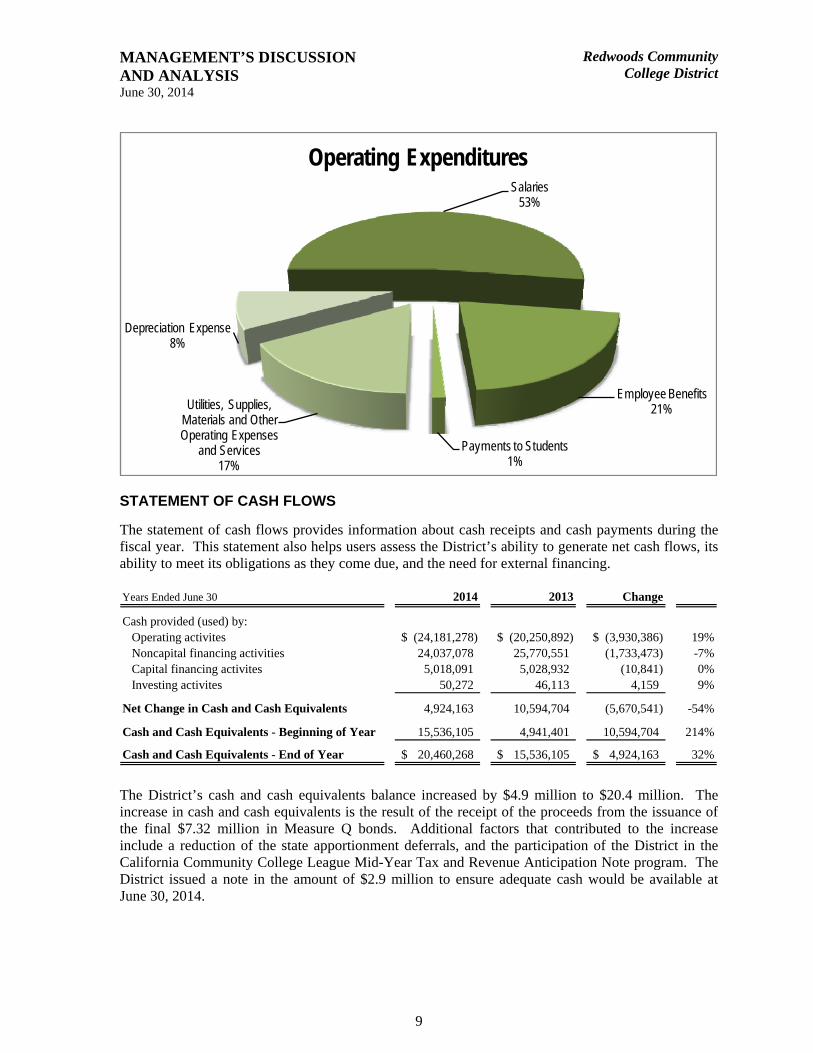
Operating Expenses (by Natural Classification)
Years Ended June 30 2014 2013 Change
Salaries 18,675,046$ 20,044,039$ (1,368,993)$ -7%Employee benefits 7,634,604 7,394,990 239,614 3%Payments to students 411,158 361,012 50,146 14%Utilities, supplies, materials, and other operating
expenses and services 5,945,093 5,724,290 220,803 4%Depreciation expense 2,962,852 2,323,234 639,618 28%
Total Operating Expense 35,628,753$ 35,847,565$ (218,812)$ -1%
The decrease in salaries expense is the result of a combination of savings realized from vacant positions and the ongoing impacts of the reduction in force and reorganization implemented during the fiscal year ended June 30, 2013. The increase in payments to students consists of increases in student aid provided by state categorical programs such as EOPS and the federal Upward Bound grant program.
Other operating expenses increased modestly. The increase was divided between increased supplies and services costs and higher utility billings. This indicates District staff continues to carefully manage supply budgets.
MANAGEMENT’S DISCUSSION AND ANALYSIS June 30, 2014
Redwoods CommunityCollege District
9
Salaries53%
Employee Benefits21%
Payments to Students1%
Utilities, Supplies, Materials and Other Operating Expenses
and Services17%
Depreciation Expense8%
Operating Expenditures
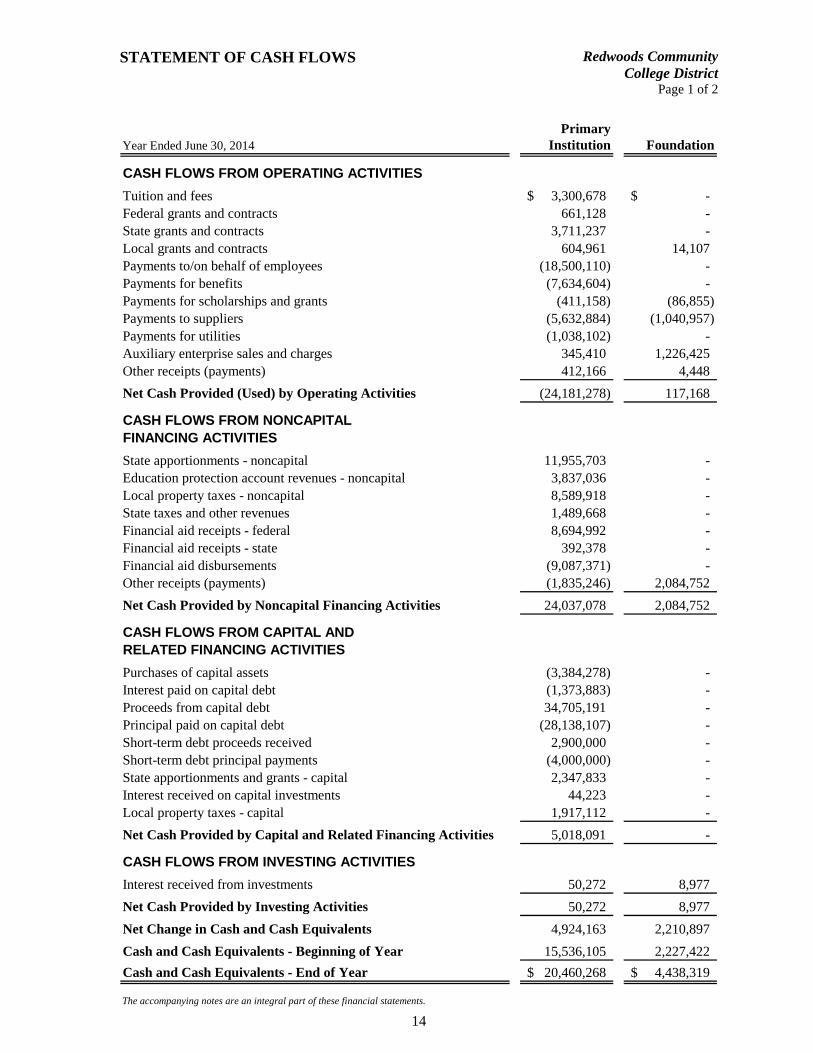
STATEMENT OF CASH FLOWS
The statement of cash flows provides information about cash receipts and cash payments during the fiscal year. This statement also helps users assess the District’s ability to generate net cash flows, its ability to meet its obligations as they come due, and the need for external financing.
Years Ended June 30 2014 2013 Change
Cash provided (used) by:Operating activites (24,181,278)$ (20,250,892)$ (3,930,386)$ 19%Noncapital financing activities 24,037,078 25,770,551 (1,733,473) -7%Capital financing activites 5,018,091 5,028,932 (10,841) 0%Investing activites 50,272 46,113 4,159 9%
Net Change in Cash and Cash Equivalents 4,924,163 10,594,704 (5,670,541) -54%
Cash and Cash Equivalents - Beginning of Year 15,536,105 4,941,401 10,594,704 214%
Cash and Cash Equivalents - End of Year 20,460,268$ 15,536,105$ 4,924,163$ 32%
The District’s cash and cash equivalents balance increased by $4.9 million to $20.4 million. The increase in cash and cash equivalents is the result of the receipt of the proceeds from the issuance of the final $7.32 million in Measure Q bonds. Additional factors that contributed to the increase include a reduction of the state apportionment deferrals, and the participation of the District in the California Community College League Mid-Year Tax and Revenue Anticipation Note program. The District issued a note in the amount of $2.9 million to ensure adequate cash would be available at June 30, 2014.
MANAGEMENT’S DISCUSSION AND ANALYSIS June 30, 2014
Redwoods CommunityCollege District
10
ECONOMIC FACTORS THAT MAY AFFECT THE FUTURE
The District’s Fiscal Year 2013-14 ending unrestricted fund equity rose to 7.89%. District reorganizations and one-time concessions from bargaining unit employees, unrepresented employees and the Board of Trustees helped to balance the Fiscal Year 2013-14 budget. However, the largest contributors to the increased fund balance were one-time temporary savings, both from vacant positions as well as continued favorable services and supplies spending patterns across the District. The District’s accreditation status remains positive, and the State Special Trustee departed after the District demonstrated positive fiscal improvements. The District continues to remain fiscally sound through careful budget planning. However, without increased student enrollments, it is exceedingly difficult to find a multiyear budget solution that both fosters fiscal solvency and avoids continued expenditure budget reductions.
The College’s student enrollment numbers have continued to decline significantly each year since 2009-10. Resident enrollments have contracted by -1,758 FTES or -31.9% from a high of 5,542 FTES in 2009-10 to a low of 3,774 in 2013-14. The single most important mission critical priority for long term District fiscal solvency is to stabilize and begin small annual restorations of student enrollments.
State voters passed proposition 30 which is providing some additional resources to community colleges. However, the District has not fully benefited from this new funding source due to student enrollment growth requirements. State funding did not provide for a statewide inflation adjustment or COLA in 2008-09, 2009-10, 2010-11, and 2011-12. For Fiscal Year 2012-13 the State provided a 1.6% COLA. In Fiscal Year 2013-14, the State provided a 0.85% COLA which was insufficient to cover the District’s base cost increases of 1.6% to 2.0% annually.
The District’s finances will continue to be positioned for the probability of austerity budgets for the near term, due to sluggish student enrollment results. With long term capital investments, most notably two new buildings recently completed at the Eureka main campus and other projects district wide, the District is also being positioned to capitalize on opportunities in the future as the State’s economic outlook eventually improves and the District stabilizes its enrollments in a sustainable manner.

FINANCIAL SECTION
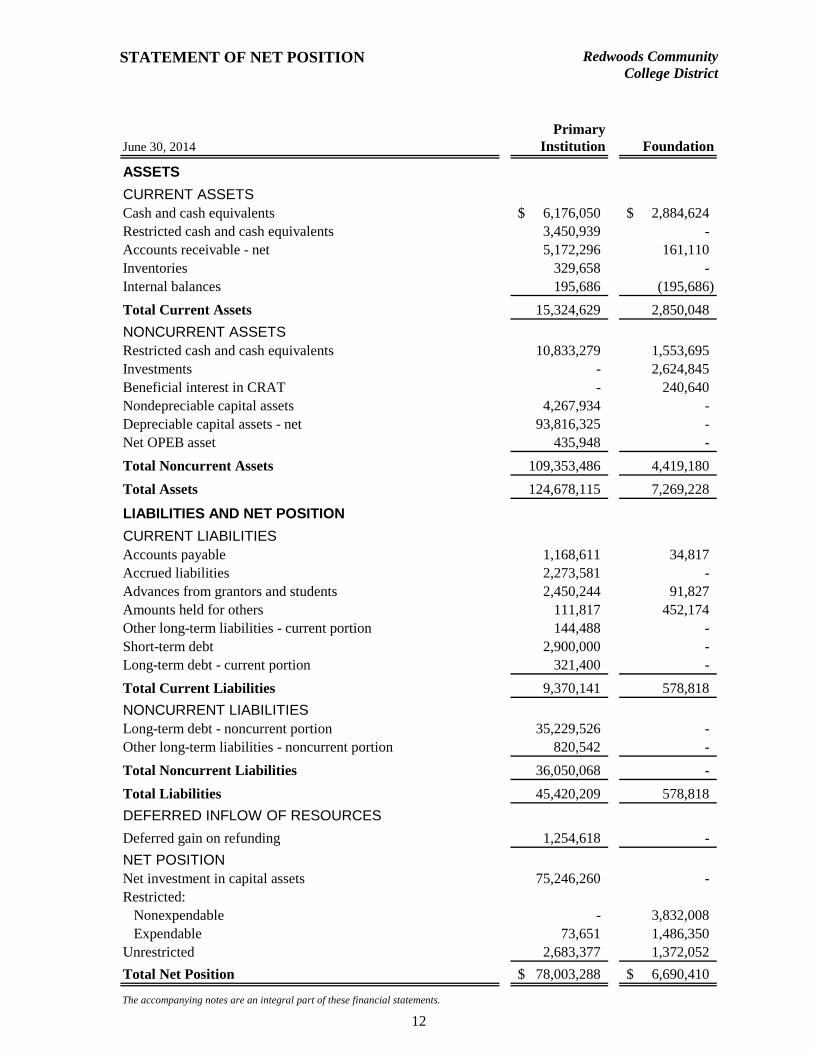
STATEMENT OF NET POSITION
Redwoods CommunityCollege District
12
PrimaryJune 30, 2014 Institution Foundation
ASSETS
CURRENT ASSETSCash and cash equivalents 6,176,050$ 2,884,624$ Restricted cash and cash equivalents 3,450,939 - Accounts receivable - net 5,172,296 161,110 Inventories 329,658 - Internal balances 195,686 (195,686)
Total Current Assets 15,324,629 2,850,048
NONCURRENT ASSETSRestricted cash and cash equivalents 10,833,279 1,553,695 Investments - 2,624,845 Beneficial interest in CRAT - 240,640 Nondepreciable capital assets 4,267,934 - Depreciable capital assets - net 93,816,325 - Net OPEB asset 435,948 -
Total Noncurrent Assets 109,353,486 4,419,180
Total Assets 124,678,115 7,269,228
LIABILITIES AND NET POSITION
CURRENT LIABILITIESAccounts payable 1,168,611 34,817 Accrued liabilities 2,273,581 - Advances from grantors and students 2,450,244 91,827 Amounts held for others 111,817 452,174 Other long-term liabilities - current portion 144,488 - Short-term debt 2,900,000 - Long-term debt - current portion 321,400 -
Total Current Liabilities 9,370,141 578,818
NONCURRENT LIABILITIESLong-term debt - noncurrent portion 35,229,526 - Other long-term liabilities - noncurrent portion 820,542 -
Total Noncurrent Liabilities 36,050,068 -
Total Liabilities 45,420,209 578,818
DEFERRED INFLOW OF RESOURCES
Deferred gain on refunding 1,254,618 -
NET POSITIONNet investment in capital assets 75,246,260 - Restricted:
Nonexpendable - 3,832,008 Expendable 73,651 1,486,350
Unrestricted 2,683,377 1,372,052
Total Net Position 78,003,288$ 6,690,410$
The accompanying notes are an integral part of these financial statements.

STATEMENT OF REVENUES, EXPENSES, AND CHANGES IN NET POSITION
Redwoods CommunityCollege District
13
PrimaryYear Ended June 30, 2014 Institution Foundation
OPERATING REVENUESTuition and fees 6,283,546$ -$ Less: Scholarship discounts and allowances (3,132,423) -
Tuition and Fees - Net 3,151,123 -
Grants and contracts - noncapital:Federal 1,348,070 - State 3,428,479 - Local 570,276 14,107
Auxiliary enterprise sales and charges 345,410 1,226,425
Total Operating Revenues 8,843,358 1,240,532
OPERATING EXPENSESSalaries 18,675,046 - Employee benefits 7,634,604 - Supplies, materials, and other operating expenses and services 4,906,991 1,004,190 Utilities 1,038,102 - Depreciation 2,962,852 - Payments to students 411,158 170,668
Total Operating Expenses 35,628,753 1,174,858
Operating Income (Loss) (26,785,395) 65,674
NONOPERATING REVENUES (EXPENSES)State apportionments - noncapital 11,445,879 - Education protection account revenues 3,837,036 - Local property taxes - noncapital 8,589,918 - State taxes and other revenues - noncapital 1,140,142 - Investment income - noncapital 50,272 480,485 Financial aid revenues - federal 8,694,992 - Financial aid revenues - state 392,378 - Financial aid disbursements (9,087,371) - Other nonoperating revenues (expenses) - noncapital 469,809 249,506
Total Nonoperating Revenues (Expenses) 25,533,055 729,991
Income (Loss) Before Other Revenue, Expenses, Gains, or Losses (1,252,340) 795,665
OTHER REVENUES, EXPENSES, GAINS, OR LOSSESState apportionments - capital 345,217 - Local property taxes and revenue- capital 1,917,112 - Interest expense - capital asset-related debt (1,741,891) - Cost of issuance expense - capital (621,759) - Investment income - capital 44,223 -
Total Other Revenues, Expenses, Gains, or Losses (57,098) -
Change in Net Position (1,309,438) 795,665
Net Position - Beginning of Year 79,312,726 5,894,745
Net Position - End of Year 78,003,288$ 6,690,410$
The accompanying notes are an integral part of these financial statements.
STATEMENT OF CASH FLOWS
Redwoods CommunityCollege District
Page 1 of 2
14
PrimaryYear Ended June 30, 2014 Institution Foundation
CASH FLOWS FROM OPERATING ACTIVITIES
Tuition and fees 3,300,678$ -$ Federal grants and contracts 661,128 - State grants and contracts 3,711,237 - Local grants and contracts 604,961 14,107 Payments to/on behalf of employees (18,500,110) - Payments for benefits (7,634,604) - Payments for scholarships and grants (411,158) (86,855) Payments to suppliers (5,632,884) (1,040,957) Payments for utilities (1,038,102) - Auxiliary enterprise sales and charges 345,410 1,226,425 Other receipts (payments) 412,166 4,448
Net Cash Provided (Used) by Operating Activities (24,181,278) 117,168
CASH FLOWS FROM NONCAPITALFINANCING ACTIVITIES
State apportionments - noncapital 11,955,703 - Education protection account revenues - noncapital 3,837,036 - Local property taxes - noncapital 8,589,918 - State taxes and other revenues 1,489,668 - Financial aid receipts - federal 8,694,992 - Financial aid receipts - state 392,378 - Financial aid disbursements (9,087,371) - Other receipts (payments) (1,835,246) 2,084,752
Net Cash Provided by Noncapital Financing Activities 24,037,078 2,084,752
CASH FLOWS FROM CAPITAL AND RELATED FINANCING ACTIVITIES
Purchases of capital assets (3,384,278) - Interest paid on capital debt (1,373,883) - Proceeds from capital debt 34,705,191 - Principal paid on capital debt (28,138,107) - Short-term debt proceeds received 2,900,000 - Short-term debt principal payments (4,000,000) - State apportionments and grants - capital 2,347,833 - Interest received on capital investments 44,223 - Local property taxes - capital 1,917,112 -
Net Cash Provided by Capital and Related Financing Activities 5,018,091 -
CASH FLOWS FROM INVESTING ACTIVITIES
Interest received from investments 50,272 8,977
Net Cash Provided by Investing Activities 50,272 8,977
Net Change in Cash and Cash Equivalents 4,924,163 2,210,897
Cash and Cash Equivalents - Beginning of Year 15,536,105 2,227,422
Cash and Cash Equivalents - End of Year 20,460,268$ 4,438,319$
The accompanying notes are an integral part of these financial statements.

STATEMENT OF CASH FLOWS
Redwoods Community College District
Page 2 of 2
15
PrimaryYear Ended June 30, 2014 Institution Foundation
RECONCILIATION OF OPERATING INCOME (LOSS) TO NETCASH USED BY OPERATING ACTIVITIES
Operating income (loss) (26,785,395)$ 65,674$ Adjustments to reconcile operating income (loss) to net cash
used by operating activities:Depreciation expense 2,962,852 - Other receipts 469,809 - Changes in:
Accounts receivable - net (547,367) 20,388 Inventories (11,360) - Net OPEB asset (116,638) - Accounts payable (816,709) (36,767) Accrued liabilities 183,880 (2,644) Advances from grantors and students 216,376 83,813 Amounts held for others 53,404 (13,296) Other long-term liabilities 209,870 -
Net Cash Provided (Used) by Operating Activities (24,181,278)$ 117,168$
COMPONENTS OF CASH AND CASH EQUIVALENTS
Cash and cash equivalents 6,176,050$ 2,884,624$ Restricted cash and cash equivalents - current 3,450,939 - Restricted cash and cash equivalents - noncurrent 10,833,279 1,553,695
Total Cash and Cash Equivalents 20,460,268$ 4,438,319$
The accompanying notes are an integral part of these financial statements.

NOTES TO THE FINANCIAL STATEMENTS June 30, 2014
Redwoods CommunityCollege District
16
1. SUMMARY OF SIGNIFICANT ACCOUNTING POLICIES
Reporting Entity Redwoods Community College District (the District) is a political subdivision of the State of California and provides higher education in portions of four counties. The District consists of one community college with two educational centers and three branches located throughout the service area.
For financial reporting purposes, the District includes all funds, agencies, and authorities that are controlled by or dependent on the District’s executive and legislative branches. Control by or dependence on the District was determined on the basis of budget adoption, taxing authority, outstanding debt secured by revenues or general obligations of the District, obligations of the District to finance any deficits that may occur, or receipt of significant subsidies from the District.
The financial statements of the District include the financial activities of the District and the combined totals of the trust and agency funds, which represent the various scholarships and student organizations within the District.
The College of the Redwoods Financing Corporation (the Corporation) and the College of the Redwoods Foundation (the Foundation), collectively known as the Component Units, have financial and operational relationships that meet the reporting entity definition criteria of the Governmental Accounting Standards Board (GASB).
The following are those aspects of the relationship between the District and the component units that satisfy the GASB.
Accountability: The Foundation operates under a master agreement with the District in accordance with the California Education Code requirements. The District is able to impose its will upon the Foundation. The Foundation provides specific financial benefits or imposes specific financial burdens on the District.
Scope of Public Service: The component units are nonprofit, public benefit corporations incorporated under the laws of the State of California. The Foundation was formed to promote and assist the educational services of the District. The Corporation was formed for the sole purpose of providing financing assistance to the District for construction and acquisition of major capital facilities. At the end of the lease term, title of all corporate property will pass to the District for no additional consideration.
Blended Presentation: The funds of separate legal entities that meet the component unit criteria described above and whose governing body is the same or substantially the same as the District’s governing board, or who provide services entirely to the District, are blended into the District’s funds by appropriate activity type to compose the primary government presentation. For financial purposes, the Corporation’s financial activities have been blended into the reporting activity of the District’s report.
Discrete Presentation: Funds of separate legal entities that meet the component unit criteria described above, but do not meet the criteria for blending, are discretely presented with the financial activities of the District. For financial presentation purposes, the Foundation’s financial activities have been discretely presented.
NOTES TO THE FINANCIAL STATEMENTS June 30, 2014
Redwoods CommunityCollege District
17
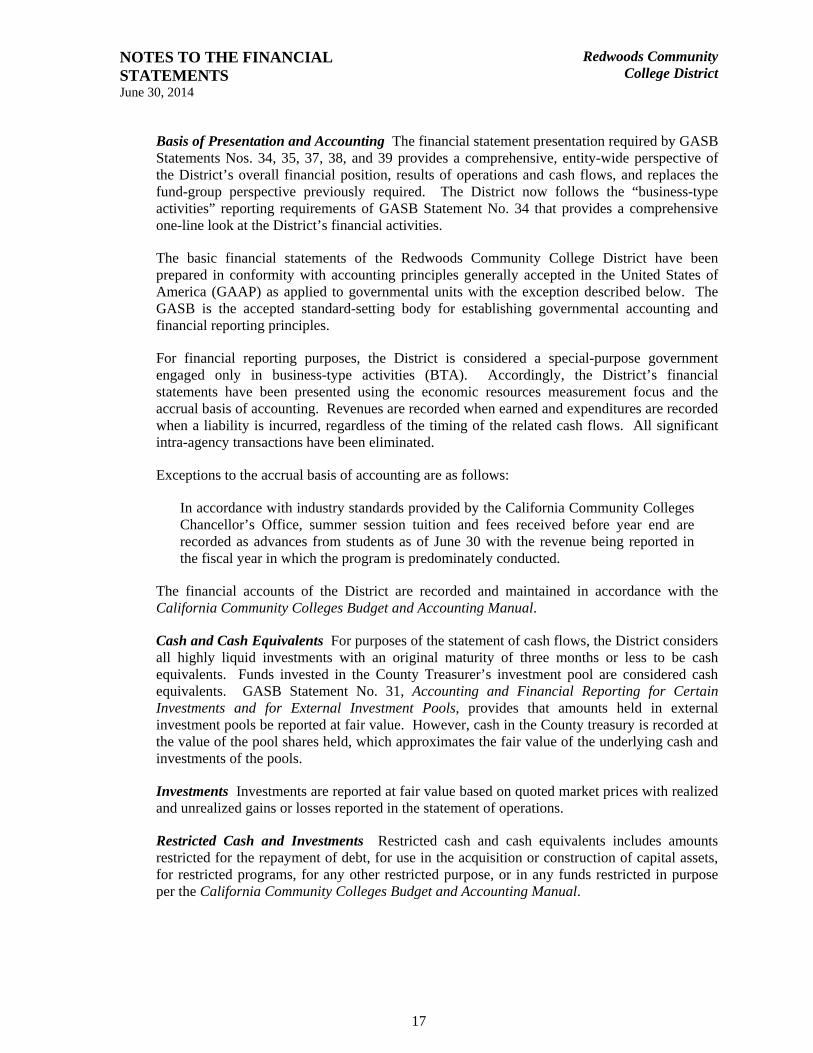
Basis of Presentation and Accounting The financial statement presentation required by GASB Statements Nos. 34, 35, 37, 38, and 39 provides a comprehensive, entity-wide perspective of the District’s overall financial position, results of operations and cash flows, and replaces the fund-group perspective previously required. The District now follows the “business-type activities” reporting requirements of GASB Statement No. 34 that provides a comprehensive one-line look at the District’s financial activities.
The basic financial statements of the Redwoods Community College District have been prepared in conformity with accounting principles generally accepted in the United States of America (GAAP) as applied to governmental units with the exception described below. The GASB is the accepted standard-setting body for establishing governmental accounting and financial reporting principles.
For financial reporting purposes, the District is considered a special-purpose government engaged only in business-type activities (BTA). Accordingly, the District’s financial statements have been presented using the economic resources measurement focus and the accrual basis of accounting. Revenues are recorded when earned and expenditures are recorded when a liability is incurred, regardless of the timing of the related cash flows. All significant intra-agency transactions have been eliminated.
Exceptions to the accrual basis of accounting are as follows:
In accordance with industry standards provided by the California Community Colleges Chancellor’s Office, summer session tuition and fees received before year end are recorded as advances from students as of June 30 with the revenue being reported in the fiscal year in which the program is predominately conducted.
The financial accounts of the District are recorded and maintained in accordance with the California Community Colleges Budget and Accounting Manual.
Cash and Cash Equivalents For purposes of the statement of cash flows, the District considers all highly liquid investments with an original maturity of three months or less to be cash equivalents. Funds invested in the County Treasurer’s investment pool are considered cash equivalents. GASB Statement No. 31, Accounting and Financial Reporting for Certain Investments and for External Investment Pools, provides that amounts held in external investment pools be reported at fair value. However, cash in the County treasury is recorded at the value of the pool shares held, which approximates the fair value of the underlying cash and investments of the pools.
Investments Investments are reported at fair value based on quoted market prices with realized and unrealized gains or losses reported in the statement of operations.
Restricted Cash and Investments Restricted cash and cash equivalents includes amounts restricted for the repayment of debt, for use in the acquisition or construction of capital assets, for restricted programs, for any other restricted purpose, or in any funds restricted in purpose per the California Community Colleges Budget and Accounting Manual.
NOTES TO THE FINANCIAL STATEMENTS June 30, 2014
Redwoods CommunityCollege District
18
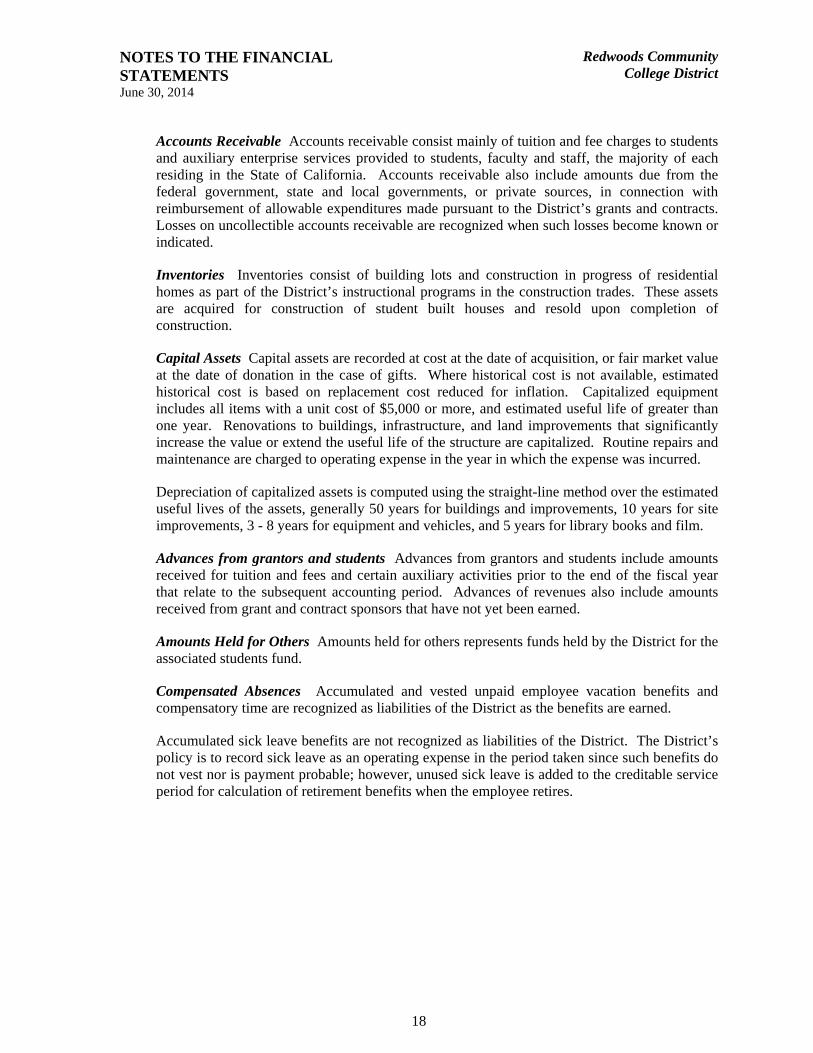
Accounts Receivable Accounts receivable consist mainly of tuition and fee charges to students and auxiliary enterprise services provided to students, faculty and staff, the majority of each residing in the State of California. Accounts receivable also include amounts due from the federal government, state and local governments, or private sources, in connection with reimbursement of allowable expenditures made pursuant to the District’s grants and contracts. Losses on uncollectible accounts receivable are recognized when such losses become known or indicated.
Inventories Inventories consist of building lots and construction in progress of residential homes as part of the District’s instructional programs in the construction trades. These assets are acquired for construction of student built houses and resold upon completion of construction.
Capital Assets Capital assets are recorded at cost at the date of acquisition, or fair market value at the date of donation in the case of gifts. Where historical cost is not available, estimated historical cost is based on replacement cost reduced for inflation. Capitalized equipment includes all items with a unit cost of $5,000 or more, and estimated useful life of greater than one year. Renovations to buildings, infrastructure, and land improvements that significantly increase the value or extend the useful life of the structure are capitalized. Routine repairs and maintenance are charged to operating expense in the year in which the expense was incurred.
Depreciation of capitalized assets is computed using the straight-line method over the estimated useful lives of the assets, generally 50 years for buildings and improvements, 10 years for site improvements, 3 - 8 years for equipment and vehicles, and 5 years for library books and film.
Advances from grantors and students Advances from grantors and students include amounts received for tuition and fees and certain auxiliary activities prior to the end of the fiscal year that relate to the subsequent accounting period. Advances of revenues also include amounts received from grant and contract sponsors that have not yet been earned.
Amounts Held for Others Amounts held for others represents funds held by the District for the associated students fund.
Compensated Absences Accumulated and vested unpaid employee vacation benefits and compensatory time are recognized as liabilities of the District as the benefits are earned.
Accumulated sick leave benefits are not recognized as liabilities of the District. The District’s policy is to record sick leave as an operating expense in the period taken since such benefits do not vest nor is payment probable; however, unused sick leave is added to the creditable service period for calculation of retirement benefits when the employee retires.

NOTES TO THE FINANCIAL STATEMENTS June 30, 2014
Redwoods CommunityCollege District
19
Long-Term Liabilities Bond premiums and discounts are deferred and amortized over the life of the bonds using the effective interest method, or the straight-line method if it does not materially differ from the effective interest method. Bonds payable are reported net of the applicable bond premium or discount. Bond issuance costs are expensed in the year incurred. Amortization of bond premium and discount costs was $17,224 for the year ended June 30, 2014.
Deferred Outflow/Inflows of Resources In addition to assets, the statement of net position includes a separate section of deferred inflows of resources. This separate financial statement element, deferred inflows of resources, represents an acquisition of net position that applies to a future period(s), and as such will not be recognized as an inflow of resources (revenue) until then. The District only has one item that qualifies for reporting in this category, which is the deferred gain on refunding reported in the statement of net position. A deferred gain on refunding results from the difference in the carrying value of refunded debt and its reacquisition price. This amount is deferred and amortized over the shortened life of the refunded or refunding debt.
In addition to assets, the statement of net position will sometimes report a separate section for deferred outflows of resources. This separate financial statement element, deferred outflows of resources, represents a consumption of net position that applies to future period(s) and as such, will not be recognized as an outflow of resources (expenses/expenditures) until then. The District does not have any item of this type.
Net Position Net position represents the differences between assets and liabilities. The District’s net position is classified as follows:
Net Investment in Capital Assets: This represents the District’s total investment in capital assets, net of outstanding debt obligations related to those capital assets. To the extent debt has been incurred but not yet expended for capital assets, such amounts are not included as a component net investment in capital assets.
Restricted Net Position - Nonexpendable: Consists of endowment and similar type funds in which donors or other outside sources have stipulated, as a condition of the gift instrument, that the principal is to be maintained inviolate and in perpetuity, and invested for the purpose of producing present and future income, which may be expended or added to principal depending on donor stipulations.
Restricted Net Position - Expendable: Restricted expendable net position represents resources which are legally or contractually obligated to be spent in accordance with restrictions imposed by external third parties.
Unrestricted Net Position: Unrestricted net position represents resources derived from student tuition and fees, state apportionments, and sales and services of educational departments and auxiliary enterprises. These resources are used for transactions relating to the educational and general operations of the District, and may be used at the discretion of the governing board to meet current expenses for any purpose.
When an expense is incurred that can be paid using either restricted or unrestricted resources, the District’s policy is to first apply the expense toward restricted resources, and then towards unrestricted resources.

NOTES TO THE FINANCIAL STATEMENTS June 30, 2014
Redwoods CommunityCollege District
20
Classification of Revenues The District has classified its revenues as either operating or non-operating. Certain significant revenue streams relied upon for operations are recorded as non-operating revenues, including state appropriations, local property taxes, and investment income.
Revenues are classified according to the following criteria:
Operating Revenues: Operating revenues include activities that have the characteristics of exchange transactions, such as: (1) student tuition and fees, net of scholarship discounts and allowances; (2) sales and services of auxiliary enterprises; (3) most federal, state, and local grants and contracts, and federal appropriations; and (4) interest on institutional student loans.
Nonoperating Revenues: Nonoperating revenues include activities that have the characteristics of nonexchange transactions, such as gifts and contributions, and other revenue sources described in GASB Statement No. 34, such as state appropriations and investment income.
Scholarship Discounts and Allowances Student tuition and fee revenue are reported net of scholarship discounts and allowances in the statement of revenues, expenses, and changes in net position. Scholarship discounts and allowances represent the difference between stated charges for goods and services provided by the District and the amount that is paid by students and/or third parties making payments on the students’ behalf.
State Apportionments Certain current-year apportionments from the State are based on various financial and statistical information of the previous year as well as State budgets and other factors outside the District’s control. In February, subsequent to the year end, the State performs a recalculation based on actual financial and statistical information for the year just completed. The District’s policy is to estimate the recalculation correction to apportionment, if any, based on factors it can reasonably determine such as local property tax revenue received and changes in FTES. Any additional corrections determined by the State are recorded in the year computed by the State.
Estimates The preparation of financial statements in conformity with accounting principles generally accepted in the United States of America requires management to make estimates and assumptions that affect the amounts reported in the basic financial statements and accompanying notes. Actual results may differ from those estimates.
Property Taxes Secured property taxes attach as an enforceable lien on property as of January 1. Taxes are payable in two installments on November 1 and February 1 and become delinquent if paid after December 10 and April 10. Unsecured property taxes are payable in one installment on or before August 31. The respective counties bill and collect the taxes for the District.
Budget and Budgetary Accounting By state law, the District’s governing board must approve a tentative budget no later than July 1, and adopt a final budget no later than September 15 of each year. A hearing must be conducted for public comments prior to adoption. The District’s governing board satisfied these requirements.
The budget is revised during the year to incorporate categorical funds that are awarded during the year and miscellaneous changes to the spending plans. The District’s governing board approves revisions to the budget.
NOTES TO THE FINANCIAL STATEMENTS June 30, 2014
Redwoods CommunityCollege District
21
On-Behalf Payments GASB Statement No. 24 requires that direct on-behalf payments for fringe benefits and salaries made by one entity to a third-party recipient for the employees of another legally separate entity be recognized as revenue and expenditures by the employer government. The State of California makes direct on-behalf payments for retirement benefits to the California State Teachers’ Retirement System (CalSTRS) and the California Public Employees’ Retirement System (CalPERS) on behalf of all community college districts in California. Payment amounts have not been reported in the basic financial statements as management believes they are immaterial to the financial statements taken as a whole.
Reclassifications Certain reclassifications have been made to prior year amounts to conform with current year presentation.
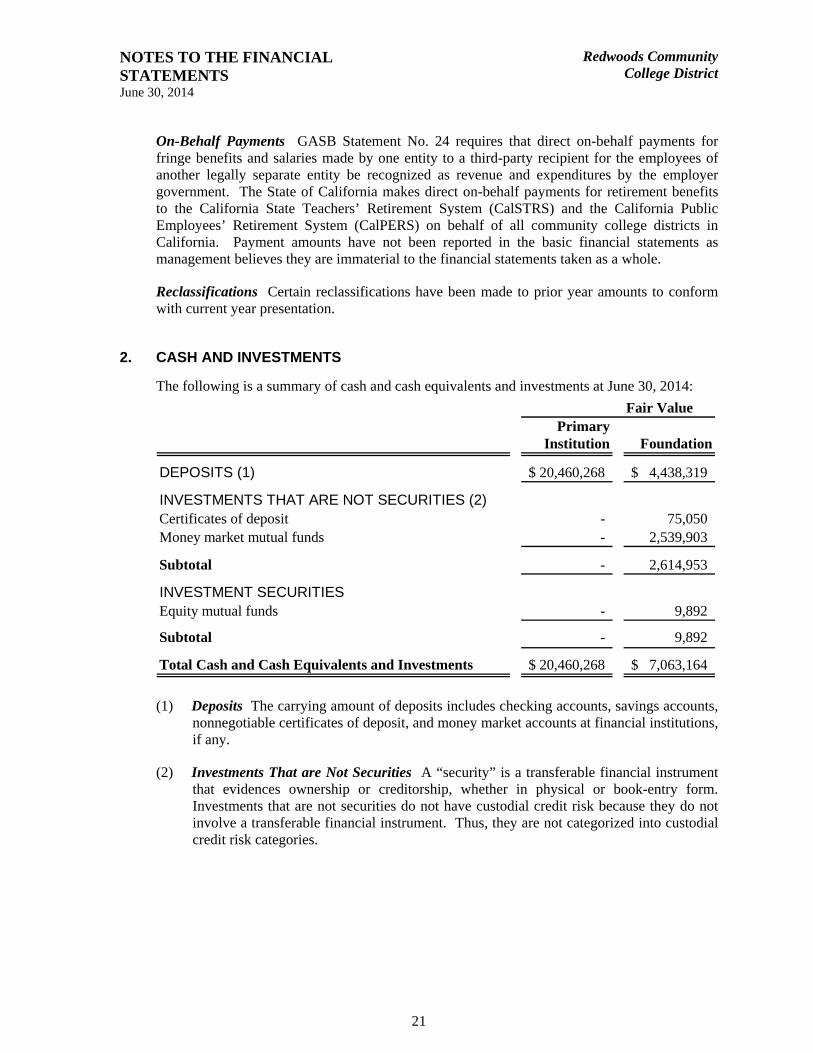
2. CASH AND INVESTMENTS
The following is a summary of cash and cash equivalents and investments at June 30, 2014:
Fair ValuePrimary
Institution Foundation
DEPOSITS (1) 20,460,268$ 4,438,319$
INVESTMENTS THAT ARE NOT SECURITIES (2)Certificates of deposit - 75,050 Money market mutual funds - 2,539,903
Subtotal - 2,614,953
INVESTMENT SECURITIESEquity mutual funds - 9,892
Subtotal - 9,892
Total Cash and Cash Equivalents and Investments 20,460,268$ 7,063,164$
(1) Deposits The carrying amount of deposits includes checking accounts, savings accounts,
nonnegotiable certificates of deposit, and money market accounts at financial institutions, if any.
(2) Investments That are Not Securities A “security” is a transferable financial instrument that evidences ownership or creditorship, whether in physical or book-entry form. Investments that are not securities do not have custodial credit risk because they do not involve a transferable financial instrument. Thus, they are not categorized into custodial credit risk categories.
NOTES TO THE FINANCIAL STATEMENTS June 30, 2014
Redwoods CommunityCollege District
22
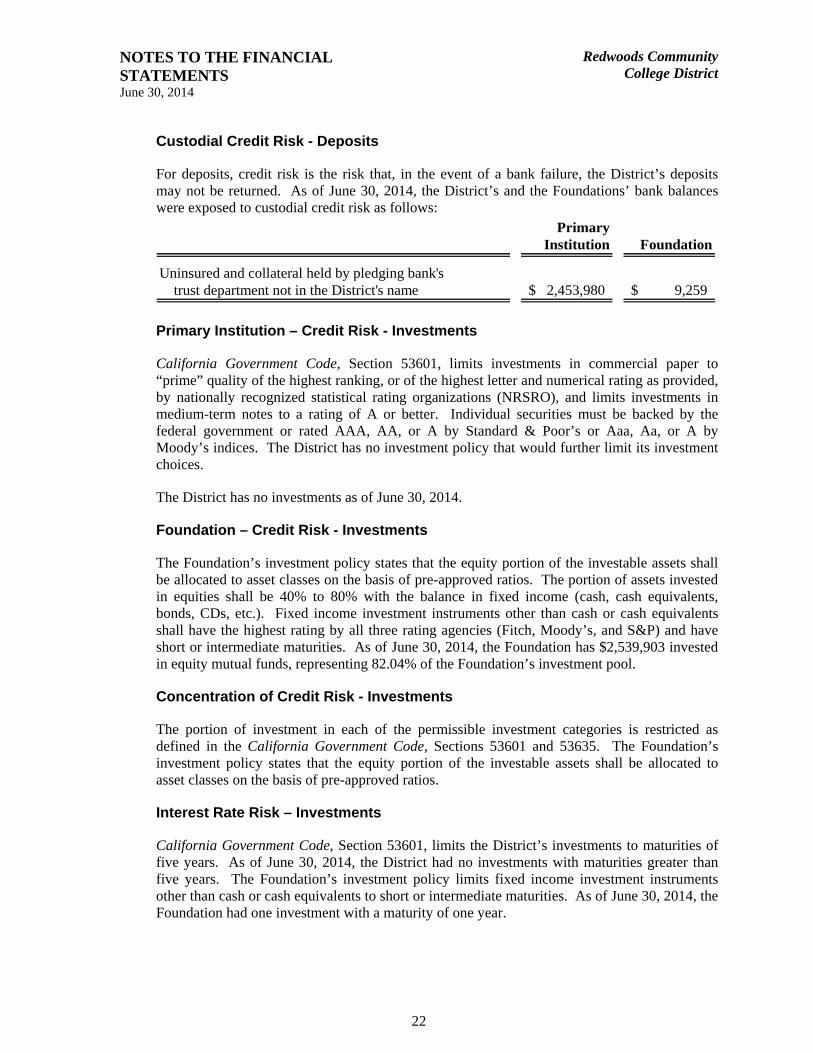
Custodial Credit Risk - Deposits
For deposits, credit risk is the risk that, in the event of a bank failure, the District’s deposits may not be returned. As of June 30, 2014, the District’s and the Foundations’ bank balances were exposed to custodial credit risk as follows:
PrimaryInstitution Foundation
Uninsured and collateral held by pledging bank's trust department not in the District's name 2,453,980$ 9,259$
Primary Institution – Credit Risk - Investments
California Government Code, Section 53601, limits investments in commercial paper to “prime” quality of the highest ranking, or of the highest letter and numerical rating as provided, by nationally recognized statistical rating organizations (NRSRO), and limits investments in medium-term notes to a rating of A or better. Individual securities must be backed by the federal government or rated AAA, AA, or A by Standard & Poor’s or Aaa, Aa, or A by Moody’s indices. The District has no investment policy that would further limit its investment choices.
The District has no investments as of June 30, 2014.
Foundation – Credit Risk - Investments
The Foundation’s investment policy states that the equity portion of the investable assets shall be allocated to asset classes on the basis of pre-approved ratios. The portion of assets invested in equities shall be 40% to 80% with the balance in fixed income (cash, cash equivalents, bonds, CDs, etc.). Fixed income investment instruments other than cash or cash equivalents shall have the highest rating by all three rating agencies (Fitch, Moody’s, and S&P) and have short or intermediate maturities. As of June 30, 2014, the Foundation has $2,539,903 invested in equity mutual funds, representing 82.04% of the Foundation’s investment pool.
Concentration of Credit Risk - Investments
The portion of investment in each of the permissible investment categories is restricted as defined in the California Government Code, Sections 53601 and 53635. The Foundation’s investment policy states that the equity portion of the investable assets shall be allocated to asset classes on the basis of pre-approved ratios.
Interest Rate Risk – Investments
California Government Code, Section 53601, limits the District’s investments to maturities of five years. As of June 30, 2014, the District had no investments with maturities greater than five years. The Foundation’s investment policy limits fixed income investment instruments other than cash or cash equivalents to short or intermediate maturities. As of June 30, 2014, the Foundation had one investment with a maturity of one year.
NOTES TO THE FINANCIAL STATEMENTS June 30, 2014
Redwoods CommunityCollege District
23
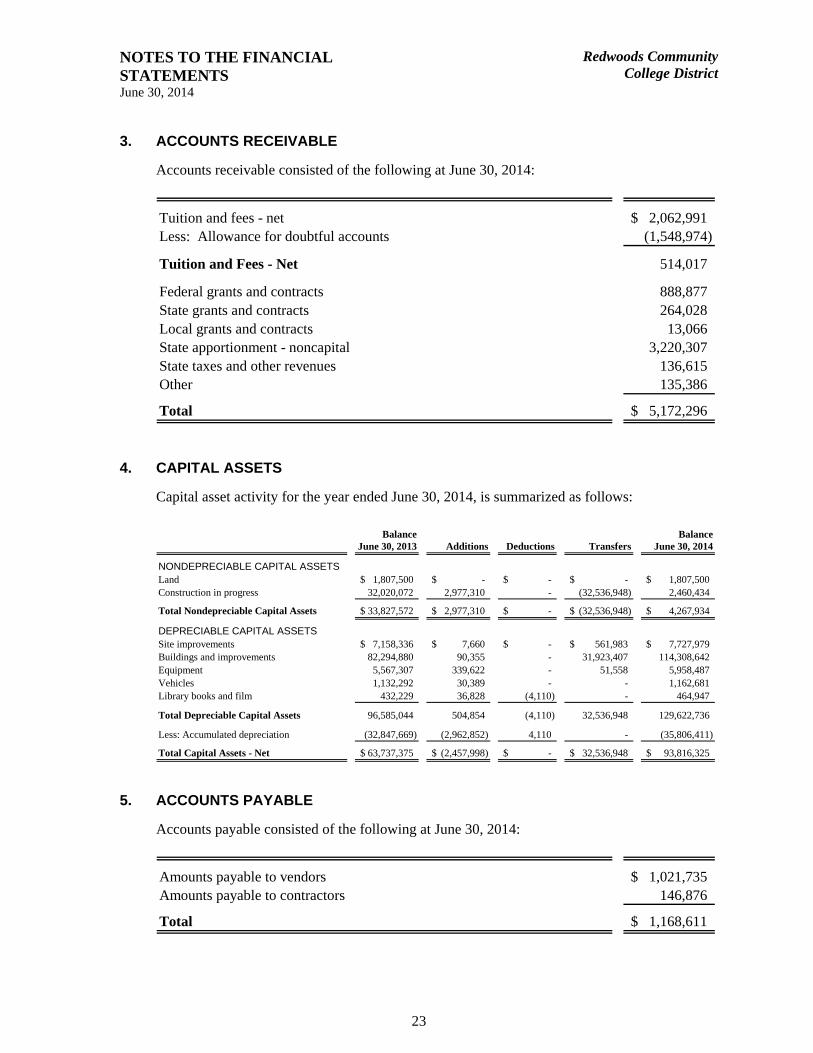
3. ACCOUNTS RECEIVABLE
Accounts receivable consisted of the following at June 30, 2014:
Tuition and fees - net 2,062,991$ Less: Allowance for doubtful accounts (1,548,974)
Tuition and Fees - Net 514,017
Federal grants and contracts 888,877 State grants and contracts 264,028 Local grants and contracts 13,066 State apportionment - noncapital 3,220,307 State taxes and other revenues 136,615 Other 135,386
Total 5,172,296$
4. CAPITAL ASSETS
Capital asset activity for the year ended June 30, 2014, is summarized as follows:
Balance BalanceJune 30, 2013 Additions Deductions Transfers June 30, 2014
NONDEPRECIABLE CAPITAL ASSETSLand 1,807,500$ -$ -$ -$ 1,807,500$ Construction in progress 32,020,072 2,977,310 - (32,536,948) 2,460,434
Total Nondepreciable Capital Assets 33,827,572$ 2,977,310$ -$ (32,536,948)$ 4,267,934$
DEPRECIABLE CAPITAL ASSETSSite improvements 7,158,336$ 7,660$ -$ 561,983$ 7,727,979$ Buildings and improvements 82,294,880 90,355 - 31,923,407 114,308,642 Equipment 5,567,307 339,622 - 51,558 5,958,487 Vehicles 1,132,292 30,389 - - 1,162,681 Library books and film 432,229 36,828 (4,110) - 464,947
Total Depreciable Capital Assets 96,585,044 504,854 (4,110) 32,536,948 129,622,736
Less: Accumulated depreciation (32,847,669) (2,962,852) 4,110 - (35,806,411)
Total Capital Assets - Net 63,737,375$ (2,457,998)$ -$ 32,536,948$ 93,816,325$
5. ACCOUNTS PAYABLE
Accounts payable consisted of the following at June 30, 2014:
Amounts payable to vendors 1,021,735$ Amounts payable to contractors 146,876
Total 1,168,611$
NOTES TO THE FINANCIAL STATEMENTS June 30, 2014
Redwoods CommunityCollege District
24
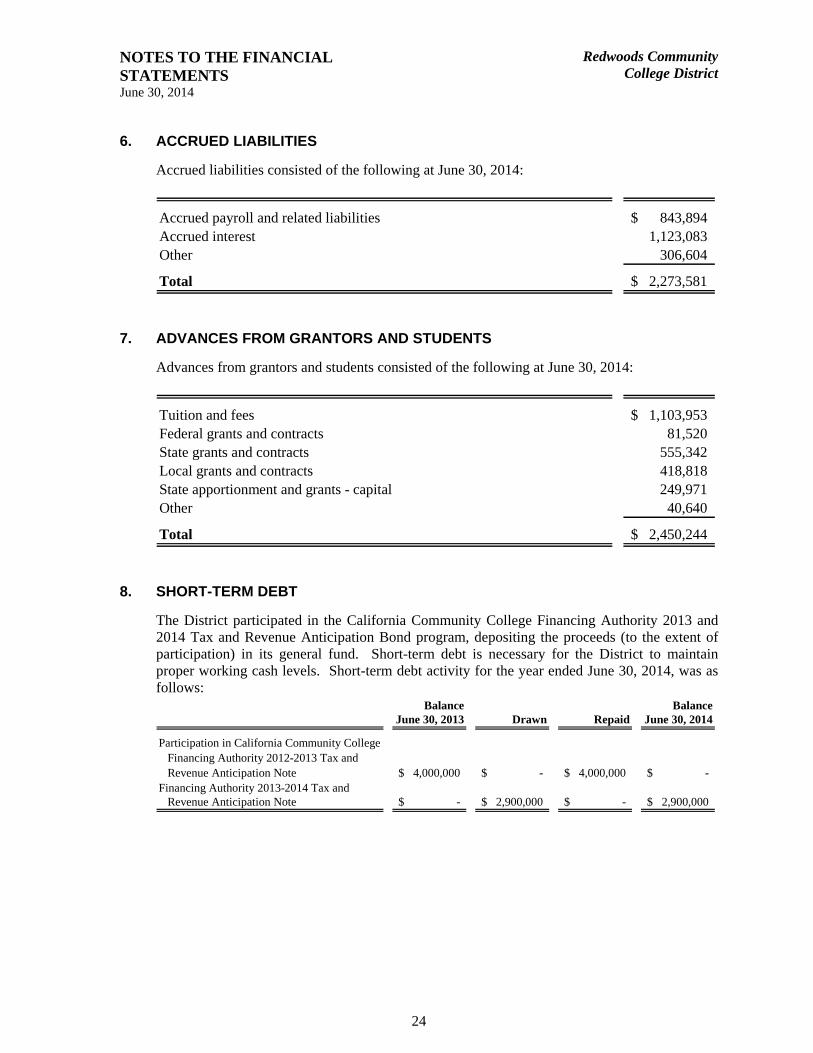
6. ACCRUED LIABILITIES
Accrued liabilities consisted of the following at June 30, 2014:
Accrued payroll and related liabilities 843,894$ Accrued interest 1,123,083 Other 306,604
Total 2,273,581$
7. ADVANCES FROM GRANTORS AND STUDENTS
Advances from grantors and students consisted of the following at June 30, 2014:
Tuition and fees 1,103,953$ Federal grants and contracts 81,520 State grants and contracts 555,342 Local grants and contracts 418,818 State apportionment and grants - capital 249,971 Other 40,640
Total 2,450,244$
8. SHORT-TERM DEBT
The District participated in the California Community College Financing Authority 2013 and 2014 Tax and Revenue Anticipation Bond program, depositing the proceeds (to the extent of participation) in its general fund. Short-term debt is necessary for the District to maintain proper working cash levels. Short-term debt activity for the year ended June 30, 2014, was as follows:
Balance BalanceJune 30, 2013 Drawn Repaid June 30, 2014
Participation in California Community CollegeFinancing Authority 2012-2013 Tax and Revenue Anticipation Note 4,000,000$ -$ 4,000,000$ -$
Financing Authority 2013-2014 Tax and Revenue Anticipation Note -$ 2,900,000$ -$ 2,900,000$
NOTES TO THE FINANCIAL STATEMENTS June 30, 2014
Redwoods CommunityCollege District
25
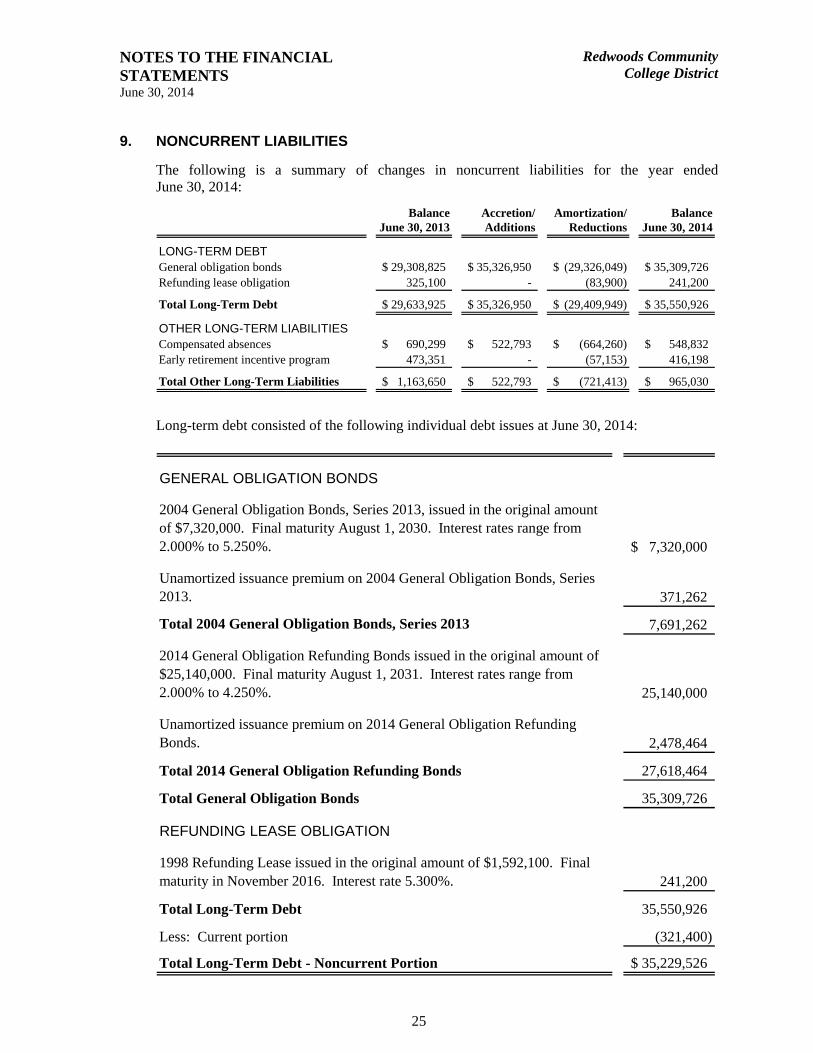
9. NONCURRENT LIABILITIES
The following is a summary of changes in noncurrent liabilities for the year ended June 30, 2014:
Balance Accretion/ Amortization/ BalanceJune 30, 2013 Additions Reductions June 30, 2014
LONG-TERM DEBTGeneral obligation bonds 29,308,825$ 35,326,950$ (29,326,049)$ 35,309,726$ Refunding lease obligation 325,100 - (83,900) 241,200
Total Long-Term Debt 29,633,925$ 35,326,950$ (29,409,949)$ 35,550,926$
OTHER LONG-TERM LIABILITIESCompensated absences 690,299$ 522,793$ (664,260)$ 548,832$ Early retirement incentive program 473,351 - (57,153) 416,198
Total Other Long-Term Liabilities 1,163,650$ 522,793$ (721,413)$ 965,030$
Long-term debt consisted of the following individual debt issues at June 30, 2014:
GENERAL OBLIGATION BONDS
2004 General Obligation Bonds, Series 2013, issued in the original amount of $7,320,000. Final maturity August 1, 2030. Interest rates range from 2.000% to 5.250%. 7,320,000$
Unamortized issuance premium on 2004 General Obligation Bonds, Series 2013. 371,262
Total 2004 General Obligation Bonds, Series 2013 7,691,262
2014 General Obligation Refunding Bonds issued in the original amount of $25,140,000. Final maturity August 1, 2031. Interest rates range from 2.000% to 4.250%. 25,140,000
Unamortized issuance premium on 2014 General Obligation Refunding Bonds. 2,478,464
Total 2014 General Obligation Refunding Bonds 27,618,464
Total General Obligation Bonds 35,309,726
REFUNDING LEASE OBLIGATION
1998 Refunding Lease issued in the original amount of $1,592,100. Final maturity in November 2016. Interest rate 5.300%. 241,200
Total Long-Term Debt 35,550,926
Less: Current portion (321,400)
Total Long-Term Debt - Noncurrent Portion 35,229,526$

NOTES TO THE FINANCIAL STATEMENTS June 30, 2014
Redwoods CommunityCollege District
26
Refunded Debt
The 2014 Refunding Bonds were issued to refinance the 2004 General Obligation Bonds, Series 2005 and 2007. The District recognized a financial statement gain of $1,254,618 on the refinance and it is being amortized over the life of the new debt. The issuance resulted in an economic gain of $2,249,623.
The annual debt service requirements to maturity on the general obligation bond issues are as follows:
Bonds BondYear Ending June 30 Principal Interest Total Premium Total
2015 230,000$ 622,752$ 852,752$ 24,292$ 877,044$ 2016 1,215,000 1,429,919 2,644,919 63,420 2,708,339 2017 1,240,000 1,394,369 2,634,369 118,317 2,752,686 2018 1,335,000 1,345,569 2,680,569 191,520 2,872,089 2019 1,435,000 1,281,418 2,716,418 70,972 2,787,390 2020-2024 8,735,000 5,533,444 14,268,444 1,143,044 15,411,488 2025-2029 12,255,000 3,191,244 15,446,244 1,237,231 16,683,475 2030-2031 6,015,000 450,850 6,465,850 930 6,466,780
Total 32,460,000$ 15,249,565$ 47,709,565$ 2,849,726$ 50,559,291
Less: Current interest (15,249,565)
Net Principal 35,309,726$
The annual debt service requirements to maturity on the refunding lease obligation are as follows:
Year Ending June 30 Principal Interest Total
2015 91,400$ 10,362$ 101,762$ 2016 93,600 5,459 99,059 2017 56,200 1,489 57,689
Total 241,200$ 17,310$ 258,510$
The amount of interest cost incurred during the year ended June 30, 2014, was $1,946,993, of which $205,102 was capitalized.
Other long-term liabilities at June 30, 2014, include the following liabilities which have required principal payments:
In 2012, the District offered early retirement benefits to select employees. The liability for the eight employees who accepted the offer was $488,169, payable in eight payments ending in 2016. The interest rate is 7.75%. 416,198$
Less: Current portion (57,153)
Early Retirement Incentive Program - Noncurrent Portion 359,045$

NOTES TO THE FINANCIAL STATEMENTS June 30, 2014
Redwoods CommunityCollege District
27
The annual principal payment retirement on the Early Retirement Incentive Program liability is as follows:
Year Ending June 30
2015 57,153$ 2016 36,716 2017 66,382 2018 71,713 2019 77,473 2020 106,761
Total 416,198$
10. EMPLOYEE RETIREMENT SYSTEMS
Qualified employees are covered under cost-sharing, multiple-employer defined benefit pension plans maintained by agencies of the State of California. Certificated employees are members of the California State Teachers’ Retirement System (CalSTRS), and classified employees are members of the California Public Employees’ Retirement System (CalPERS).
California State Teachers’ Retirement System
Plan Description
All certificated employees and those employees meeting minimum standards adopted by the Board of Governors of the California Community Colleges and employed 50% or more in a full-time equivalent position participate in the Defined Benefit Plan (DB Plan). Part-time educators hired under a contract of less than 50% or on an hourly or daily basis without contract may elect membership in the Cash Balance Benefit Program (CB Benefit Program). Since January 1, 1999, both of these plans have been part of the California State Teachers’ Retirement Plan (CalSTRP), a cost-sharing, multiple-employer contributory public employee retirement system. The State Teachers’ Retirement Law (Part 13 of the California Education Code, Section 22000 et seq.) established benefit provisions for CalSTRS. Copies of the CalSTRS annual financial report may be obtained from CalSTRS, 100 Waterfront Place, Sacramento, California 95605.
CalSTRP, a defined benefit pension plan, provides retirement, disability, and death benefits, and depending on which component of CalSTRP the employee is in, post-retirement cost-of-living adjustments may also be offered. Employees in the DB Plan attaining the age of 60 with five years of credited California service (service) are eligible for “normal” retirement and are entitled to a monthly benefit of 2% of their final compensation for each year of service. Final compensation is generally defined as the average salary earnable for the highest three consecutive years of service. The plan permits early retirement options at age 55 or as early as age 50 with at least 30 years of service. While early retirement can reduce the 2% factor used at age 60, service of 30 or more years will increase the percentage age factor to be applied.
NOTES TO THE FINANCIAL STATEMENTS June 30, 2014
Redwoods CommunityCollege District
28
Disability benefits are generally the maximum of 50% of final compensation for most applicants. Eligible dependent children can increase this benefit up to a maximum of 90% of final compensation. After five years of credited service, members become 100% vested in retirement benefits earned to date. If a member’s employment is terminated, the accumulated member contributions are refundable.
The features of the CB Benefit Program include immediate vesting, variable contribution rates that can be bargained, guaranteed interest rates, and flexible retirement options. Participation in the CB Benefit Plan is optional; however, if the employee selects the CB Benefit Plan and their basis of employment changes to half-time or more, the member will automatically become a member of the DB Plan.
Funding Policy
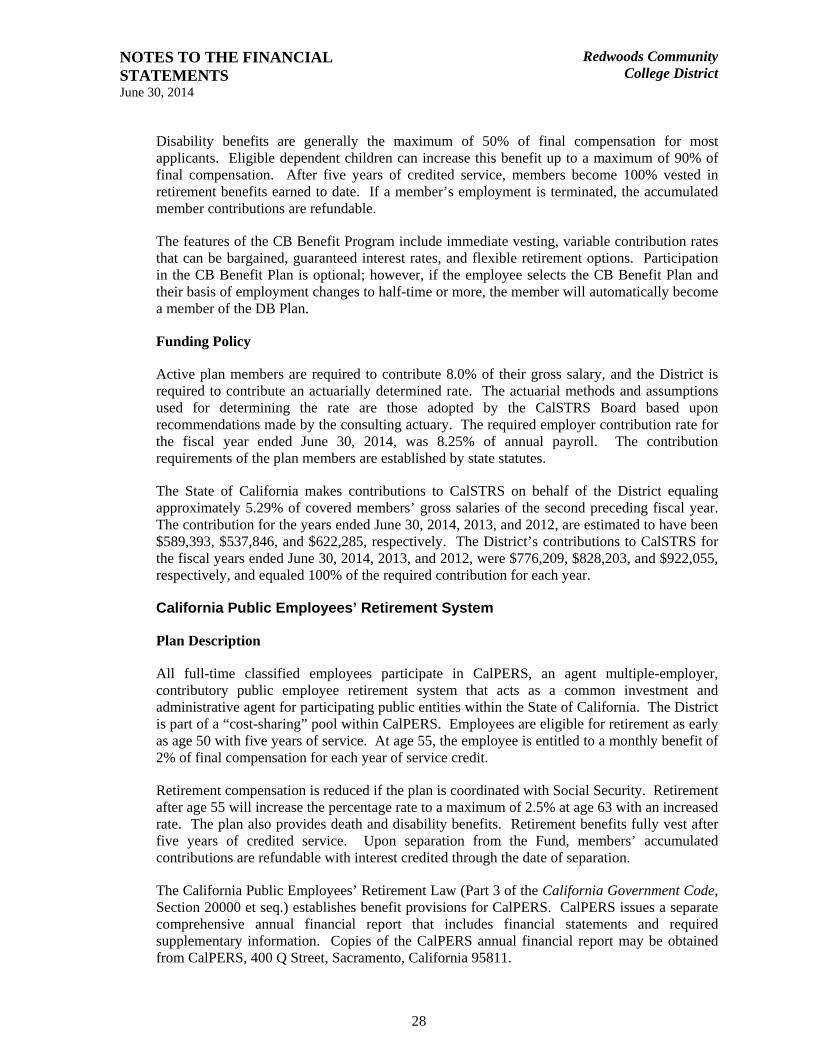
Active plan members are required to contribute 8.0% of their gross salary, and the District is required to contribute an actuarially determined rate. The actuarial methods and assumptions used for determining the rate are those adopted by the CalSTRS Board based upon recommendations made by the consulting actuary. The required employer contribution rate for the fiscal year ended June 30, 2014, was 8.25% of annual payroll. The contribution requirements of the plan members are established by state statutes.
The State of California makes contributions to CalSTRS on behalf of the District equaling approximately 5.29% of covered members’ gross salaries of the second preceding fiscal year. The contribution for the years ended June 30, 2014, 2013, and 2012, are estimated to have been $589,393, $537,846, and $622,285, respectively. The District’s contributions to CalSTRS for the fiscal years ended June 30, 2014, 2013, and 2012, were $776,209, $828,203, and $922,055, respectively, and equaled 100% of the required contribution for each year.
California Public Employees’ Retirement System
Plan Description
All full-time classified employees participate in CalPERS, an agent multiple-employer, contributory public employee retirement system that acts as a common investment and administrative agent for participating public entities within the State of California. The District is part of a “cost-sharing” pool within CalPERS. Employees are eligible for retirement as early as age 50 with five years of service. At age 55, the employee is entitled to a monthly benefit of 2% of final compensation for each year of service credit.
Retirement compensation is reduced if the plan is coordinated with Social Security. Retirement after age 55 will increase the percentage rate to a maximum of 2.5% at age 63 with an increased rate. The plan also provides death and disability benefits. Retirement benefits fully vest after five years of credited service. Upon separation from the Fund, members’ accumulated contributions are refundable with interest credited through the date of separation.
The California Public Employees’ Retirement Law (Part 3 of the California Government Code, Section 20000 et seq.) establishes benefit provisions for CalPERS. CalPERS issues a separate comprehensive annual financial report that includes financial statements and required supplementary information. Copies of the CalPERS annual financial report may be obtained from CalPERS, 400 Q Street, Sacramento, California 95811.

NOTES TO THE FINANCIAL STATEMENTS June 30, 2014
Redwoods CommunityCollege District
29
Funding Policy
Active plan members are required to contribute 7.0% of their salary (7.0% of monthly salary over $133.33 if the member participates in Social Security) and the District is required to contribute an actuarially determined rate. The actuarial methods and assumptions used for determining the rate are those adopted by the CalPERS Board of Administration. The required employer contribution rate for the fiscal year ended June 30, 2014, was 11.442% of annual payroll. The contribution requirements of the plan members are established by state statutes. The District’s contributions to CalPERS for the fiscal years ended June 30, 2014, 2013, and 2012, were $745,343, $787,389, and $885,987, respectively, and equaled 100% of the required contribution for each year.
A State of California contribution on behalf of the District to CalPERS was not required for the years ended June 30, 2014, 2013, and 2012.
11. STATE AND FEDERAL ALLOWANCES, AWARDS, AND GRANTS
The District has received state and federal funds for specific purposes that are subject to review and audit by the grantor agencies. Although such audits could generate expenditure disallowance under terms of the grants, management believes that any required reimbursements will not be material.
12. JOINT POWERS AUTHORITIES
The District participates in property, liability, and workers’ compensation insurance programs organized through the Northern California Community Colleges Self-Insurance Authority (NCCCSIA), the Statewide Association of Community Colleges (SWACC), and the Protected Insurance Program for Schools (PIPS). These JPAs are created to provide self-insurance programs to California community colleges.
The District participates in a health insurance benefits program organized by the North Coast Schools Medical Insurance Group (NCSMIG), which is a JPA, created to provide self-insurance programs for school districts.
The District is a participant in the Schools Excess Liability Fund (SELF). SELF is a JPA created to provide services and other items necessary and appropriate for the establishment, operation, and maintenance of a self-funded excess liability fund for public educational agencies, which are parties thereto. Should excess liability claims exceed amounts funded to SELF by all participants, the District may be required to provide additional funding.
The JPAs are independently accountable for their fiscal matters, and as such, are not component units of the District for financial reporting purposes.
Each District member pays a premium commensurate with the level of coverage requested and shares surpluses and deficits proportionate to their participation in the JPA. For the last three years, settled claims have not exceeded insurance coverage, nor has there been any reduction in insurance coverage.
NOTES TO THE FINANCIAL STATEMENTS June 30, 2014
Redwoods CommunityCollege District
30
13. POSTEMPLOYMENT BENEFITS OTHER THAN PENSION BENEFITS (OPEB)
The District provides postemployment healthcare benefits for retired employees in accordance with negotiated contracts with the various bargaining units of the District.
Plan Description
The Redwoods Community College District Health Plan (the Plan) is a single-employer defined benefit healthcare plan administered by the District. The District provides medical, dental, and vision insurance coverage to all employees who retire from the District and meet the age and service requirement for eligibility. Group medical coverage is provided for academic retirees hired before January 1, 2008, classified retirees hired before July 1, 2006, and administrative, managerial, and confidential employees hired before September 1, 2006. Group medical coverage is also provided for board members meeting certain eligibility requirements. Membership of the Plan consists of 74 retirees currently receiving benefits and 135 eligible active plan members.
Funding Policy
The contribution requirements are established and may be amended by the District and the District’s bargaining units. The required contribution is based on projected pay-as-you-go financing requirements with an additional amount to prefund benefits as determined annually. For the year ended June 30, 2014, the District contributed $900,284 to the Plan.
Annual OPEB Cost and Net OPEB Obligation (Asset)
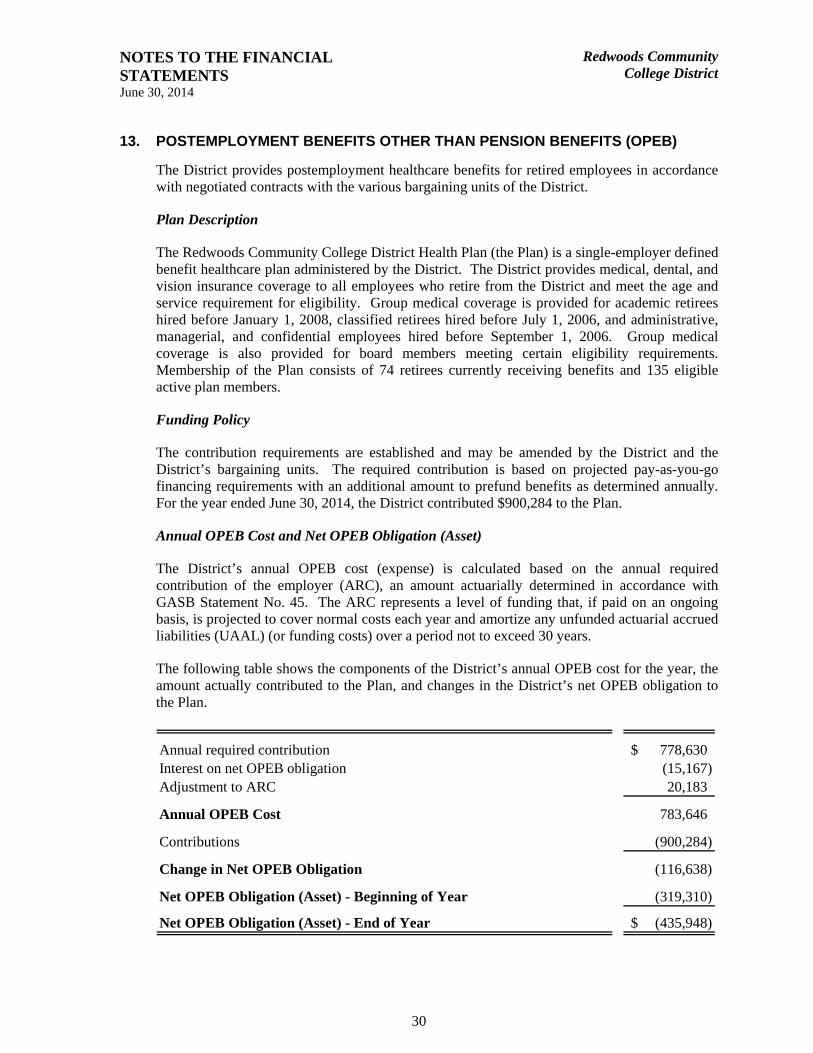
The District’s annual OPEB cost (expense) is calculated based on the annual required contribution of the employer (ARC), an amount actuarially determined in accordance with GASB Statement No. 45. The ARC represents a level of funding that, if paid on an ongoing basis, is projected to cover normal costs each year and amortize any unfunded actuarial accrued liabilities (UAAL) (or funding costs) over a period not to exceed 30 years.
The following table shows the components of the District’s annual OPEB cost for the year, the amount actually contributed to the Plan, and changes in the District’s net OPEB obligation to the Plan.
Annual required contribution 778,630$ Interest on net OPEB obligation (15,167) Adjustment to ARC 20,183
Annual OPEB Cost 783,646
Contributions (900,284)
Change in Net OPEB Obligation (116,638)
Net OPEB Obligation (Asset) - Beginning of Year (319,310)
Net OPEB Obligation (Asset) - End of Year (435,948)$

NOTES TO THE FINANCIAL STATEMENTS June 30, 2014
Redwoods CommunityCollege District
31
The annual OPEB cost, the percentage of annual OPEB cost contributed to the Plan, and the net OPEB obligation for fiscal year 2014 and the two preceding years were:
Annual Actual Net EndingOPEB Employer Percentage OPEB
Year Ended Cost Contributions Contributed Obligation
June 30, 2012 822,292$ 921,751$ 112.10% (125,537)$ June 30, 2013 781,176$ 974,949$ 124.81% (319,310)$ June 30, 2014 783,646$ 900,284$ 114.88% (435,948)$
Funded Status and Funding Progress
The District’s funding status information is illustrated as follows:
September 1, 2011 October 16, 2013
Actuarial accrued liability (AAL) 6,965,101$ 6,468,065$ Actuarial value of plan assets - -
Unfunded Actuarial Accrued Liability 6,965,101$ 6,468,065$
Funded ratio (actuarial value of plan assets/AAL) 0.00% 0.00%
Covered payroll (active members) 12,254,397$ 9,752,729$
UAAL as a Percentage of Covered Payroll 56.84% 66.32%
As of June 30, 2014, the District had not set aside any amounts in an external trust fund.
Actuarial Methods and Assumptions
Actuarial valuation of an ongoing plan involves estimates of the value of reported amounts and assumptions about the probability of events far into the future. Examples include assumptions about future employment, mortality, and the healthcare cost trend. Amounts determined regarding the funded status of the plan and the annual required contributions of the employer are subject to continual revision as actual results are compared to past expectations and new estimates are made about the future.
Projections of benefits for financial reporting purposes are based on the substantive plan (the Plan, as understood by the employer and the plan members), and includes the types of benefits provided at the time of each valuation and the historical pattern of sharing benefits costs between the employer and plan members to that point. The actuarial methods and assumptions used include techniques that are designed to reduce the effects of short-term volatility in actuarial accrued liabilities and the actuarial value of assets, consistent with the long-term perspective of the calculations.
In the October 16, 2013, actuarial valuation, the entry age normal cost method was used. The actuarial assumptions included a 4.75% discount rate, a 2.75% price inflation, a 2.75% wage inflation, and an annual cost trend rate of 4.0%. Unfunded actuarial accrued liabilities are amortized to produce payments (principal and interest), which are a level percentage of payroll over a 30-year period.

NOTES TO THE FINANCIAL STATEMENTS June 30, 2014
Redwoods CommunityCollege District
32
14. COMMITMENTS AND CONTINGENCIES
The District entered into various operating leases for land, buildings, and equipment. All leases contain termination clauses providing for cancellation upon written notice to lessors. It is expected that in the normal course of business most of these leases will be replaced by similar leases.
The District periodically enters into construction commitments which are funded through State grants and/or Measure Q Bond funding. At June 30, 2014, the District had unfinished contracts in the amount of $348,548.
The California Division of the State Architect has informed the District that since some of the District’s buildings are located near active earthquake faults, the best mitigation is avoidance of those areas. The District is constructing comparable new building space on adjacent sites and is considering potential nonstudent uses of the existing affected buildings, if possible. At June 30, 2014, the District’s affected assets have a net book value of $2,259,895 and have been reported without adjustment.
The District is accredited by the Accrediting Commission for Community and Junior Colleges of the Western Association of Schools and Colleges (ACCJC or “the Commission”). In February of 2014 the College was notified by the Commission that it has been removed from probation, and all sanctions, and that its accreditation has been reaffirmed. A brief history of the District’s accreditation status is discussed below.
The Commission acted in February 2012 to place the District on “show cause.” Show cause is ordered when the Commission finds that an institution is in substantial noncompliance with its eligibility requirements, accreditation standards, or Commission policies, or when the institution has not responded to the conditions imposed by the Commission. The District was required to prepare a Show Cause Report by October 2012, as well as a Closure Plan.
As a result of the accreditation show cause finding, on April 6, 2012, the District’s Board of Trustees adopted Resolution Number 656, “Resolution in Support of a Special Trustee.” At its August 7, 2012, meeting, the Board of Trustees approved a contract for Mr. Thomas E. Henry to act as State Special Trustee for the District to provide advice, make recommendations, and assist with the development of a fiscal and educational recovery plan. Special Trustee Henry continued in this role until the District was removed from all Commission sanctions.
In January 2013, the Commission reviewed the District’s and the visiting team’s follow-up reports and changed the District’s status to the lesser sanction of “probation.” The College issued another follow-up report and a team visited the College in November 2013. The Commission reviewed those follow-up reports and on February 7, 2014 notified the College that it has been removed from probation, and all sanctions, and that its accreditation has been reaffirmed.
The District was placed on enrollment “stability” funding by the State Chancellor’s Office during fiscal years 2012-2013 and 2013-14 due to missing student enrollment targets during the 2011-12 and 2012-13 fiscal years. The District’s unrestricted general fund balance fell below 5.0% at the end of 2011-12. The District implemented employee reductions-in-force and negotiated pay concessions with all employee groups, including its faculty and classified staff collective bargaining units. As a result, the District closed fiscal year 2012-13 with a 5.0% fund balance.

NOTES TO THE FINANCIAL STATEMENTS June 30, 2014
Redwoods CommunityCollege District
33
With assistance from State Special Trustee Henry, the District has been and continues to implement a multi-year fiscal recovery plan to ensure the District’s continued financial solvency by increasing revenues and reducing expenditures. This comprehensive sustainability plan includes revising District policies and procedures and enacting multi-year budget plans that steadily improve the fund balance each year.
15. IMPACT OF RECENTLY ISSUED ACCOUNTING STANDARDS
In June 2012, GASB issued Statement No. 68, Accounting and Financial Reporting for Pensions – An Amendment of GASB Statement No. 27. This statement will improve accounting and financial reporting by state and local governments for defined benefit pensions and defined contribution pensions. The statement will also improve information provided by state and local governmental employers about financial support for pensions that are provided by other entities. The District’s management has not yet determined the impact that implementation of these standards, which is required on July 1, 2014, will have on the District’s financial statements, if any.
16. CONCENTRATION BENEFICIAL INTEREST IN CHARITABLE REMAINDER ANNUITY TRUST – FOUNDATION
The Foundation was named a remainder beneficiary of a charitable remainder annuity trust, which was created in June 1997. The income beneficiary is to receive, first from income and, to the extent that income is insufficient, from principal, a total annuity each year equal to 7% of the net fair market value of the trust assets on the first day of the trust. Upon the death of the income beneficiary, 33% of the remaining principal is to be distributed to the Foundation.
The Foundation has elected the fair value option in conformity with FASB ASC 825-10 to report its interest in the charitable remainder trust. A noncurrent asset for the charitable remainder trust has been recognized at the present value of the expected future cash flow discounted at a rate of 2.20% at June 30, 2014. Changes in the value of the trust have been reported in the statement of activities as decreases in temporarily restricted net assets.

SUPPLEMENTARY INFORMATION SECTION
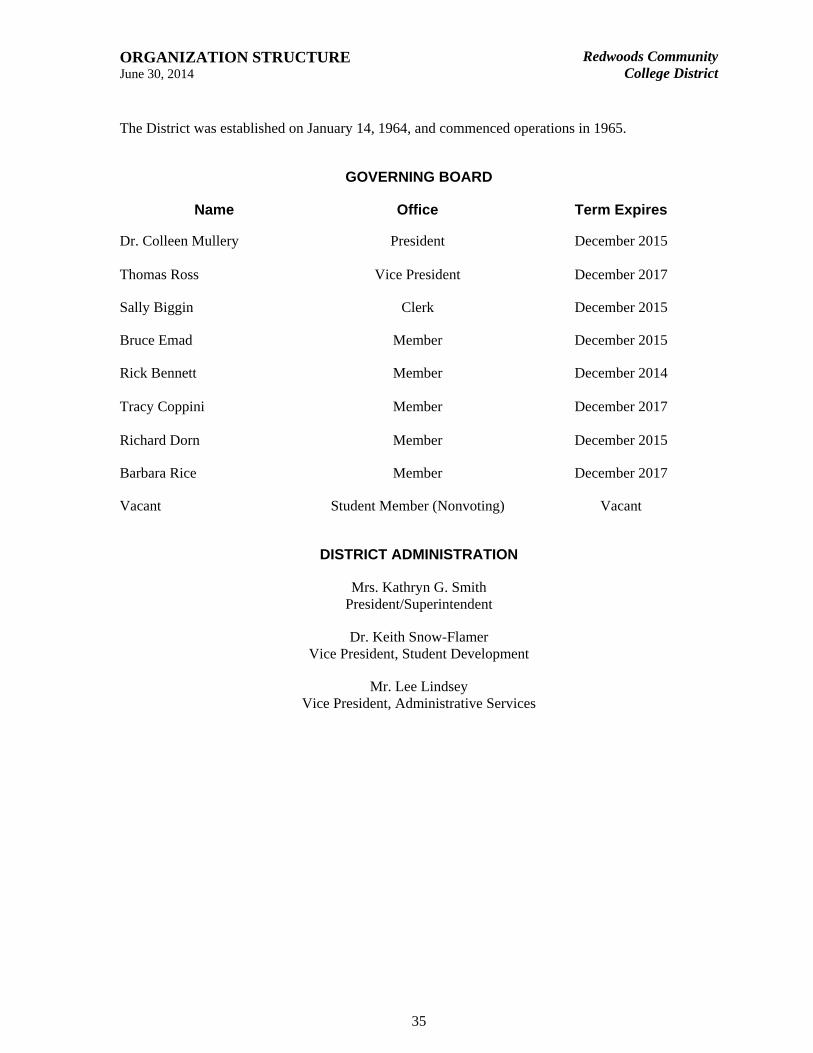
ORGANIZATION STRUCTURE June 30, 2014
Redwoods CommunityCollege District
35
The District was established on January 14, 1964, and commenced operations in 1965.
GOVERNING BOARD
Name Office Term Expires
Dr. Colleen Mullery President December 2015
Thomas Ross Vice President December 2017
Sally Biggin Clerk December 2015
Bruce Emad Member December 2015
Rick Bennett Member December 2014
Tracy Coppini Member December 2017
Richard Dorn Member December 2015
Barbara Rice Member December 2017
Vacant Student Member (Nonvoting) Vacant
DISTRICT ADMINISTRATION
Mrs. Kathryn G. Smith President/Superintendent
Dr. Keith Snow-Flamer Vice President, Student Development
Mr. Lee Lindsey Vice President, Administrative Services

SCHEDULE OF WORKLOAD MEASURES FOR STATE GENERAL APPORTIONMENT June 30, 2014
Redwoods CommunityCollege District
36
The full-time equivalent resident students (FTES) eligible for 2013-14 state apportionment reported to the State of California as of June 30, 2014, are summarized below:
ReportedData
SUMMER INTERSESSION (Summer 2013 only)Credit 22.81
SUMMER INTERSESSION (Summer 2014 - Prior to July 1, 2014)Credit 5.45
PRIMARY TERMS (Exclusive of Summer Intersession)
Census Procedure CoursesWeekly Census Contact Hours 3,021.28 Daily Census Contact Hours 143.70
Actual Hours of Attendance Procedure CoursesNoncredit 13.54 Credit 243.38
Alternative Attendance Accounting ProcedureWeekly Census Contact Hours 264.59 Daily Census Contact Hours 48.79
Total FTES 3,763.54
SUPPLEMENTARY INFORMATION (Subset of above information)
IN-SERVICE TRAINING COURSES (FTES) -
BASIC SKILLS COURSES AND IMMIGRANT EDUCATIONNoncredit 23.38 Credit 311.85
See the accompanying notes to the supplementary information.
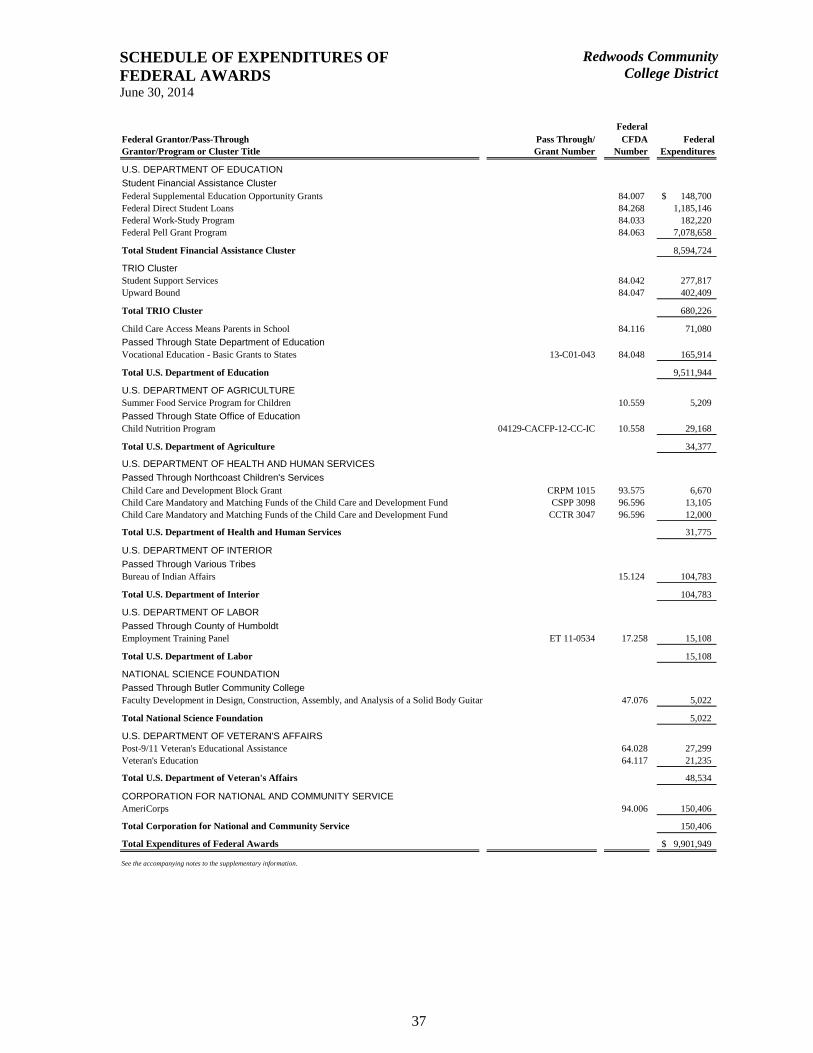
SCHEDULE OF EXPENDITURES OF FEDERAL AWARDS June 30, 2014
Redwoods CommunityCollege District
37
FederalFederal Grantor/Pass-Through Pass Through/ CFDA FederalGrantor/Program or Cluster Title Grant Number Number Expenditures
U.S. DEPARTMENT OF EDUCATION
Student Financial Assistance ClusterFederal Supplemental Education Opportunity Grants 84.007 148,700$ Federal Direct Student Loans 84.268 1,185,146 Federal Work-Study Program 84.033 182,220 Federal Pell Grant Program 84.063 7,078,658
Total Student Financial Assistance Cluster 8,594,724
TRIO ClusterStudent Support Services 84.042 277,817 Upward Bound 84.047 402,409
Total TRIO Cluster 680,226
Child Care Access Means Parents in School 84.116 71,080
Passed Through State Department of EducationVocational Education - Basic Grants to States 13-C01-043 84.048 165,914
Total U.S. Department of Education 9,511,944
U.S. DEPARTMENT OF AGRICULTURESummer Food Service Program for Children 10.559 5,209
Passed Through State Office of EducationChild Nutrition Program 04129-CACFP-12-CC-IC 10.558 29,168
Total U.S. Department of Agriculture 34,377
U.S. DEPARTMENT OF HEALTH AND HUMAN SERVICES
Passed Through Northcoast Children's ServicesChild Care and Development Block Grant CRPM 1015 93.575 6,670 Child Care Mandatory and Matching Funds of the Child Care and Development Fund CSPP 3098 96.596 13,105 Child Care Mandatory and Matching Funds of the Child Care and Development Fund CCTR 3047 96.596 12,000
Total U.S. Department of Health and Human Services 31,775
U.S. DEPARTMENT OF INTERIOR
Passed Through Various TribesBureau of Indian Affairs 15.124 104,783
Total U.S. Department of Interior 104,783
U.S. DEPARTMENT OF LABOR
Passed Through County of HumboldtEmployment Training Panel ET 11-0534 17.258 15,108
Total U.S. Department of Labor 15,108
NATIONAL SCIENCE FOUNDATION
Passed Through Butler Community CollegeFaculty Development in Design, Construction, Assembly, and Analysis of a Solid Body Guitar 47.076 5,022
Total National Science Foundation 5,022
U.S. DEPARTMENT OF VETERAN'S AFFAIRSPost-9/11 Veteran's Educational Assistance 64.028 27,299 Veteran's Education 64.117 21,235
Total U.S. Department of Veteran's Affairs 48,534
CORPORATION FOR NATIONAL AND COMMUNITY SERVICEAmeriCorps 94.006 150,406
Total Corporation for National and Community Service 150,406
Total Expenditures of Federal Awards 9,901,949$
See the accompanying notes to the supplementary information.

SCHEDULE OF EXPENDITURES OF STATE AWARDS June 30, 2014
Redwoods CommunityCollege District
38
Program RevenuesCash Accounts Deferred
Received Receivable Revenue Total
Extended Opportunity Programs and Services 779,053$ -$ (88,085)$ 690,968$ Disabled Students Programs and Services 591,487 - - 591,487 CalGrant 379,012 (10,134) - 368,878 Student Success 281,562 - - 281,562 Student Financial Aid Administration 264,093 - - 264,093 CalWORKS 185,894 (50,982) - 134,912 Foster Parent 177,954 60,017 - 237,971 Prop 20 Lottery 164,566 (28,089) (33,478) 102,999 Nursing Education 156,912 27,265 - 184,177 Community Collaborative (CTE) 155,387 (4,363) - 151,024 Clean Energy 149,096 - (149,096) - State Preschool 147,424 11,865 - 159,289 State Mandated Costs 121,898 - - 121,898 Instructional Equipment & Materials 109,713 - - 109,713 Scheduled Maintenance 109,705 - (90,472) 19,233 Cooperative Agencies Resources for Education 107,479 - - 107,479 Part-Time Faculty Allowance 100,150 - - 100,150 Other categorical aid programs 213,368 71,979 36,055 321,402
Total State Programs 4,194,753$ 77,558$ (325,076)$ 3,947,235$
See the accompanying notes to the supplementary information.
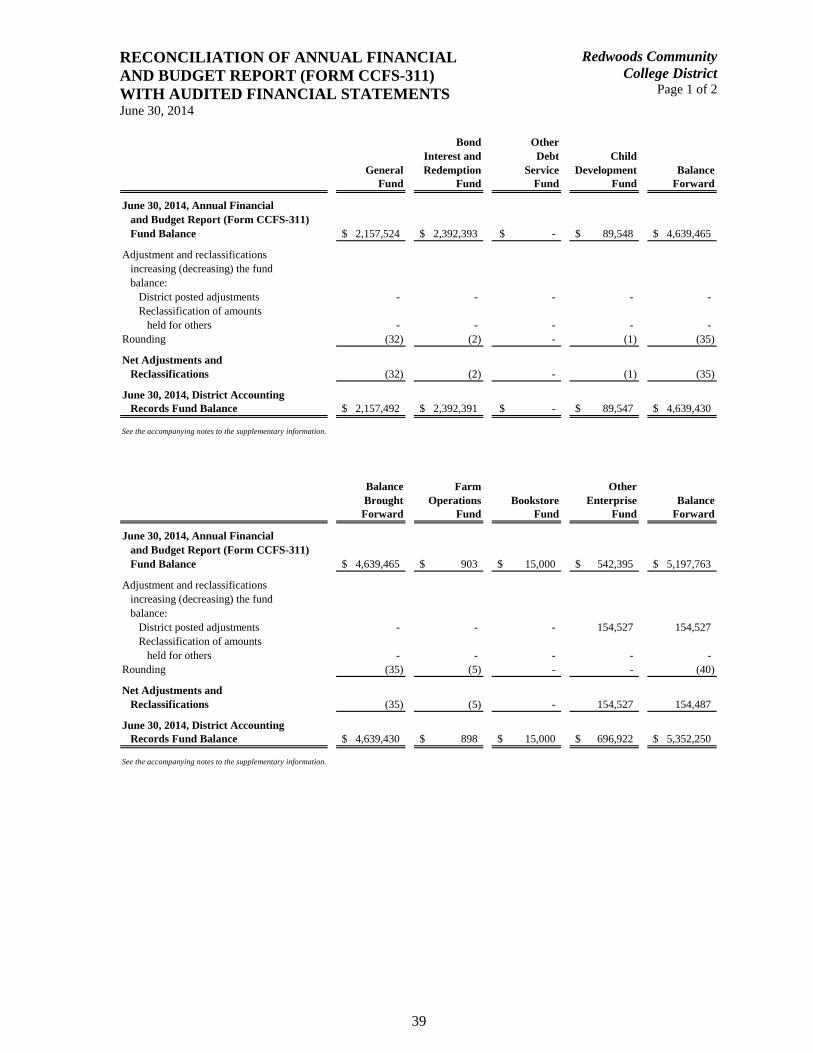
RECONCILIATION OF ANNUAL FINANCIAL AND BUDGET REPORT (FORM CCFS-311) WITH AUDITED FINANCIAL STATEMENTS June 30, 2014
Redwoods CommunityCollege District
Page 1 of 2
39
Bond OtherInterest and Debt Child
General Redemption Service Development BalanceFund Fund Fund Fund Forward
June 30, 2014, Annual Financial and Budget Report (Form CCFS-311)Fund Balance 2,157,524$ 2,392,393$ -$ 89,548$ 4,639,465$
Adjustment and reclassificationsincreasing (decreasing) the fundbalance:
District posted adjustments - - - - - Reclassification of amounts
held for others - - - - - Rounding (32) (2) - (1) (35)
Net Adjustments andReclassifications (32) (2) - (1) (35)
June 30, 2014, District AccountingRecords Fund Balance 2,157,492$ 2,392,391$ -$ 89,547$ 4,639,430$
See the accompanying notes to the supplementary information.
Balance Farm OtherBrought Operations Bookstore Enterprise BalanceForward Fund Fund Fund Forward
June 30, 2014, Annual Financial and Budget Report (Form CCFS-311)Fund Balance 4,639,465$ 903$ 15,000$ 542,395$ 5,197,763$
Adjustment and reclassificationsincreasing (decreasing) the fundbalance:
District posted adjustments - - - 154,527 154,527 Reclassification of amounts
held for others - - - - - Rounding (35) (5) - - (40)
Net Adjustments andReclassifications (35) (5) - 154,527 154,487
June 30, 2014, District AccountingRecords Fund Balance 4,639,430$ 898$ 15,000$ 696,922$ 5,352,250$
See the accompanying notes to the supplementary information.

RECONCILIATION OF ANNUAL FINANCIAL AND BUDGET REPORT (FORM CCFS-311) WITH AUDITED FINANCIAL STATEMENTS June 30, 2014
Redwoods CommunityCollege District
Page 2 of 2
40
Other CapitalBalance Special Outlay EmployeeBrought Revenue Projects Benefit BalanceForward Fund Fund Fund Forward
June 30, 2014, Annual Financial and Budget Report (Form CCFS-311)Fund Balance 5,197,763$ 605,678$ 10,430,422$ 1,901,048$ 18,134,911$
Adjustment and reclassificationsincreasing (decreasing the fundbalance:
District posted adjustments 154,527 - - - 154,527 Reclassification of amounts
held for others - - - - - Rounding (40) 2 2 1 (35)
Net Adjustments andReclassifications 154,487 2 2 1 154,492
June 30, 2014, District AccountingRecords Fund Balance 5,352,250$ 605,680$ 10,430,424$ 1,901,049$ 18,289,403$
See the accompanying notes to the supplementary information.
Balance Associated StudentBrought Students Financial AidForward Trust Fund Trust Fund Total
June 30, 2014, Annual Financial and Budget Report (Form CCFS-311)Fund Balance 18,134,911$ 111,817$ 5$ 18,246,733$
Adjustment and reclassificationsincreasing (decreasing the fundbalance:
District posted adjustments 154,527 - - 154,527 Reclassification of amounts
held for others - (111,818) - (111,818) Rounding (35) 1 - (34)
Net Adjustments andReclassifications 154,492 (111,817) - 42,675
June 30, 2014, District AccountingRecords Fund Balance 18,289,403$ -$ 5$ 18,289,408$
See the accompanying notes to the supplementary information.
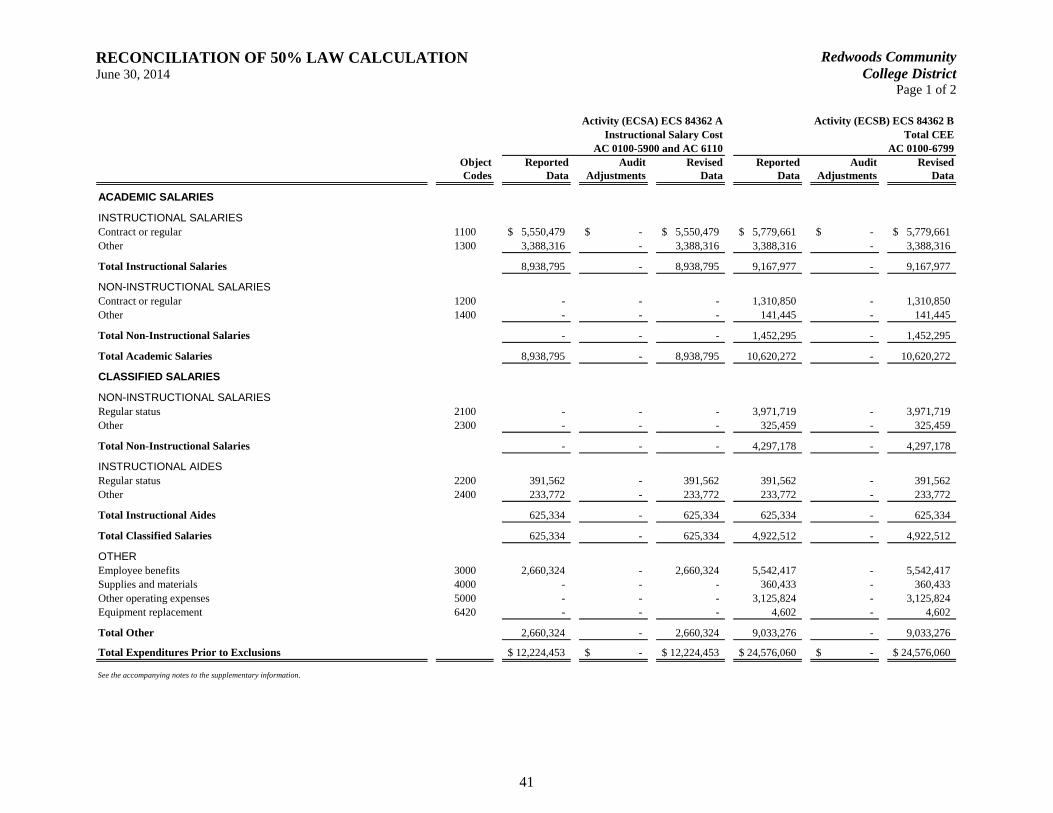
RECONCILIATION OF 50% LAW CALCULATION June 30, 2014
Redwoods CommunityCollege District
Page 1 of 2
41
Activity (ECSA) ECS 84362 A Activity (ECSB) ECS 84362 BInstructional Salary Cost Total CEE
AC 0100-5900 and AC 6110 AC 0100-6799Object Reported Audit Revised Reported Audit RevisedCodes Data Adjustments Data Data Adjustments Data
ACADEMIC SALARIES
INSTRUCTIONAL SALARIESContract or regular 1100 5,550,479$ -$ 5,550,479$ 5,779,661$ -$ 5,779,661$ Other 1300 3,388,316 - 3,388,316 3,388,316 - 3,388,316
Total Instructional Salaries 8,938,795 - 8,938,795 9,167,977 - 9,167,977
NON-INSTRUCTIONAL SALARIESContract or regular 1200 - - - 1,310,850 - 1,310,850 Other 1400 - - - 141,445 - 141,445
Total Non-Instructional Salaries - - - 1,452,295 - 1,452,295
Total Academic Salaries 8,938,795 - 8,938,795 10,620,272 - 10,620,272
CLASSIFIED SALARIES
NON-INSTRUCTIONAL SALARIESRegular status 2100 - - - 3,971,719 - 3,971,719 Other 2300 - - - 325,459 - 325,459
Total Non-Instructional Salaries - - - 4,297,178 - 4,297,178
INSTRUCTIONAL AIDESRegular status 2200 391,562 - 391,562 391,562 - 391,562 Other 2400 233,772 - 233,772 233,772 - 233,772
Total Instructional Aides 625,334 - 625,334 625,334 - 625,334
Total Classified Salaries 625,334 - 625,334 4,922,512 - 4,922,512
OTHEREmployee benefits 3000 2,660,324 - 2,660,324 5,542,417 - 5,542,417 Supplies and materials 4000 - - - 360,433 - 360,433 Other operating expenses 5000 - - - 3,125,824 - 3,125,824 Equipment replacement 6420 - - - 4,602 - 4,602
Total Other 2,660,324 - 2,660,324 9,033,276 - 9,033,276
Total Expenditures Prior to Exclusions 12,224,453$ -$ 12,224,453$ 24,576,060$ -$ 24,576,060$
See the accompanying notes to the supplementary information.
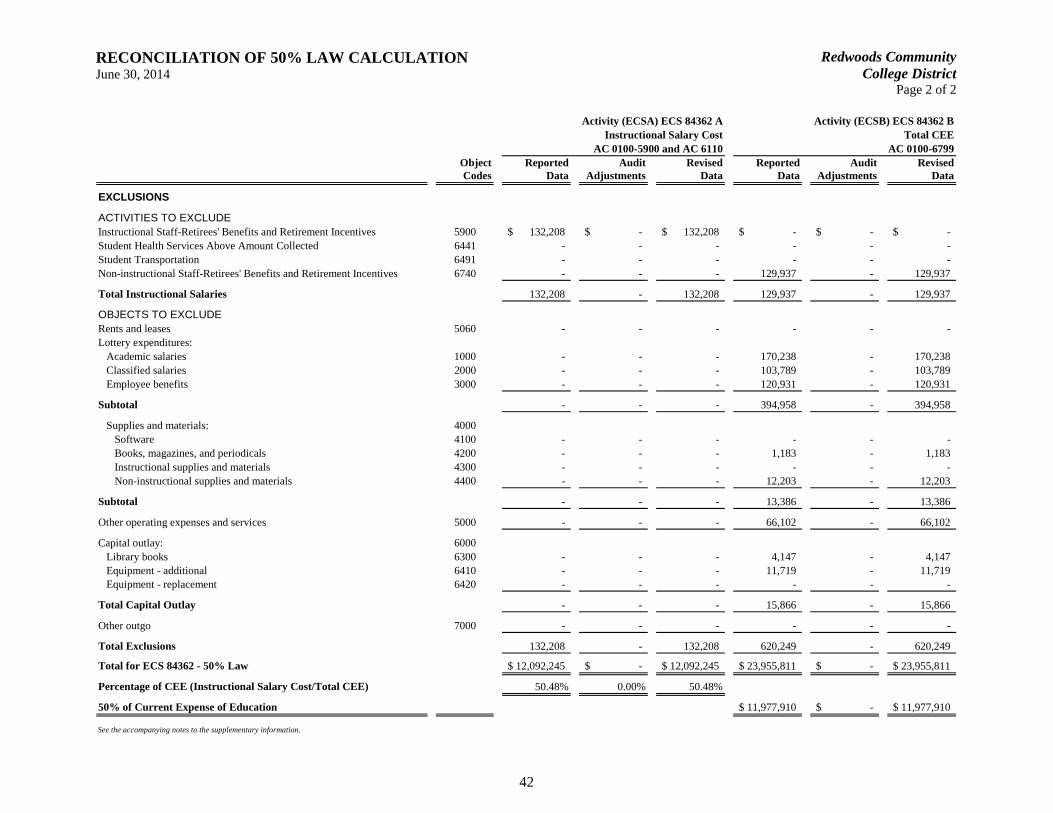
RECONCILIATION OF 50% LAW CALCULATION June 30, 2014
Redwoods CommunityCollege District
Page 2 of 2
42
Activity (ECSA) ECS 84362 A Activity (ECSB) ECS 84362 BInstructional Salary Cost Total CEE
AC 0100-5900 and AC 6110 AC 0100-6799Object Reported Audit Revised Reported Audit RevisedCodes Data Adjustments Data Data Adjustments Data
EXCLUSIONS
ACTIVITIES TO EXCLUDEInstructional Staff-Retirees' Benefits and Retirement Incentives 5900 132,208$ -$ 132,208$ -$ -$ -$ Student Health Services Above Amount Collected 6441 - - - - - - Student Transportation 6491 - - - - - - Non-instructional Staff-Retirees' Benefits and Retirement Incentives 6740 - - - 129,937 - 129,937
Total Instructional Salaries 132,208 - 132,208 129,937 - 129,937
OBJECTS TO EXCLUDERents and leases 5060 - - - - - - Lottery expenditures:
Academic salaries 1000 - - - 170,238 - 170,238 Classified salaries 2000 - - - 103,789 - 103,789 Employee benefits 3000 - - - 120,931 - 120,931
Subtotal - - - 394,958 - 394,958
Supplies and materials: 4000Software 4100 - - - - - - Books, magazines, and periodicals 4200 - - - 1,183 - 1,183 Instructional supplies and materials 4300 - - - - - - Non-instructional supplies and materials 4400 - - - 12,203 - 12,203
Subtotal - - - 13,386 - 13,386
Other operating expenses and services 5000 - - - 66,102 - 66,102
Capital outlay: 6000Library books 6300 - - - 4,147 - 4,147 Equipment - additional 6410 - - - 11,719 - 11,719 Equipment - replacement 6420 - - - - - -
Total Capital Outlay - - - 15,866 - 15,866
Other outgo 7000 - - - - - -
Total Exclusions 132,208 - 132,208 620,249 - 620,249
Total for ECS 84362 - 50% Law 12,092,245$ -$ 12,092,245$ 23,955,811$ -$ 23,955,811$
Percentage of CEE (Instructional Salary Cost/Total CEE) 50.48% 0.00% 50.48%
50% of Current Expense of Education 11,977,910$ -$ 11,977,910$
See the accompanying notes to the supplementary information.
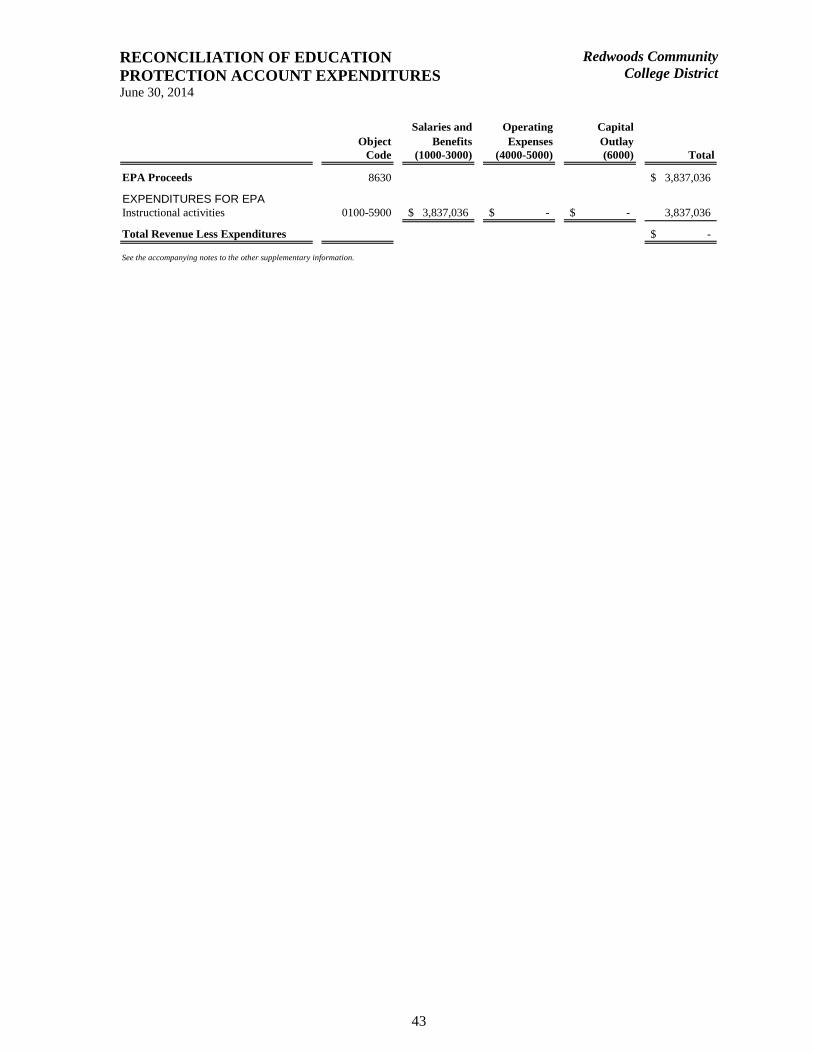
RECONCILIATION OF EDUCATION PROTECTION ACCOUNT EXPENDITURESJune 30, 2014
Redwoods CommunityCollege District
43
Salaries and Operating CapitalObject Benefits Expenses Outlay
Code (1000-3000) (4000-5000) (6000) Total
EPA Proceeds 8630 3,837,036$
EXPENDITURES FOR EPAInstructional activities 0100-5900 3,837,036$ -$ -$ 3,837,036
Total Revenue Less Expenditures -$
See the accompanying notes to the other supplementary information.
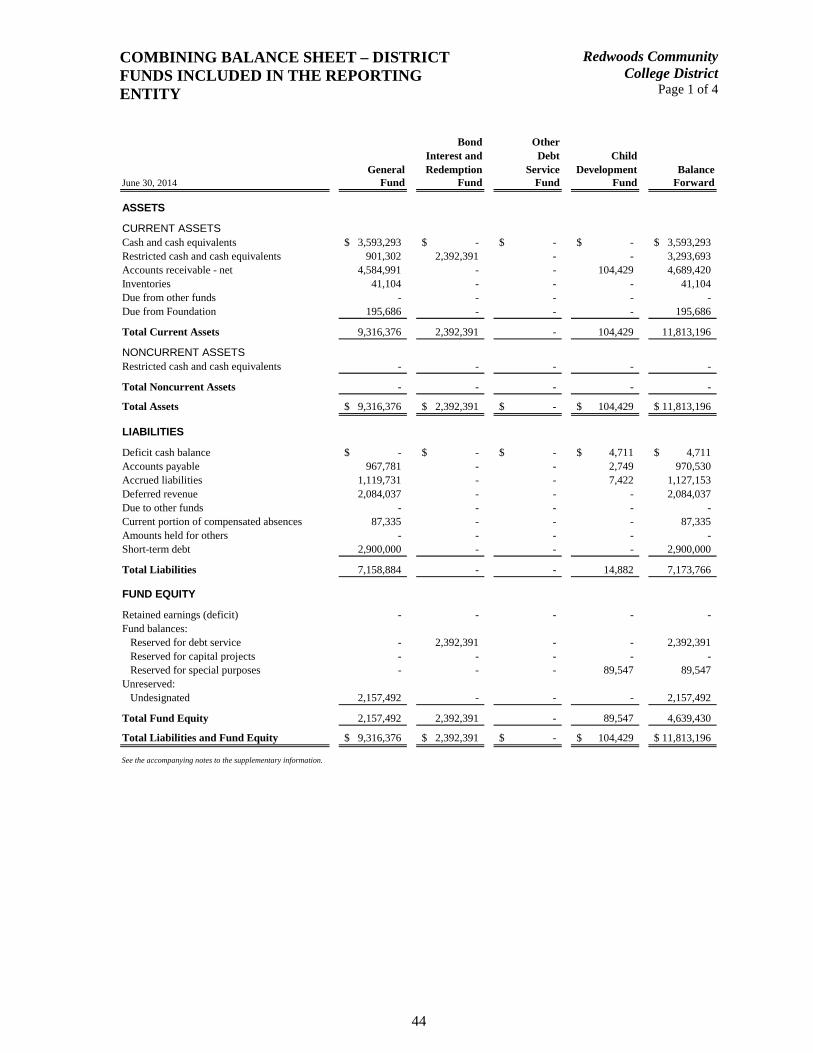
COMBINING BALANCE SHEET – DISTRICT FUNDS INCLUDED IN THE REPORTING ENTITY
Redwoods CommunityCollege District
Page 1 of 4
44
Bond OtherInterest and Debt Child
General Redemption Service Development BalanceJune 30, 2014 Fund Fund Fund Fund Forward
ASSETS
CURRENT ASSETSCash and cash equivalents 3,593,293$ -$ -$ -$ 3,593,293$ Restricted cash and cash equivalents 901,302 2,392,391 - - 3,293,693 Accounts receivable - net 4,584,991 - - 104,429 4,689,420 Inventories 41,104 - - - 41,104 Due from other funds - - - - - Due from Foundation 195,686 - - - 195,686
Total Current Assets 9,316,376 2,392,391 - 104,429 11,813,196
NONCURRENT ASSETSRestricted cash and cash equivalents - - - - -
Total Noncurrent Assets - - - - -
Total Assets 9,316,376$ 2,392,391$ -$ 104,429$ 11,813,196$
LIABILITIES
Deficit cash balance -$ -$ -$ 4,711$ 4,711$ Accounts payable 967,781 - - 2,749 970,530 Accrued liabilities 1,119,731 - - 7,422 1,127,153 Deferred revenue 2,084,037 - - - 2,084,037 Due to other funds - - - - - Current portion of compensated absences 87,335 - - - 87,335 Amounts held for others - - - - - Short-term debt 2,900,000 - - - 2,900,000
Total Liabilities 7,158,884 - - 14,882 7,173,766
FUND EQUITY
Retained earnings (deficit) - - - - - Fund balances:
Reserved for debt service - 2,392,391 - - 2,392,391 Reserved for capital projects - - - - - Reserved for special purposes - - - 89,547 89,547
Unreserved:Undesignated 2,157,492 - - - 2,157,492
Total Fund Equity 2,157,492 2,392,391 - 89,547 4,639,430
Total Liabilities and Fund Equity 9,316,376$ 2,392,391$ -$ 104,429$ 11,813,196$
See the accompanying notes to the supplementary information.

COMBINING BALANCE SHEET – DISTRICT FUNDS INCLUDED IN THE REPORTING ENTITY
Redwoods CommunityCollege District
Page 2 of 4
45
Balance Farm OtherBrought Operations Bookstore Enterprise Balance
June 30, 2014 Forward Fund Fund Fund Forward
ASSETS
CURRENT ASSETSCash and cash equivalents 3,593,293$ 6,081$ 15,000$ 440,128$ 4,054,502$ Restricted cash and cash equivalents 3,293,693 - - - 3,293,693 Accounts receivable - net 4,689,420 - - 61,560 4,750,980 Inventories 41,104 - - 288,554 329,658 Due from other funds - - - - - Due from Foundation 195,686 - - - 195,686
Total Current Assets 11,813,196 6,081 15,000 790,242 12,624,519
NONCURRENT ASSETSRestricted cash and cash equivalents - - - - -
Total Noncurrent Assets - - - - -
Total Assets 11,813,196$ 6,081$ 15,000$ 790,242$ 12,624,519$
LIABILITIES
Deficit cash balance 4,711$ -$ -$ -$ 4,711$ Accounts payable 970,530 5,183 - 19,354 995,067 Accrued liabilities 1,127,153 - - 21,098 1,148,251 Deferred revenue 2,084,037 - - 52,868 2,136,905 Due to other funds - - - - - Current portion of compensated absences 87,335 - - - 87,335 Amounts held for others - - - - - Short-term debt 2,900,000 - - - 2,900,000
Total Liabilities 7,173,766 5,183 - 93,320 7,272,269
FUND EQUITY
Retained earnings (deficit) - 898 15,000 - 15,898 Fund balances:
Reserved for debt service 2,392,391 - - - 2,392,391 Reserved for capital projects - - - - - Reserved for special purposes 89,547 - - - 89,547
Unreserved:Undesignated 2,157,492 - - 696,922 2,854,414
Total Fund Equity 4,639,430 898 15,000 696,922 5,352,250
Total Liabilities and Fund Equity 11,813,196$ 6,081$ 15,000$ 790,242$ 12,624,519$
See the accompanying notes to the supplementary information.

COMBINING BALANCE SHEET – DISTRICT FUNDS INCLUDED IN THE REPORTING ENTITY
Redwoods CommunityCollege District
Page 3 of 4
46
Other CapitalBalance Special Outlay BondBrought Revenue Projects Construction Balance
June 30, 2014 Forward Fund Fund Fund Forward
ASSETS
CURRENT ASSETSCash and cash equivalents 4,054,502$ 602,935$ -$ -$ 4,657,437$ Restricted cash and cash equivalents 3,293,693 - - - 3,293,693 Accounts receivable - net 4,750,980 19,940 - - 4,770,920 Inventories 329,658 - - - 329,658 Due from other funds - - - - - Due from Foundation 195,686 - - - 195,686
Total Current Assets 12,624,519 622,875 - - 13,247,394
NONCURRENT ASSETSRestricted cash and cash equivalents - - 385,562 10,447,716 10,833,278
Total Noncurrent Assets - - 385,562 10,447,716 10,833,278
Total Assets 12,624,519$ 622,875$ 385,562$ 10,447,716$ 24,080,672$
LIABILITIES
Deficit cash balance 4,711$ -$ -$ -$ 4,711$ Accounts payable 995,067 17,195 25,704 121,171 1,159,137 Accrued liabilities 1,148,251 - - 6,008 1,154,259 Deferred revenue 2,136,905 - 249,971 - 2,386,876 Due to other funds - - - - - Current portion of compensated absences 87,335 - - - 87,335 Amounts held for others - - - - - Short-term debt 2,900,000 - - - 2,900,000
Total Liabilities 7,272,269 17,195 275,675 127,179 7,692,318
FUND EQUITY
Retained earnings (deficit) 15,898 - - - 15,898 Fund balances:
Reserved for debt service 2,392,391 - - - 2,392,391 Reserved for capital projects - - 109,887 10,320,537 10,430,424 Reserved for special purposes 89,547 - - - 89,547
Unreserved:Undesignated 2,854,414 605,680 - - 3,460,094
Total Fund Equity 5,352,250 605,680 109,887 10,320,537 16,388,354
Total Liabilities and Fund Equity 12,624,519$ 622,875$ 385,562$ 10,447,716$ 24,080,672$
See the accompanying notes to the supplementary information.
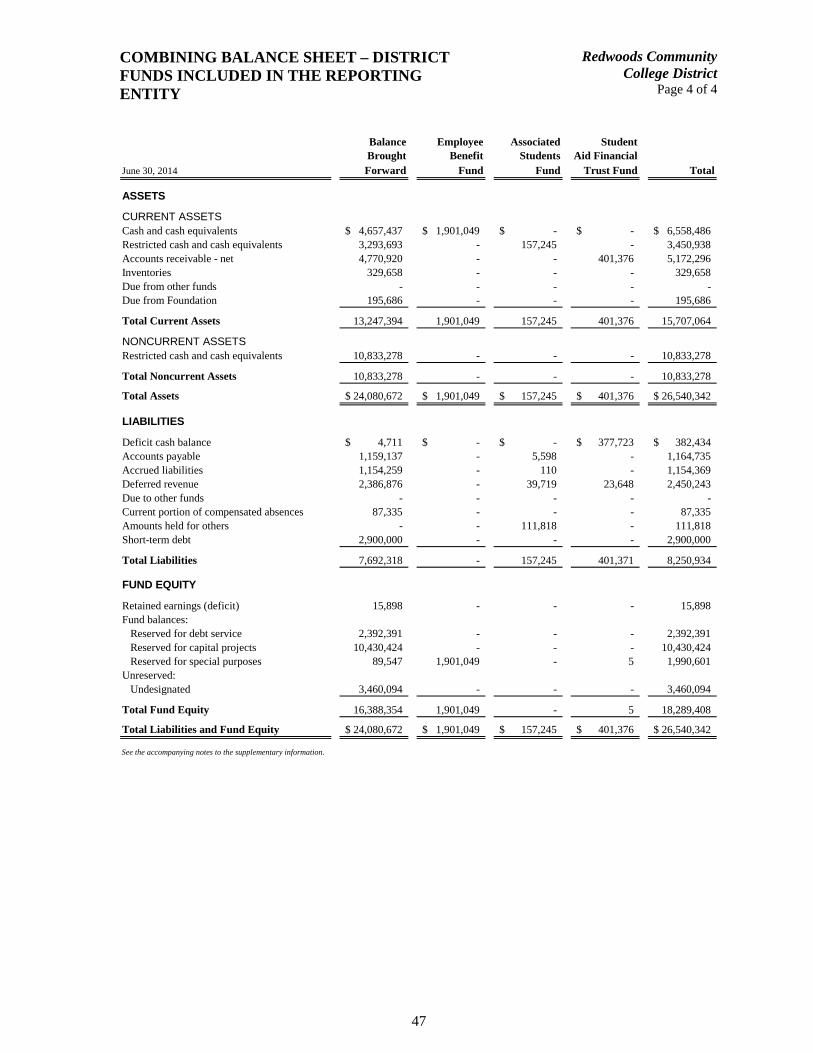
COMBINING BALANCE SHEET – DISTRICT FUNDS INCLUDED IN THE REPORTING ENTITY
Redwoods CommunityCollege District
Page 4 of 4
47
Balance Employee Associated StudentBrought Benefit Students Aid Financial
June 30, 2014 Forward Fund Fund Trust Fund Total
ASSETS
CURRENT ASSETSCash and cash equivalents 4,657,437$ 1,901,049$ -$ -$ 6,558,486$ Restricted cash and cash equivalents 3,293,693 - 157,245 - 3,450,938 Accounts receivable - net 4,770,920 - - 401,376 5,172,296 Inventories 329,658 - - - 329,658 Due from other funds - - - - - Due from Foundation 195,686 - - - 195,686
Total Current Assets 13,247,394 1,901,049 157,245 401,376 15,707,064
NONCURRENT ASSETSRestricted cash and cash equivalents 10,833,278 - - - 10,833,278
Total Noncurrent Assets 10,833,278 - - - 10,833,278
Total Assets 24,080,672$ 1,901,049$ 157,245$ 401,376$ 26,540,342$
LIABILITIES
Deficit cash balance 4,711$ -$ -$ 377,723$ 382,434$ Accounts payable 1,159,137 - 5,598 - 1,164,735 Accrued liabilities 1,154,259 - 110 - 1,154,369 Deferred revenue 2,386,876 - 39,719 23,648 2,450,243 Due to other funds - - - - - Current portion of compensated absences 87,335 - - - 87,335 Amounts held for others - - 111,818 - 111,818 Short-term debt 2,900,000 - - - 2,900,000
Total Liabilities 7,692,318 - 157,245 401,371 8,250,934
FUND EQUITY
Retained earnings (deficit) 15,898 - - - 15,898 Fund balances:
Reserved for debt service 2,392,391 - - - 2,392,391 Reserved for capital projects 10,430,424 - - - 10,430,424 Reserved for special purposes 89,547 1,901,049 - 5 1,990,601
Unreserved:Undesignated 3,460,094 - - - 3,460,094
Total Fund Equity 16,388,354 1,901,049 - 5 18,289,408
Total Liabilities and Fund Equity 24,080,672$ 1,901,049$ 157,245$ 401,376$ 26,540,342$
See the accompanying notes to the supplementary information.
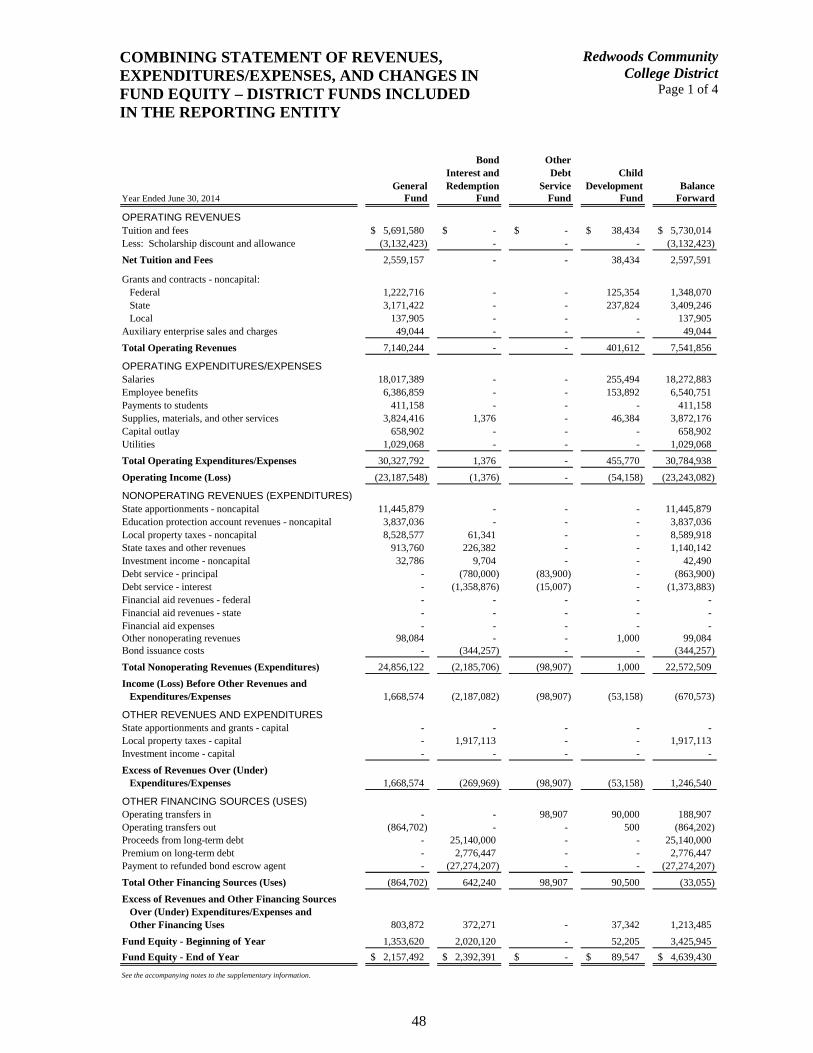
COMBINING STATEMENT OF REVENUES, EXPENDITURES/EXPENSES, AND CHANGES IN FUND EQUITY – DISTRICT FUNDS INCLUDED IN THE REPORTING ENTITY
Redwoods CommunityCollege District
Page 1 of 4
48
Bond OtherInterest and Debt Child
General Redemption Service Development BalanceYear Ended June 30, 2014 Fund Fund Fund Fund Forward
OPERATING REVENUESTuition and fees 5,691,580$ -$ -$ 38,434$ 5,730,014$ Less: Scholarship discount and allowance (3,132,423) - - - (3,132,423)
Net Tuition and Fees 2,559,157 - - 38,434 2,597,591
Grants and contracts - noncapital:Federal 1,222,716 - - 125,354 1,348,070 State 3,171,422 - - 237,824 3,409,246 Local 137,905 - - - 137,905
Auxiliary enterprise sales and charges 49,044 - - - 49,044
Total Operating Revenues 7,140,244 - - 401,612 7,541,856
OPERATING EXPENDITURES/EXPENSESSalaries 18,017,389 - - 255,494 18,272,883 Employee benefits 6,386,859 - - 153,892 6,540,751 Payments to students 411,158 - - - 411,158 Supplies, materials, and other services 3,824,416 1,376 - 46,384 3,872,176 Capital outlay 658,902 - - - 658,902 Utilities 1,029,068 - - - 1,029,068
Total Operating Expenditures/Expenses 30,327,792 1,376 - 455,770 30,784,938
Operating Income (Loss) (23,187,548) (1,376) - (54,158) (23,243,082)
NONOPERATING REVENUES (EXPENDITURES)State apportionments - noncapital 11,445,879 - - - 11,445,879 Education protection account revenues - noncapital 3,837,036 - - - 3,837,036 Local property taxes - noncapital 8,528,577 61,341 - - 8,589,918 State taxes and other revenues 913,760 226,382 - - 1,140,142 Investment income - noncapital 32,786 9,704 - - 42,490 Debt service - principal - (780,000) (83,900) - (863,900) Debt service - interest - (1,358,876) (15,007) - (1,373,883) Financial aid revenues - federal - - - - - Financial aid revenues - state - - - - - Financial aid expenses - - - - - Other nonoperating revenues 98,084 - - 1,000 99,084 Bond issuance costs - (344,257) - - (344,257)
Total Nonoperating Revenues (Expenditures) 24,856,122 (2,185,706) (98,907) 1,000 22,572,509
Income (Loss) Before Other Revenues and Expenditures/Expenses 1,668,574 (2,187,082) (98,907) (53,158) (670,573)
OTHER REVENUES AND EXPENDITURESState apportionments and grants - capital - - - - - Local property taxes - capital - 1,917,113 - - 1,917,113 Investment income - capital - - - - -
Excess of Revenues Over (Under) Expenditures/Expenses 1,668,574 (269,969) (98,907) (53,158) 1,246,540
OTHER FINANCING SOURCES (USES)Operating transfers in - - 98,907 90,000 188,907 Operating transfers out (864,702) - - 500 (864,202) Proceeds from long-term debt - 25,140,000 - - 25,140,000 Premium on long-term debt - 2,776,447 - - 2,776,447 Payment to refunded bond escrow agent - (27,274,207) - - (27,274,207)
Total Other Financing Sources (Uses) (864,702) 642,240 98,907 90,500 (33,055)
Excess of Revenues and Other Financing SourcesOver (Under) Expenditures/Expenses andOther Financing Uses 803,872 372,271 - 37,342 1,213,485
Fund Equity - Beginning of Year 1,353,620 2,020,120 - 52,205 3,425,945
Fund Equity - End of Year 2,157,492$ 2,392,391$ -$ 89,547$ 4,639,430$
See the accompanying notes to the supplementary information.
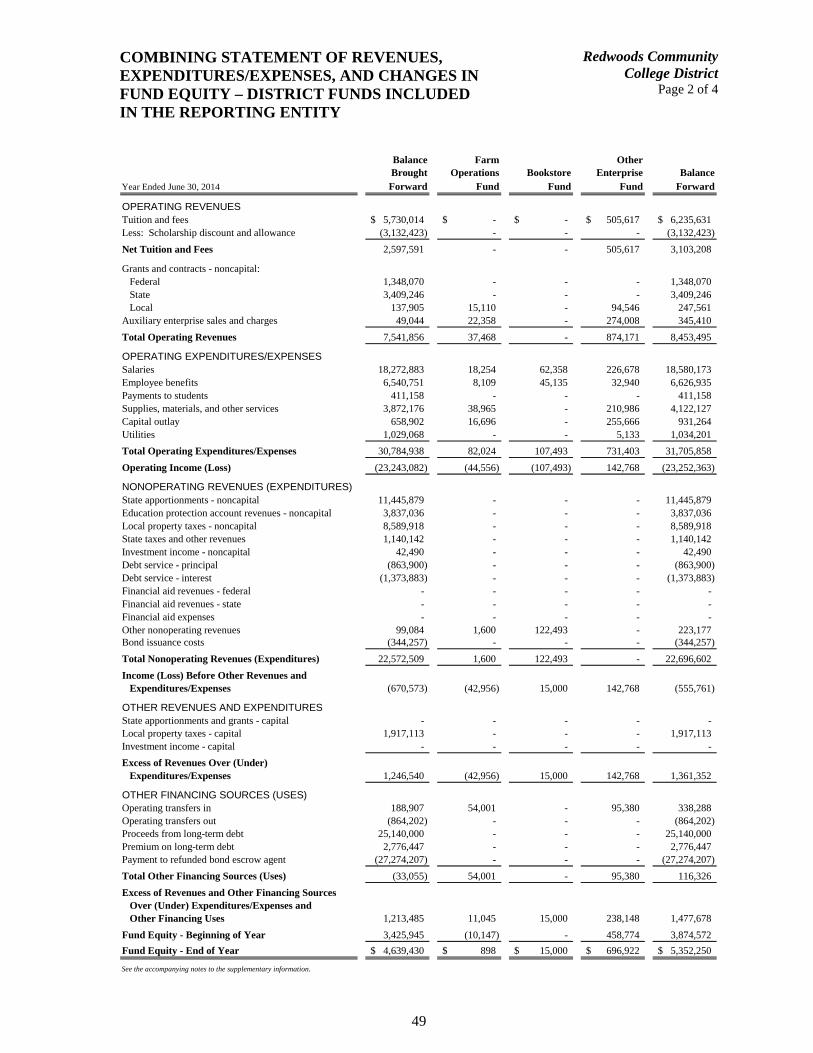
COMBINING STATEMENT OF REVENUES, EXPENDITURES/EXPENSES, AND CHANGES IN FUND EQUITY – DISTRICT FUNDS INCLUDED IN THE REPORTING ENTITY
Redwoods CommunityCollege District
Page 2 of 4
49
Balance Farm OtherBrought Operations Bookstore Enterprise Balance
Year Ended June 30, 2014 Forward Fund Fund Fund Forward
OPERATING REVENUESTuition and fees 5,730,014$ -$ -$ 505,617$ 6,235,631$ Less: Scholarship discount and allowance (3,132,423) - - - (3,132,423)
Net Tuition and Fees 2,597,591 - - 505,617 3,103,208
Grants and contracts - noncapital:Federal 1,348,070 - - - 1,348,070 State 3,409,246 - - - 3,409,246 Local 137,905 15,110 - 94,546 247,561
Auxiliary enterprise sales and charges 49,044 22,358 - 274,008 345,410
Total Operating Revenues 7,541,856 37,468 - 874,171 8,453,495
OPERATING EXPENDITURES/EXPENSESSalaries 18,272,883 18,254 62,358 226,678 18,580,173 Employee benefits 6,540,751 8,109 45,135 32,940 6,626,935 Payments to students 411,158 - - - 411,158 Supplies, materials, and other services 3,872,176 38,965 - 210,986 4,122,127 Capital outlay 658,902 16,696 - 255,666 931,264 Utilities 1,029,068 - - 5,133 1,034,201
Total Operating Expenditures/Expenses 30,784,938 82,024 107,493 731,403 31,705,858
Operating Income (Loss) (23,243,082) (44,556) (107,493) 142,768 (23,252,363)
NONOPERATING REVENUES (EXPENDITURES)State apportionments - noncapital 11,445,879 - - - 11,445,879 Education protection account revenues - noncapital 3,837,036 - - - 3,837,036 Local property taxes - noncapital 8,589,918 - - - 8,589,918 State taxes and other revenues 1,140,142 - - - 1,140,142 Investment income - noncapital 42,490 - - - 42,490 Debt service - principal (863,900) - - - (863,900) Debt service - interest (1,373,883) - - - (1,373,883) Financial aid revenues - federal - - - - - Financial aid revenues - state - - - - - Financial aid expenses - - - - - Other nonoperating revenues 99,084 1,600 122,493 - 223,177 Bond issuance costs (344,257) - - - (344,257)
Total Nonoperating Revenues (Expenditures) 22,572,509 1,600 122,493 - 22,696,602
Income (Loss) Before Other Revenues and Expenditures/Expenses (670,573) (42,956) 15,000 142,768 (555,761)
OTHER REVENUES AND EXPENDITURESState apportionments and grants - capital - - - - - Local property taxes - capital 1,917,113 - - - 1,917,113 Investment income - capital - - - - -
Excess of Revenues Over (Under) Expenditures/Expenses 1,246,540 (42,956) 15,000 142,768 1,361,352
OTHER FINANCING SOURCES (USES)Operating transfers in 188,907 54,001 - 95,380 338,288 Operating transfers out (864,202) - - - (864,202) Proceeds from long-term debt 25,140,000 - - - 25,140,000 Premium on long-term debt 2,776,447 - - - 2,776,447 Payment to refunded bond escrow agent (27,274,207) - - - (27,274,207)
Total Other Financing Sources (Uses) (33,055) 54,001 - 95,380 116,326
Excess of Revenues and Other Financing SourcesOver (Under) Expenditures/Expenses andOther Financing Uses 1,213,485 11,045 15,000 238,148 1,477,678
Fund Equity - Beginning of Year 3,425,945 (10,147) - 458,774 3,874,572
Fund Equity - End of Year 4,639,430$ 898$ 15,000$ 696,922$ 5,352,250$
See the accompanying notes to the supplementary information.
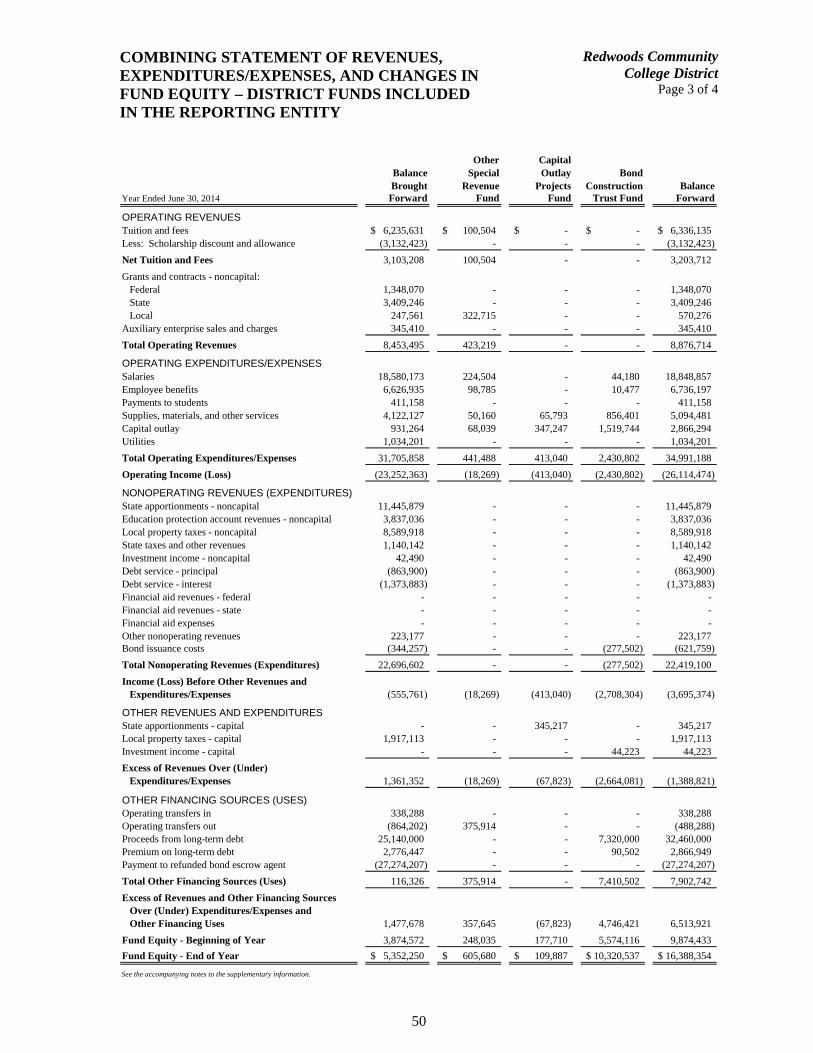
COMBINING STATEMENT OF REVENUES, EXPENDITURES/EXPENSES, AND CHANGES IN FUND EQUITY – DISTRICT FUNDS INCLUDED IN THE REPORTING ENTITY
Redwoods CommunityCollege District
Page 3 of 4
50
Other CapitalBalance Special Outlay BondBrought Revenue Projects Construction Balance
Year Ended June 30, 2014 Forward Fund Fund Trust Fund Forward
OPERATING REVENUESTuition and fees 6,235,631$ 100,504$ -$ -$ 6,336,135$ Less: Scholarship discount and allowance (3,132,423) - - - (3,132,423)
Net Tuition and Fees 3,103,208 100,504 - - 3,203,712
Grants and contracts - noncapital:Federal 1,348,070 - - - 1,348,070 State 3,409,246 - - - 3,409,246 Local 247,561 322,715 - - 570,276
Auxiliary enterprise sales and charges 345,410 - - - 345,410
Total Operating Revenues 8,453,495 423,219 - - 8,876,714
OPERATING EXPENDITURES/EXPENSESSalaries 18,580,173 224,504 - 44,180 18,848,857 Employee benefits 6,626,935 98,785 - 10,477 6,736,197 Payments to students 411,158 - - - 411,158 Supplies, materials, and other services 4,122,127 50,160 65,793 856,401 5,094,481 Capital outlay 931,264 68,039 347,247 1,519,744 2,866,294 Utilities 1,034,201 - - - 1,034,201
Total Operating Expenditures/Expenses 31,705,858 441,488 413,040 2,430,802 34,991,188
Operating Income (Loss) (23,252,363) (18,269) (413,040) (2,430,802) (26,114,474)
NONOPERATING REVENUES (EXPENDITURES)State apportionments - noncapital 11,445,879 - - - 11,445,879 Education protection account revenues - noncapital 3,837,036 - - - 3,837,036 Local property taxes - noncapital 8,589,918 - - - 8,589,918 State taxes and other revenues 1,140,142 - - - 1,140,142 Investment income - noncapital 42,490 - - - 42,490 Debt service - principal (863,900) - - - (863,900) Debt service - interest (1,373,883) - - - (1,373,883) Financial aid revenues - federal - - - - - Financial aid revenues - state - - - - - Financial aid expenses - - - - - Other nonoperating revenues 223,177 - - - 223,177 Bond issuance costs (344,257) - - (277,502) (621,759)
Total Nonoperating Revenues (Expenditures) 22,696,602 - - (277,502) 22,419,100
Income (Loss) Before Other Revenues and Expenditures/Expenses (555,761) (18,269) (413,040) (2,708,304) (3,695,374)
OTHER REVENUES AND EXPENDITURESState apportionments - capital - - 345,217 - 345,217 Local property taxes - capital 1,917,113 - - - 1,917,113 Investment income - capital - - - 44,223 44,223
Excess of Revenues Over (Under) Expenditures/Expenses 1,361,352 (18,269) (67,823) (2,664,081) (1,388,821)
OTHER FINANCING SOURCES (USES)Operating transfers in 338,288 - - - 338,288 Operating transfers out (864,202) 375,914 - - (488,288) Proceeds from long-term debt 25,140,000 - - 7,320,000 32,460,000 Premium on long-term debt 2,776,447 - - 90,502 2,866,949 Payment to refunded bond escrow agent (27,274,207) - - - (27,274,207)
Total Other Financing Sources (Uses) 116,326 375,914 - 7,410,502 7,902,742
Excess of Revenues and Other Financing SourcesOver (Under) Expenditures/Expenses andOther Financing Uses 1,477,678 357,645 (67,823) 4,746,421 6,513,921
Fund Equity - Beginning of Year 3,874,572 248,035 177,710 5,574,116 9,874,433
Fund Equity - End of Year 5,352,250$ 605,680$ 109,887$ 10,320,537$ 16,388,354$
See the accompanying notes to the supplementary information.
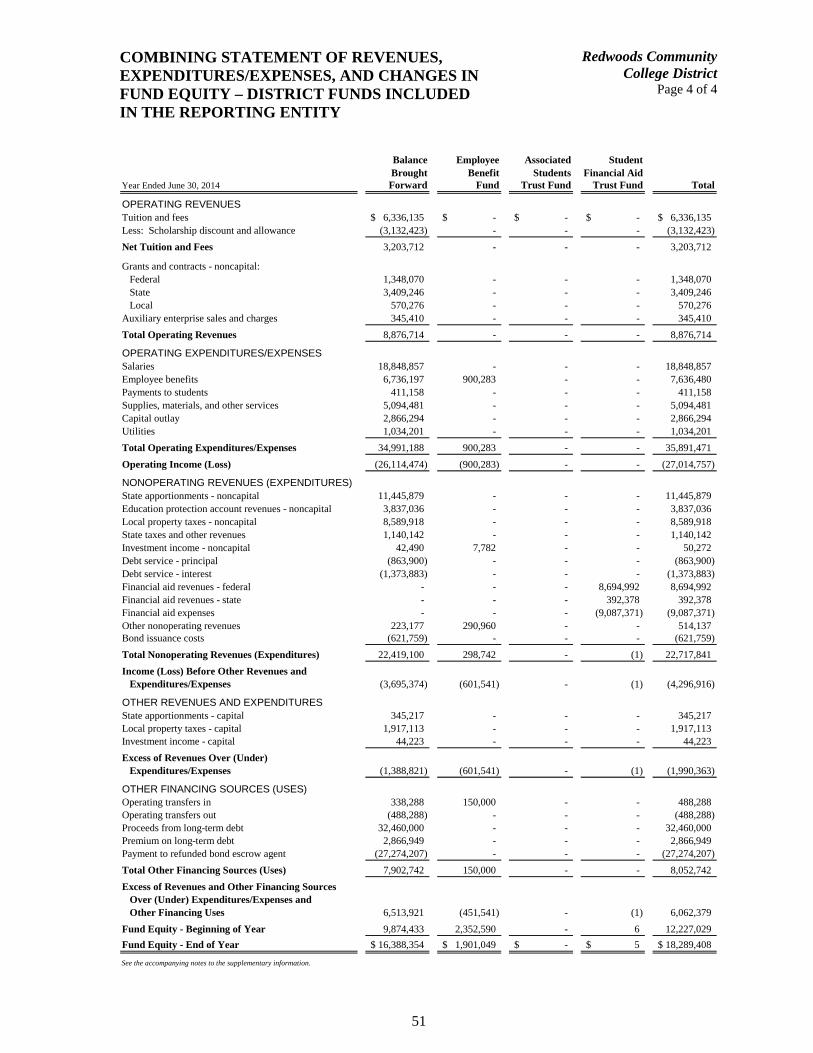
COMBINING STATEMENT OF REVENUES, EXPENDITURES/EXPENSES, AND CHANGES IN FUND EQUITY – DISTRICT FUNDS INCLUDED IN THE REPORTING ENTITY
Redwoods CommunityCollege District
Page 4 of 4
51
Balance Employee Associated StudentBrought Benefit Students Financial Aid
Year Ended June 30, 2014 Forward Fund Trust Fund Trust Fund Total
OPERATING REVENUESTuition and fees 6,336,135$ -$ -$ -$ 6,336,135$ Less: Scholarship discount and allowance (3,132,423) - - - (3,132,423)
Net Tuition and Fees 3,203,712 - - - 3,203,712
Grants and contracts - noncapital:Federal 1,348,070 - - - 1,348,070 State 3,409,246 - - - 3,409,246 Local 570,276 - - - 570,276
Auxiliary enterprise sales and charges 345,410 - - - 345,410
Total Operating Revenues 8,876,714 - - - 8,876,714
OPERATING EXPENDITURES/EXPENSESSalaries 18,848,857 - - - 18,848,857 Employee benefits 6,736,197 900,283 - - 7,636,480 Payments to students 411,158 - - - 411,158 Supplies, materials, and other services 5,094,481 - - - 5,094,481 Capital outlay 2,866,294 - - - 2,866,294 Utilities 1,034,201 - - - 1,034,201
Total Operating Expenditures/Expenses 34,991,188 900,283 - - 35,891,471
Operating Income (Loss) (26,114,474) (900,283) - - (27,014,757)
NONOPERATING REVENUES (EXPENDITURES)State apportionments - noncapital 11,445,879 - - - 11,445,879 Education protection account revenues - noncapital 3,837,036 - - - 3,837,036 Local property taxes - noncapital 8,589,918 - - - 8,589,918 State taxes and other revenues 1,140,142 - - - 1,140,142 Investment income - noncapital 42,490 7,782 - - 50,272 Debt service - principal (863,900) - - - (863,900) Debt service - interest (1,373,883) - - - (1,373,883) Financial aid revenues - federal - - - 8,694,992 8,694,992 Financial aid revenues - state - - - 392,378 392,378 Financial aid expenses - - - (9,087,371) (9,087,371) Other nonoperating revenues 223,177 290,960 - - 514,137 Bond issuance costs (621,759) - - - (621,759)
Total Nonoperating Revenues (Expenditures) 22,419,100 298,742 - (1) 22,717,841
Income (Loss) Before Other Revenues and Expenditures/Expenses (3,695,374) (601,541) - (1) (4,296,916)
OTHER REVENUES AND EXPENDITURESState apportionments - capital 345,217 - - - 345,217 Local property taxes - capital 1,917,113 - - - 1,917,113 Investment income - capital 44,223 - - - 44,223
Excess of Revenues Over (Under) Expenditures/Expenses (1,388,821) (601,541) - (1) (1,990,363)
OTHER FINANCING SOURCES (USES)Operating transfers in 338,288 150,000 - - 488,288 Operating transfers out (488,288) - - - (488,288) Proceeds from long-term debt 32,460,000 - - - 32,460,000 Premium on long-term debt 2,866,949 - - - 2,866,949 Payment to refunded bond escrow agent (27,274,207) - - - (27,274,207)
Total Other Financing Sources (Uses) 7,902,742 150,000 - - 8,052,742
Excess of Revenues and Other Financing SourcesOver (Under) Expenditures/Expenses andOther Financing Uses 6,513,921 (451,541) - (1) 6,062,379
Fund Equity - Beginning of Year 9,874,433 2,352,590 - 6 12,227,029
Fund Equity - End of Year 16,388,354$ 1,901,049$ -$ 5$ 18,289,408$
See the accompanying notes to the supplementary information.
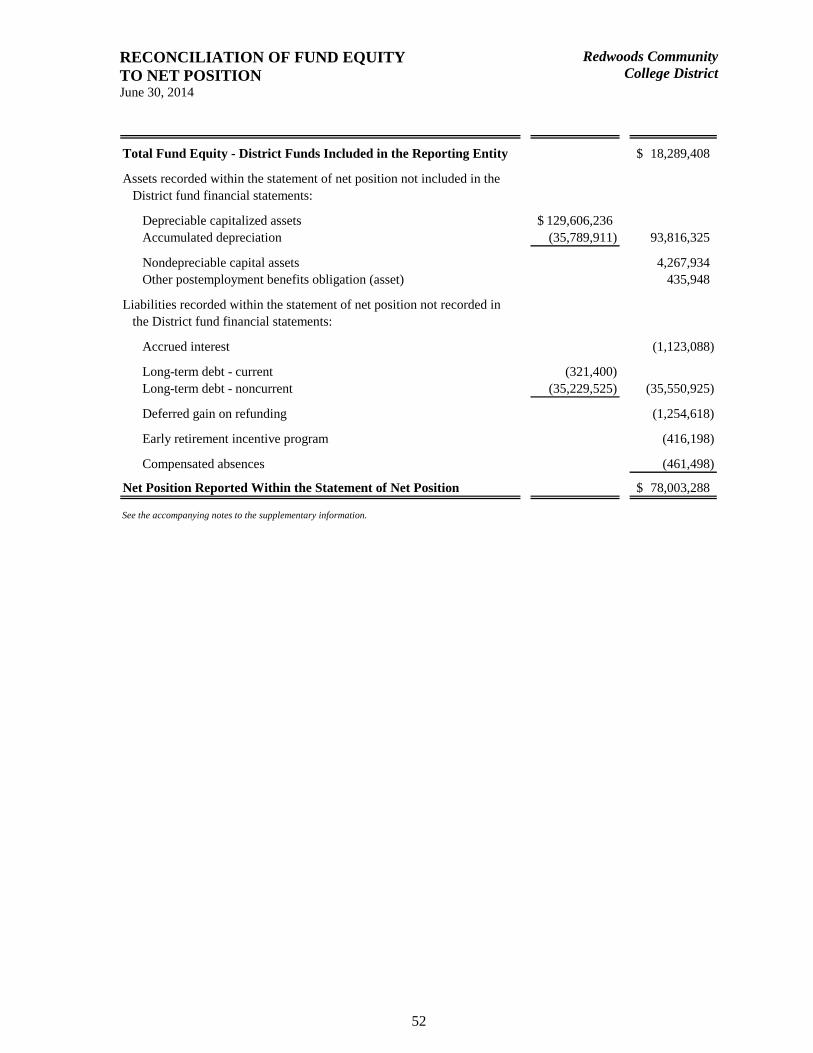
RECONCILIATION OF FUND EQUITY TO NET POSITION June 30, 2014
Redwoods CommunityCollege District
52
Total Fund Equity - District Funds Included in the Reporting Entity 18,289,408$
Assets recorded within the statement of net position not included in the District fund financial statements:
Depreciable capitalized assets 129,606,236$ Accumulated depreciation (35,789,911) 93,816,325
Nondepreciable capital assets 4,267,934 Other postemployment benefits obligation (asset) 435,948
Liabilities recorded within the statement of net position not recorded in the District fund financial statements:
Accrued interest (1,123,088)
Long-term debt - current (321,400) Long-term debt - noncurrent (35,229,525) (35,550,925)
Deferred gain on refunding (1,254,618)
Early retirement incentive program (416,198)
Compensated absences (461,498)
Net Position Reported Within the Statement of Net Position 78,003,288$
See the accompanying notes to the supplementary information.

RECONCILIATION OF CHANGE IN FUND EQUITY TO CHANGE IN NET POSITION June 30, 2014
Redwoods CommunityCollege District
53
Total Net Change in Fund Equity - District Funds Included in Reporting Entity 6,062,379$
Depreciation expense reported within the statements (2,962,852)
Capital outlay expense not reported within the statements 3,277,062
Decrease in compensated absences reported within the statements 170,389
Principal payments on debt not reported within the statements 28,138,107
Interest expense from change in accrued interest payable and amortization of bond premiums reported within the statements (573,110)
Interest expense capitalized within the statements 205,102
Bond premiums from issuance of debt not reported within the statements (2,866,949)
Proceeds from issuance of debt not reported within the statements (32,460,000)
Increase in expense of other postemployment and retirement incentive benefits reported within the statements (299,566)
Net Change in Net Position Reported Within the GASB 35 Statement of Revenues, Expenses, and Changes in Net Position (1,309,438)$
See the accompanying notes to the supplementary information.

NOTES TO THE SUPPLEMENTARY INFORMATION June 30, 2014
Redwoods CommunityCollege District
54
1. PURPOSE OF SCHEDULES
Schedule of Expenditures of Federal Awards and Schedule of Expenditures of State Awards
The audit of the District for the year ended June 30, 2014, was conducted in accordance with OMB Circular A-133, which requires disclosure of the financial activities of all federally funded programs. To comply with OMB Circular A-133 and state requirements, the Schedule of Expenditures of Federal Awards and Schedule of Expenditures of State Awards was prepared for the District.
The schedules have been prepared on the accrual basis of accounting.
Schedule of Workload Measures for State General Apportionment
The Schedule of Workload Measures for State General Apportionment Annualized Attendance as of June 30, 2014, represents the basis of apportionment of the District’s annual source of funding.
Reconciliation of Annual Financial and Budget Report (Form CCFS-311) With District Accounting Records
This schedule provides the information necessary to reconcile the fund balance of all funds reported on the Form CCFS-311 to the District accounting records.
Reconciliation of 50% Law Calculation
This schedule provides the information necessary to reconcile the 50% law calculation as reported on the Form CCFS-311 to the audited financial statements.
Reconciliation of Education Protection Account Expenditures
This schedule provides the information necessary to reconcile the Education Protection Account Expenditures reported on the Form CCFS-311 to the audited financial statements.
2. COMBINING FINANCIAL STATEMENTS SUMMARY OF SIGNIFICANT ACCOUNTING POLICIES
Basis of Accounting The accompanying Combining Balance Sheet – District Funds Included in the Reporting Entity, Combining Statement of Revenues, Expenditures/Expenses, and Changes in Fund Equity – District Funds Included in the Reporting Entity are presented on the modified accrual basis of accounting with the exception of the Farm Operations Fund and Employee Benefit Trust Fund, which are presented on the accrual basis of accounting consistent with the presentation in the entity-wide financial statements.
NOTES TO THE SUPPLEMENTARY INFORMATION June 30, 2014
Redwoods CommunityCollege District
55
Under the modified accrual basis of accounting, revenues are recognized when susceptible to accrual (i.e., when they are “measurable” and “available”). “Measurable” means the amount of the transaction can be determined and “available” means collectible within the current period or soon enough thereafter to pay liabilities of the current period. The District considers property taxes available if they are collected within 60 days after year end. A one-year availability period is used for revenue recognition for all other governmental fund revenues. Expenditures are recorded when the related fund liability is incurred. Principal and interest on general long-term debt are recorded as fund liabilities when due or when amounts have been accumulated in the debt service fund for payments to be made early in the following year.
Property taxes, franchise taxes, licenses, interest revenue, and charges for services are susceptible to accrual. Other receipts become measurable and available when cash is received by the District and are recognized as revenue at that time.
The District reports advance of revenue on its combining balance sheet. Advance of revenues arise when potential revenue does not meet both the “measurable” and “available” criteria for recognition in the current period. Advance of revenues also arise when resources are received by the District before it has a legal claim to them, as when grant monies are received prior to the incurrence of qualifying expenditures. In subsequent periods, when both revenue recognition criteria are met, or when the District has legal claim to the resources, the liability for advance of revenue is removed and revenue is recognized.

OTHER REPORTS SECTION
57
INDEPENDENT AUDITORS’ REPORT ON INTERNAL CONTROL OVER FINANCIAL REPORTING AND ON COMPLIANCE AND OTHER MATTERS BASED ON AN AUDIT OF FINANCIAL STATEMENTS PERFORMED IN ACCORDANCE WITH GOVERNMENT AUDITING STANDARDS
To the Board of Trustees Redwoods Community College District Eureka, California
We have audited, in accordance with auditing standards generally accepted in the United States of America and the standards applicable to financial audits contained in Government Auditing Standards issued by the Comptroller General of the United States, the financial statements of Redwoods Community College District (the District) as of and for the year ended June 30, 2014, and the related notes to the financial statements, which collectively comprise the District’s basic financial statements, and have issued our report thereon dated December 30, 2014.
Internal Control Over Financial Reporting
In planning and performing our audit of the financial statements, we considered the District’s internal control over financial reporting (internal control) to determine the audit procedures that are appropriate in the circumstances for the purpose of expressing our opinion on the financial statements, but not for the purpose of expressing an opinion on the effectiveness of the District’s internal control. Accordingly, we do not express an opinion on the effectiveness of the District’s internal control.
A deficiency in internal control exists when the design or operation of a control does not allow management or employees in the normal course of performing their assigned functions, to prevent, or detect and correct misstatements on a timely basis. A material weakness is a deficiency, or a combination of deficiencies, in internal control, such that there is a reasonable possibility that a material misstatement of the District’s financial statements will not be prevented, or detected and corrected on a timely basis. A significant deficiency is a deficiency, or a combination of deficiencies, in internal control that is less severe than a material weakness, yet important enough to merit attention by those charged with governance.
Our consideration of internal control over financial reporting was for the limited purpose described in the first paragraph of this section and was not designed to identify all deficiencies in internal control over financial reporting that might be material weaknesses or significant deficiencies. Given these limitations, during our audit we did not identify any deficiencies in internal control over financial reporting that we consider to be material weaknesses. However, material weaknesses may exist that have not been identified.
Compliance and Other Matters
As part of obtaining reasonable assurance about whether the District’s financial statements are free of material misstatement, we performed tests of its compliance with certain provisions of laws, regulations, contracts, and grant agreements, noncompliance with which could have a direct and material effect on the determination of financial statement amounts. However, providing an opinion on compliance with those provisions was not an objective of our audit; and, accordingly, we do not express such an opinion. The results of our tests disclosed no instances of noncompliance or other matters that are required to be reported under Government Auditing Standards.
58
INDEPENDENT AUDITORS’ REPORT ON INTERNAL CONTROL OVER FINANCIAL REPORTING AND ON COMPLIANCE AND OTHER MATTERS BASED ON AN AUDIT OF FINANCIAL STATEMENTS PERFORMED IN ACCORDANCE WITH GOVERNMENT AUDITING STANDARDS Continued
Purpose of this Report
The purpose of this report is solely to describe the scope of our testing of internal control and compliance and the results of that testing, and not to provide an opinion on the effectiveness of the District’s internal control or on compliance. This report is an integral part of an audit performed in accordance with Government Auditing Standards in considering the District’s internal control and compliance. Accordingly, this communication is not suitable for any other purpose.
December 30, 2014 Redding, California
59
INDEPENDENT AUDITORS’ REPORT ON COMPLIANCE FOR EACH MAJOR FEDERAL PROGRAM AND ON INTERNAL CONTROL OVER COMPLIANCE REQUIRED BY OMB CIRCULAR A-133
To the Board of Trustees Redwoods Community College District Eureka, California
Report on Compliance for Each Major Federal Program
We have audited Redwoods Community College District’s (the District) compliance with the types of compliance requirements described in the U.S. Office of Management and Budget (OMB) Circular A-133 Compliance Supplement that could have a direct and material effect on each of the District’s major federal programs for the year ended June 30, 2014. The District’s major federal programs are identified in the summary of auditors’ results section of the accompanying schedule of findings and questioned costs.
Management’s Responsibility
Management is responsible for compliance with the requirements of laws, regulations, contracts, and grants applicable to its federal programs.
Auditors’ Responsibility
Our responsibility is to express an opinion on compliance for each of the District’s major federal programs based on our audit of the types of compliance requirements referred to above. We conducted our audit of compliance in accordance with auditing standards generally accepted in the United States of America; the standards applicable to financial audits contained in Government Auditing Standards, issued by the Comptroller General of the United States; and OMB Circular A-133, Audits of States, Local Governments, and Non-Profit Organizations. Those standards and OMB Circular A-133 require that we plan and perform the audit to obtain reasonable assurance about whether noncompliance with the types of compliance requirements referred to above that could have a direct and material effect on a major federal program occurred. An audit includes examining, on a test basis, evidence about the District’s compliance with those requirements and performing such other procedures as we considered necessary in the circumstances.
We believe that our audit provides a reasonable basis for our opinion on compliance for each major federal program. However, our audit does not provide a legal determination on the District’s compliance.
Opinion on Each Major Federal Program
In our opinion, the District complied, in all material respects, with the types of compliance requirements referred to above that could have a direct and material effect on each of its major federal programs for the year ended June 30, 2014.

60
INDEPENDENT AUDITORS’ REPORT ON COMPLIANCE FOR EACH MAJOR FEDERAL PROGRAM AND ON INTERNAL CONTROL OVER COMPLIANCE REQUIRED BY OMB CIRCULAR A-133 Continued
Report on Internal Control Over Compliance
Management of the District is responsible for establishing and maintaining effective internal control over compliance with the types of compliance requirements referred to above. In planning and performing our audit of compliance, we considered the District’s internal control over compliance with the types of requirements that could have a direct and material effect on each major federal program as a basis for designing auditing procedures that are appropriate in the circumstances for the purpose of expressing an opinion on compliance for each major federal program and to test and report on internal control over compliance in accordance with OMB Circular A-133, but not for the purpose of expressing an opinion on the effectiveness of internal control over compliance. Accordingly, we do not express an opinion on the effectiveness of the District’s internal control over compliance.
A deficiency in internal control over compliance exists when the design or operation of a control over compliance does not allow management or employees, in the normal course of performing their assigned functions, to prevent, or detect and correct, noncompliance with a type of compliance requirement of a federal program on a timely basis. A material weakness in internal control over compliance is a deficiency, or combination of deficiencies, in internal control over compliance, such that there is a reasonable possibility that material noncompliance with a type of compliance requirement of a federal program will not be prevented, or detected and corrected, on a timely basis. A significant deficiency in internal control over compliance is a deficiency, or combination of deficiencies, in internal control over compliance with a type of compliance requirement of a federal program that is less severe than a material weakness in internal control over compliance, yet important enough to merit attention by those charged with governance.
Our consideration of internal control over compliance was for the limited purpose described in the first paragraph of this section and was not designed to identify all deficiencies in internal control over compliance that might be material weaknesses or significant deficiencies. We did not identify any deficiencies in internal control over compliance that we consider to be material weaknesses. However, material weaknesses may exist that have not been identified.
The purpose of this report on internal control over compliance is solely to describe the scope of our testing of internal control over compliance and the results of that testing based on the requirements of OMB Circular A-133. Accordingly, this report is not suitable for any other purpose.
December 30, 2014 Redding, California
61
INDEPENDENT AUDITORS’ REPORT ON STATE COMPLIANCE
To the Board of Trustees Redwoods Community College District Eureka, California
Compliance
We have audited the Redwoods Community College District’s (the District) compliance with the types of state compliance requirements described in the California Community Colleges Contracted District Audit Manual 2013-14, published by the California Community Colleges Chancellor’s Office, for the year ended June 30, 2014. The applicable state compliance requirements are identified in the table below.
Management’s Responsibility
Compliance with the requirements referred to above is the responsibility of the District’s management.
Auditors’ Responsibility
Our responsibility is to express an opinion on the District’s compliance with the state laws and regulations based on our audit.
We conducted our audit in accordance with auditing standards generally accepted in the United States of America; the standards applicable to financial audits contained in Government Auditing Standards, issued by the Comptroller General of the United States; and California Community Colleges Contracted District Audit Manual 2013-14, published by the California Community Colleges Chancellor’s Office. Those standards and the California Community Colleges Contracted District Audit Manual 2013-14, require that we plan and perform the audit to obtain reasonable assurance about whether noncompliance with the compliance requirements referred to above that could have a material effect on compliance with the state laws and regulations described in the schedule below. An audit includes examining, on a test basis, evidence supporting the District’s compliance with those requirements and performing such other procedures as we considered necessary in the circumstances. We believe our audit provides a reasonable basis for our opinion. Our audit does not provide legal determination of the District’s compliance with those requirements.
62
INDEPENDENT AUDITORS’ REPORT ON STATE COMPLIANCE Continued
SALARIES OF CLASSROOM INSTRUCTORS: 50 PERCENT LAW
APPORTIONMENT FOR INSTRUCTIONAL SERVICE AGREEMENTS/CONTRACTS
STATE GENERAL APPORTIONMENT FUNDING SYSTEM
RESIDENCY DETERMINATION FOR CREDIT COURSES
STUDENTS ACTIVELY ENROLLED
CONCURRENT ENROLLMENT OF K-12 STUDENTS IN COMMUNITY COLLEGE CREDIT COURSES
SCHEDULED MAINTENANCE PROGRAM
GANN LIMIT CALCULATION
OPEN ENROLLMENT
STUDENT FEES - HEALTH FEES AND USE OF HEALTH FEE FUNDS
PROPOSITION 39 CLEAN ENERGY
EXTENDED OPPORTUNITY PROGRAMS AND SERVICES (EOPS) AND COOPERATIVE AGENCIES RESOURCES FOR EDUCATION (CARE)
DISABLED STUDENT PROGRAMS AND SERVICES (DSPS)
TO BE ARRANGED HOURS (TBA)
PROPOSITION 1D STATE BOND FUNDED PROJECTS
PROPOSITION 30 EDUCATION PROTECTION ACCOUNT FUNDS
Opinion
In our opinion, except for findings 2014-0001 described in the accompanying schedule of findings and questioned costs, the District complied, in all material respects, with the state laws and regulations referred to above that are applicable to the District for the year ended June 30, 2014.
The District’s Response to Findings
The District’s responses to the noncompliance findings identified in our audit are described in the schedule of findings and questioned costs. The District’s responses were not subjected to the auditing procedures applied in the audit of compliance, and, accordingly, we express no opinion on them.

63
INDEPENDENT AUDITORS’ REPORT ON STATE COMPLIANCE Continued
Purpose of This Report
The purpose of this report is solely to describe the scope of our testing over compliance, and the results of that testing, based on the California Community Colleges Contracted District Audit Manual 2013-14. Accordingly, this report is not suitable for any other purpose.
December 30, 2014 Redding, California

SCHEDULE OF FINDINGS AND QUESTIONED COSTS SECTION
SCHEDULE OF FINDINGS AND QUESTIONED COSTS June 30, 2014
Redwoods CommunityCollege District
65
SECTION I SUMMARY OF AUDITORS’ RESULTS
FINANCIAL STATEMENTS
Type of auditors’ report issued: Unmodified
Internal control over financial reporting: Material weaknesses identified? NoSignificant deficiencies identified not considered to be material weaknesses? None reported
Noncompliance material to financial statements noted? No
FEDERAL AWARDS
Internal control over major programs: Material weaknesses identified? NoSignificant deficiencies identified not considered to be material weaknesses? None reported
Type of auditors’ report issued on compliance for major program: Unmodified
Any audit findings disclosed that are required to be reported in accordance with OMB Circular A-133, Section .510(a)? No
Identification of major programs: CFDA Nos. 84.007, 84.268, 84.033, and 84.063 Student Financial Assistance Cluster
Threshold for distinguishing types A and B programs: $300,000
Auditee qualified as low-risk auditee? Yes
STATE AWARDS
Compliance over state programs: Material weaknesses identified? NoSignificant deficiencies identified not considered to be material weaknesses? Yes
Type of auditors’ report issued on compliance for state programs: Qualified

SCHEDULE OF FINDINGS AND QUESTIONED COSTS June 30, 2014
Redwoods CommunityCollege District
66
SECTION II FINDINGS FINANCIAL STATEMENTS AUDIT
None.

SCHEDULE OF FINDINGS AND QUESTIONED COSTS June 30, 2014
Redwoods CommunityCollege District
67
SECTION III FINDINGS FEDERAL AWARDS AUDIT
None.
SCHEDULE OF FINDINGS AND QUESTIONED COSTS June 30, 2014
Redwoods CommunityCollege District
68
SECTION IV FINDINGS STATE AWARDS AUDIT
STATE COMPLIANCE (424 State General Apportionment Funding System) (2014-0001)
Significant Deficiency
Condition
The District scheduled one of the 75 courses we selected for testing for clock hours in excess of course outline hours. The course was an intercollegiate physical education course that used the Positive Attendance Accounting Method to determine FTES.
Criteria
Per the Student Attendance Accounting Manual (SAAM), scheduling of courses (clock hours) must be consistent with the total number of class hours indicated in the approved course outline of record. Reasonable variances are permitted if due to legitimate scheduling considerations caused by course compression, computational exigencies, or exceptions provided for in CCR, Title 5.
Effect
The overstatement of FTES from scheduling in excess of course outline hours was 1.02 as reported by the District in their P3 CCFS-320 report. Subsequent to our initial testing and discussions with the District, they created query reports in Datatel to identify all courses affected. The District prepared a CCFS-320 Recalc report which they submitted in November 2014. We tested the Recalc report and found that the matter related to an intercollegiate physical education course was corrected. Because we were able to determine that this error related to specific courses, we felt extrapolation of the error rate to the entire population would not produce reasonable results. As an alternative approach, we expanded our testing to 100% of these courses. Our expanded scope identified one additional exception.
The two intercollegiate physical education courses that were scheduled for clock hours in excess of course outline hours overstated FTES by 2.40 FTES. This overstatement represents the difference for the entire population of these courses and, therefore, this is a “hard” error and extrapolation is not necessary.
Recommendation
We recommend the District review their current control procedures in this area to determine if they can be strengthened while maintaining reasonable cost/benefit results.
Response
The District concurs with the auditor’s recommendation. The Vice President of Instruction and Student Development will work with staff to review how the curriculum change process links to course setup in Datatel to identify possible control procedure improvements.

CORRECTIVE ACTION PLAN June 30, 2014
Redwoods CommunityCollege District
69
Not applicable: there are no current-year findings related to federal awards.

SUMMARY SCHEDULE OF PRIOR AUDIT FINDINGS June 30, 2014
Redwoods CommunityCollege District
70
STATE COMPLIANCE (DSPS) (2013-0001)
Significant Deficiency
Condition
Five of the 29 files tested for DSPS eligibility did not contain a student education plan or the student education plan was not updated for the current fiscal year.
Criteria
Per the Chancellors’ Office, Implementing Guidelines for Title 5 Regulations, an up-to-date student education plan for the current year, signed by the student and the DSPS professional staff person, should be available in the file of each student receiving services paid through the DSPS office.
Effect
The District did not maintain information required by the program to substantiate eligibility of students participating in the program. The extrapolation of this error to the entire DSPS student population is 175 students potentially out of compliance.
Recommendation
We recommended the District implement a procedure to ensure that a student is not entered into the system and counted as being served until a completed student education plan is signed by the student and in the student file.
Current Status
Implemented.
SUMMARY SCHEDULE OF PRIOR AUDIT FINDINGS June 30, 2014
Redwoods CommunityCollege District
71
STATE COMPLIANCE (424 State General Apportionment Funding System) (2013-0002)
Significant Deficiency
Condition
The District incorrectly used either the Weekly or Daily Attendance Accounting Method when the Alternative Attendance Accounting Method was required for nine of 75 courses tested during our testing of State General Apportionment. Per discussion with District staff, all of these exceptions were data entry errors when setting up the course sections in Datatel.
One of the nine exceptions was a Distance Education course using the Weekly Attendance Accounting Method.
The remaining eight exceptions noted were Independent Studies courses where the Daily Attendance Accounting Method was used.
Criteria
Per the Student Attendance Accounting Manual (SAAM), Distance Education and Independent Studies courses must use the Alternative Attendance Accounting Method when calculating FTES.
Effect
The overstatement of FTES due to this matter was 0.26 for the one Distance Education course and 2.28 for the eight Independent Studies courses as reported by the District in their P3 CCFS-320 report. Subsequent to our initial testing and discussions with the District, they created query reports in Datatel which they used to identify all miscoded courses and then prepared a CCFS-320 Recalc report which they submitted in November 2013. We tested the Recalc report and found all Attendance Accounting Methods used were appropriate and that FTES overstatements noted in P3 were corrected. Accordingly, there is no FTES misstatement by the District and extrapolation of the error in this finding is not necessary.
Recommendation
We recommended the District review their current control procedures in this area to determine if they can be strengthened while maintaining reasonable cost/benefit results.
Current Status
Implemented.
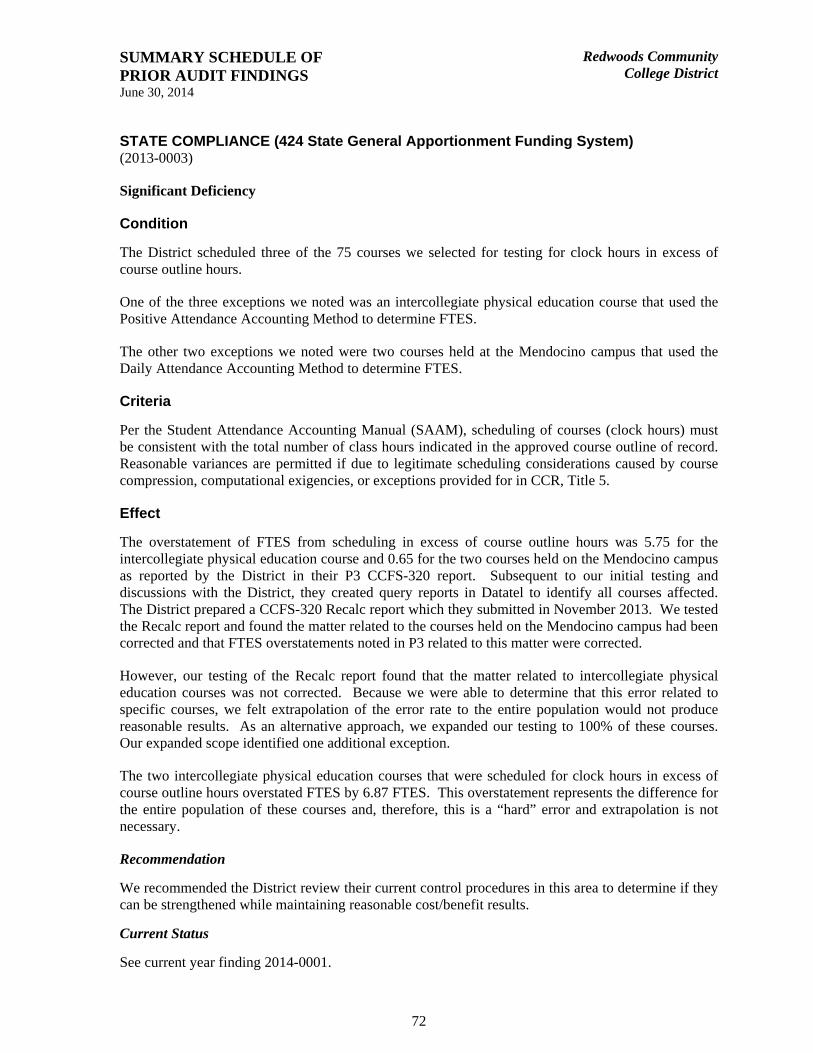
SUMMARY SCHEDULE OF PRIOR AUDIT FINDINGS June 30, 2014
Redwoods CommunityCollege District
72
STATE COMPLIANCE (424 State General Apportionment Funding System) (2013-0003)
Significant Deficiency
Condition
The District scheduled three of the 75 courses we selected for testing for clock hours in excess of course outline hours.
One of the three exceptions we noted was an intercollegiate physical education course that used the Positive Attendance Accounting Method to determine FTES.
The other two exceptions we noted were two courses held at the Mendocino campus that used the Daily Attendance Accounting Method to determine FTES.
Criteria
Per the Student Attendance Accounting Manual (SAAM), scheduling of courses (clock hours) must be consistent with the total number of class hours indicated in the approved course outline of record. Reasonable variances are permitted if due to legitimate scheduling considerations caused by course compression, computational exigencies, or exceptions provided for in CCR, Title 5.
Effect
The overstatement of FTES from scheduling in excess of course outline hours was 5.75 for the intercollegiate physical education course and 0.65 for the two courses held on the Mendocino campus as reported by the District in their P3 CCFS-320 report. Subsequent to our initial testing and discussions with the District, they created query reports in Datatel to identify all courses affected. The District prepared a CCFS-320 Recalc report which they submitted in November 2013. We tested the Recalc report and found the matter related to the courses held on the Mendocino campus had been corrected and that FTES overstatements noted in P3 related to this matter were corrected.
However, our testing of the Recalc report found that the matter related to intercollegiate physical education courses was not corrected. Because we were able to determine that this error related to specific courses, we felt extrapolation of the error rate to the entire population would not produce reasonable results. As an alternative approach, we expanded our testing to 100% of these courses. Our expanded scope identified one additional exception.
The two intercollegiate physical education courses that were scheduled for clock hours in excess of course outline hours overstated FTES by 6.87 FTES. This overstatement represents the difference for the entire population of these courses and, therefore, this is a “hard” error and extrapolation is not necessary.
Recommendation
We recommended the District review their current control procedures in this area to determine if they can be strengthened while maintaining reasonable cost/benefit results.
Current Status
See current year finding 2014-0001.